
Complete plastome sequence of Iodes cirrhosa Turcz., the first in the Icacinaceae, comparative genomic analyses and possible split of Idoes species in response to climate changes
- Published
- Accepted
- Received
- Academic Editor
- Axel Tiessen
- Subject Areas
- Bioinformatics, Genomics
- Keywords
- Iodes cirrhosa Turcz., Icacinaceae, Plastome, Selective pressure, Phylogenomic analysis
- Copyright
- © 2019 Wang et al.
- Licence
- This is an open access article distributed under the terms of the Creative Commons Attribution License, which permits unrestricted use, distribution, reproduction and adaptation in any medium and for any purpose provided that it is properly attributed. For attribution, the original author(s), title, publication source (PeerJ) and either DOI or URL of the article must be cited.
- Cite this article
- 2019. Complete plastome sequence of Iodes cirrhosa Turcz., the first in the Icacinaceae, comparative genomic analyses and possible split of Idoes species in response to climate changes. PeerJ 7:e6663 https://doi.org/10.7717/peerj.6663
Abstract
Plastome-based phylogenetic study has largely resolved the phylogeny of Icacinaceae. However, no single complete plastome sequence is available for Icacinaceae species, thereby limiting the further phylogenomics analysis of the members of this family. Here, we obtained the complete plastome sequence of Iodes cirrhosa Turcz., which is the first in Icacinaceae, by using the next-generation sequencing technology. The genome was annotated and compared with other closely related plastomes by using mVISTA. The divergence time of six Iodes species was analyzed using the BEAST software. The plastome of I. cirrhosa was 151,994 bp long, with a pair of inverted repeats (IRs, 24,973 bp) separated by a large single-copy (LSC, 84,527 bp) region and a small single-copy (SSC, 17,521 bp) region. The plastome encoded 112 unique genes, including 80 protein-coding, 28 tRNA, and four rRNA genes. Approximately 59 repeat sequences and 188 simple sequence repeats were identified. Four pairs of partially overlapped genes, namely, psbD/psbC, ndhF/Ψycf1, atpB/atpE, and rpl22/rps3, were observed. A comparison of the boundaries of the LSC, SSC, and IR regions with four other plastomes from Aquifoliales and Sapindales exhibited a high overall degree of sequence similarity. Four most highly variable regions, namely, trnH-GUG/psbA, psbM/trnD-GUC, petA/psbJ, and rps16/trnQ-UUG, were found. Using the plastome of I. cirrhosa as reference, we reassembled the plastomes of five Iodes species. Ka/Ks ratio analyses revealed that 27 genes and 52 amino acid residue sites from 11 genes had undergone strong positive selection in the Iodes branch, with the most abundant proteins being the NDH and ribosomal proteins. Divergence-time analysis indicated that Iodes species were first formed 34.40 million years ago. Results revealed that the ancestor of the six species was likely to have split in the late Eocene epoch. In summary, the first complete plastome sequence of I. cirrhosa provided valuable information regarding the evolutionary processes of Iodes species.
Introduction
Iodes is a genus belonging to the Icacinaceae family that contains many primary species of the tropics, such as trees, shrubs, and lianas. Iodes consists of 16 accepted species, as recorded in the Plant List (version 1.1, 2013, http://www.theplantlist.org); four of these species, namely, Iodes cirrhosa Turcz., Iodes vitiginea (Hance) Hemsl., Iodes seguinii (H.Lev.) Rehder, and Iodes balansae Gagnep, were found in China. Iodes species represent a rich source of potentially active compounds. For example, I. cirrhosa is a woody vine medicinal plant from the Icacinaceae family that is widely distributed in Guangxi and Yunnan Provinces in China and adjacent areas in Southeast Asia. I. cirrhosa has gained attention for its remarkable treatment effects on multiple diseases, such as rheumatism, nephritis, urine acerbity, and swelling pain (Gan et al., 2010). Modern pharmacology studies have shown that liposoluble constituents from I. cirrhosa have neuroprotective and K channel-blocking activity, and glycosides from the same species present activity against glutamate-induced PC12 cell damage (Gan et al., 2011; Gan et al., 2010). Hence, understanding the phylogenetic relationships and plastome evolution of Iodes species will likely lead to the discovery of novel active compounds produced from this group. Our original goal was to conduct phylogenetic analyses of the plastomes of Iodes species. Unfortunately, after extensive effort, we failed to obtain the materials for these samples, other than that of I. cirrhosa. Consequently, we focused on I. cirrhosa in this study.
Previous studies showed that Icacinaceae is highly polyphyletic (Lens et al., 2008). Kårehed (2001) conducted the first family-wide phylogenetic investigation of species from Icacinaceae on the basis primarily of ndhF sequence, with a sparse sampling of several other loci (rbcL, atpB, and 18S rDNA). Stull et al. (2015) sequenced 50 plastid genomes across the core asterid, focusing on the basal lamiid genera. Combining their data with other available asterid plastome data, this research group resolved the basal lamiid phylogeny. Several new orders, including Icacinales, have been recognized in the Angiosperm Phylogeny Group classification of the orders and families of angiosperms partly because of this study (The Angiosperm Phylogeny Group et al., 2016). With the resolution of the phylogenetic position of Icacinaceae, the next logical steps would be to resolve the relationships among species and genera within Icacinaceae.
While the nuclear genome may contain numerous potentially useful markers, the plastome sequences have been widely used in resolving phylogenetic relationship and discovering novel molecular markers. The highly conservative nature and slow evolutionary rate of the plastome make it uniform enough in conducting comparative studies across different species but divergent sufficiently to capture evolutionary events, including insertions, deletions, reversals, and translocations. These characteristics make plastome sequence a suitable and invaluable tool in studying molecular phylogeny, barcode identification, plant evolution, and phylogenetics (Dong et al., 2012; Dong et al., 2015; Dong et al., 2017). The recent development of next-generation sequencing (NGS) technologies have significantly reduced the time and cost associated with the sequencing of an entire plastome for nonmodel species. The availability of thousands of plastome sequences and the improvement in bioinformatics analysis methods allows the assembly of the complete plastome sequences without the need to isolate the plastids from the cells experimentally and then sequence the plastid DNA (Kane et al., 2012; Nock et al., 2011).
Although the plastome sequences have been used successfully to resolve the basal lamiid phylogeny (Stull et al., 2015), the sequencing reads have not been assembled to obtain complete plastome sequences. The corresponding protein sequences used for the phylogenetics analysis are largely fragmental. The availability of complete plastome sequences may be useful in several ways. First, complete plastome sequences can be used as the reference to obtain the proteome and genome sequences of plastids from other related species. Second, complete plastome sequences can be used to resolve phylogenetic relationships among low taxonomic levels. Third, molecular markers can be identified to distinguish related species closely.
In this study, we sequenced the complete plastome of I. cirrhosa by using the genome skimming strategy and then analyzed the genome in detail. First, we identified all protein-coding, tRNA, and rRNA genes and several sequence repeats. Second, by using the complete plastome of I. cirrhosa as a reference, we reassembled the NGS reads from the study of Stull et al. (2015). Consequently, much better plastome assemblies and more complete proteomes for five Iodes species were obtained than those of the previous reports. Third, we compared the I. cirrhosa plastome with its most closely related species from Aquifoliales and Sapindales. Fourth, several intergenic regions were selected for the identification of candidate molecular barcodes. Fifth, we identified positively selected genes and sites during the evolution of Iodes species. Finally, divergence time was estimated for the six Iodes species, and a possible split was identified. In summary, these results may help further understand the evolutionary history of the Iodes clade and facilitate the biospecting of the active compounds from this plant group.
Materials and Methods
Plant materials and total DNA purification
The fresh leaves of I. cirrhosa were collected from the Institute of Medicinal Plant Development in Guangxi Province, China and frozen at −80 °C. Total DNA was extracted using a plant genomic DNA extraction kit (Tiangen Biotech, Beijing, China). DNA quality was assessed by electrophoresis in 1% (w/v) agarose gel, and their quantity was examined using Qubit 3.0 (Life Technologies, Carlsbad, CA, USA).
Plastome sequencing, assembly, and annotation
Approximately 500 ng DNA was used to construct a library with an insert size of 150 bp and sequenced according to the manufacturer’s instructions for HiSeq 2500 platform (Illumina Inc., San Diego, CA, USA). The raw sequence data were preprocessed according to the following steps: (1) removal of the adaptor sequences; (2) removal of reads that are <140 bp long; (3) removal of those bases before the first base acquired a quality score of <20 from the 5′ of each read; and (4) removal of those bases after the first base acquired a quality score of <20 at 3′ of each read. Consequently, 6,353,850 reads were obtained, with the total length of 1.91 Gb. These clean paired-end reads were filtered against all the plastomes of plants recorded in the GenBank by using BLASTN with an e-value cut-off of 1e−5. The extracted reads were assembled using AbySS (v. 1.5.2), and the resulting contigs were extended by Sanger sequencing by using sequence-specific primers (Table S1). The correctness of the complete draft plastome was validated by mapping all raw reads to the draft plastome by using Bowtie 2 (v. 2.0.1) (Langmead, 2010) and eyeballing the read coverage by using Tablet (v. 1.14.10.20; Milne et al., 2010). Genes were annotated by CpGAVAS web service (Liu et al., 2012) and edited manually by Apollo genome editor (Lewis et al., 2002). The circular map was generated using OrganellarGenomeDRAW (Lohse, Drechsel & Bock, 2007). Codon usage and GC content were also analyzed using the Cusp and Compseq programs from EMBOSS (Chojnacki et al., 2017). The raw sequencing results and the genome assembly and annotation results have been deposited in GenBank, with the accession numbers SRR8503885 and NC_036304, respectively.
Comparative genome analyses
The complete plastomes of I. cirrhosa were compared with four other species, namely, Helwingia himalaica (Aquifoliales, NC_031370), Ilex paraguariensis (Sapindales, KP016928), Sapindus mukorossi (Sapindales, NC_025554.1), and Euonymus japonicus (Sapindales, NC_028067), by using the software mVISTA in Shuffle-LAGAN mode. The plastome of I. cirrhosa served as a reference genome in comparative analyses. To identify the most divergent regions among the congeneric species, we defined the sequences of the same regions from the congeneric species as mutually most similar sequences after the comparison with the BLASTN program. Then, the sequences were subjected to multiple sequence alignment by using ClustalW2 (Chenna et al., 2003). The Kimura two-parameter distance was calculated using the distmat program from the EMBOSS package (Chojnacki et al., 2017).
Repeat sequence analysis
The REPuter (http://vmatch.de/) web service was used to identify the size and location of the four types of repeats, including forward, palindromic, reverse, and complement repeats in five species (Kurtz et al., 2001). The minimum repeat size was set to 30 bp, and the cut-off for the similarities among the repeat units was 90%. Simple sequence repeats (SSRs) were predicted using MISA Perl Script, with the following thresholds: eight units of mononucleotides; four units of di- and trinucleotides; and three units of tetra-, penta-, and hexanucleotides (Beier et al., 2017). Tandem repeats were identified using the Tandem Repeats Finder (Castelo, Martins & Gao, 2002), with the following parameter settings: matches = 2, mismatches and indels = 7, minimum alignment score = 50, maximum period size = 500, minimum repeat size = 9 bp, and the cut-off for similarities among the repeat units = 70%.
Reconstruction of the plastomes and proteomes of the five Iodes species
To conduct the phylogenetic analyses of the Iodes species, we downloaded the reads of five other Iodes species from the NCBI SRA database, with the following run accession numbers: Iodes klaineana (SRR2401796), Iodes liberica (SRR2401797), Iodes perrieri (SRR2401798), Iodes scandens (SRR2401799), and Iodes seretii (SRR2401800). The plastomes of the five species were assembled following the procedure described above, with the plastome sequences of I. cirrhosa as the reference. To obtain shared proteins among the Iodes species, we utilized the protein sequences translated from the plastome of I. cirrhosa as the reference sequences in extracting the shared proteins from the contigs of the five Iodes species by using custom Python scripts. Briefly, the contig sequences of each Iodes species were searched against the full-length reference sequences of the I. cirrhosa proteins by using the BLASTX with an e-value cut-off of 1e−5. These hit sequences were assembled using the program Phrap. Then, the assembled contigs were compared against the reference protein sequences by using the BLASTX with the cut-off e-value of 1e−5. The fragments corresponding to those found in the high-scoring pairs were concatenated together and used as the corresponding protein sequences for the corresponding Iodes species.
Phylogenetics analyses
Seventy-four protein sequences shared by the six Iodes species, including ACCD, ATPA, ATPB, ATPE, ATPF, ATPH, ATPI, CCSA, CEMA, CLPP, MATK, NDHA, NDHB, NDHC, NDHD, NDHE, NDHF, NDHG, NDHH, NDHI, NDHJ, NDHK, PETA, PETB, PETD, PETG, PETL, PETN, PSAA, PSAB, PSAC, PSAI, PSAJ, PSBA, PSBB, PSBC, PSBD, PSBE, PSBF, PSBH, PSBI, PSBK, PSBL, PSBM, PSBN, PSBT, PSBZ, RBCL, RPL14, , RPL2, RPL20, RPL22, RPL23, RPL32, RPL33, RPOA, RPOB, RPOC1, RPOC2, RPS11, RPS12, RPS14, RPS15, RPS16, RPS18, RPS19, RPS2, RPS3, RPS4, RPS7, YCF1, YCF2, YCF3, and YCF4, were extracted. The 74 protein sequences were concatenated and aligned using the ClustalW program (Corpet, 1988). The phylogenetic trees were constructed using the software Randomized Axelerated Maximum Likelihood (RAxML) and the maximum likelihood (ML) method, with Arabidopsis thaliana and Nicotiana tabacum as the outgroups, respectively. The detailed parameters were “raxmlHPC-PTHREADS-SSE3 -fa -N 1000 -m PROTGAMMACPREV/GTRGAMMA -x 551314260 -p 551314260 -o Arabidopsis_thaliana, Nicotiana_tabacum -T 20”. The significant level of the phylogenetic tree was assessed by bootstrap testing with 1,000 replications. The bootstrap values of each branch were shown beyond each node.
Selective pressure analyses
On the basis of the ML tree, we conducted selective pressure analysis by using the adaptive branch-site random effects likelihood (aBSREL) model (Smith et al., 2015) that is implemented in HyPhy (https://veg.github.io/hyphy-site/getting-started/#characterizing-selective-pressures). Significance was assessed using the likelihood ratio test at a threshold of p ≤ 0.05 after correcting for multiple testing implemented in the program. The sites that were subject to positive selection in the Iodes genus branch were identified using the codeml program implemented in PAML (v. 4.9; Yang & Nielsen, 2002).
Divergence-time estimation
Then, the ML tree and the alignment of the 74 shared proteins were loaded into the BEAST software (v. 1.8.4; Drummond et al., 2012) for the divergence-time estimation using the cpREV substitution model, which is a model of amino acid substitution for proteins encoded by chloroplast DNA (Adachi et al., 2000). The 1,000,000 generations underwent MCMC analysis, in which every 1,000 generations were sampled under a strict clock approach by using the Yule speciation tree prior with the substitution rate. The 93 and 107 million years ago (Mya) were used as the lower and upper boundaries of the lamiid species splitting time in calibrating the clock (He et al., 2016; Hedges, Dudley & Kumar, 2006). TRACER software (v. 1.6; Rambaut & Drummond, 2007) was used to check the effective population size of >200. The default settings were used otherwise when performing MCMC TREE analysis. TREEANNOTATOR software (v. 1.8.4; Bouckaert et al., 2014) was used to produce the maximum clade credibility trees from the trees after burning-in of 10%. The chronogram of the tree with the highest credibility was visualized in FigTree (v. 1.4.3; http://tree.bio.ed.ac.uk/software/figtree/, November 2018).
Results
General features of the I. cirrhosa plastome
The assembled plastome of I. cirrhosa was 151,994 bp long. A total of 582,754 (4.1%) out of the 14,176,506 paired-end sequencing reads were successfully mapped to the I. cirrhosa plastome, thereby yielding approximately 508-fold average coverage. The genome possessed a typical quadripartite structure with a pair of inverted repeat (IR) regions of 24,973 bp separated by a large single-copy (LSC) region of 84,527 bp and a small single-copy (SSC) region of 17,521 bp (Fig. 1). Overall, 47.33%, 1.86%, and 6.76% of the plastome sequence-encoded proteins, tRNAs, and rRNAs, respectively, whereas the remaining 44.05% corresponded to the noncoding region, including introns, intergenic spacers, and pseudogenes. The genome contained 134 genes in total, corresponding to 112 unique genes encoding 80 proteins, 28 tRNAs, and 4 rRNAs (Table 1 and Dataset S1). Seven genes (i.e., rpl2, rpl23, ycf2, ycf15, ndhB, rps7, and rps12) and all rRNA genes were identified in the IR regions (Fig. 1). The genome also had 21 intron-containing genes. Among these genes, 11 protein-coding genes and 8 tRNA genes had only one intron in each of them. Two protein-coding genes, namely, clpP and ycf3, had two introns (Table S2). Two genes (i.e., trnG-UCC and rps12) lost their introns compared with those in the Sapindales species (Wang, Chen & Zhang, 2017; Zhang et al., 2016). The rps12 gene is a special trans-splicing gene. The 5′ exon of the gene was located in the LSC region, whereas the 3′ exon of the gene was located in the IR region. The trans-spliced gene rps12 has also been found in other plant species, such as Olea europaea (Mariotti et al., 2010). Four pairs of overlapping genes (i.e., psbD/psbC, atpE/atpB, rps3/rpl22, and ndhF/Ψycf1) were identified, which is similar to those found in the Sapindales species.
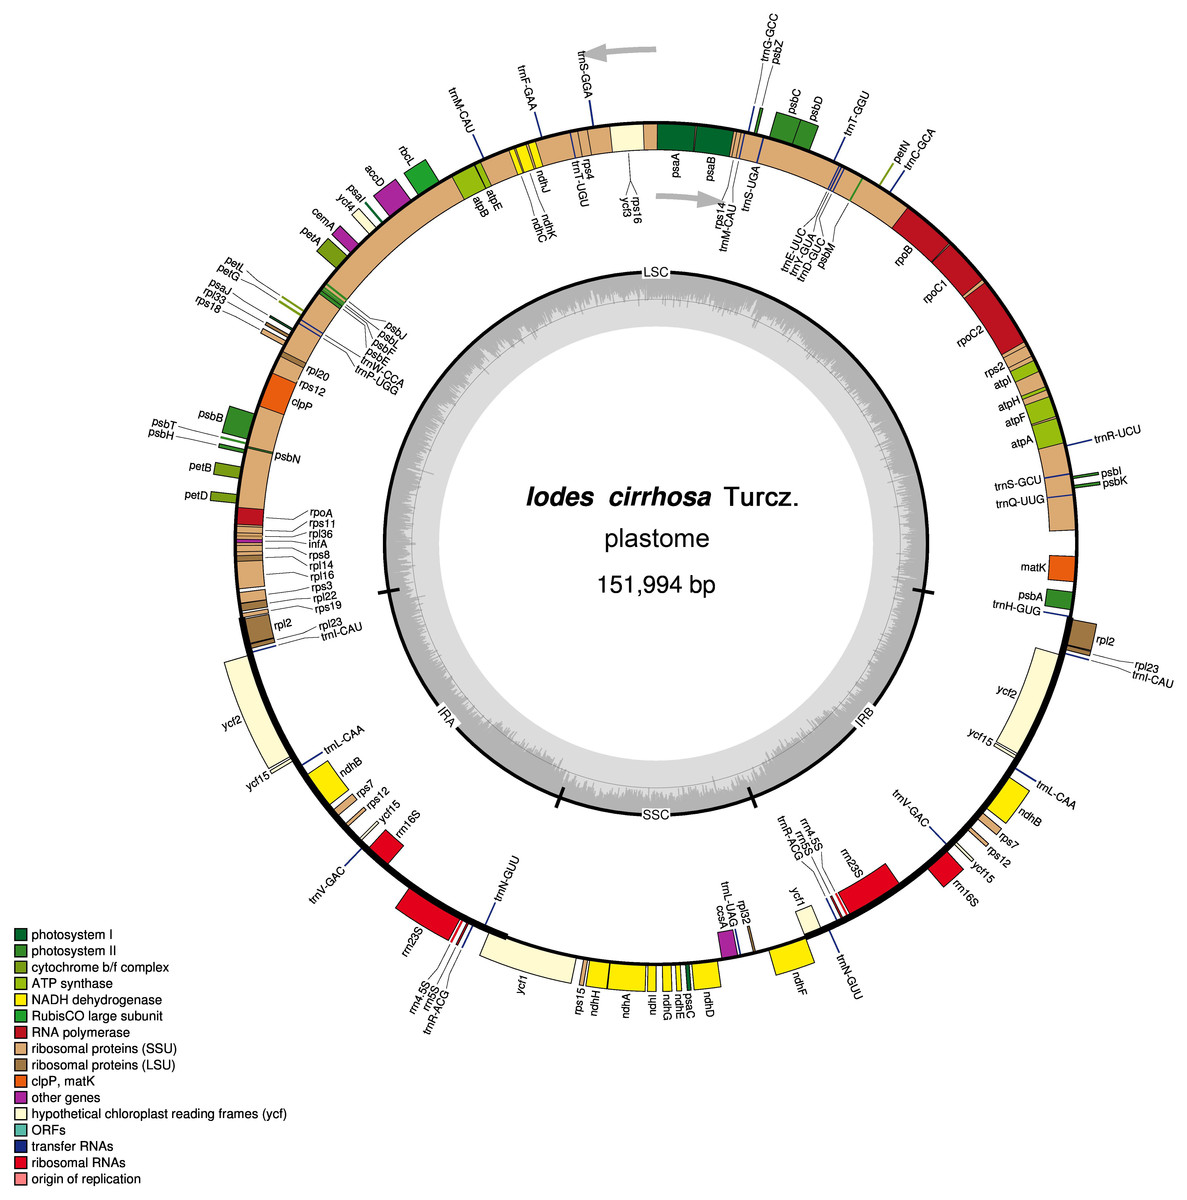
Figure 1: Schematic representation of the I. cirrhosa plastome.
The outer circle shows the distribution of various genes on the genome, whose color indicate their functional classifications. The genes drawn outside the circle are transcribed clockwise, whereas those drawn inside are transcribed counterclockwise. The inner circle shows the distribution of the GC contents along the genome and is divided into the large single copy (LSC) region, small single copy (SSC) region and two inverted repeat (IR) regions, IRA and IRB.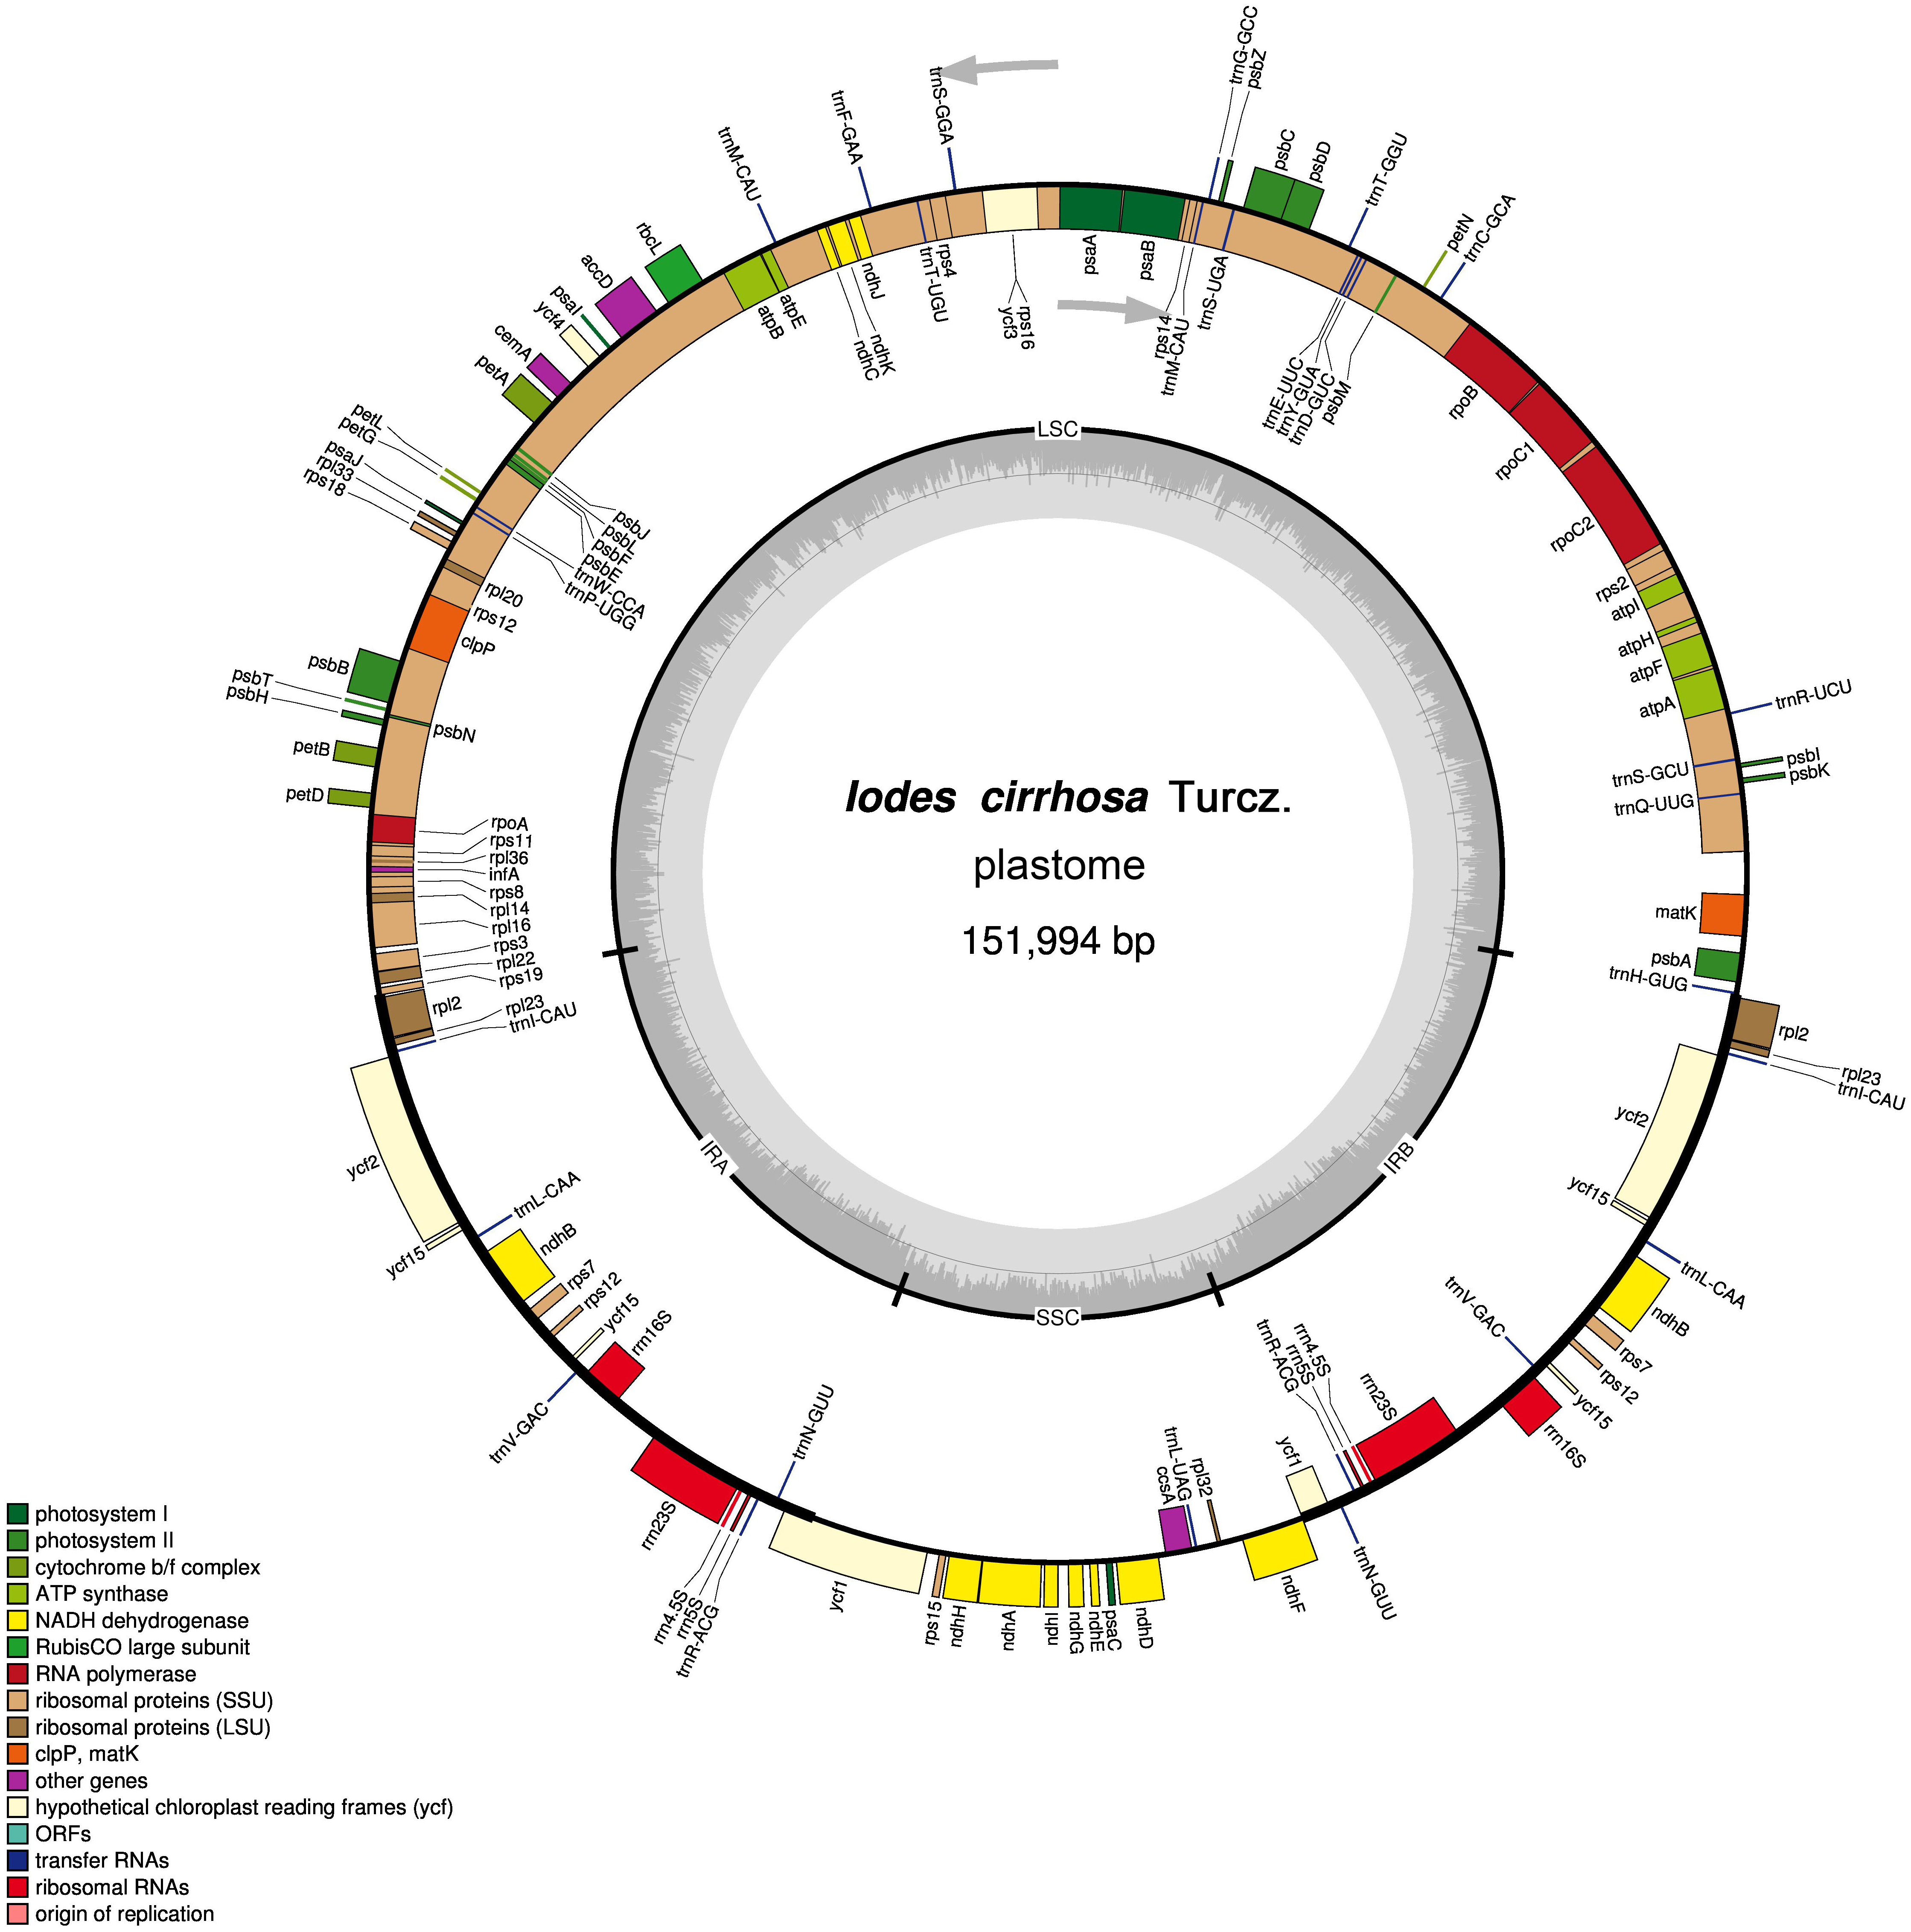
| Group of name | List of predicted genes |
|---|---|
| Photosystem I | psaA, B, C, I, J |
| Photosystem II | psbA, B, C, D, E, F, H, I, J, K, L, M, N, T, Z |
| Cytochrome b/f complex | petA,B,D,G,L,N |
| ATP synthase | atpA, B, E, F, H, I |
| NADH-dehydrogenase | ndhA, B (×2), C, D, E ,F, G, H, I, J, K |
| Rubisco large subunit | rbcL |
| RNA polymerase | rpoA, B, C1, C2 |
| Small subunit of ribosome | rps2, 3, 4,7 (×2), 8, 11, 12, 14, 15, 16, 18, 19 |
| Large subunit of ribosome | rpl16, 2 (×2), 14, 20, 22, 23 (×2), 32, 33, 36 |
| Proteins of unknown function | ycf1 (×2), ycf2 (×2), ycf3, ycf4, ycf15 (×4) |
| Other proteins | accD, ccsA, cemA, clpP, infA, matK |
| Ribosomal RNAs | rrn16S (×2), 23S (×2), 4.5S (×2), 5S (×2) |
| Transfer RNAs | trnA(UGC) (×2), C(GCA), C(ACA), D(GUC), E(UUC) (×3), F(GAA), G(GCC), H(GUG), I(CAU) (×2), K(UUU), L(CAA) (×2), L(UAA), L(UAG), M(CAU) (×4), N(GUU) (×2), P(UGG), Q(UUG), R(ACG) (×2), R(UCU), S(UGA), S(GCU), S(GGA), T(UGU), T(GGU), T(CGU), V(GAC) (×2), W(CCA), Y(GUA) |
Notes:
Numbers in the parentheses represent the number of copies.
- LSC
-
large single copy region
- SSC
-
small single copy region
- IR
-
Inverted repeat region
- CDS
-
coding sequence
The GC content of the entire plastome sequence was 37.44%, which was lower than that of the IR regions (43.0%) and higher than those of the LSC (35.45%) and SSC regions (31.2%, Table S3). This result suggested that the LSC, SSC, and IR regions may have different origins. The plastome contained 89 protein-coding genes, with 73,620 nucleotides forming 24,540 nonstop codons and 267 nucleotides forming 89 stop codons (Table S4). Among the 24,629 stop and nonstop codons, those for leucine and isoleucine presented the highest frequencies of 2,641 (10.72%) and 2,084 (8.48%), respectively. The codons for cysteine showed the lowest frequencies of 284 (1.15%, Table S5). Given that only 28 tRNA gene types were found in the plastome, at least 36 types of tRNAs coded in the nuclear genomes were required to translate all the proteins encoded in the plastome. The most abundant types of codons (Table S4) had no apparent correlation with the most abundant types of tRNA genes (Table 1). Within the CDS of the plastome, the A/T contents for the first, second, and third codon positions were 55.30%, 60.75%, and 69.65%, respectively (Table S3). A bias of high A/T ratio existed at the third codon position, which is similar to other land plants (Nie et al., 2014).
Repeat sequences and SSR analyses
Repeat sequences play an important role in genetic diversity, such as genome length variation and structural rearrangement (Jo et al., 2011). We analyzed the repeat structures in the plastomes of four species that are most closely related to I. cirrhosa and those of I. cirrhosa (Fig. 2A). Overall, the relative abundance of each type of repeats (i.e., forward, palindrome, reverse, and complement) was similar among the five species. The number of repeats for these five species may change once the complete plastome sequences for these species become available. In the plastome of I. cirrhosa, we detected 59 repeat sequences consisting of 28 forward, 29 palindromic, 1 reverse, and 1 complement repeats, with the length of >30 bp and similarities of >90% (Table S6). A total of 34 pairs of repeats were located in the ycf2 gene alone, which may be associated with the rapid evolution of this protein.
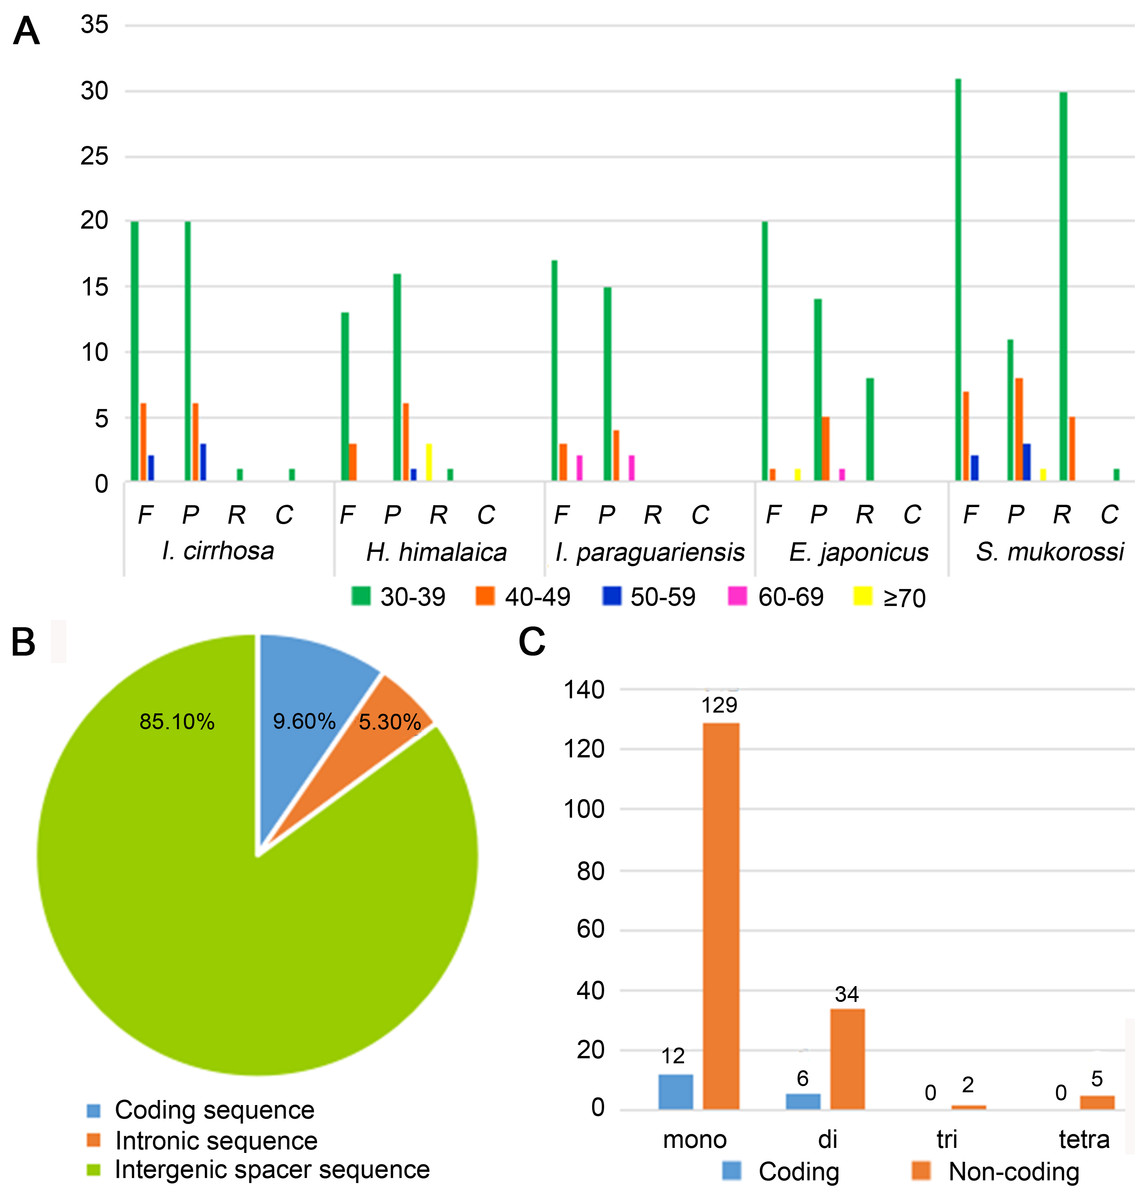
Figure 2: Statistics of repeat sequences detected in the plastome of I. cirrhosa.
(A) Repeat sequences identified in the five plastomes. F, Forward; P, Palindrome; R, Reverse; C, Complement. (B) SSRs distribution among three different types of sequences: coding, intragenic and intergenic spacer sequences. (C) Different types of SSRs distribution among coding and non-coding regions.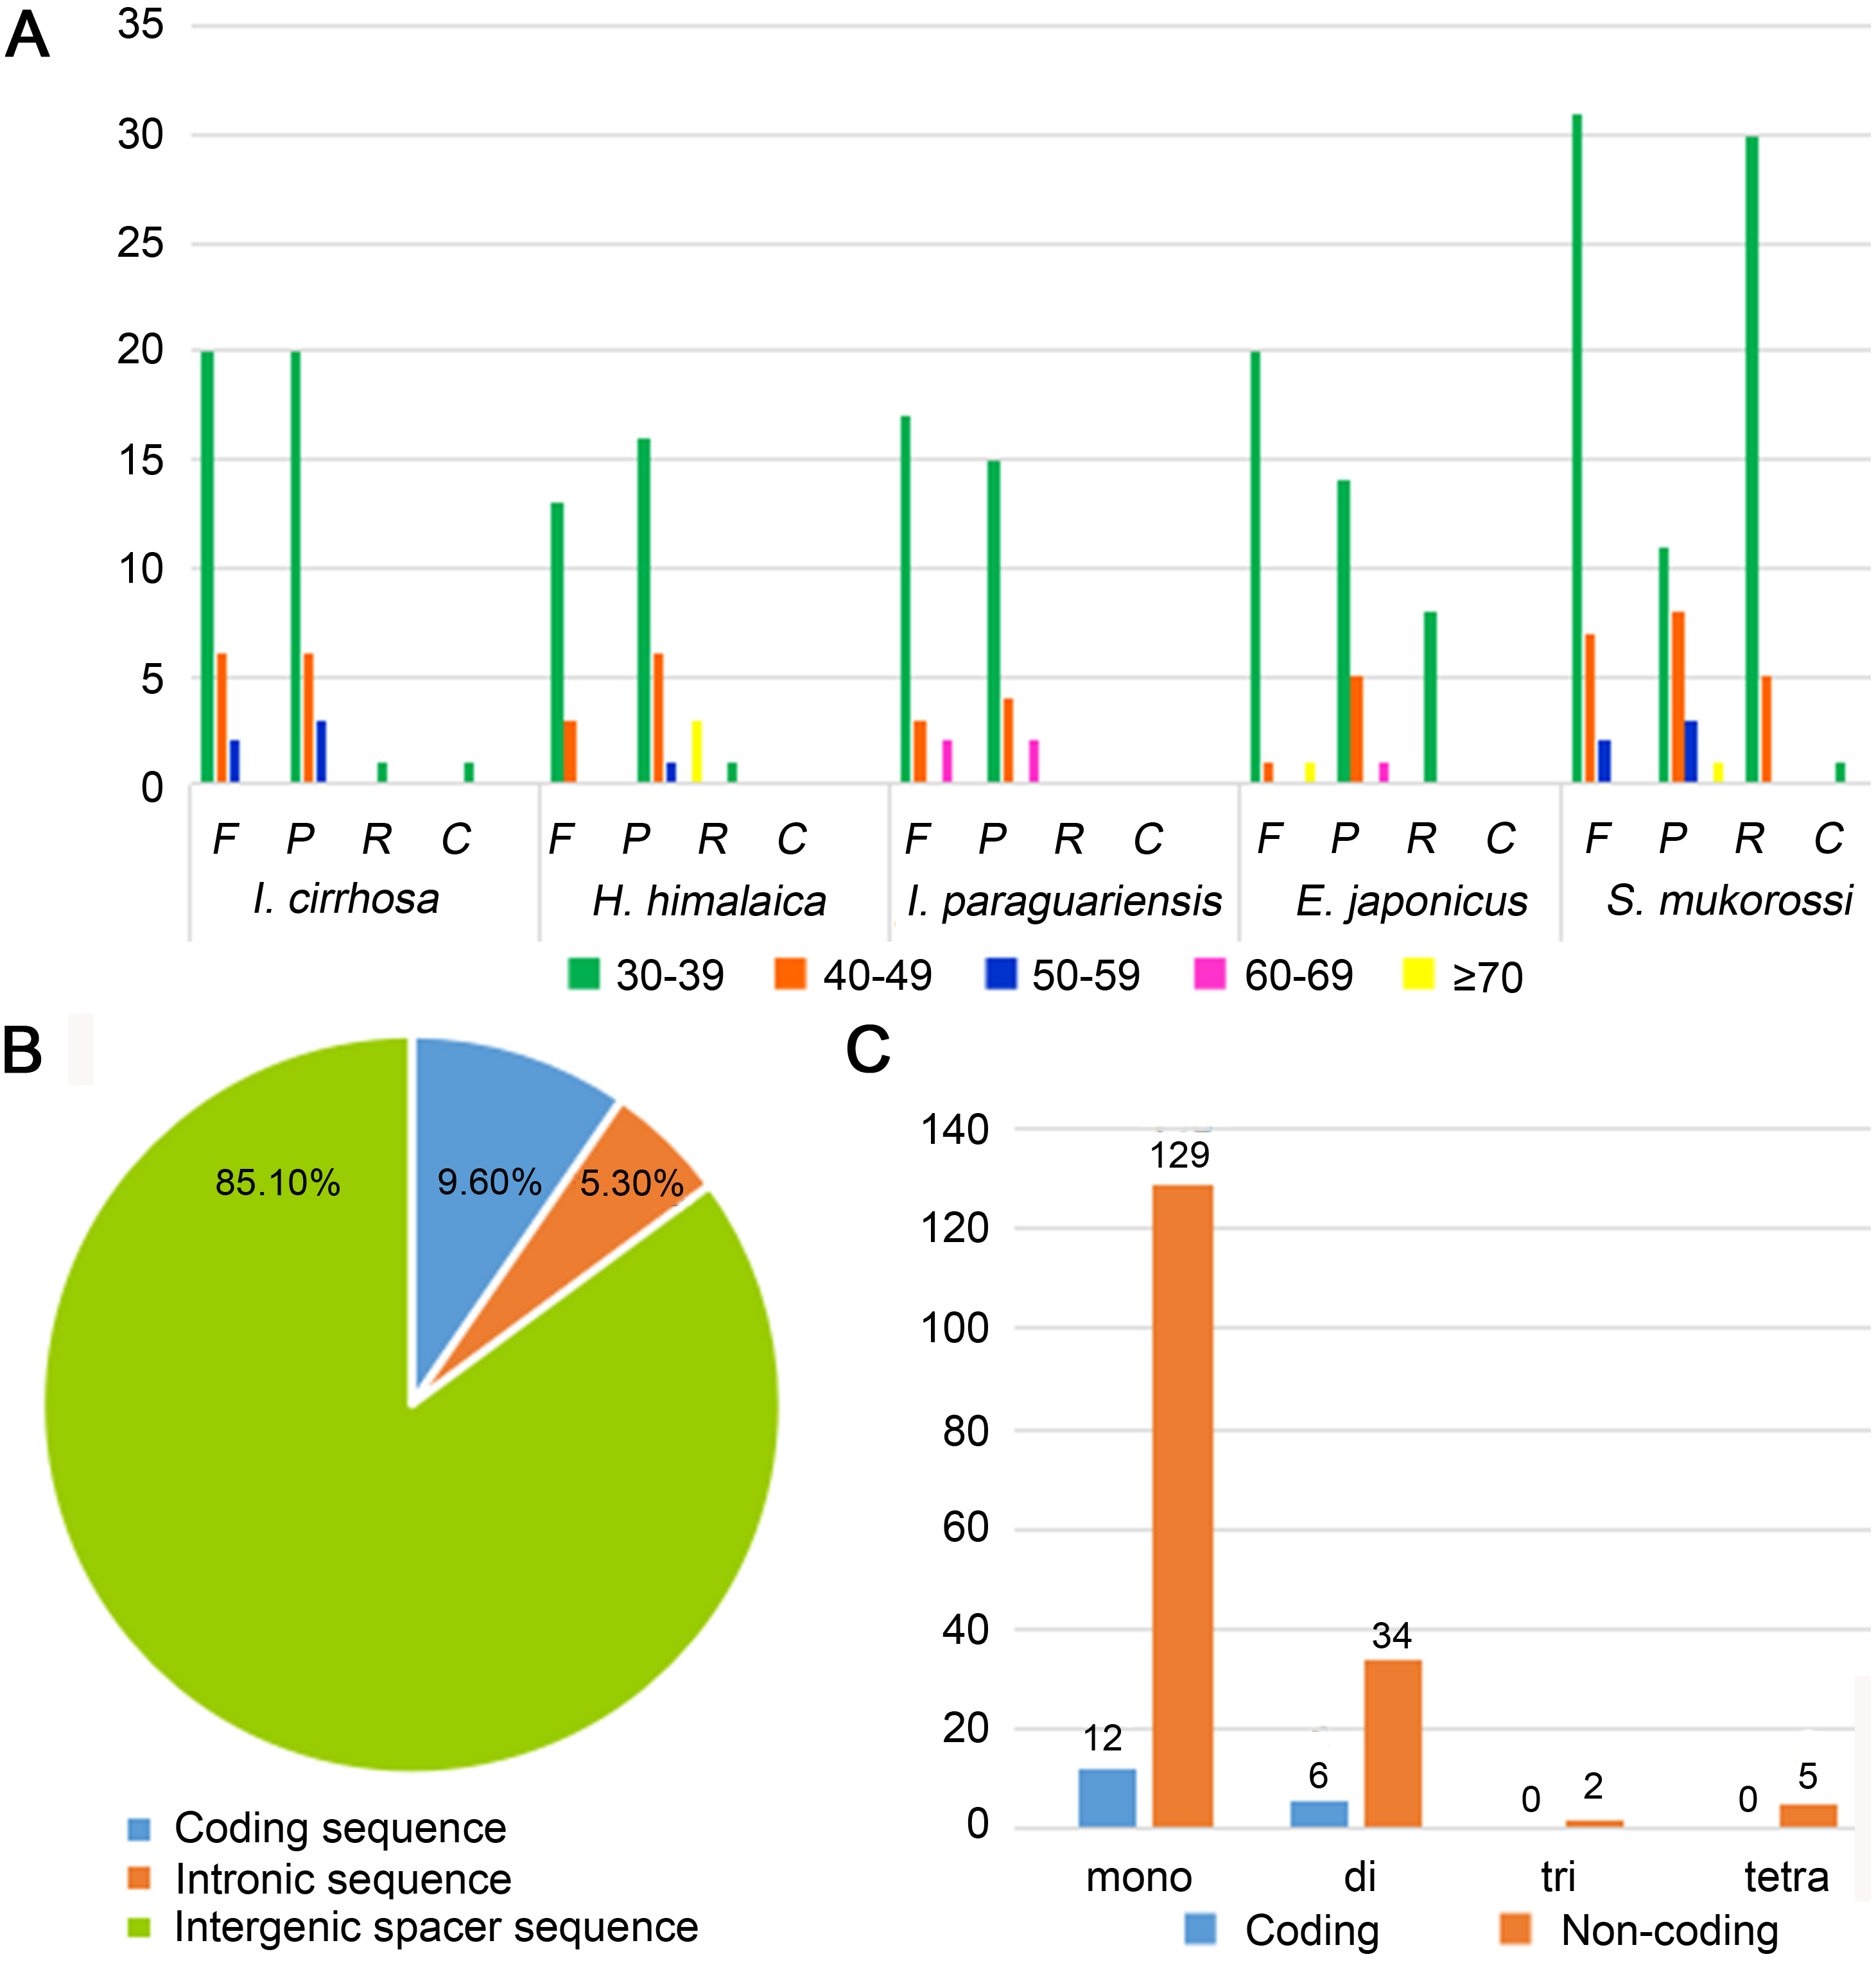
Tandemly repeated DNA sequences consisting of 1–6 nucleotide repeat units are called SSRs and also known as microsatellites that are distributed throughout the genomes (Powell et al., 1995). SSRs have been widely used as molecular markers in the studies of population genetics, species identification, and phylogenetic investigations on the basis of their high-degree variations (Provan et al., 1997). A total of 188 SSRs were identified in the plastomes of I. cirrhosa (Table S7). The most abundant types of SSRs are shown in Table 2. The SSRs were mostly distributed in the IGS and intron sequences (Fig. 2B). Among these SSRs, the majority is mononucleotide repeats (Fig. 2C). As shown in Table 2, most mononucleotide repeats consisted of A/T repeats (97.2%), whereas most dinucleotide repeats consisted of AT/AT (65%). These results agreed with those of the previous report, wherein SSRs from plastomes are generally composed of short polyA or polyT repeats and rarely contain tandem G or C repeats in many plants (Wang, Shi & Gao, 2013). In rare cases, SSRs have also been found in the coding regions. For example, 18 SSRs were identified in the CDS of 11 genes in I. cirrhosa, namely, matK, rpoA, rpoB, rpoC1, rpoC2, atpB, rps7, rps19, ndhB, ccsA, and ycf2.
| SSR repeats Type | Units | Number of copies | ||||||||||||||||
|---|---|---|---|---|---|---|---|---|---|---|---|---|---|---|---|---|---|---|
| 3 | 4 | 5 | 6 | 7 | 8 | 9 | 10 | 11 | 12 | 13 | 14 | 15 | 16 | 17 | 18 | Total | ||
| Mono | A/T | – | – | – | – | – | 58 | 33 | 26 | 11 | 3 | 2 | 1 | 1 | 1 | – | 1 | 137 |
| C/G | – | – | – | – | – | 1 | 3 | – | – | – | – | – | – | – | – | – | 4 | |
| Di | AC/GT | – | 1 | – | – | – | – | – | – | – | – | – | – | – | – | – | – | 1 |
| AG/CT | – | 12 | 1 | – | – | – | – | – | – | – | – | – | – | – | – | – | 13 | |
| AT/AT | – | 19 | 5 | 1 | – | 1 | – | – | – | – | – | – | – | – | – | – | 26 | |
| Tri | AAG/CTT | – | 1 | – | – | – | – | – | – | – | – | – | – | – | – | – | – | 1 |
| AAT/ATT | – | 1 | – | – | – | – | – | – | – | – | – | – | – | – | – | – | 1 | |
| Tetra | AAAC/GTTT | 1 | – | – | – | – | – | – | – | – | – | – | – | – | – | – | – | 1 |
| AAAG/CTTT | 1 | – | – | – | – | – | – | – | – | – | – | – | – | – | – | – | 1 | |
| AATC/ATTG | 1 | – | – | – | – | – | – | – | – | – | – | – | – | – | – | – | 1 | |
| AATG/ATTC | 1 | – | – | – | – | – | – | – | – | – | – | – | – | – | – | – | 1 | |
| AATT/AATT | 1 | – | – | – | – | – | – | – | – | – | – | – | – | – | – | – | 1 | |
The tandemly repeated DNA sequences with the size of repeat units longer than those of the SSR were identified using the Tandem Repeats Finder (Table S8). The following information, such as the start position, end position, size of repeat unit, numbers of repeat units, pattern, percent of matches between adjacent copies, sequences of the repeat unit, and the sequence of the entire repeat, are shown. In total, 30 repeats were identified. The repeat sizes ranged from 9 bp to 33 bp, with an average of 18.9 bp. The number of repeat units in the repeat sequences ranged from 1.9 to 12.6 with an average of 3.48. The overall percentages of matches among adjacent copies ranged from 70% to 100%, with an average of 91.1%. The corresponding alignment scores among adjacent repeat units ranged from 50 to 183, with an average of 91.1. The results identified using REPuter and Tandem Repeats Finder exhibited some overlaps. The differences among the results were due to the difference in the algorithm and parameter of each program used.
Comparative genome analyses
The plastome of I. cirrhosa was compared with four other species, namely, I. paraguariensis, S. mukorossi, E. japonicas, and H. himalaica (Fig. 3) because these species were the most closely related whose plastome sequences were available at the time of this study. Among these species, I. paraguariensis and S. mukorossi are from Sapindales, E. japonicus are from Celastrales, and H. himalaica are from Aquifoliales. The comparison revealed that the length of the plastome of I. cirrhosa was the shortest in the five plastomes. While various lengths of the plastomes of these plants are mainly attributed to the varied length of their LSC and IR regions, the lengths of all LSC, SSC, and IR regions of I. cirrhosa were the shortest among the five plastomes.
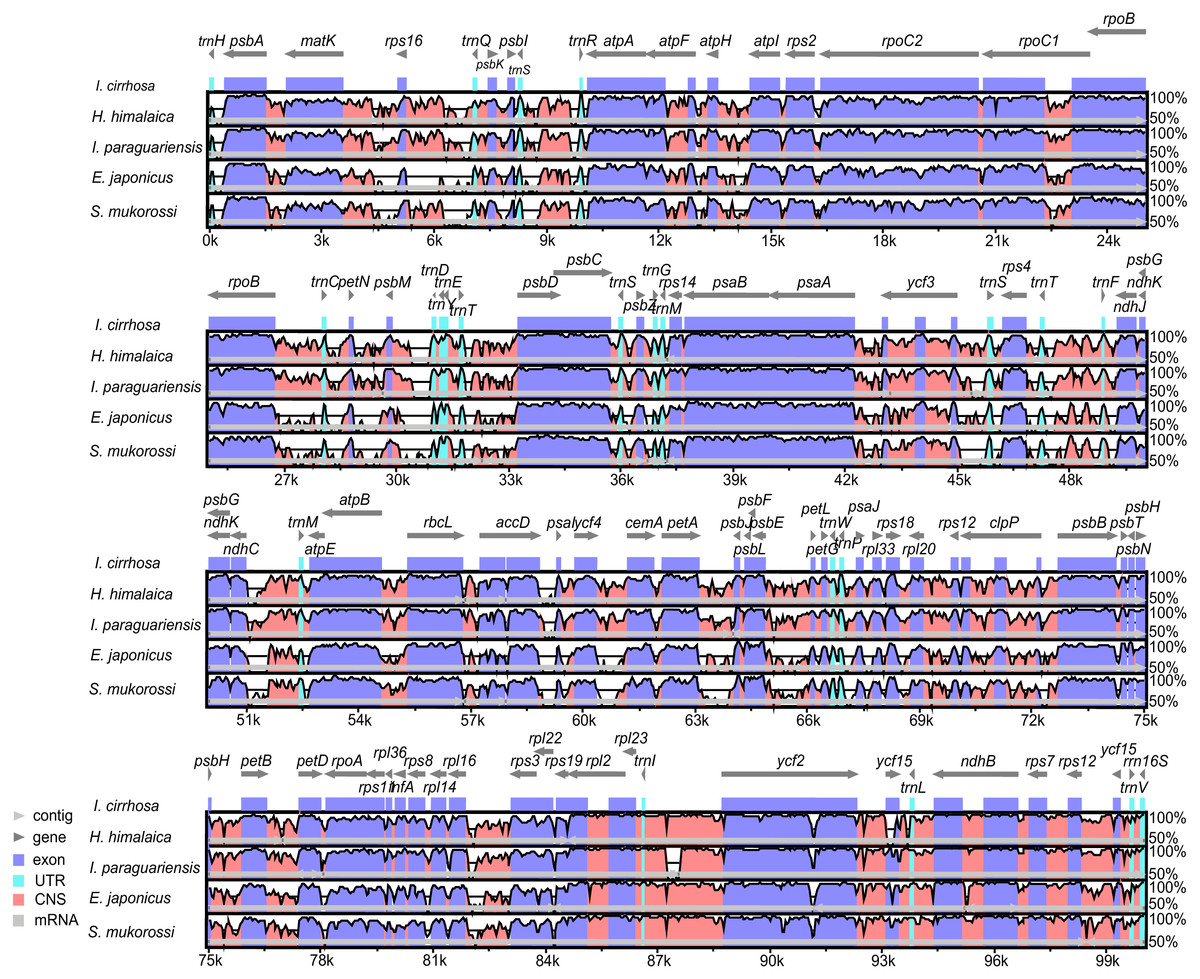
Figure 3: Identity plot comparing five species plastomes using I. cirrhosa as the reference.
The vertical scale, ranging from 50% to 100%, indicates the percentage of identity calculated in sliding windows. The horizontal axis indicates the coordinates within the plastome. Different colors correspond to the types of the genome regions, Blue, regions coding for proteins; Pink, regions that are non-coding; Light blue, regions coding for tRNAs and rRNAs. Light horizontal grey arrows represent genes.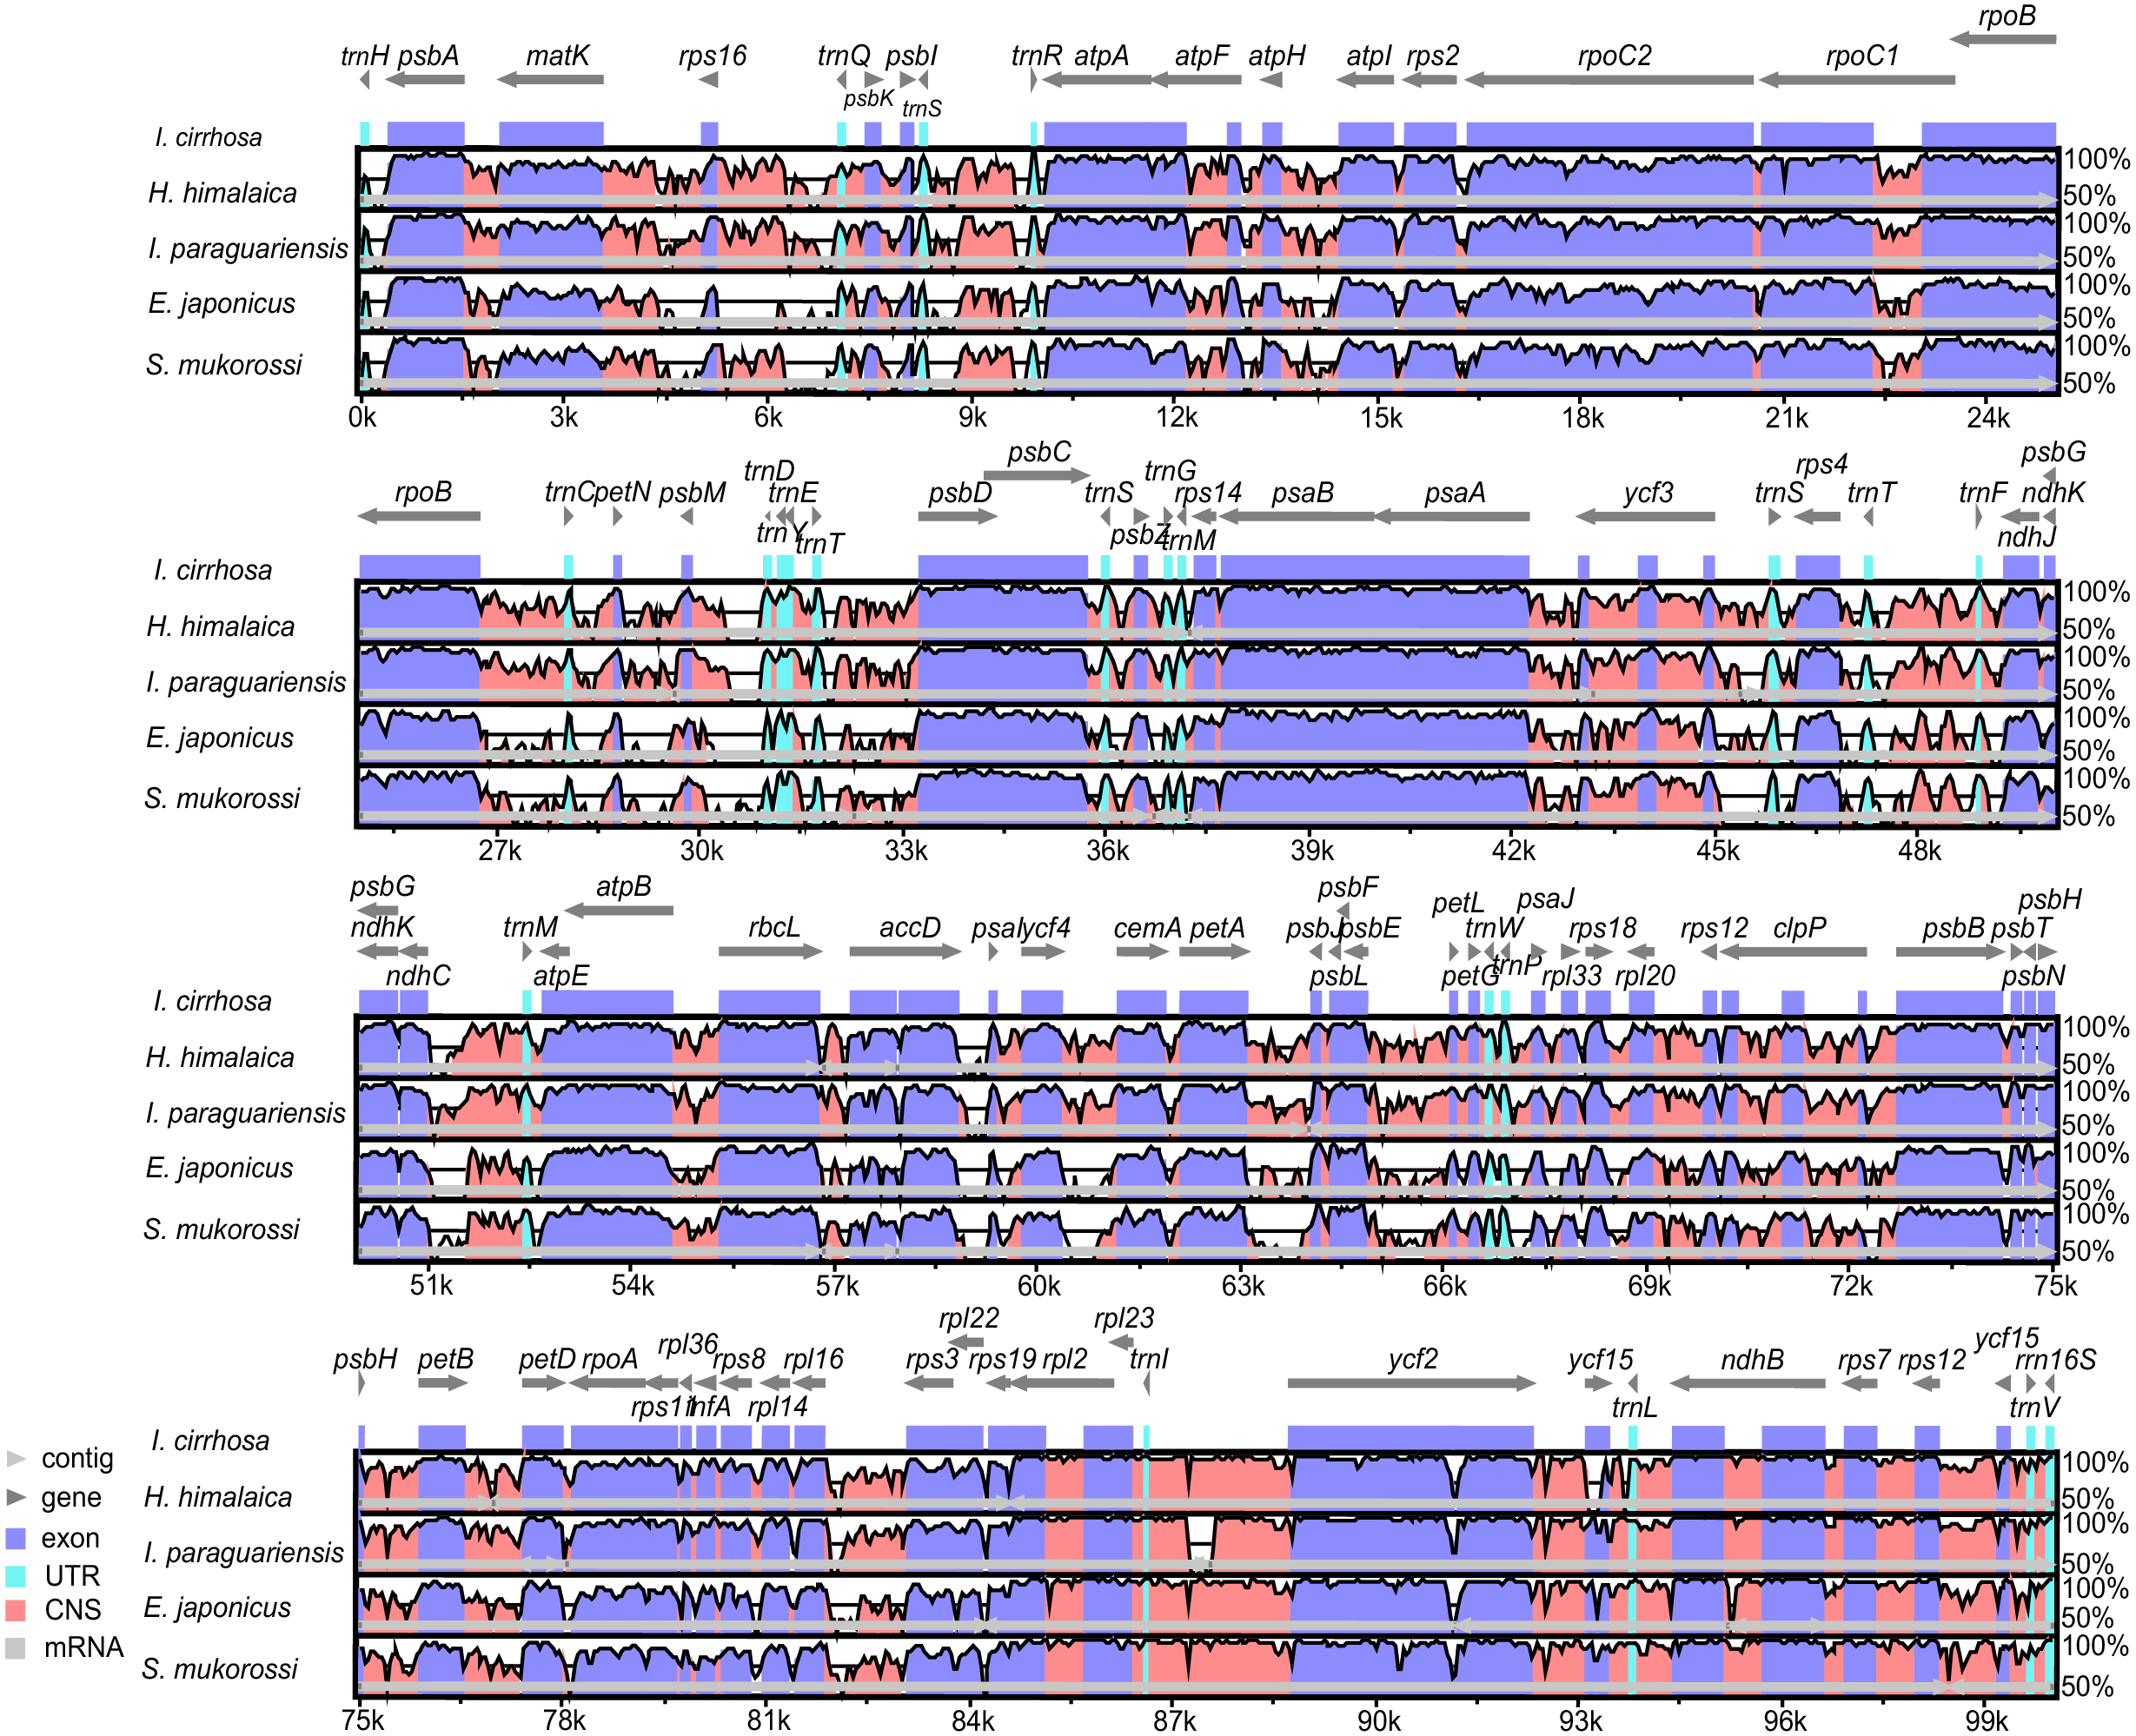
The genome organizations and sequences from the five plastomes are highly conserved, as expected in angiosperms (Dong et al., 2013). Overall, the IR regions were more conserved than the LSC and SSC regions. Similarly, the coding regions were more conserved than their noncoding counterparts. To identify the regions that were more likely to contain markers that can distinguish these congeneric species, we calculated the Kimura two-parameter distances for sequences from each pair of the species by using the distmat programs from the EMBOSS package. The distances for the most divergent regions are shown in Table S9. The most divergent coding regions among the five plastomes were ycf1 (2.11 ± 1.49), ycf2 (1.07 ± 1.32), ndhF (15.55 ± 10.16), rbcL (1.27 ± 0.35), accD (2.73 ± 2.14), and psaA (39.74 ± 39.48) genes. By contrast, the noncoding regions, such as trnH-GUG/psbA (85.61 ± 71.57), psbM/trnD-GUC (5.58 ± 3.73), petA/psbJ (37.89 ± 34.05), and rps16/trnQ-UUG (32.75 ± 18.87), showed the highest degree of sequence divergence. The numbers in the parentheses were the mean ± standard deviation of the Kimura two-parameter distances for each region. Potential molecular markers for genetic diversity and evolutionary studies can be identified from these regions (Shaw et al., 2007). However, the molecular markers from these regions need to be further identified and verified experimentally.
Boundary analysis of I. cirrhosa plastome
The causes of variation in the size of plastomes include the gains and losses of genes and introns (Delannoy et al., 2011), the expansion/contraction of the IR regions (Luo et al., 2014; Zhang et al., 2013), and major structural rearrangements, such as inversions (Walker, Zanis & Emery, 2014) and transpositions (Cosner et al., 1997). The boundary regions of I. cirrhosa, I. paraguariensis, S. mukorossi, E. japonicus, and H. himalaica (Fig. 4) were compared with to illustrate the evolutionary history of the IR boundaries. In the I. cirrhosa plastome, rps19 gene was located at the LSC/IRa junction, and only 38 bp of rps19 was duplicated in the IRb region. Similarly, ycf1 gene was located at the junction of SSC/IRa, and 1,057 bp of ycf1 was duplicated in the IRa region. The incomplete genes of rps19 and ycf1 in the IR regions were pseudogenes. These boundaries generally fluctuated among different plastomes. For example, rps19 was located inside the IR regions in the plastomes of S. mukorossi and E. japonicus. The ndhF gene spanned across the junction of SSC/IR in I. cirrhosa, which is the same as that observed in I. paraguariensis. The ndhF gene and ycf1 pseudogene had 14 bp long overlap (Fig. 4). In the plastomes of E. japonicas, H. himalaica, and S. mukorossi, the ndhF gene was located inside of the SSC regions completely. The SSC region of the I. cirrhosa plastome was in an inverted configuration, which is similar to Dioscoreaceae plastomes (Hansen et al., 2007) but different from those of I. paraguariensis, S. mukorossi, E. japonicus, and H. himalaica.
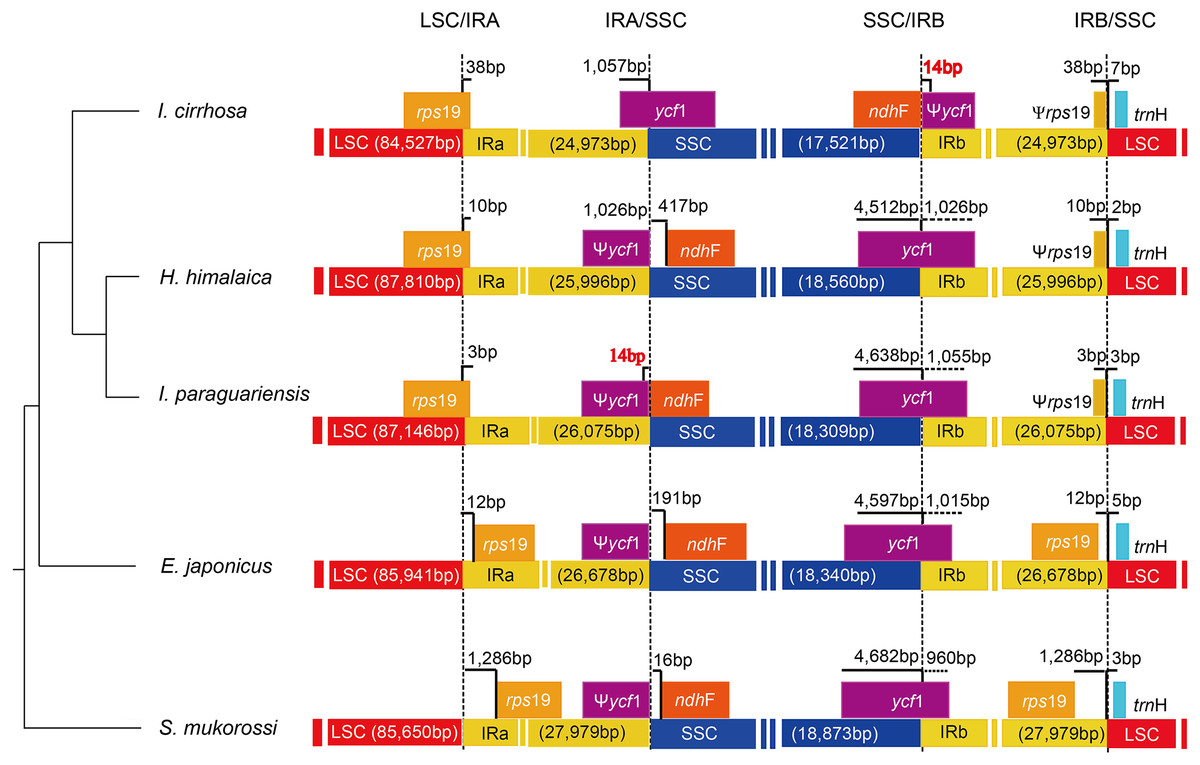
Figure 4: Analysis of the plastomic structure at the LSC/IR and SSC/IR boundary regions.
Sequences from I. cirrhosa, H. himalaica, I. paraguariensis, E. japonicus and S. mukorossi are shown. The phylogenetic relationships of these five species are shown on the left. For each species, a long horizontal strip is used to represent the overall structure of the plastome. The dashed vertical lines mark either the 5′ end or 3′ end of the genes at the junctions. The solid vertical lines indicate the actual junctions. “Ψ” indicates that the corresponding gene is a pseudogene. The length of overlap gene is labeled by red in I. cirrhosa and I. paraguarie.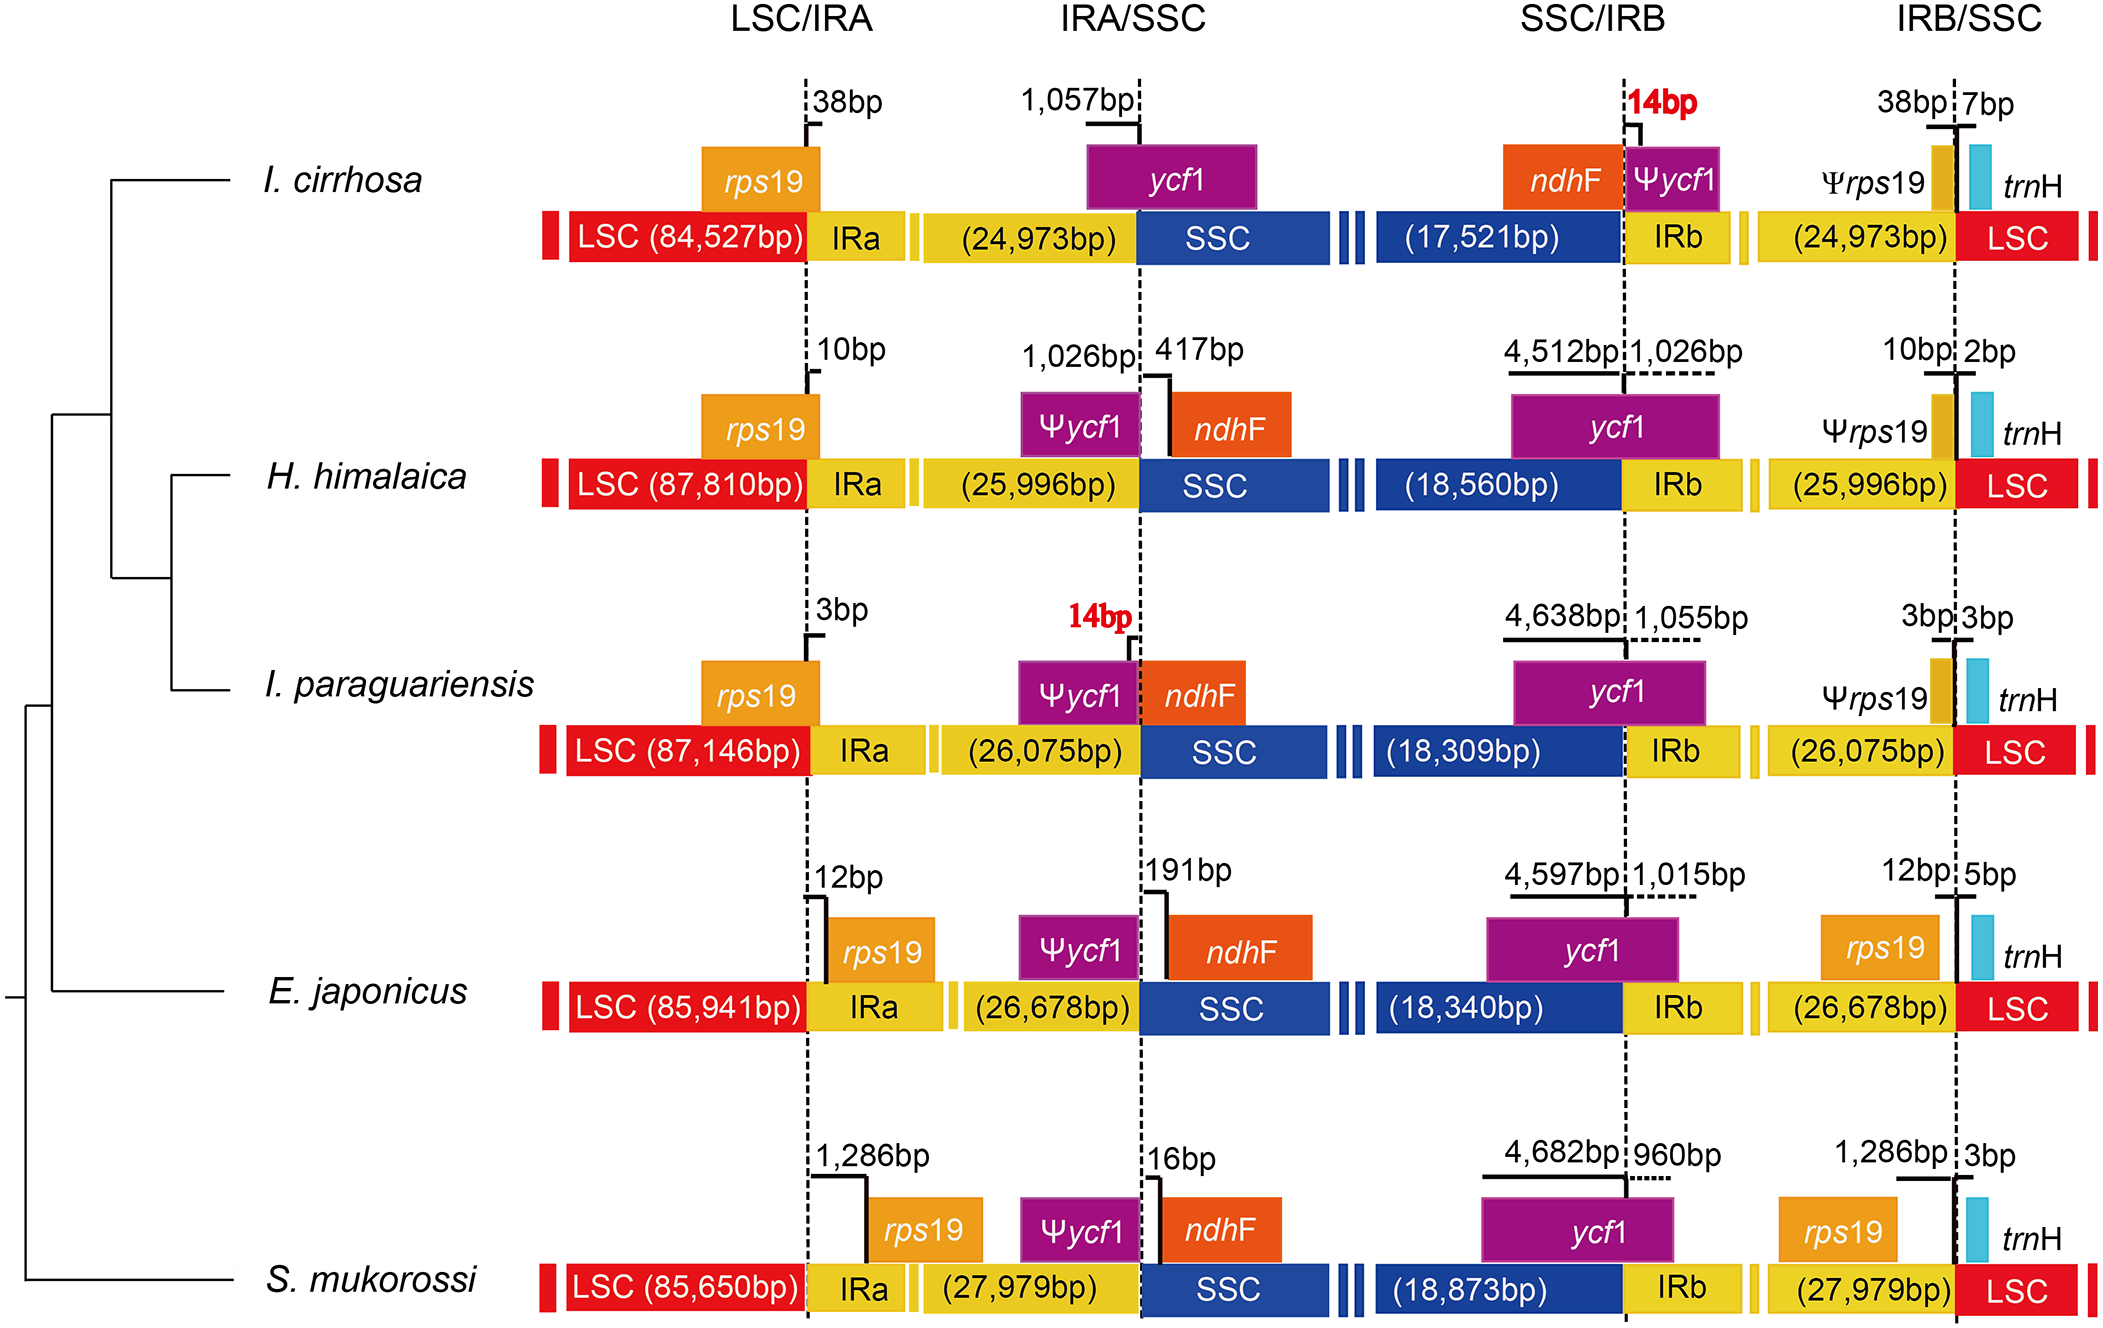
Reconstruction of the plastomes and plastid proteomes of Iodes species
We reassembled the plastome sequences of I. klaineana (Dataset S2), I. liberica (Dataset S3), I. perrieri (Dataset S4), I. scandens (Dataset S5), and I. seretii (Dataset S6) by using the complete plastome sequences of I. cirrhosa as the reference. The reconstructed plastomes significantly improved as shown in the dotplots, showing the alignment between the plastome of I. cirrhosa and those of the five other five Iodes species (Fig. 5). However, we failed to fill the gaps in these plastomes experimentally because we cannot obtain the materials for these five species. Overall, our reference guided the reconstruction of the plastid proteomes and plastomes, thereby resulting in considerable improvement compared with those obtained before (see below). Thus, using closely related reference plastome in the assembly of new plastome sequences is important.
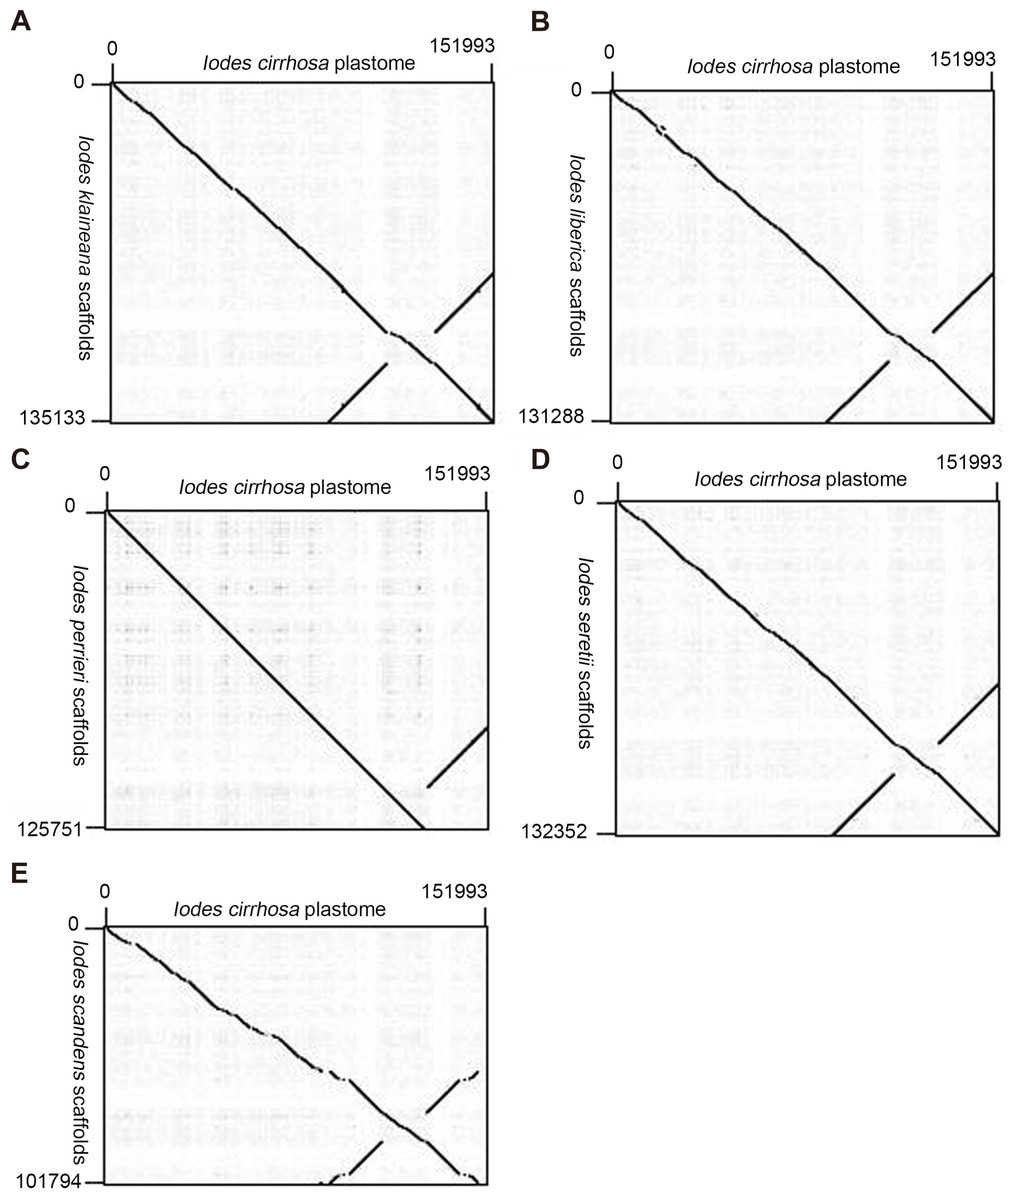
Figure 5: Dotplots of the plastome from Idoes cirrhosa and scaffolds from (A) Iodes klaineana, (B) Iodes liberica, (C) Iodes perrieri, (D) Iodes seretii, (E) Iodes scandens.
The horizontal axis represents the I. cirrhosa plastome. The vertical axis represents the scaffolds of the other five Iodes species.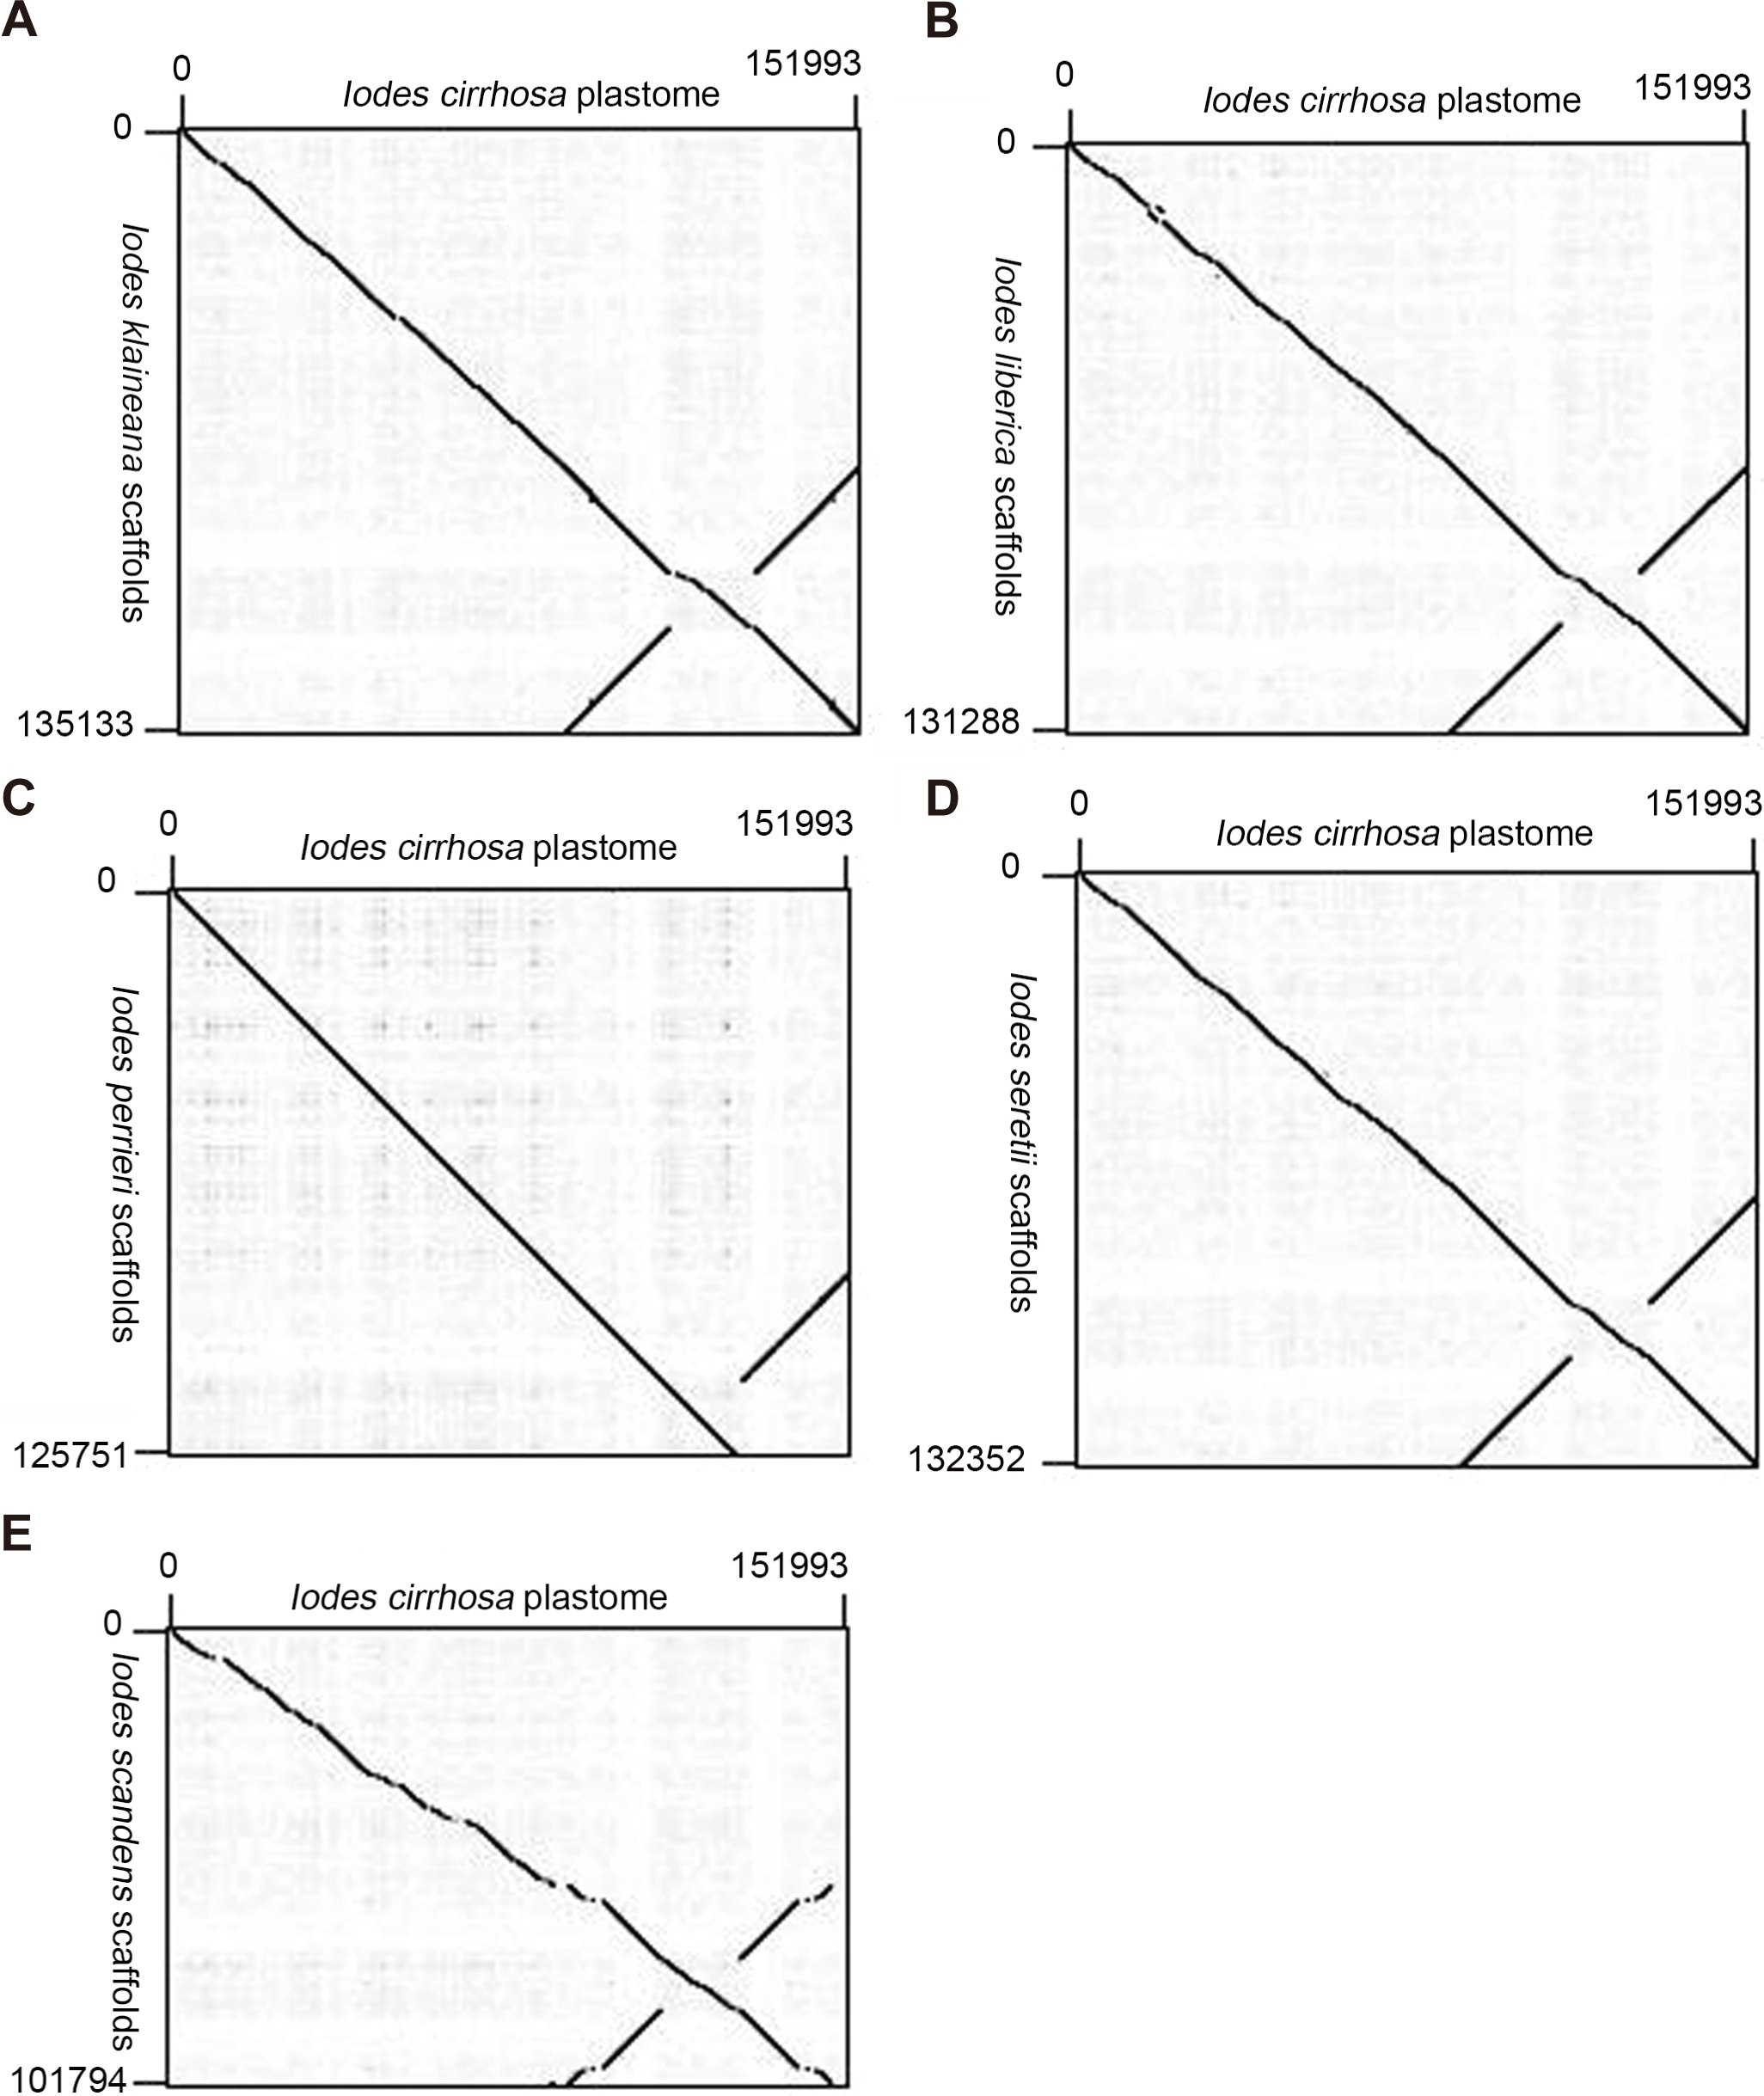
We identified the proteomes for each of the five Iodes species by using the plastid proteome of the I. cirrhosa reference. The multiple sequence alignments of proteins from the six Iodes species and A. thaliana are shown with highlights in Figs. S1–S74 and in FASTA format in Dataset S7. The quality of the assembly results of most homologous proteins have been improved significantly, although some parts of the protein sequences may still be missing. To demonstrate how much our reference guided reassembly has improved the proteome, we aligned the MATK protein from this study and that reported from the previous study for each of the five Iodes species in Figs. S75–S80. The regions that were significantly improved are shown in red square.
Phylogenetics analysis
Then, we rebuilt the phylogenetic tree on the basis of the reconstructed protein sequence as described above, with A. thaliana and N. tabacum as the outgroups, respectively. The ML tree constructed with 74 concatenated proteins is shown in Fig. S81. The topological structure of the Iodes genus branch was the same as those described previously by Stull et al. (2015). The alignment of all the 74 proteins concatenated to construct the phylogenetic tree is shown in NEXUS format in Dataset S8. The corresponding alignments of the nucleotide sequences for each gene were shown with highlights in Figs. S82–S155 and in FASTA format in Dataset S9. The petG, psbZ, rps7, rps12, ycf1, and ycf3 genes were used in the phylogenetics analysis in the present study. However, these genes were excluded from the phylogenetics analysis due to poor sequence quality in the study of Stull et al. (2015). The alignments of these six genes are shown in Figs. S107, S128, S144, S146, S152, and S154. In summary, using the reconstructed proteome, the phylogenetic relationships of the six Iodes species have been resolved completely.
Identification of positively selected genes and sites
Synonymous substitutions were accumulated nearly neutrally, while nonsynonymous substitutions were subjected to selective pressure of varying degrees and directions (positive or negative). In general, the ratio of nonsynonymous to synonymous substitution (ω) measures the levels of selective pressure operating in a protein-coding gene (Jiang et al., 2018). To test which shared genes were subjected to positive selection, we conducted the selection analysis of the exons of each protein-coding gene by using the aBSREL model. A total of 11 branches among the six Iodes species were tested to diversify the selection.
A total of 27 shared genes evolved under positive selection in the Iodes genus branch. The significance and number of rate categories inferred at the Iodes genus branch are provided in Table 3. The 27 genes can be classified into 8 groups. The first group contained two ATP synthase genes, namely, atpB and atpF. The second group contained seven NADH-dehydrogenase genes, namely, ndhA, ndhB, ndhE, ndhF, ndhF, ndhG, and ndhK. The third group contained one gene, that is, petG, which codes a subunit of the cytochrome b/f complex. The fourth group contained psaA, which is a gene involved in photosynthesis. The fifth group contained seven ribosomal protein-coding genes, namely, rpl2, rpl22, rpl23, rps3, rps7, rps18, and rps19. The sixth group contained three RNA polymerase genes, namely, rpoB, rpo C1, and rpoC2. The seventh group contained acc D, ccsA, and matK, which were classified into other protein groups. The eighth group contained ycf1, ycf2, and ycf3, which have unknown functions.
To determine which sites were subjected to positive selection along the Iodes genus branch, we used the codeml from PAML (v. 4.9; Yang & Nielsen, 2002) to analyze the 27 genes that were under positive selection by using the branch-site model. The Iodes genus branch shown in the ML tree was set as the foreground branch, and the outgroup branches were set as the background branches. A total of 52 amino acid residue sites from 11 genes were positively selected (Table 4). The gene names and the numbers of selected sites were ccsA (4), matK (5), ndhE (4), ndhF (3), ndhK (1), psaA (25), rpl23 (2), rpoC1 (2), rps18 (2), rps7 (2), and ycf2 (2). A total of 25 amino acid residue sites in the gene psaA were positively selected. psaA is a gene that is related to photosynthesis. The biological relevance of these selected sites will be an interesting topic for future study.
Divergence-time analysis of the Iodes genus
To identify the divergence time of the six Iodes species, we utilized the ML tree (Dataset S10) and alignment of the 74 shared proteins (Dataset S8) as the original files for the Bayesian evolutionary analysis by using sampling trees. The tree showed that the six Iodes species formed a monophyletic group. The topology of the branch was identical to that in the ML tree. The divergence time of each node in the monophyly of Iodes genus was annotated beyond each node (Fig. 6). The divergence time of the Iodes monophyly was estimated to be 34.40 Mya. This time period was later than the 54 Mya of Icacinaceae appearance according to the TreeTime report (Hedges, Dudley & Kumar, 2006). The divergence time between I. cirrhosa and I. scandens was approximately 31.93 Mya, which was approximately during the early Oligocene epoch. However, the four other Iodes species began to diverge until approximately 23.75 Mya, thereby suggesting that these species were the young population in Iodes (Fig. 6). I. klaineana and I. liberica were the youngest species, which split at approximately 18.07 Mya (Fig. 6). The split time of the six Iodes species was estimated to be from the late Oligocene epoch to the early Miocene epoch.
| Species under selection | B | LRT | Test p-value | Uncorrected p-value | ω Distribution over Sites | Gene name |
|---|---|---|---|---|---|---|
| I. scandens | 0.0395 | 69.1914 | 0 | 0 |
ω1 = 0.219 (97%) ω2 = 10,000 (2.8%) |
acc D |
| I. liberica | 0.0161 | 13.5704 | 0.0046 | 0.0004 |
ω1 = 0.00 (100%) ω2 = 10,000 (0.21%) |
|
| I. seretii | 0.0177 | 20.9163 | 0.0001 | 0 |
ω1 = 0.00 (100%) ω2 = 10,000 (0.43%) |
atp B |
| I. scandens | 0.0395 | 43.2439 | 0 | 0 |
ω1 = 0.0396 (79%) ω2 = 10,000 (21%) |
atp F |
|
I. seretii I. perrieri I. liberica I. klaineana |
0.0033 | 41.7172 | 0 | 0 |
ω1 = 0.00 (98%) ω2 = 10,000 (2.3%) |
|
| I. liberica | 0.0161 | 41.5182 | 0 | 0 |
ω1 = 0.00 (99%) ω2 = 10,000 (0.78%) |
ccs A |
| I. perrieri | 0.0131 | 21.6819 | 0.0001 | 0 |
ω1 = 0.237 (99%) ω2 = 10,000 (0.81%) |
|
| I. liberica | 0.0161 | 31.5631 | 0 | 0 |
ω1 = 0.00 (91%) ω2 = 10,000 (9.2%) |
mat K |
|
I. cirrhosa I. scandens |
0.0034 | 232.27 | 0 | 0 |
ω1 = 1.00 (72%) ω2 = 10,000 (28%) |
|
| I. cirrhosa | 0.023 | 15.8778 | 0.0013 | 0.0001 |
ω1 = 1.00 (95%) ω2 = 10,000 (5.1%) |
|
| I. cirrhosa | 0.023 | 151.9285 | 0 | 0 |
ω1 = 0.0229 (92%) ω2 = 2,240 (8.0%) |
ndh A |
| I. scandens | 0.0395 | 138.8669 | 0 | 0 |
ω1 = 0.465 (90%) ω2 = 2,240 (10%) |
|
| I. seretii | 0.0177 | 125.9252 | 0 | 0 |
ω1 = 0.555 (92%) ω2 = 10,000 (8.2%) |
|
| I. perrieri | 0.0131 | 118.0196 | 0 | 0 |
ω1 = 0.0245 (95%) ω2 = 3,330 (5.0%) |
|
|
I. perrieri I. liberica I. klaineana |
0.0006 | 151.8593 | 0 | 0 |
ω1 = 0.00 (92%) ω2 = 3,330 (8.4%) |
|
| I. klaineana | 0.0074 | 18.3085 | 0.0003 | 0 |
ω1 = 0.271 (100%) ω2 = 10,000 (0.35%) |
|
| I. scandens | 0.0395 | 40.0987 | 0 | 0 |
ω1 = 0.434 (99%) ω2 = 10,000 (0.52%) |
ndh B |
| I. seretii | 0.0177 | 38.5771 | 0 | 0 |
ω1 = 0.00 (71%) ω2 = 1,850 (29%) |
ndh E |
| I. liberica | 0.0161 | 32.0969 | 0 | 0 |
ω1 = 0.176 (99%) ω2 = 10,000 (1.3%) |
ndh F |
| I. perrieri | 0.0131 | 63.2828 | 0 | 0 |
ω1 = 0.264 (97%) ω2 = 377 (2.6%) |
ndh F |
| I. scandens | 0.0395 | 90.4163 | 0 | 0 |
ω1 = 0.241 (96%) ω2 = 324 (4.1%) |
|
| I. seretii | 0.0177 | 13.5496 | 0.0039 | 0.0004 |
ω1 = 0.320 (99%) ω2 = 10,000 (0.82%) |
|
|
I. liberica I. klaineana |
0.0022 | 13.3158 | 0.0039 | 0.0004 |
ω1 = 0.375 (100%) ω2 = 10,000 (0.24%) |
|
| I. scandens | 0.0395 | 25.8917 | 0 | 0 |
ω1 = 0.749 (80%) ω2 = 100 (20%) |
ndh G |
|
I. cirrhosa I. scandens |
0.0034 | 29.2692 | 0 | 0 |
ω1 = 1.00 (99%) ω2 = 10,000 (1.2%) |
ndh K |
| I. perrieri | 0.0131 | 17.129 | 0.0008 | 0.0001 |
ω1 = 0.00 (93%) ω2 = 839 (6.7%) |
pet G |
| I. perrieri | 0.0131 | 362.9645 | 0 | 0 |
ω1 = 0.0306 (94%) ω2 = 10,000 (6.4%) |
psa A |
| I. seretii | 0.0177 | 332.4549 | 0 | 0 |
ω1 = 0.143 (95%) ω2 = 1,550 (4.9%) |
|
|
I. seretii I. perrieri I. liberica I. klaineana |
0.0033 | 158.1644 | 0 | 0 |
ω1 = 0.188 (90%) ω2 = 3,640 (10%) |
|
| I. perrieri | 0.0131 | 44.4643 | 0.0000 | 0.0000 |
ω1 = 0.0577 (72%) ω2= 2000 (28%) |
rpl 2 |
| I. liberica | 0.0161 | 10.1996 | 0.0253 | 0.0021 |
ω1= 1.00 (99%) ω2= 10,000 (1.5%) |
rpl 22 |
| I. scandens | 0.0395 | 15.2617 | 0.0021 | 0.0002 |
ω1= 0.195 (97%) ω2= 110 (3.3%) |
rpl 23 |
| I. scandens | 0.0395 | 19.7602 | 0.0002 | 0.0000 |
ω1= 0.173 (100%) ω2= 255 (0.32%) |
rpo B |
| I. perrieri | 0.0131 | 116.6650 | 0.0000 | 0.0000 |
ω1= 0.0980 (97%) ω2= 3,330 (2.5%) |
rpo C1 |
| I. scandens | 0.0395 | 44.2547 | 0.0000 | 0.0000 |
ω1= 1.00 (99%) ω2= 10,000 (0.94%) |
|
| I. seretii | 0.0177 | 72.9439 | 0.0000 | 0.0000 |
ω1= 0.304 (99%) ω2= 10,000 (0.86%) |
rpo C2 |
| I. scandens | 0.0395 | 98.4880 | 0.0000 | 0.0000 |
ω1= 0.336 (98%) ω2= 10,000 (2.3%) |
|
| I. liberica | 0.0161 | 28.3779 | 0.0000 | 0.0000 |
ω1= 0.540 (100%) ω2= 10,000 (0.47%) |
|
|
I. liberica I. klaineana |
0.0022 | 26.4708 | 0.0000 | 0.0000 |
ω1= 0.777 (100%) ω2= 5,480 (0.38%) |
|
| I. perrieri | 0.0131 | 14.7652 | 0.0017 | 0.0002 |
ω1= 0.402 (100%) ω2= 443 (0.18%) |
|
|
I. perrieri I. liberica I. klaineana |
0.0006 | 13.1292 | 0.0063 | 0.0005 |
ω1= 0.00 (99%) ω2= 10,000 (0.51%) |
rps 3 |
|
I. seretii I. perrieri I. liberica I. klaineana |
0.0033 | 9.9293 | 0.0290 | 0.0024 |
ω1= 0.00 (99%) ω2= 10,000 (1.1%) |
|
| I. perrieri | 0.0131 | 75.2232 | 0.0000 | 0.0000 |
ω1= 0.00 (79%) ω2= 320 (21%) |
rps 7 |
| I. scandens | 0.0395 | 12.6120 | 0.0081 | 0.0006 |
ω1= 0.00 (97%) ω2= 10,000 (3.4%) |
rps 18 |
| I. liberica | 0.0161 | 69.4590 | 0.0000 | 0.0000 |
ω1= 1.00 (83%) ω2= 3,330 (17%) |
rps 19 |
| I. cirrhosa | 0.0230 | 25.6408 | 0.0000 | 0.0000 |
ω1= 1.00 (99%) ω2= 10,000 (0.66%) |
ycf 1 |
| I. perrieri | 0.0131 | 22.7892 | 0.0000 | 0.0000 |
ω1= 0.00 (100%) ω2= 10,000 (0.30%) |
|
| I. scandens | 0.0395 | 194.6220 | 0.0000 | 0.0000 |
ω1= 0.286 (98%) ω2= 10,000 (2.0%) |
ycf 2 |
| I. liberica | 0.0161 | 134.1704 | 0.0000 | 0.0000 |
ω1= 0.0920 (99%) ω2= 6,070 (1.1%) |
|
|
I. liberica I. klaineana |
0.0022 | 51.3748 | 0.0000 | 0.0000 |
ω1= 0.399 (100%) ω2= 3,330 (0.36%) |
|
| I. liberica | 0.0161 | 40.5254 | 0.0000 | 0.0000 |
ω1= 0.367 (95%) ω2= 10,000 (4.9%) |
ycf 3 |
Notes:
- B
-
Optimized branch length
- LRT
-
Likelihood ratio test statistic for selection
- Test p-value
-
p-value corrected for multiple testing
- Uncorrected p-value
-
Raw p-value without correction for multiple testing
- ω
-
The ratio of nonsynonymous to synonymous substitution
| Gene | Positive selected position | Amino acid | Omega value |
|---|---|---|---|
| ccsA | 50 | T | 0.587 |
| 52 | F | 0.505 | |
| 131 | A | 0.502 | |
| 242 | R | 0.647 | |
| matK | 186 | R | 0.815 |
| 434 | G | 0.771 | |
| 495 | S | 0.587 | |
| 568 | V | 0.672 | |
| 639 | R | 0.868 | |
| ndhE | 5 | Y | 0.660 |
| 34 | F | 0.669 | |
| 68 | G | 0.559 | |
| 78 | S | 0.525 | |
| ndhF | 503 | M | 0.685 |
| 512 | F | 0.642 | |
| 723 | I | 0.639 | |
| ndhK | 224 | R | 0.994 |
| psaA | 18 | H | 0.717 |
| 28 | R | 0.719 | |
| 652 | A | 0.702 | |
| 680 | P | 0.896 | |
| 771 | H | 0.946 | |
| 856 | F | 0.985 | |
| 859 | R | 0.580 | |
| 860 | D | 0.984 | |
| 861 | Y | 0.979 | |
| 862 | D | 0.569 | |
| 871 | L | 0.934 | |
| 873 | R | 0.979 | |
| 875 | L | 0.756 | |
| 877 | H | 0.993 | |
| 879 | D | 0.608 | |
| 880 | A | 0.884 | |
| 881 | I | 0.902 | |
| 928 | A | 0.943 | |
| 929 | Q | 0.904 | |
| 931 | I | 0.971 | |
| 932 | Q | 0.972 | |
| 987 | V | 0.880 | |
| 988 | H | 0.992 | |
| 989 | H | 0.989 | |
| 993 | F | 0.568 | |
| rpl23 | 33 | I | 0.629 |
| 37 | R | 0.623 | |
| rpoC1 | 102 | T | 0.657 |
| 693 | F | 0.712 | |
| rps18 | 74 | S | 0.621 |
| 95 | I | 0.698 | |
| rps7 | 12 | A | 0.714 |
| 69 | V | 0.709 | |
| ycf2 | 1,478 | S | 0.894 |
| 2,127 | V | 0.994 |
Notes:
Omega value = 1, >1, and <1, indicates neutral evolution, purifying selection, and positive selection, respectively.
Discussion
In this study, we sequenced and analyzed the plastome of I. cirrhosa, which was the first complete plastome sequence in Icacinaceae. In particular, we (1) extracted total DNA from the leaves of I. cirrhosa; (2) filtered the sequence reads on the basis of sequence similarity to the plastome sequences of the other closely related species; (3) assembled the sequence reads followed by gap-filling to obtain the complete plastome; (4) annotated the genome to identify protein-coding, rRNA, and tRNA genes; (5) calculated the bias of codon usage; (6) analyzed the long repeat and SSR sequences; (7) characterized the boundary of the IR regions; (8) reconstructed proteomes and plastomes of the five Iodes species by using the plastome sequence of I. cirrhosa as reference; (9) further confirmed the phylogenetic relationships among the six Iodes species; and (10) identified the positively selected genes and sites in the plastomes on the basis of this phylogeny and resolved the evolutionary history of these six Iodes species.
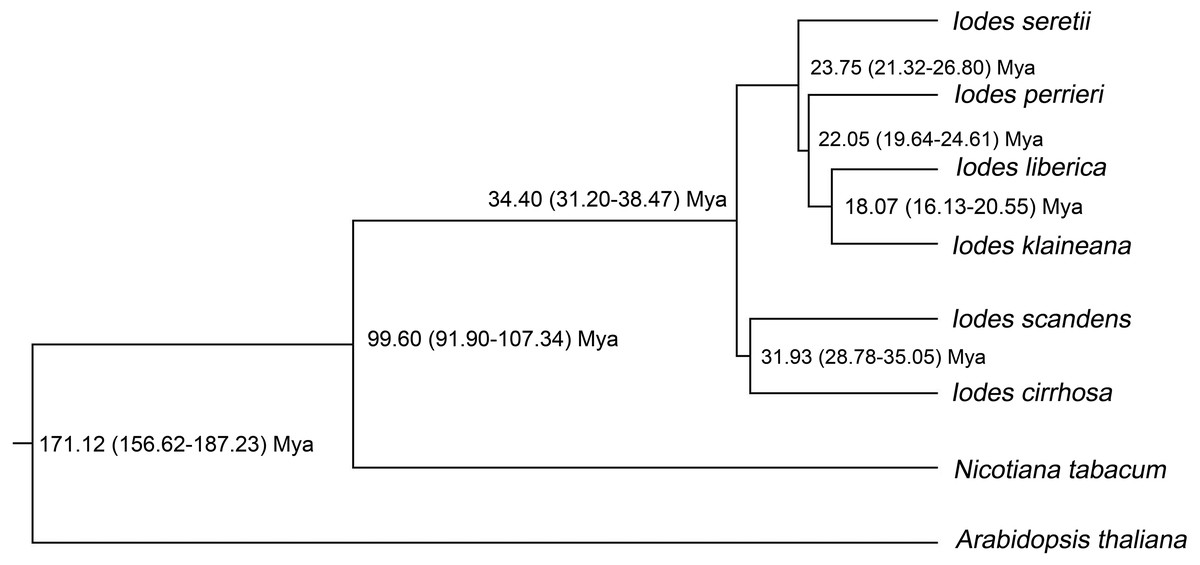
Figure 6: Divergence time of the six Iodes species estimated using the BEAST software.
Numbers beyond the node represent Iodes species divergence time (million years ago, Mya) and 95% highest posterior density intervals. The topology of the Iodes branch based on 74 protein-coding genes is completely consistent with ML tree.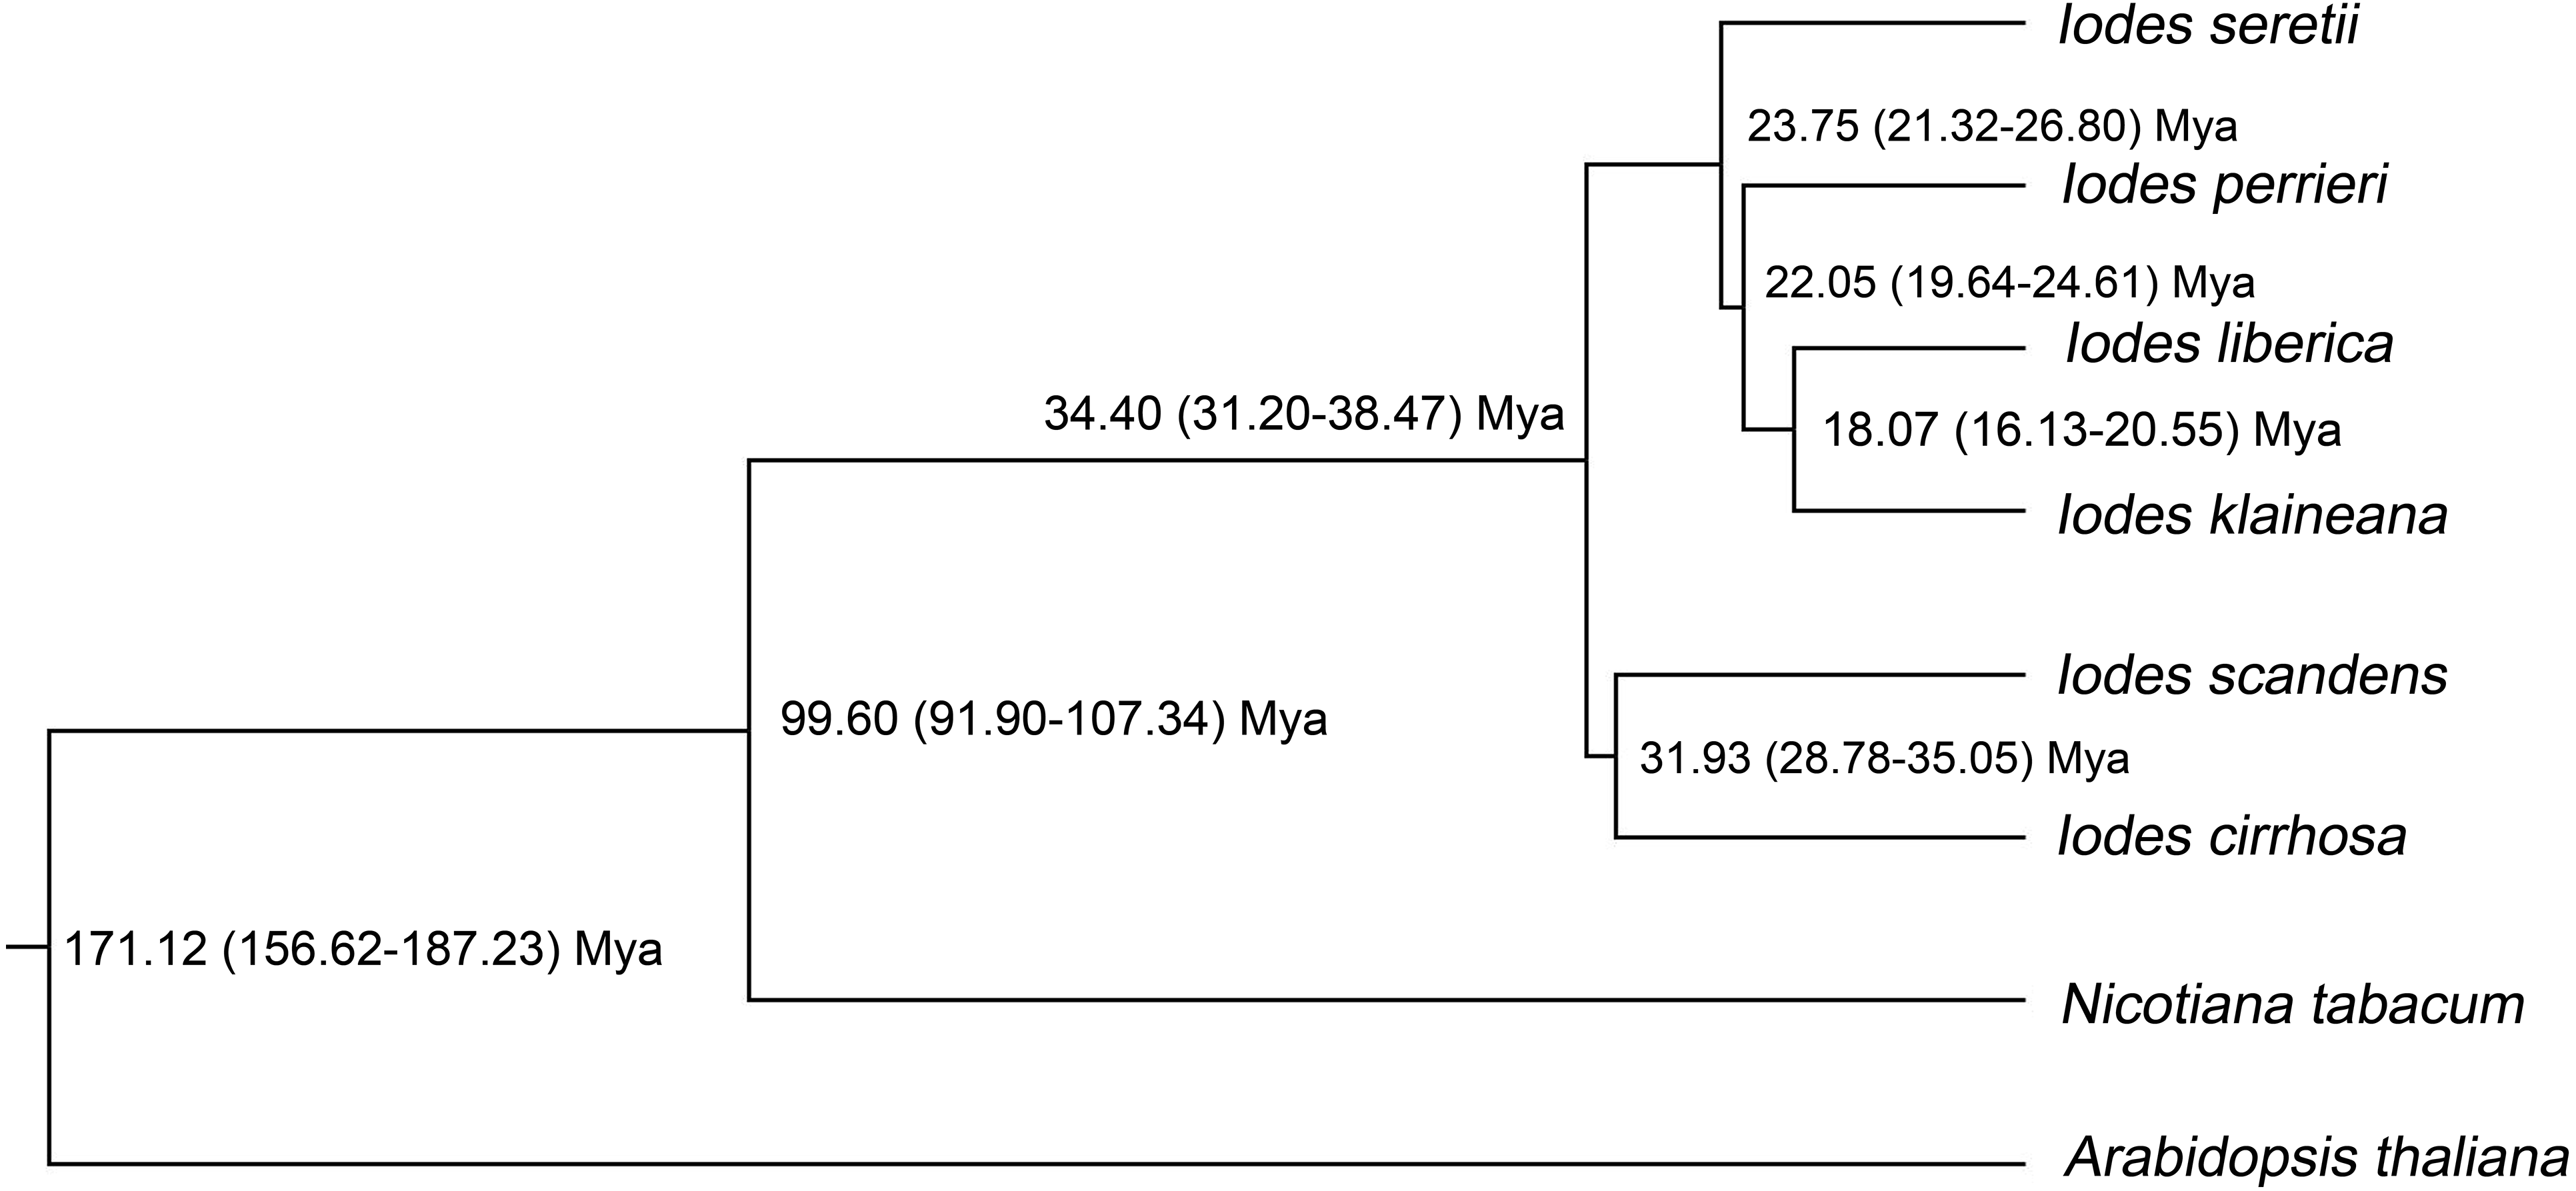
In a previous study, plastome-scale dataset has been used to resolve the basal lamiid phylogeny (Stull et al., 2015). As described before, complete plastome sequences are needed for many applications. Hence, we downloaded the plastome-scale dataset for six Iodes species reported in the study of Stull et al. and assembled them following the standard procedures described above. To our surprise, all six assembly results were highly fragmental and contained numerous gaps. Failure to obtain high-quality assemblies may be due to the following reasons. First, the samples in Stull et al.’s (2015) study may be of relatively poor quality. The extracted DNAs had been degraded extensively and lost some regions completely. Second, the Icacinaceae genomes may be highly heterogeneous. Third, the plastomes may be highly fragmented. Unfortunately, we failed to collect samples of the species reported previously and cannot test the hypotheses above. Instead, we collected the samples of I. cirrhosa and successfully obtained the first complete plastome sequence in Icacinaceae.
From the complete plastome sequences, many SSR markers were identified. These SSRs are potentially useful in studying the evolutionary history of I. cirrhosa populations (Chae et al., 2014; Khadivi-Khub et al., 2014). SSRs play an important role in genomic rearrangement and sequence variation in plastomes (Huang et al., 2014). The dominance of A/T in mononucleotide SSRs in I. cirrhosa was similar to those described previously (Yao et al., 2016). Approximately 83% of the repeats were found in the intergenic regions, which were often also divergent hotspot regions (Huang et al., 2014; Yao et al., 2015). These regions would be useful for the development of new phylogenetic markers for species identification and discrimination.
Regarding the gene contents, four pairs of overlapping genes were identified in the I. cirrhosa plastome. The presence of overlapping genes in plastomes generally indicates the low evolutionary degree of species and is a common feature of bacterial genomes. Overlapping genes are often transcriptionally and translationally coregulated and have been found in other plastomes. In tobacco plastome, four pairs of overlapping genes, namely, psbD/psbC, ndhC/ndhK, atpB/atpE, and rpl22/rps3, have been found (Shinozaki et al., 1986). Compared with those in the tobacco genome, the overlapping gene pair of ndhC/ndhK in the tobacco plastome was replaced by the pair of ndhF/Ψycf1 in the I. cirrhosa plastome. The overlapping gene pair ndhF/Ψycf1 was also found before in the I. paraguariensis plastome and in some Asteraceae species (Curci et al., 2015).
For other gene pairs, the 50-nucleotide overlapping regions of the psbD and psbC genes were first identified in the plastome of spinach. The in vitro translation of the psbC cistron is dependent upon the upstream psb D cistron (Adachi et al., 2012). However, not all overlapping genes are coregulated, transcribed, and translated. For example, the overlapping genes atpB and atpE have a stop codon (UGA) for atpB and the start codon (AUG) for atpE. Therefore, the translation of atpB and atpE is considered independent (Suzuki et al., 2011). Whether or not these overlapping genes represent their ancestral states and are kept for particular reason will be interesting topics for future studies.
In the selection pressure analysis, eight groups of genes were under positive selection pressure. The largest groups of genes encoded NADH-dehydrogenases and ribosomal proteins, each of which had seven members. The chloroplast NADH dehydrogenase-like (NDH) complex is involved in the cyclic electron transport around photosystem I and chlororespiration. The NDH complex was discovered more than 20 years ago. However, analyzing the function of this complex has been difficult because of low abundance and fragile nature. The NDH subunit is involved in the stabilization of the NDH complex, especially under high light conditions (Fan et al., 2015). Considering that the Iodes species is largely distributed in the tropical and subtropical areas, which are generally under high light and temperature conditions, the selection of these NDH genes will likely increase the stability of the complex, thereby allowing the effective functioning of the chloroplast in these environments.
Similarly, the ribosomal proteins are part of the ribosome complex, which is the translational machinery that is critical for the correct production of proteins required for the normal functioning of a cell. The selection of the ribosomal proteins may increase the stability of ribosomal complex under the conditions frequently associated with high light, such as high temperature, which is similar to the selection of the NDH proteins under high light. However, whether or not these ribosomal proteins have better stability under high light or associated conditions than those ancestral proteins still require further validation experimentally.
The ycf1, ycf2, and ycf3 genes were also positively selected. The functions of these three genes are largely unknown at present. These genes are known to evolve rapidly. The question on whether the rapid evolution rates of these genes and these selected sites are related remain to be elucidated. Sequence similarity search against GenBank showed that this protein is similar to photosystem I assembly protein ycf3 from Anethum graveolens (EU016788) and Lomandra lonqifolia (HQ183650). Consistent with the proposal above, the positive selection of the YCF3 gene may reflect the adaptation of these plants to the high-light environmental condition.
As shown in the divergence-time analysis, Iodes species were first formed on the last Eocene epoch. The time was later than the early-middle Eocene epoch of Icacinaceae fossils (Stull, Moore & Manchester, 2011), which indicated the varied forming times of Icacinaceae species. The older group of I. cirrhosa and I. scandens split on the last Eocene epoch. From the middle Eocene epoch, the climate have become cold, and the continental interiors have begun to dry out. The formation of the Iodes genus may be affected by the cooling environment. The divergence times of the six Iodes species in this present study were distributed in the Oligocene and the early Miocene. The climate was slow global cooling during the Oligocene and Oligocene-Miocene transition, although it remained stable. The cooling climate may have driven the evolution of these Iodes species. However, the six Iodes species formed two branches in the Iodes monophyly, which may be attributed by considerably complex reasons.
The current study failed to identify genes that are related to the therapeutic effects of I. cirrhosa. Given that chloroplast is mostly involved in the photosynthesis process, it is not directly related to the biosynthesis of bioactive compounds. In the future, the analysis of nuclear genes will likely identify the genes that are related to the production of their activity. Lastly, while a plastome-scale dataset is generally sufficient to resolve a phylogenetic relationship, complete plastome sequences are required to understand the evolutionary processes at the genome scale and identify markers from noncoding regions. The results obtained from this study have set the stage to understand how plastomes from Icacinaceae evolve.
Conclusions
The complete plastome of I. cirrhosa, which is the first sequenced member of the Icacinaceae family, was determined and characterized in detail. Using the plastome of I. cirrhosa as a reference, we reconstructed the proteomes and plastomes of the five Iodes species. We identified 27 genes and 52 amino acid sites that had undergone positive selection. The divergence time of the six Iodes species was 34.40 Mya.