
Predictive value of machine learning for the risk of acute kidney injury (AKI) in hospital intensive care units (ICU) patients: a systematic review and meta-analysis
- Published
- Accepted
- Received
- Academic Editor
- Peixin Dong
- Subject Areas
- Emergency and Critical Care, Immunology, Nephrology, Data Mining and Machine Learning
- Keywords
- Intensive care units, Acute kidney injury, Machine learning
- Copyright
- © 2023 Du et al.
- Licence
- This is an open access article distributed under the terms of the Creative Commons Attribution License, which permits using, remixing, and building upon the work non-commercially, as long as it is properly attributed. For attribution, the original author(s), title, publication source (PeerJ) and either DOI or URL of the article must be cited.
- Cite this article
- 2023. Predictive value of machine learning for the risk of acute kidney injury (AKI) in hospital intensive care units (ICU) patients: a systematic review and meta-analysis. PeerJ 11:e16405 https://doi.org/10.7717/peerj.16405
Abstract
Background
Recent studies suggest machine learning represents a promising predictive option for patients in intensive care units (ICU). However, the machine learning performance regarding its actual predictive value for early detection in acute kidney injury (AKI) patients remains uncertain.
Objective
This study represents the inaugural meta-analysis aiming to investigate the predictive value of machine learning for assessing the risk of AKI among ICU patients.
Methods
PubMed, Web of Science, Embase, and the Cochrane Library were all thoroughly searched from inception to June 25, 2022. Eligible studies for inclusion were those concentrating on the predictive value and the development, validation, or enhancement of a prediction model for AKI patients in the ICU. Measures of effects, including c-index, sensitivity, specificity, and their corresponding 95% confidence intervals (CIs), were employed for analysis. The risk of bias in the included original studies was assessed using Probst. The meta-analysis in our study was carried out using R version 4.2.0.
Results
The systematic search yielded 29 articles describing 13 machine-learning models, including 86 models in the training set and 57 in the validation set. The overall c-index was 0.767 (95% CI [0.746, 0.788]) in the training set and 0.773 (95% CI [0.741, 0.804]) in the validation set. The sensitivity and specificity of included studies are as follows: sensitivity [train: 0.66 (95% CI [0.59, 0.73]), validation: 0.73 (95% CI [0.68, 0.77])]; and specificity [train: 0.83 (95% CI [0.78, 0.87])], validation: 0.75 (95% CI [0.71, 0.79])].
Conclusion
The machine learning-based method for predicting the risk of AKI in hospital ICU patients has excellent predictive value and could potentially serve as a prospective application strategy for early identification. PROSPERO Registration number ID: CRD42022362838.
Introduction
Acute kidney injury (AKI) occurs in approximately 10–15% of hospitalized patients, with more than 50% of patients experiencing it in intensive care units (ICU) (Ronco, Bellomo & Kellum, 2019). This condition not only impacts acute incidence rates and mortality but also leads to substantial medical resource utilization and high treatment costs, which cannot be overlooked in the long-term prognosis of patients (Huang, Xu & Yang, 2020; Silver et al., 2017). Therefore, there is a crucial need for timely and accurate prediction of AKI risk in ICU patients. AKI is a heterogeneous clinical syndrome with multiple causes, pathogenesis, and outcomes (Levey & James, 2017; Pickkers et al., 2021). Unfortunately, these complexities are not adequately addressed in the current diagnosis and treatment of AKI.
The acute renal injury network (AKIN) defines AKI as the simultaneous increase in serum creatinine and reduction of urine volume (Hoste et al., 2018). Presently, the diagnosis of AKI relies on the changes in serum creatinine and urine volume and some blood and urine biomarkers related to the damage of renal tubules (e.g., SOFA score) (Ostermann et al., 2020). However, when it comes to changes in serum creatinine and urine volume, the assessment primarily reflects the loss of renal function rather than injury. This means that individuals experiencing transient volume depletion may meet the diagnostic criteria for AKI when changes in serum creatinine and urine volume are used as evaluation criteria (Bhatraju et al., 2020; Kellum et al., 2021). Additionally, one significant drawback of current AKI biomarker research is the absence of tissue correlation (Wen & Parikh, 2021). Both AKIN and kidney disease: improving global outcomes(KDIGO) guidelines define oliguria as the reduction of urine volume to <0.5 ml/kg/hour (Khwaja, 2012). Thus, the urine volume and creatinine change value need to be combined with time to have an accurate diagnosis (Md Ralib et al., 2013; Wang & Chryssanthou, 1988). Therefore, relying solely on changes in serum creatinine and urine volume may lead to an overestimation or underestimation of the incidence of renal injury (Hoste et al., 2018). Nevertheless, the AKI stage is an essential time window that may initiate key interventions to change the natural history of kidney disease. Consequently, it is crucial to accurately and promptly identifying the onset of AKI (Chawla et al., 2017). Given the continuing development of information technology, nanotechnology, and biomedicine, the emergence of new and more effective diagnostic technologies is inevitable.
As a sub-field of artificial intelligence, machine learning can use large data sets to predict future events, providing greater hope for doctors to achieve an accurate diagnosis (Rauschert et al., 2020). Based on the refined process including training, verification, and testing, automatically adjusting model parameters can improve performance (Greener et al., 2022). In recent years, machine learning has been increasingly employed for predicting and diagnosing kidney diseases, including acute kidney injury in pediatric intensive care and forecasting the survival rates of kidney transplantation (Dong et al., 2021; Naqvi et al., 2021). However, there is currently no relevant meta-analysis confirming the effectiveness of machine learning models in predicting AKI among ICU patients. Therefore, this study aims to synthesize previous research and introduce new methodologies for assessing the predictive capabilities of machine learning in assessing the risk of AKI in ICU patients.
Methods
We designed this systematic review according to the checklist provided by the preferred reporting items for systematic reviews and meta-analyses guidelines (Supplemental Material). A protocol for this study was registered on PROSPERO (https://www.crd.york.ac.uk/PROSPERO/#myprospero), with the registration number ID: CRD42022362838.
Search strategy and inclusion criteria
We conduct a comprehensive and systematic search of PubMed, Embase, the Cochrane Library, and Web of Science from inception through 25 June 2022. Only literature in the English language was included. The search utilized a combination of medical subject headings (MeSH) terms and text words related to intensive care units, acute kidney injury, and machine learning. Two researchers (Yuanhong Du, Ping Gan) independently searched the literature, with any discrepancies resolved by a third researcher. Furthermore, the references of each eligible article were meticulously reviewed for potential additional relevant research.
A study had to meet the following criteria to be included
(1) The subjects of this systematic review and meta-analysis were ICU patients, and their modeling variables were accurately recorded.
(2) The articles included in this systematic review and meta-analysis were mainly in the form of a case-control study, with patients with AKI in the ICU in the observation group.
(3) The articles included in this systematic review and meta-analysis were mainly in the form of a case-control study, with patients without AKI in the ICU in the control group.
(4) The original studies incorporated in this systematic review and meta-analysis encompassed the following design types: case-control study, cohort study, and prospective nested case-control study.
The following cases should be excluded
(1) Research types such as meta-analyses, reviews, guidelines, expert opinions, etc.
(2) Studies that solely analyzed risk factors without constructing a complete risk model.
(3) Studies lacking the following outcome indicators for assessing the prediction accuracy of the risk model: ROC, c-statistic, c-index, sensitivity, specificity, accuracy, recall, precision, confusion matrix, diagnostic four-grid table, F1 score, and calibration curve.
(4) Studies with a limited number of samples (<50 cases).
(5) Studies focused on the validation of maturity scales.
(6) Studies that examined the accuracy of single-factor prediction.
Literature screening and data extraction
The retrieved results were uploaded into the document management tool endnote.X9 for screening process. Two investigators independently assessed the studies for inclusion based on their titles, abstracts, full texts, and any Supplementary Materials. Any disagreements that arose were resolved through consultation with a third party.
Before starting data extraction, we developed a standardized data extraction form. This form includes the following information: first author, publication year, author affiliation, study type, patient sources, AKI diagnostic criteria, total number of AKI patients, overall sample size, AKI sample size in the training set, training set sample size, overfitting methods, AKI sample size in the validation set, validation set sample size, approaches for addressing missing data, variable screening and feature selection methods, categories of machine learning models utilized in the literature, and variables chosen for modeling, etc. Two investigators (Yuanhong Du, Lin-Yu Li) independently conducted the screening of studies and data extraction from the included studies based on the provided documents. Any disagreements were resolved with the assistance of a third party.
Quality assessment
Probast (Wolff et al., 2019) was used to assess the risk of bias in the included original research. This tool encompasses several questions distributed across four distinct domains: participants, predictor variables, outcomes, and statistical analyses. These questions collectively assess the overall risk of bias and the overall usability of the studies. Each of the four domains contains two, three, six and nine specific questions, respectively, and each question offers three response options (yes/probably yes, no/probably no, and no information). A domain was categorized as high risk if at least one question indicated “no” or “probably no”, while it was considered low risk if all questions within the domain were answered with “yes” or “probably yes”. The overall risk of bias was rated as low when all domains were considered low risk, and high risk when at least one domain was considered high risk. Two investigators (Yuanhong Du, Chengjing Guan) independently assessed the risk of bias based on Probast and cross-checked their assessments. In cases of disagreement, a third investigator was consulted to assist in resolving the discrepancies.
Data synthesis and statistical analysis
We performed a meta-analysis for evaluation metrics (c-index and accuracy) of machine learning models. In cases where the c-index lacked 95% confidence intervals (CI) and standard errors, we followed the approach described in Debray et al. (2019) to estimate standard errors. Given the discrepancies in the included variables and inconsistent parameters among the machine-learning models, we primarily employed the random effects model for the c-index meta-analysis. In addition, a bivariate mixed-effect model was used for the meta-analysis of sensitivity and specificity. The meta-analysis of this study was performed in R4.2.0 (R Core Team, 2022).
Results
Study selection
The study selection process is described in Fig. 1. Initially, we identified 1,229 distinct records, subsequently evaluating 54 full-text papers. Ultimately, we incorporated 29 studies that met our inclusion criteria. For a comprehensive list of excluded studies that satisfied the inclusion criteria, please refer to the Supplemental Material. Figure 1 provides a visual representation of the specific screening process.
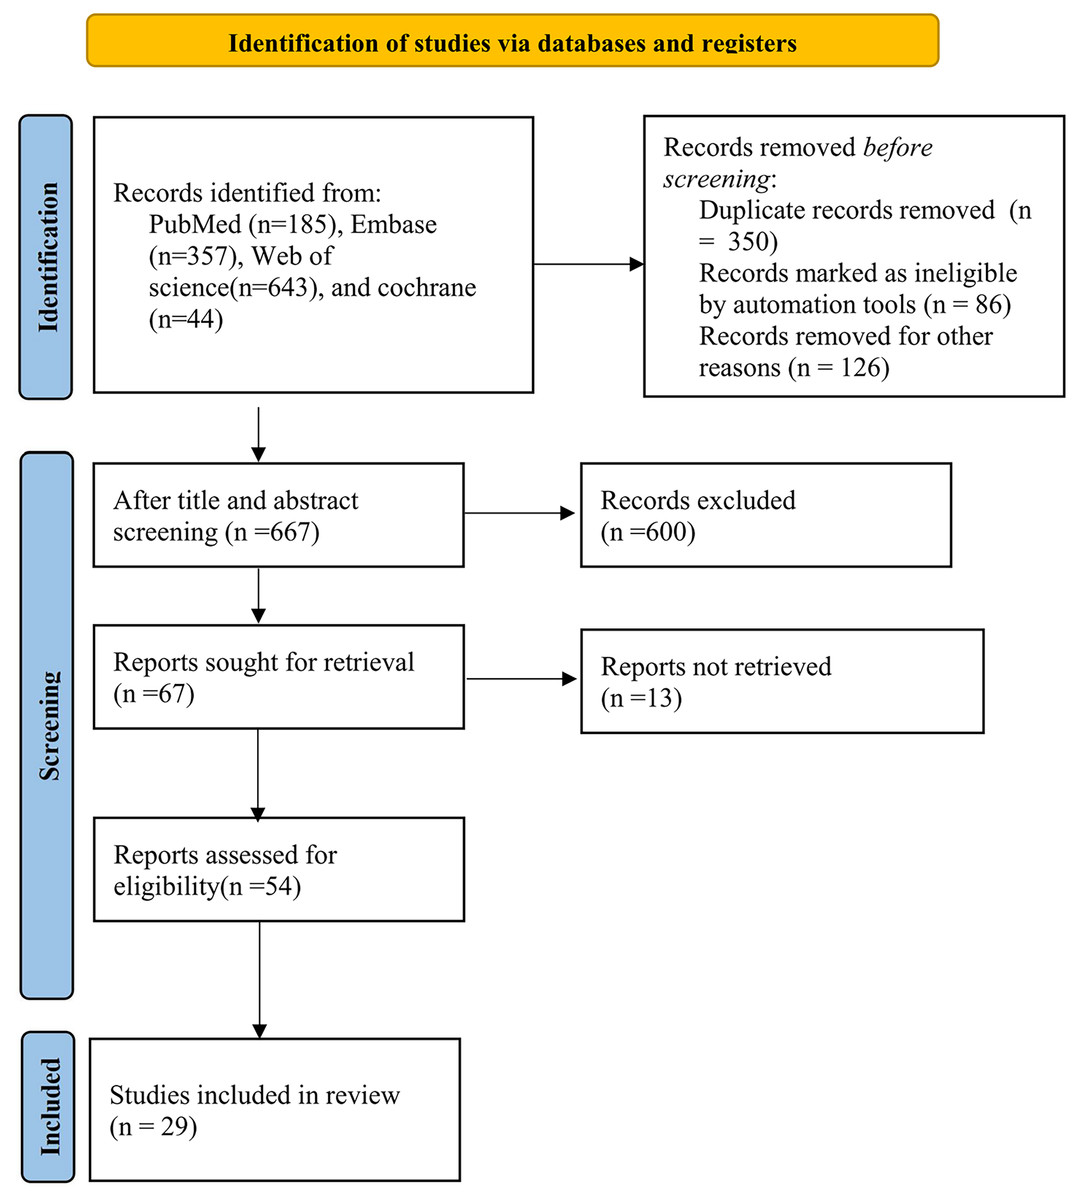
Figure 1: Flow chart of the study selection process.
Characteristics of included studies
The 29 included studies covered 13 different types of models (NB (naive Bayes), RF (random forest), CNN (convolutional neural networks), LR (logistic regression), SVM (support vector machine), ANN (Artificial Neural Networks), GBDT (gradient boosting decision tree), DT (decision tree), DL (deep learning), XGBoost (eXtreme gradient boosting), AdaBoost (adaptive boosting), KNN (k-nearest neighbor)), with a total of 860,852 participants. These studies comprised one cohort study and 28 case-control studies retrieved from four databases: PubMed (n = 185), Embase (n = 357), Web of Science (n = 643), and Cochrane (n = 44). There were 13 studies from the United States, 13 from China, one from the Netherlands, one from Singapore, and one from Belgium within the included literature. See Table 1 for characteristics of included studies.
| First author | Year of publication | Country of author | Study type | Source of patients | Diagnostic criteria for AKI | Total sample size | Number of samples in training set | Generation way of verification set |
|---|---|---|---|---|---|---|---|---|
| Sun M | 2019 | USA | Case control | Database | KDIGO | 16558 | 11558 | 7:3 random sampling |
| Zimmerman LP | 2019 | USA | Case control | Database | KDIGO | 23950 | ||
| Shawwa K | 2021 | USA | Case control | Database | KDIGO | 117003 | 78779 | 8:2 random sampling, external validation |
| Hamid Mohamadlou | 2018 | USA | Case control | Database | KDIGO | 68319 | 48582 | 3-fold cross-validation, 10-fold cross-validation |
| Shuo An | 2020 | China | Case control | Single center | KDIGO | 583 | 408 | 7:3 random sampling |
| Marine Flechet | 2017 | Belgium | Case control | Database | KDIGO | 4490 | 2123 | Priori decided |
| Wen En Joseph Wong | 2021 | Singapore | Case control | Single center | AKIN | 940 | ||
| Jiawei He | 2021 | China | Case control | Database | KDIGO | 718 | 209 | External validation |
| JOSHUA PARRECO | 2019 | USA | Case control | Database | KDIGO | 151098 | 10-fold cross-validation (10 repetitions) | |
| Suru Yue | 2022 | China | Case control | Database | AKIN | 2415 | 1690 | 7: 3 random sampling |
| Sidney Le | 2021 | USA | Case control | Database | KDIGO | 12347 | 10-fold crossvalidation | |
| Travis R. Goodwin | 2020 | USA | Case control | Database | KDIGO | 70096 | 34878 | 8:1:1 (training, development, and testing datasets) |
| Chao Ding | 2021 | China | Case control | Database | KDIGO | 10139 | 5237 | 7:3 random sampling, external validation |
| Jay L. Koyner | 2018 | USA | Case control | Single center | KDIGO | 12158 | 7295 | 6:4 random sampling |
| Yikuan Li | 2018 | USA | Case control | Database | KDIGO | 14470 | 10129 | 7:3 random sampling |
| Chun-Te Huang | 2021 | China (Taiwan) | Case control | Database | KDIGO | 428 | 3874 | 8:1:1 (training:validation:testing) |
| Emma Schwager | 2021 | USA | Case control | Single center | KDIGO | 98472 | 78778 | 8:2 random sampling |
| Iacopo VAGLIANO | 2021 | Netherlands | Case control | Database | KDIGO | 34516 | 8:1:1 random sampling | |
| Sai Huang | 2022 | China | Case control | Database | KDIGO | 6690 | 3986 | Internal validation + external validation |
| Junzi Dong | 2021 | USA | Case control | Multicenter | KDIGO | 8549 | 7329 | derivation (70%), validation (15%), and holdout testing (15%) |
| Jianchao Ma | 2021 | China | Cohort study | Single center | KDIGO | 358 | 232 | |
| Tingting Fan | 2021 | China | Case control | Database | KDIGO | 456 | 228 | 7:3 random sampling |
| Khaled Shawwa | 2021 | USA | Case control | Database | KDIGO | 38223 | 19694 | 8:2 random sampling, external validation |
| Kaidi Gong | 2020 | China | Case control | Database | KDIGO | 12447 | 9958 | 8:2 random sampling |
| Qing Qian | 2021 | China | Case control | Database | KDIGO | 9429 | 6286 | 8:2 random sampling |
| Wenpeng Gao | 2022 | China | Case control | Database | KDIGO | 30020 | 24016 | 4:1 random sampling |
| Qiqiang Liang | 2022 | China | Case control | Database | KDIGO | 58491 | 34520 | 4:1 random sampling, external validation |
| Mohammad Amin Morid | 2020 | USA | Case control | Database | AKIN | 22542 | 6763 | 3:7 random sampling |
| Yuan Wang | 2020 | China | Case control | Database | KDIGO | 34947 | 34947 | 6:4 random sampling, external validation |
| Number of samples in verification set | Modeling variables | Model type |
|---|---|---|
| 5000 | Creatinine level maximum/Mechanical Ventilation/International normalized ratio maximum/Potassium level maximum/Prothrombin time minimum/Estimated glomerular filtration rate/Age/Diastolic BP mean/Partial thromboplastin time minimum/Blood urea nitrogen level maximum | LR RF NB SVM CNN |
| Gender/Age/Ethnicity/Creatinine Max during Day 2 and Day 3/Heart Rate Maximum/Heart Rate Mean/Systolic BP Minimum/Systolic BP Mean/Diastolic BP Minimum/Diastolic BP Mean/Temperature Maximum/SpO2 Minimum/SpO2 Mean/Glucose Level Maximum/Bicarbonate Level Minimum/Creatinine Level Minimum/Creatinine Level Maximum/Hemoglobin Level Minimum/Platelet Count Minimum/Potassium Level Maximum/Partial Thromboplastin Time Minimum/Partial Thromboplastin Time Maximum/International Normalized Ratio Minimum/International Normalized Ratio Maximum/Prothrombin Time Minimum/Prothrombin Time Maximum/Blood Urea Nitrogen Level Maximum/White Blood Cell Count Maximum/Calcium Level Minimum/Mechanical Ventilation/Average Urine Output/Estimated Glomerular Filtration Rate | LR Backward Selection Model/LR All Variables Model/RF Backward Selection Model/RF All Variables Model/MLP Backward Selection Model/MLP All Variables Model | |
| 38224 | Male/African American/ICU mortality/In-hospital mortality/Age/Weight/Baseline serum creatinine/Baseline serum creatinine available/Reasons for ICU admission (Sepsis/Heart valve surgery/Myocardial infarction) | Gradient-boosting model |
| 19737 | Boosted ensembles of decision trees | |
| 175 | Pneumonia within 7 days/GCS classification/Heart failure within 7 days/GCS difference/Torasemide/Hypertension/Coronary heart disease/CV of GCS/Noradrenaline/Dopamine/furosemide | Nomogram |
| 2367 | Age/Baseline serum creatinine/Surgical or medical category/Planned admission/Diabetes/Blood glucose upon ICU admission/Suspected sepsis upon ICU admission/Hemodynamic support upon ICU admission/Serum creatinine/APACHE II score/Maximum lactate Bilirubin/Hours of ICU stay/Total amount of urine/Urine slopea/Time the mean arterial blood pressure is above its average value/Time the mean arterial blood pressure is below 60 mmHg/Pharmacologic hemodynamic support | Random forest machine-learning algorithm (Baseline model Admission model Day1 model Day1 + model) |
| 509 | Age/Gender/Ethnicity/Ethnicity/Diabetes Mellitus/Ischemic Heart Disease/Congestive Heart Failure/Pre-ICU eGFR/Pre-ICU eGFR/Type of surgery/Blood transfusion/Lowest ICU Haemoglobin in 1st 48 h/Lowest ICU bicarbonate in 1st 24 hours/ICU sepsis/Mean Arterial Pressure ≤ 70mmHg | The generalized structural equation model (gSEM) |
| 509 | Non-renal SOFA/creatinine on day 3/hypertension/diuretics/delta creatinine/emergency department/non-renal SOFA at day3/baseline creatinine/renal toxic drugs/AKI stage/Charlson score/age/delta urine output/diabetes mellitus/creatine at day1/chronic obstructive pulmonary disease/chronic liver disease/APS-III/APS-II/heart failure/BMI/non-renal SOFA at day1/urine output at day3/mechanical ventilation/urine output at day1/male/chronic kidney disease/surgery | Recurrent neural network-long short-term memory (RNN-LSTM), decision tree, logistic regression. |
| Creatinine minimum, Creatinine maximum, BUN minimum, BUN maximum, Glucose minimum, Glucose maximum, Potassium minimum, Potassium maximum, Sodium minimum, Sodium maximum, Chloride minimum, Chloride maximum, Calcium minimum, Calcium maximum, Bicarbonate minimum, Bicarbonate maximum, Anion gap minimum, Anion gap maximum, Magnesium minimum, Magnesium maximum, Phosphate minimum, Phosphate maximum, Hgb minimum, Hgb maximum, Hct minimum, Hct maximum, Platelets minimum, Platelets maximum, WBC minimum, WBC maximum, Bilirubin minimum, Bilirubin maximum, AST minimum, AST maximum, ALT minimum, ALT maximum, Alkphos minimum, Alkphos maximum, PT minimum, PT maximum, PTT minimum, PTT maximum, Lactate minimum, Lactate maximum, Albumin minimum, Albumin maximum, Prealbumin minimum, Prealbumin maximum, Minimum temperature, Maximum temperature, Minimum RR, Maximum RR, Minimum HR, Maximum HR, Minimum BP, Maximum BP | Gradient boosted trees (GBT), logistic regression, and deep learning | |
| 725 | Age, gender,ethnicity,obesity, congestive heart failure, hypertension, diabetes, aminoglycoside, glycopeptide antibiotics, nonsteroidal antiinflammatory drugs (NSAIDs), stain, ACEI/ARBs, APSIII, SAPSII, heart rate, systolic pressure, diastolic pressure, respiratory rate, temperature, SpO2, anion gap, bicarbonate, bilirubin, creatinine, chloride, glucose, lactate, platelets, potassium, prothrombin time (PTT), activated partial thromboplastin time (APTT), BUN, white blood cell (WBC), neutrophils, lymphocytes, Gram-positive bacteria, Gram-negative bacteria, and mechanical ventilation | Nomogram model |
| Convolutional neural network | ||
| 35218 | Recurrent additive network for Temporal Risk Prediction | |
| 4902 | Serum albumin, CKD, AKI stage, SOFA score, lactate, RRT during the first day | Nomogram |
| 4863 | Gradient boosting machine (GBM) model, | |
| 4341 | Multinomial naïve Bayes (NB), support vector machine (SVM), logistic regression, gradient boosting decision tree (GBDT), knowledge-guided convolutional neural networks (CNN) | |
| 764 | Time span in ICU/Age/BMI/gender/SBP/DBP/Pulse pressure/Oximetry/Respiratory rate/Pulse rate/Temperature/Vasopressin/Norepinephrine /Dopamine/Epinephrine/Dobutamine/FIO2 /PEEPCPAP/PAW/MAPS/TOTRR/VTEXH/MVEXH/ | Random forest (RF) machine learning algorithm |
| 19694 | Neural network, gradient boosting, logostic regression, random forest | |
| Random forest/gradient boosted trees/logistic regression/LSTM | ||
| 2704 | Highest heart rate, Highest respiratory rate, Lowest diastolic blood pressure, Lowest systolic blood pressure, Highest FIO2 of ventilator, Haemoglobin level, Haematocrit level, Platelet count, Serum urea nitrogen level, Phosphorus level, Magnesium level, SCr level, Baseline SCr level. | Logistic regression and random forest |
| 1220 | Shock index/SpO2/Blood urea nitrogen/Serum creatinine rate of change/Bilirubin/PaCO2/Anion gap/White blood cell count/Serum albumin/Serum chloride/Gentamicin trough/Number of vasoactive drugs administered/Number of high nephrotoxic potential drugs administered/Mean airway pressure/Time since admission | |
| 126 | uNAG, sCysC, sex, age, body mass index (BMI), preexisting clinical conditions of each patient, admission type, baseline sCr, baseline estimated glomerular filtration rate (eGFR), blood laboratory values at ICU admission (hemoglobin, serum glucose, procalcitonin, lactate, Creactive protein), Acute Physiology and Chronic Health Evaluation (APACHE) II score at ICU admission, Sequential organ failure assessment score (SOFA) at ICU admission, use of nephrotoxic drugs within 5 days before ICU admission (nonsteroidal anti-inflammatory drug, angiotensin-converting enzyme inhibitor, angiotensin receptor blocker, immunosuppressant, sulfadiazine, aminoglycoside, vancomycin, acyclovir, amphotericin, allopurinol, or polymyxin), administration of radiographic contrast before ICU admissi | Nomogram |
| 228 | T2DM/microangiopathy/preexisting CHF/history of hypertension/RR/urine output/GCS/DBP | Nomogram |
| 18529 | Hospital Admit BMI/Chronic kidney disease/Congestive heart failure,nonhypertensive/Coagulation and hemorrhagic disorders/Cardiac dysrhythmias/Age at ICU Admit/Weight (kg) Hosp Admit/Cardiac arrest and ventricular fibrillation/Cancer of brain and nervous system/admitdiagnosis_Heart valve disorders/Baseline creatinine combined/Pulmonary heart disease/admitdiagnosis_Septicemia (except in labor)/Chronic ulcer of skin/Acute myocardial infarction/BMI increase/admitdiagnosis_Respiratory failure; insufficiency; arrest (adult)/admitdiagnosis_Other and unspecified benign neoplasm/Other nutritional, endocrine, and metabolic disorders/baseline creatinine available/Weight increase/Chronic obstructive pulmonary disease and bronchiectasis/Disorders of lipid metabolism/Nephritis; nephrosis; renal sclerosis/Hypertension with complications and secondary hypertension/Diseases of white blood cells/admitdiagnosis_Other fractures/Other endocrine disorders/Diabetes mellitus with complications/Coronary atherosclerosis and other heart disease | Gradient-boosting model |
| 2489 | LR, SVM, DT, RF, NN, XGB, VOTE | |
| 3143 | Age, sex, body mass index (BMI)), Blood Urea Nitrogen (mg/dL), International Normalized Ratio, Glucose (mg/dL), Partial Thromboplastin Time (s), Hemoglobin (K/µL), Platelet Count (K/µL), Potassium (mg/dL), White Blood Cell Count (K/µL), Bicarbonate (mg/dL), Calcium (mg/dL), Prothrombin Time (s), Creatinine (mg/dL) and Urine Output (mL), Oxygen saturation (%)) | LightGBMm, logistic regression, Random forest, support vector machine, eXtreme gradient boosting, convolutional neural network |
| 6004 | Length of stay, serum creatinine, diuretic, albumin, bicarbonate, sepsis, chloride, white blood cell count (WBC), blood urea nitrogen (BUN), glucose (GLU), systolic blood pressure (SBP), diastolic blood pressure (DBP), arterial pressure, heart rate (HR), respiratory rate (RR), body temperature (BT), mean arterial pressure (MAP), weight, height, mechanical ventilation, renal replacement therapy (RRT), hyperensort, sodium levels, potassium levels, SOFA scores, APS III scores, SAPS II scores | Logistic regression, random forest, LightGBM, XGBoost, ensemble models |
| 23971 | Logistic regression, LightGBoost, GBDT, AdaBoost, random forest, XGBoost | |
| 15779 | Heart rate, temperature, systolic blood pressure, and diastolic blood pressure, White blood cells, hemoglobin, and platelets, Sodium, anion gap, blood urea nitrogen, potassium, prothrombin, calcium, magnesium, chloride, bicarbonate, and phosphate | Random forest, extreme gradient boosting tree, kernel-based bayesian network, SVM, logistic regression, naïve Bayes, k-nearest neighbor, Artificial Neural Network (ANN) |
| Ensemble Time Series Model (ETSM), XGBoost |
In this study, we utilized 86 models for training, encompassing NB, RF, CNN, LR, SVM, ANN, GBDT, DT, DL, XGBoost, AdaBoost, KNN, and Time Series Models. Additionally, we employed 65 models for testing, which included NB, RF, CNN, LR, SVM, ANN, GBDT, DT, XGBoost, and AdaBoost. The variable screening and feature selection methods primarily relied on various techniques, such as LASSO regression, stepwise regression, variable importance analysis, univariate and multivariate logistic regression models, the XGBoost package in Python, feature importance assessment, Nadam optimizer, bootstrapped backward elimination, least absolute shrinkage, least-squares-fit linear equations, multivariable linear and logistic regression, and backward selection. Furthermore, we employed ten distinct testing models, namely NB, RF, CNN, LR, SVM, ANN, GBDT, DT, XGBoost, and AdaBoost.
Quality of evidence and risk of bias
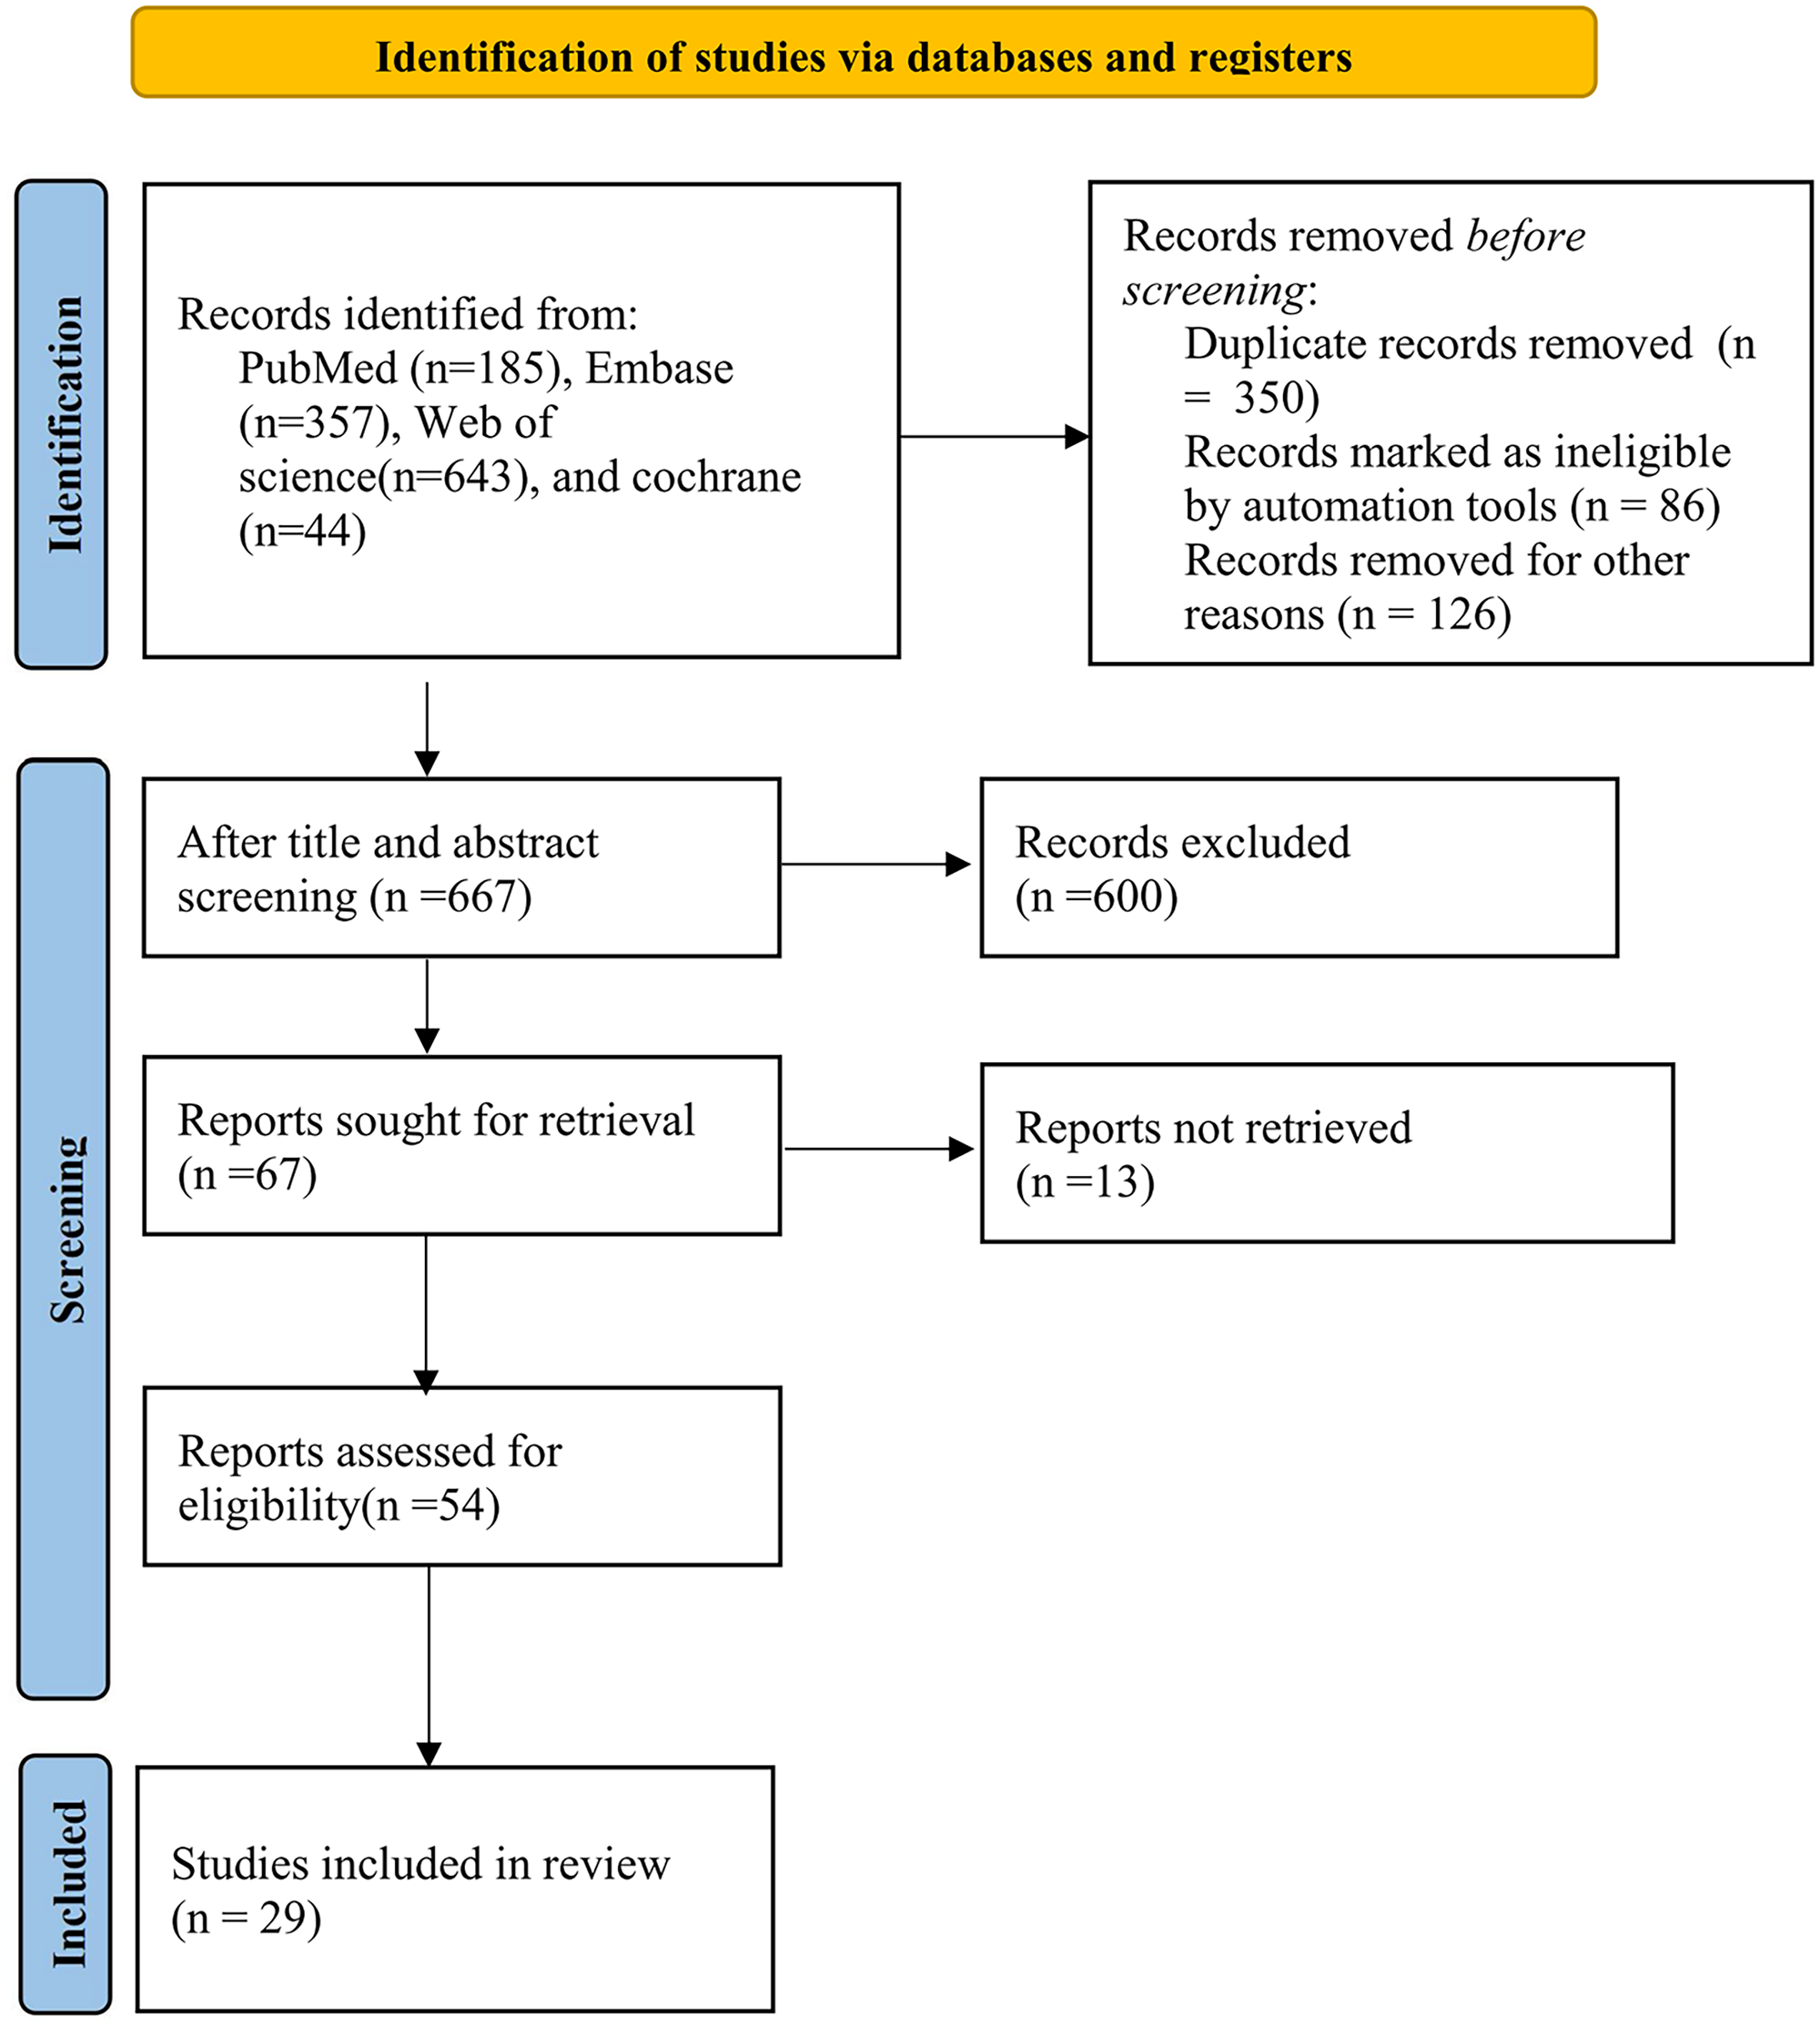
The high risk is mainly concentrated in the research object and the part of statistical analysis. This is predominantly attributed to several factors, including a certain number of case-control studies in the sample source of the included articles, the design of the original study sample size in the statistical analysis part, the way of screening the prediction factors, and the consideration of over-fitting, under-fitting, and optimal fitting of the prediction model.
Among the 86 included models, the machine learning models that relied on demographic information like gender, age, and clinical examination data, including creatinine, central venous pressure, and urine volume, exhibited a reasonable approach. These models were particularly well-suited for analyzing records that contained essential sample characteristics, enhancing the reliability of case records. In the process of data generation, five studies used multivariate imputation to deal with missing values.
In the modeling process, the validation set primarily consists of internal validation generated through random sampling. Additionally, among the 10 studies conducted, there is a subset of studies that include independent external validation sets. Figure 2 shows the probast quality evaluation results.
Figure 2: Risk of bias assessment.
Results of individual studies
C-index
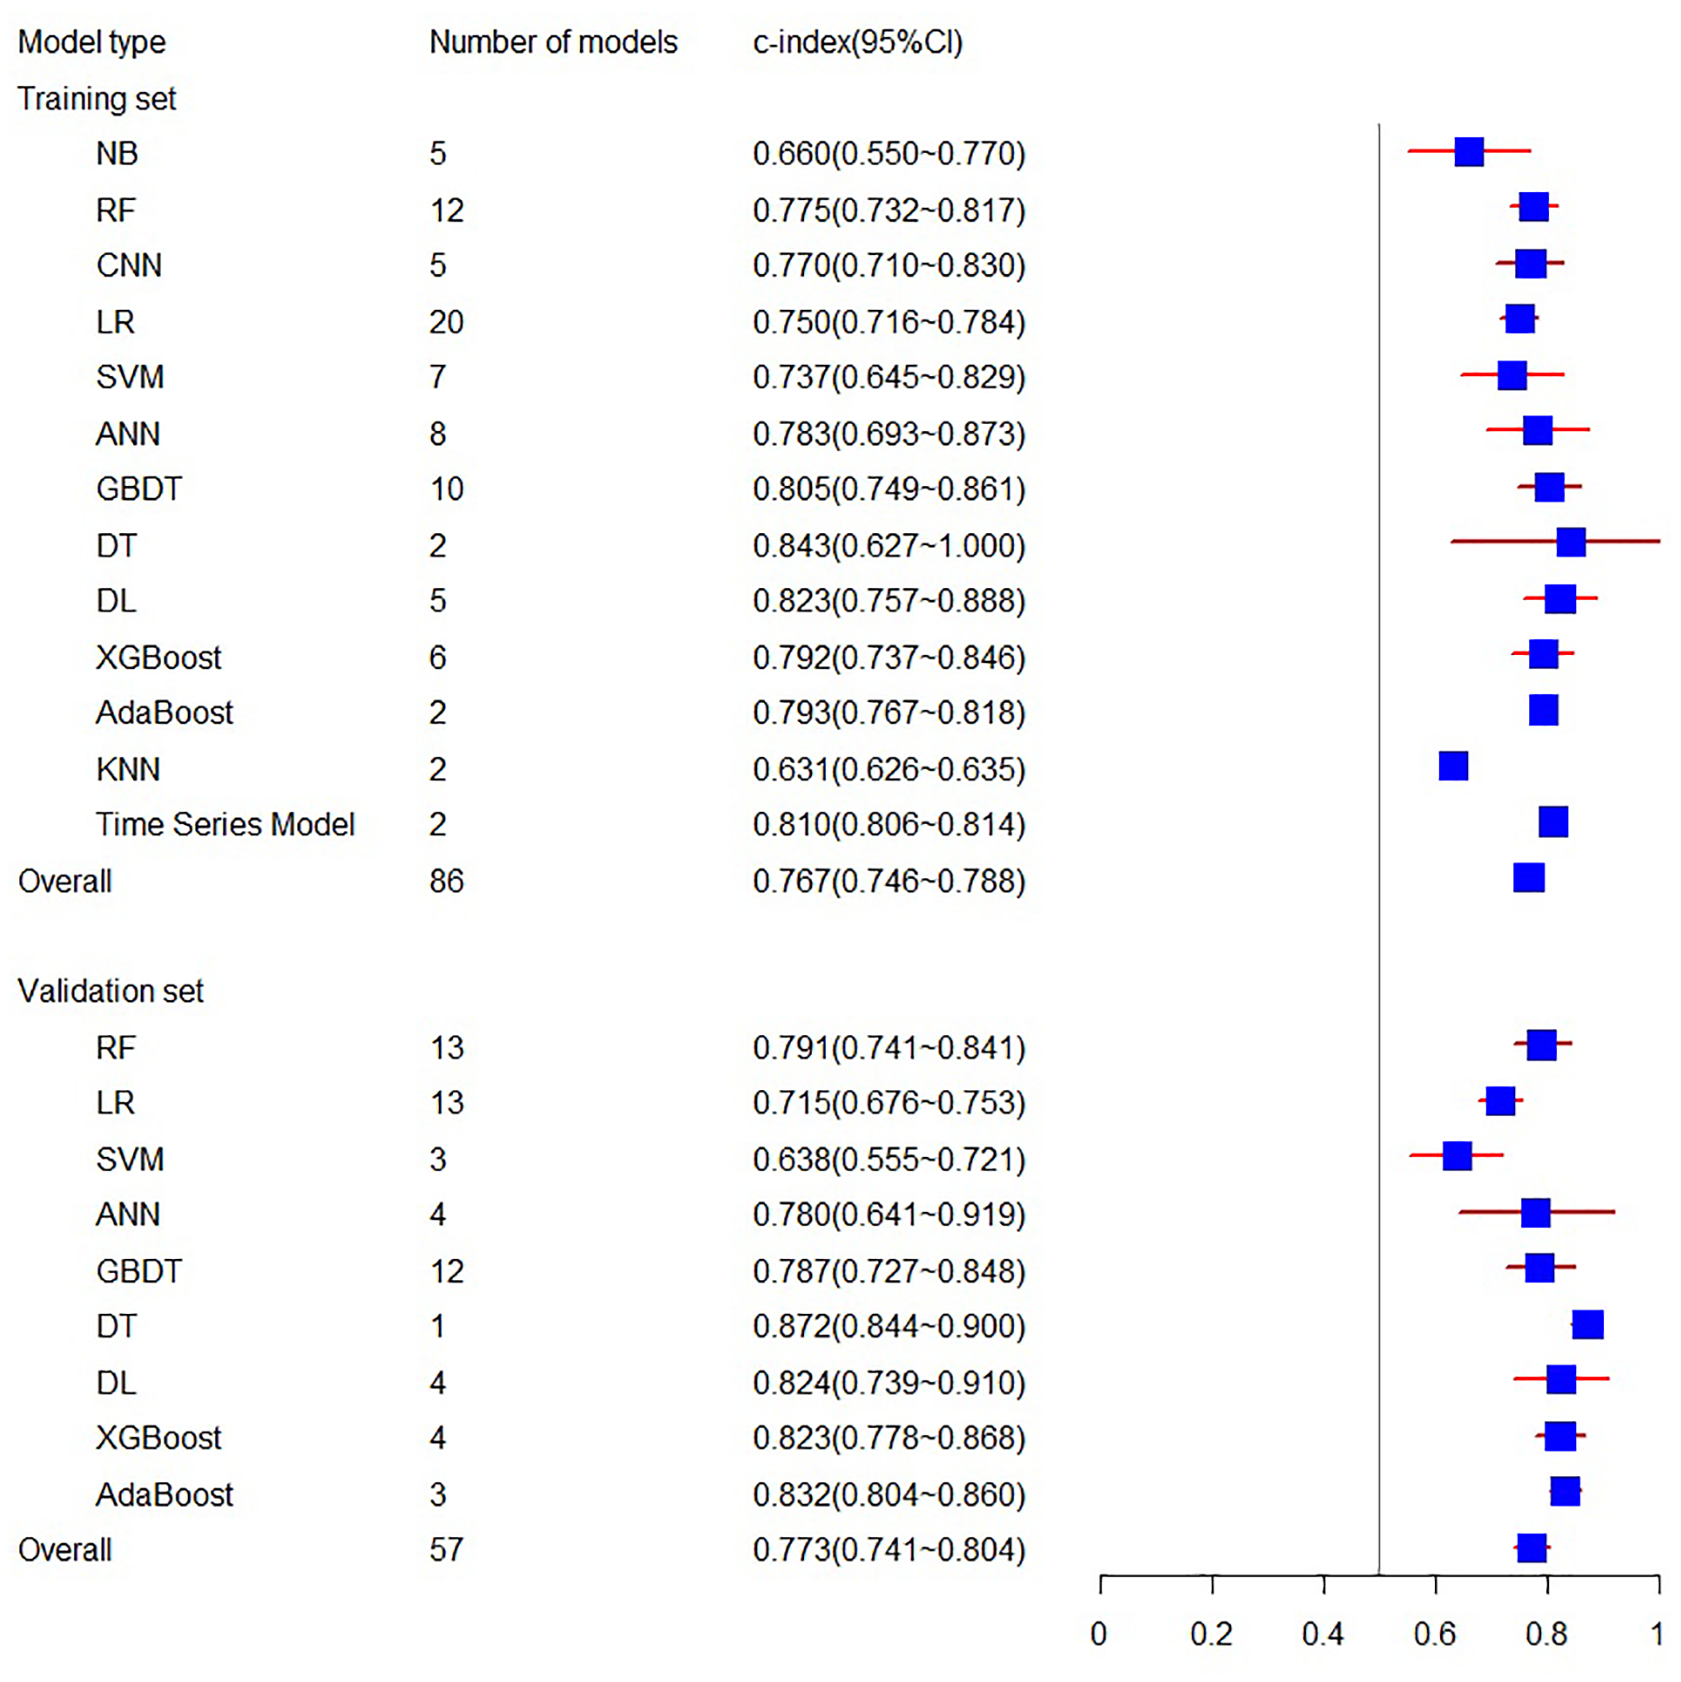
The systematic review included 29 eligible machine learning models, totaling 86 Models, with 13 types of models in the training set and 10 types of models in the validation set. In this meta-analysis, the training set related to C-index involves 16 articles, including 86 models, resulting in a final combined result of 0.767 (95% CI [0.746, 0.788]), while the validation set related to C-index involves 27 articles, including 57 models, with the combined result of 0.773 (95% CI [0.741, 0.804]) (see Fig. 3). Among the individual models included, the training set encompassed five NB, 12 RF, five CNN, 20 LR, seven SVM, eight ANN, 10 GBDT, two DT, five DL, six XGBoost, two AdaBoost, 2 KNN, and two Time Series Models. The validation set included 13 RF, 13 LR, three SVM, four ANN, 12 GBDT, one DT, four DL, four XGBoost, and three AdaBoost models. For a comprehensive overview of the C-index results for individual models and the overall C-index results, please refer to Table 2.
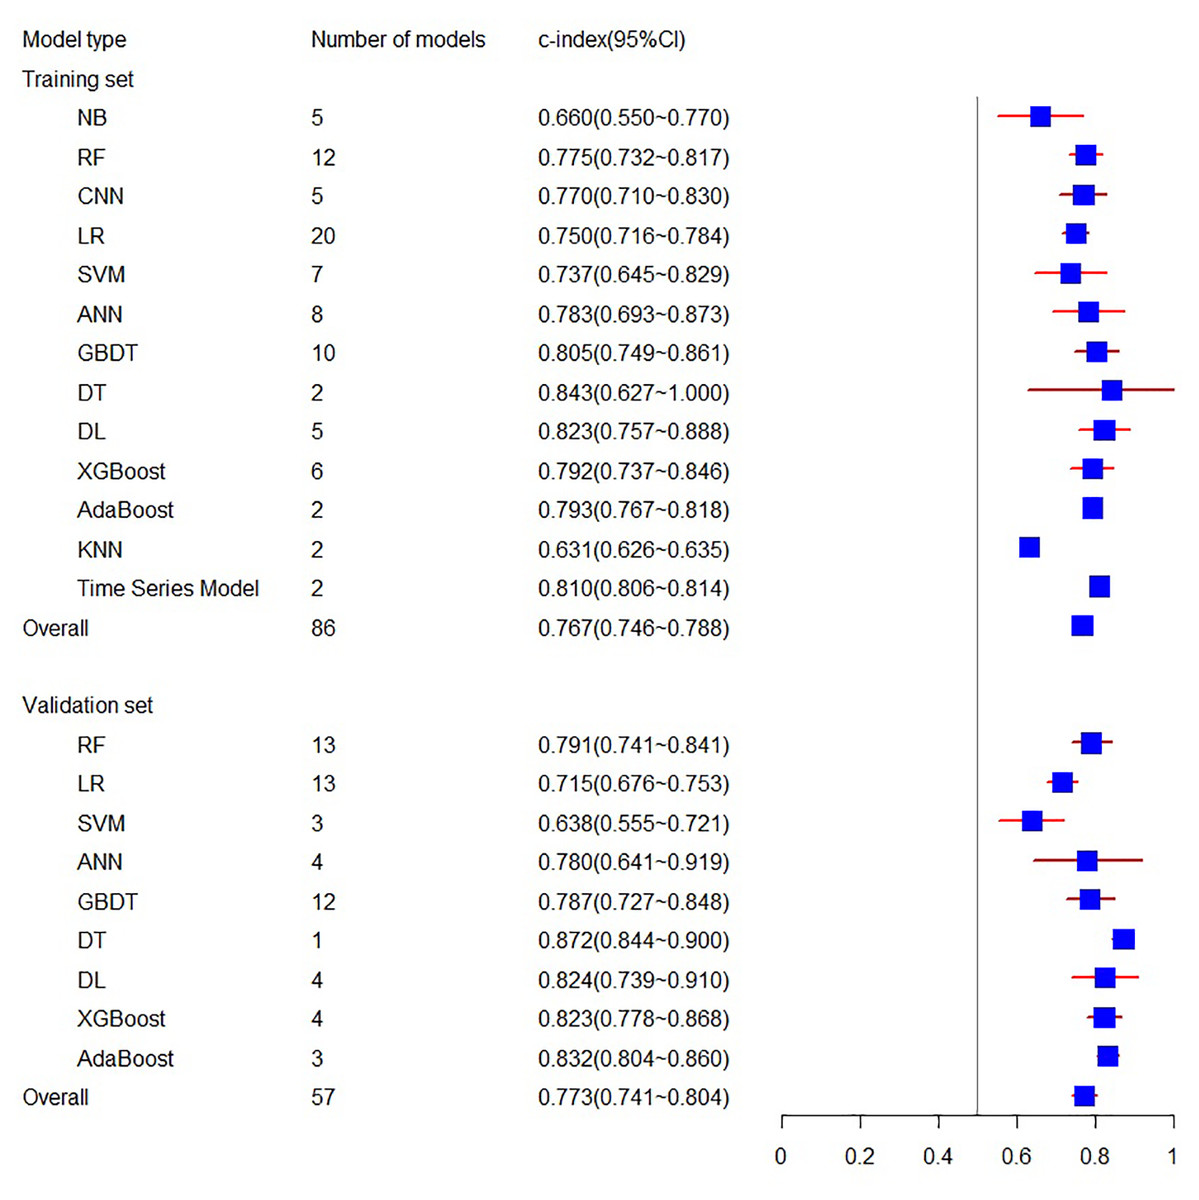
Figure 3: The C-index of the training set and verification set.
| Train | Test | |||
|---|---|---|---|---|
| Number | cindex (95% CI) | Number | cindex (95% CI) | |
| Model | ||||
| NB | 5 | 0.660 (0.550∼0.770) | ||
| RF | 12 | 0.775 (0.732∼0.817) | 13 | 0.791 (0.741∼0.841) |
| CNN | 5 | 0.770 (0.710∼0.830) | ||
| LR | 20 | 0.750 (0.716∼0.784) | 13 | 0.715 (0.676∼0.753) |
| SVM | 7 | 0.737 (0.645∼0.829) | 3 | 0.638 (0.555-0.721) |
| ANN | 8 | 0.783 (0.693∼0.873) | 4 | 0.780 (0.641∼0.919) |
| GBDT | 10 | 0.805 (0.749∼0.861) | 12 | 0.787 (0.727∼0.848) |
| DT | 2 | 0.843 (0.627∼1.000) | 1 | 0.872 (0.844∼0.900) |
| DL | 5 | 0.823 (0.757∼0.888) | 4 | 0.824 (0.739–0.910) |
| XGBoost | 6 | 0.792 (0.737∼0.846) | 4 | 0.823 (0.778∼0.868) |
| AdaBoost | 2 | 0.793 (0.767∼0.818) | 3 | 0.832 (0.804∼0.860) |
| KNN | 2 | 0.631 (0.626–0.635) | ||
| Time Series Model | 2 | 0.810 (0.806∼0.814) | ||
| Overrall | 86 | 0.767 (0.746∼0.788) | 57 | 0.773 (0.741∼0.804) |
Sensitivity and specificity
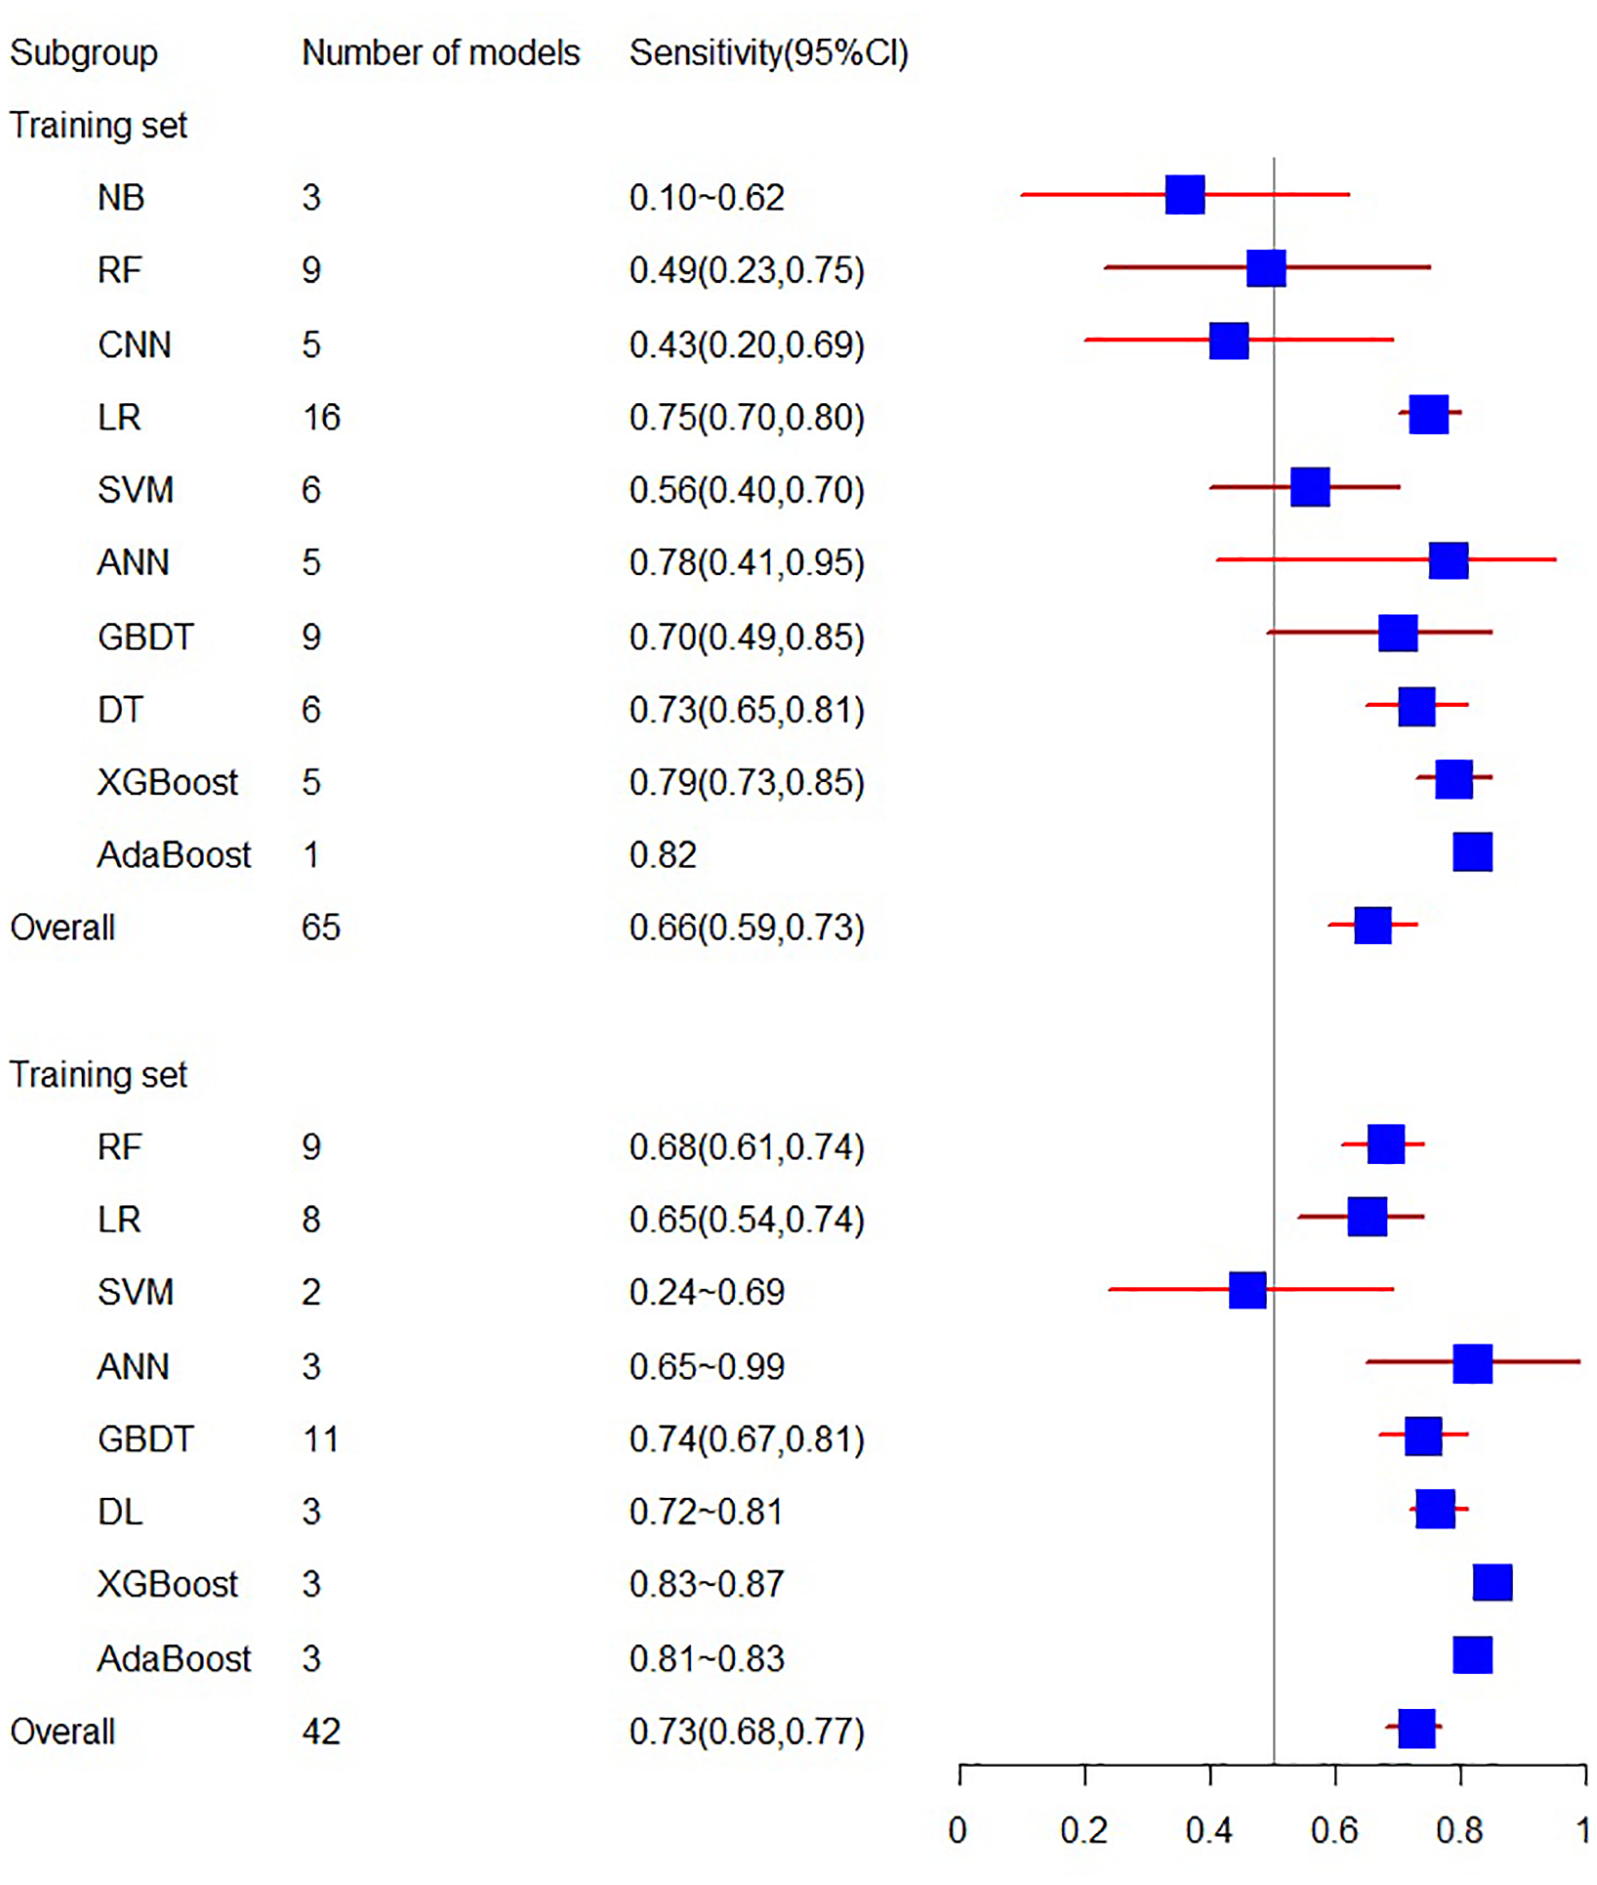
The training set related to sensitivity encompasses 18 articles, with a sensitivity of 0.66 (95% CI [0.59, 0.73]). In contrast, the sensitivity related to the validation set involves 10 articles, resulting in a sensitivity of 0.73 (95% CI [0.68, 0.77]).
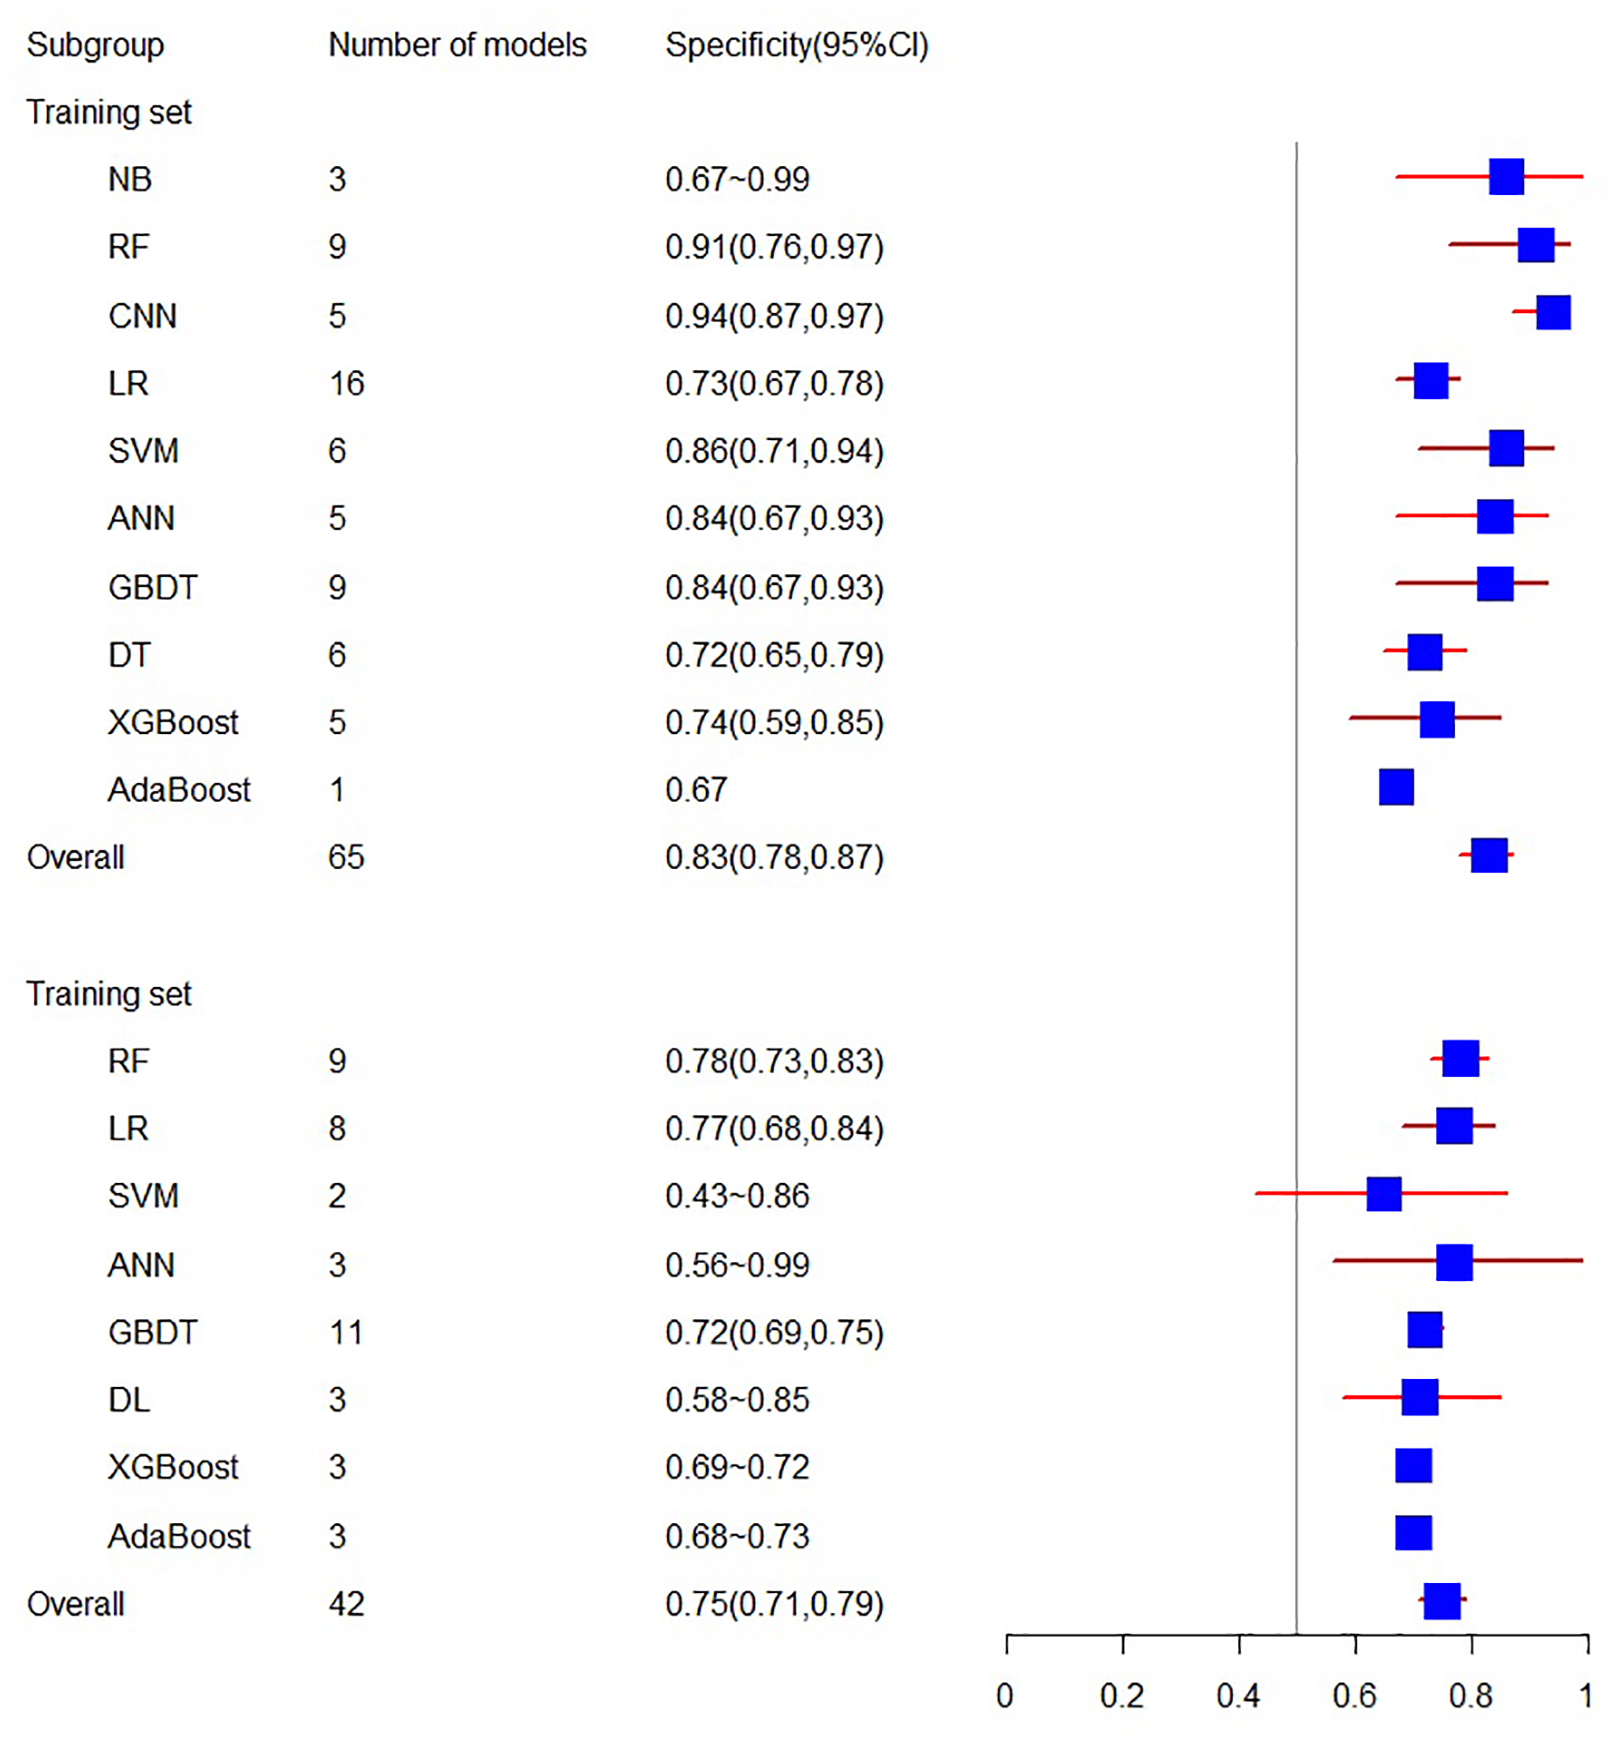
As for specificity, the training set consists of 18 articles with a specificity of 0.83 (95% CI [0.78, 0.87]), while the validation set related to specificity includes 10 articles, yielding a specificity of 0.75 (95% CI [0.71, 0.79]) (see Figs. 4 and 5).
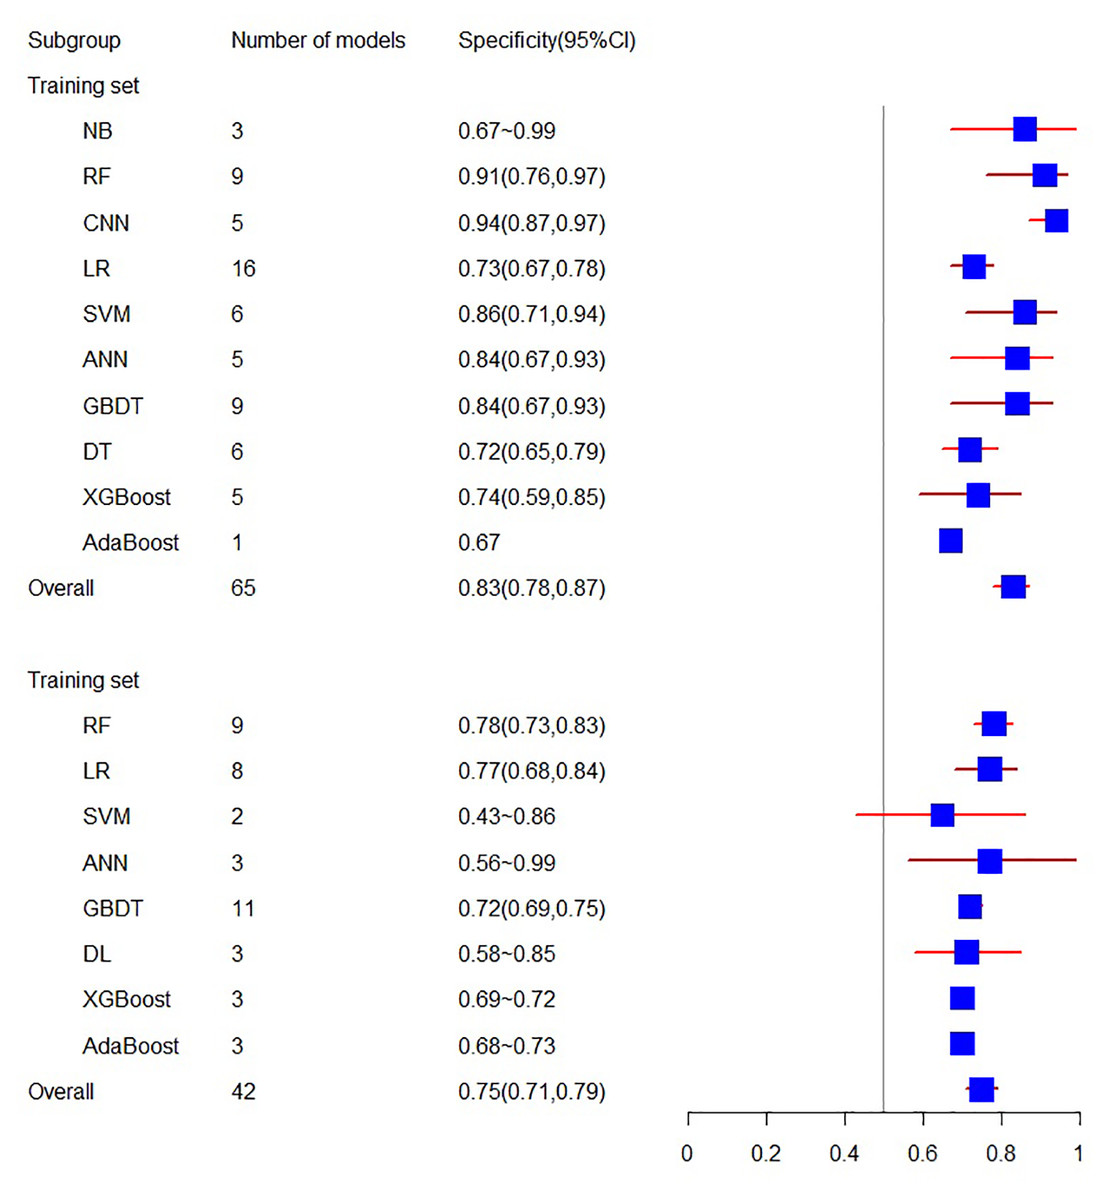
Figure 4: The sensitivity of the training set and verification set.
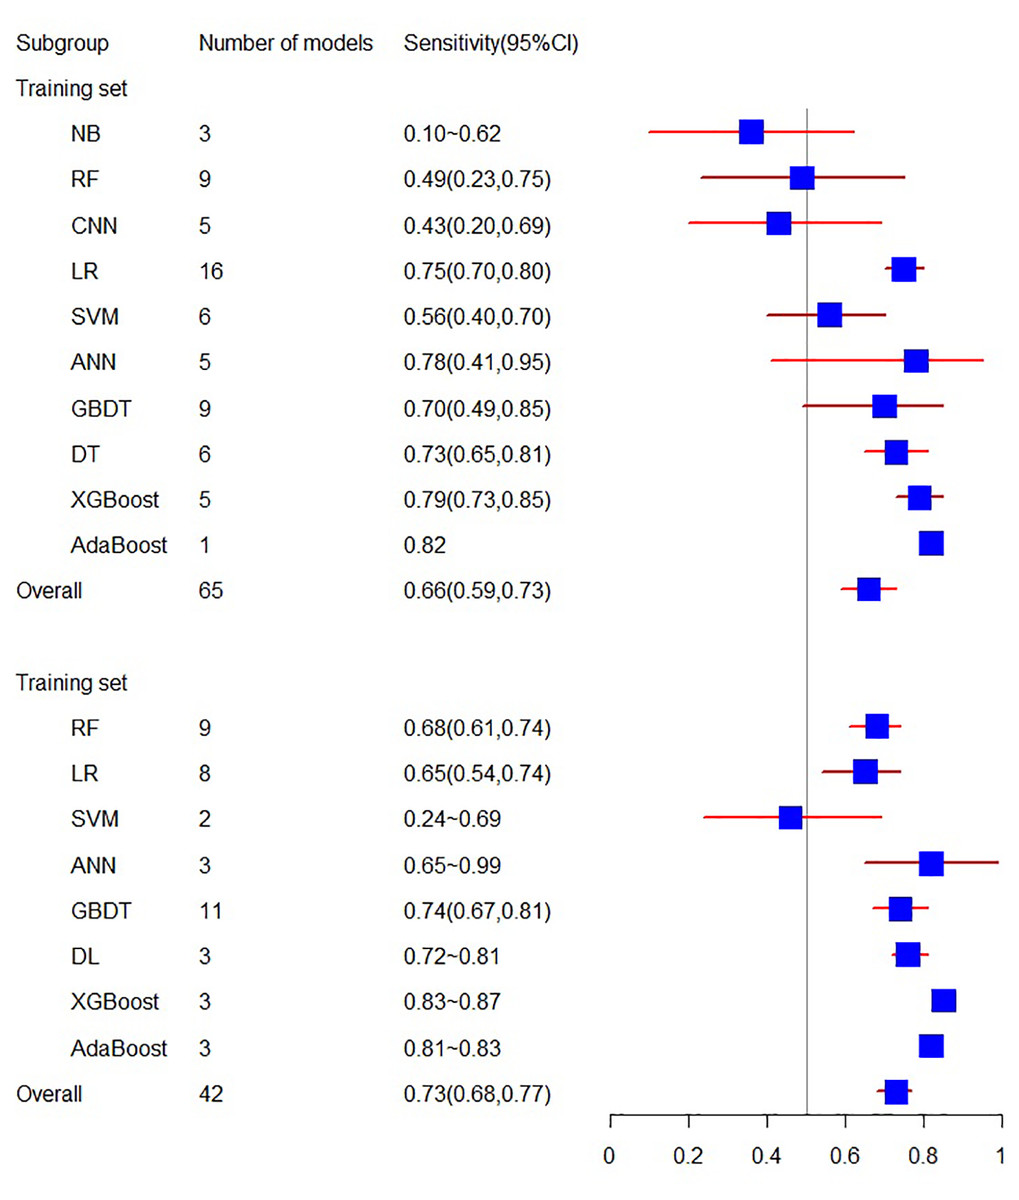
Figure 5: The specificity of the training set and verification set.
Discussion
To our knowledge, this study represents the first systematic review focusing on the utilization of machine learning for predicting the risk of AKI in ICU patients. Our investigation incorporated 10 distinct models, including NB, RF, CNN, LR, SVM, ANN, GBDT, DT, DL, XGBoost, AdaBoost, KNN, and Time Series Models, sourced from a pool of 29 studies. Upon conducting a comprehensive analysis, we observed that each individual model consistently demonstrated moderate to excellent performance. Moreover, the overall predictive capability also revealed excellence. Consequently, our research findings underscore the optimal practical value of employing machine learning-based methods in identifying AKI patients within the ICU setting. These methods can serve as a promising application avenue in this domain, offering substantial potential for improved prediction and patient care.
At the moment, machine learning is used to predict kidney disease and evaluate acute kidney injury (Alfieri et al., 2021; Yue et al., 2022). Additionally, there has been some meta-analysis and investigation of the application of machine learning in the prediction of acute renal injury and perioperative acute renal injury, with positive results (Song et al., 2021; Zhang et al., 2022). At the same time, machine learning has been applied to numerous studies involving ICU population (Gottlieb et al., 2022). However, there has been a notable absence of relevant meta-analyses to provide a more evidence-based foundation. Therefore, our research addresses this gap. Based on our findings, machine learning demonstrates excellent predictive capabilities in ICU patients with acute renal injury, further highlighting its potential in improving patient care and outcomes.
This represents the inaugural utilization of a meta-analysis to assess the application of machine learning in diagnosing acute renal injury, potentially advancing the pursuit of precision treatment for this condition. Additionally, following the confirmation of feasibility, this study underscores the suitability of machine learning as a diagnostic method for patients.
Undoubtedly, our study is not without its limitations. Firstly, despite our efforts to conduct a thorough search, the scope of our included literature remains limited, possibly due to our focus on English-language publications. Secondly, the inherent diversity among the included models has led to unavoidable heterogeneity. The variations in models utilized and the inclusion of different variables in these models may account for some of the sources of heterogeneity observed in our study.
Conclusion
The findings of this study underscore the effectiveness of the included prediction models in accurately forecasting the incidence of acute renal injury. These models can serve as a foundation for establishing predictive models, aiding in the development of effective preoperative diagnostic strategies, and identifying key factors that contribute to the creation of an optimal predictive model. At the same time, we anticipate the advancement of even more precise models in the future. We also eagerly anticipate the incorporation of larger sample sizes and multicenter studies in our future research endeavors, enabling a more in-depth exploration of the precise diagnostic efficacy of AKI across various models and types of predictive factors.