
The prevalence of clarithromycin-resistant Helicobacter pylori isolates: a systematic review and meta-analysis
- Published
- Accepted
- Received
- Academic Editor
- Bernardo Franco
- Subject Areas
- Microbiology, Infectious Diseases
- Keywords
- Clarithromycin, Meta-analysis, Antibiotic resistance, Helicobacter pylori
- Copyright
- © 2023 Sholeh et al.
- Licence
- This is an open access article distributed under the terms of the Creative Commons Attribution License, which permits unrestricted use, distribution, reproduction and adaptation in any medium and for any purpose provided that it is properly attributed. For attribution, the original author(s), title, publication source (PeerJ) and either DOI or URL of the article must be cited.
- Cite this article
- 2023. The prevalence of clarithromycin-resistant Helicobacter pylori isolates: a systematic review and meta-analysis. PeerJ 11:e15121 https://doi.org/10.7717/peerj.15121
Abstract
Background
Knowledge of global clarithromycin (CLA)-resistant rates of Helicobacter pylori (H. pylori) is crucial for decision of the most appropriate eradication therapies with good clinical outcomes. Therefore, this review and meta-analysis aimed to evaluate the global prevalence of the CLA resistance in H. pylori to provide some guidance for selecting the first-line antibiotics.
Method
A comprehensive search was performed for relevant literature until April 2021 in PubMed, Embase, and Web of Science databases. Freeman-Tukey double arcsine transformation was performed to estimate the weighted pooled prevalence of resistance.
Results
The meta-analysis included 248 articles. The prevalence of CLA-resistant H. pylori was 27.53% (95% CI [25.41–29.69]). The heterogeneity between reports was significant (I2 = 97.80%, P < 0.01). The resistance rate increased from 24.28% in 2010–2017 to 32.14% in 2018–2021 (P < 0.01). Iran, with 38 articles, has the most report. Nevertheless, Switzerland, Portugal, and Israel had the highest resistance rates (67.16%, 48.11%, and 46.12%, respectively). The heterogeneity between the continents and the antimicrobial susceptibility methods also interpreted standard guidelines and breakpoints was insignificant (P > 0.05).
Conclusion
Overall CLA resistance rate was 27.53%, worldwide. The difference in CLA resistance rate among the included studies can be due to several reasons such as differences in antibiotic prescription rates in various geographic areas, use of different breakpoints or inaccurate criteria in performed studies, and the emergence of multidrug-resistant (MDR) strains.
Introduction
Helicobacter pylori is one of the most successful human pathogens that affects approximately 50% of the population worldwide. In developing countries 70% to 90% of the population are infected by this bacterium (Arenas et al., 2019; Kocsmár et al., 2021). H. pylori infection is related to many gastric diseases, such as peptic ulcers, chronic gastritis, uninvestigated and functional dyspepsia and mucosa-associated lymphoid tissue lymphoma, and even increases the risk of gastric cancer (Savoldi et al., 2018). As for the high prevalence of the bacterium and its related diseases, proper treatment is very important. Today, standard treatment is a three-stage drug that consists of an acid neutralizer and two antibiotics, clarithromycin (CLA), and amoxicillin or metronidazole for 14 days (Hosseini et al., 2021).
However, treatment is difficult because the bacterium quickly develops resistance to the few antibiotics known to be effective (Park et al., 2016). The World Health Organization (WHO) has classified it among the 12 most resistant bacteria in the world (Essaidi et al., 2022). The increasing failure rate of eradication treatment due to the appearance of resistant H. pylori strains contributes to the worldwide prevalence of this infection and subsequent inflammatory and neoplastic disorders. Unfortunately, nowadays, the success of this treatment is less than 80% worldwide (Kocsmár et al., 2021; Hussein, Al-Ouqaili & Majeed, 2022).
CLA has been emerged as the basis for H. pylori treatment in combined therapy because of small effect on gastric acidity, its low minimal inhibitory concentration, and relatively good mucosal diffusion (Marques et al., 2020; Nishizawa & Suzuki, 2014). Due to extensive usage of CLA in some geographical regions, global prevalence rate of CLA resistance is increasing (Zou et al., 2020). In developing countries, CLA resistance and frequency of re-infection are factors that contribute to high worldwide prevalence of H. pylori infection and subsequent inflammatory and neoplastic disorders (Alarcón-Millán et al., 2016). In most European countries, as well as the rest of the world, the prevalence of CLA resistance has reached 20%. With rare exceptions, it is no longer recommended to include CLA in empirical treatment in regions where primary resistance to this antibiotic is 20% (Alarcón-Millán et al., 2016; Morilla et al., 2019).
Knowledge of global CLA-resistant rates of H. pylori is crucial for decision of the most appropriate eradication therapies with good clinical outcomes. Therefore, the aim of current review and meta-analysis is to evaluation of the global prevalence of the CLA resistance in H. pylori.
Method
Search strategy
A comprehensive search was conducted by two researchers in the online databases PubMed, Embase, and Web of Science until April 2021, using relevant keywords such as clarithromycin, antibiotic resistance, and H. pylori, as well as related MeSH terms (see Supplemental File 1 for the search syntax). The search syntax is available in Table 1.
| First author (Reference) | Country | Enrollment time | Published year | Type of study | N. patients | Mean age | N. HP | N. Clarithromycin-resistant | AST method | Breakpoint |
|---|---|---|---|---|---|---|---|---|---|---|
| Horie et al. (2020) | Japan | 2005–2018 | 2020 | RET | 5,249 | 58.3 | 1300 | 426 | MIC | 1 |
| Haddadi et al. (2020) | Iran | 2020 | CS | 280 | 46 | 128 | 3 | DD | CLSI 2015 21 |
|
| Eisig et al. (2011) | Brazil | 2011 | PCS | 54 | 46.6 | 39 | 3 | MIC | 1 | |
| Aftab et al. (2016) | Bangladesh | 2014–2014 | 2015 | CS | 133 | 35.2 | 56 | 22 | MIC | 0.25 |
| Ortiz et al. (2019) | Honduras | 2013–2013 | 2019 | CS | 189 | 54 | 116 | 13 | MIC | 0.5 |
| Silva et al. (2018) | Portugal | 2013–2017 | 2018 | PCS | 74 | 14 | 58 | 7 | MIC | 1 |
| Almeida et al. (2014) | Portugal | 2009–2013 | 2014 | PCS | 180 | 43.4 | 180 | 90 | MIC | 1 |
| Ilie et al. (2011) | Romania | 2011 | CS | 100 | Range: 19–80 | 70 | 22 | DD | >20 CLSI 2010 |
|
| Vécsei et al. (2011) | Austria | 2007–2009 | 2011 | RET | 96 | 10.8 | 96 | 16 | MIC | 1 |
| Ranjbar & Chehelgerdi (2018) | Iran | 2016–2017 | 2018 | CS | 700 | Range: 3–72 | 526 | 335 | DD | 21 |
| Hamza et al. (2018) | Egypt | 2018 | CS | 150 | 20 | 12 | DD | 21 | ||
| Gong et al. (2020) | South Korea | 2017–2018 | 2020 | RET | 13 | 46 | 38 | MIC | 0.5 | |
| Wang et al. (2020) | China | 2018–2019 | 2020 | CS | 124 | 124 | 44 | MIC | 0.5 | |
| Su et al. (2022) | Taiwan | 2009–2019 | 2021 | RET | 87 | 13.5 | 65 | 15 | MIC | 1 |
| Sugimoto et al. (2017) | Japan | 2011–2015 | 2016 | RET | 111 | 55.2 | 111 | 90 | MIC | 1 |
| Abadi et al. (2011) | Iran | 2009–2009 | 2011 | CS | 210 | 40.7 | 197 | 89 | DD | 30 |
| Teh et al. (2014) | Malaysia | 2014 | CS | 110 | 102 | 7 | MIC | 1 | ||
| Peng et al. (2017) | China | 2013–2014 | 2017 | CS | 178 | 41.6 | 78 | 38 | MIC | 1 |
| Hashemi et al. (2019) | Iran | 2015–2016 | 2019 | CS | 150 | 157 | 38 | MIC | 1 | |
| Lauener et al. (2019) | Switzerland | 2013–2017 | 2019 | CS | 140 | 140 | 96 | MIC | 1 | |
| Domanovich-Asor et al. (2020) | Israel | 2015–2019 | 2020 | CS | 48 | 48 | 26 | MIC | 1 | |
| Wu et al. (2015) | Taiwan | 2010–2014 | 2015 | RET | 137 | 137 | 95 | MIC | 1 | |
| Vala et al. (2016) | Iran | 2011–2012 | 2016 | CS | 80 | 20 | 4 | MIC | 0.5 | |
| Omar et al. (2014) | Australia | 2014 | CS | 11 | 46.8 | 11 | 8 | MIC | 1 | |
| Vilaichone et al. (2016) | Thailand | 2013–2013 | 2016 | CS | 291 | 46.6 | 124 | 7 | MIC | 0.5 |
| Lee et al. (2014) | South Korea | 2003–2013 | 2014 | PCS | 2,202 | 52.9 | 475 | 147 | MIC | 1 |
| Lee et al. (2019) | South Korea | 2014–2018 | 2018 | PCS | 85 | 55.2 | 74 | 24 | MIC | 1 |
| Goudarzi et al. (2016) | Iran | 2014–2014 | 2016 | CS | 65 | 42 | 65 | 28 | MIC | 1 |
| Karpinski et al. (2015) | Poland | 1998–1999 2013–2014 |
2015 | CS | 108 | 108 | 9 | MIC | 1 | |
| Miyata et al. (2021) | Japan | 2007–2018 | 2020 | CS | 119 | 12 | 45 | 26 | MIC | 1 |
| Palmitessa et al. (2020) | Italy | 2017–2018 | 2020 | CS | 224 | 48.6 | 92 | 49 | MIC | 0.5 |
| Hung et al. (2021) | Taiwan | 2016–2019 | 2021 | RET | 197 | 54.8 | 62 | 9 | MIC | 1 |
| Miftahussurur et al. (2016) | Japan | 2012–2012 | 2016 | CS | 146 | 42.2 | 42 | 9 | MIC | 0.25 |
| Siddiqui et al. (2016) | Pakistan | 2008–2013 | 2016 | CS | 889 | 35.6 | 92 | 5 | MIC | 0.5 |
| Sugimoto et al. (2014) | Japan | 2009–2013 | 2014 | CS | 153 | 153 | 64 | MIC | 1 | |
| Jolaiya et al. (2020) | Nigeria | 2020 | CS | 492 | 104 | 41 | MIC | 0.5 | ||
| Pandya et al. (2014) | India | 2008–2011 | 2014 | CS | 125 | 80 | 47 | DD | 30 | |
| Lehours, Siffré & Mégraud (2011) | France | 2009–2009 | 2011 | CS | 127 | 43 | 26 | MIC | 0.5 | |
| Sun et al. (2018) | China | 2018 | CS | 49 | Range: 27–76 | 43 | 9 | MIC | 0.75 | |
| Dekhnich et al. (2018) | Russia | 2009–2017 | 2018 | CS | 783 | 51.8 | 276 | 16 | MIC | 0.5 |
| Sugimoto et al. (2020) | Japan | 2015–2019 | 2020 | RET | 307 | 62.3 | 307 | 102 | MIC | 1 |
| Siavoshi, Saniee & Malekzadeh (2018) | Iran | 2018 | CS | 450 | 44.1 | 104 | 37 | MIC | 2 | |
| Szadkowski, Zemlak & Muszynski (2018) | Poland | 2005–2015 | 2018 | CS | 154 | 55 | 15 | DD | 21 | |
| Costa, Soares & Goncalves (2017) | Portugal | 2012–2016 | 2017 | RET | 42 | 48.9 | 42 | 36 | DD | 17 |
| Aguilera-Correa et al. (2017) | Spain | 2016 | CS | 136 | 84 | 48 | MIC | 0.5 | ||
| Akar et al. (2021) | Turkey | 2018–2019 | 2021 | CS | 422 | 50 | 133 | 25 | MIC | 0.5 |
| Yula et al. (2013) | Turkey | 2010–2011 | 2012 | CS | 110 | 41.4 | 79 | 7 | MIC | 1 |
| Zhang et al. (2019) | China | 2015–2016 | 2018 | CS | 150 | 149 | 104 | MIC | 1 | |
| Macin et al. (2015) | Turkey | 2006–2012 | 2015 | CS | 311 | Range: 5–19 | 93 | 28 | MIC | 1 |
| Auttajaroon et al. (2019) | Thailand | 2017–2017 | 2019 | CS | 93 | 54.5 | 70 | 9 | MIC | 0.5 |
| Eghbali et al. (2016) | Iran | 2012–2013 | 2016 | CS | 89 | 53.6 | 89 | 5 | MIC | 1 |
| Wu et al. (2014) | Taiwan | 2014 | CS | 231 | 43 | 5 | MIC | 1 | ||
| Kocazeybek et al. (2019) | Turkey | 2014–2017 | 2019 | CS | 63 | 47.08 | 63 | 24 | MIC | 1 |
| Egli et al. (2020) | Switzerland | 2013–2017 | 2020 | CS | 76 | 76 | 49 | MIC | 1 | |
| Khani, Talebi Bezmin Abadi & Mohabati Mobarez (2019) | Iran | 2017–2018 | 2019 | CS | 81 | 56.8 | 61 | 13 | MIC | 0.5 |
| Morimoto et al. (2015) | Japan | 2014 | RET | 135 | 62.3 | 135 | 35 | MIC | 1 | |
| Alarcón-Millán et al. (2016) | Mexico | 2016 | CS | 144 | 48.3 | 45 | 8 | DD | 18 | |
| Tamayo et al. (2017) | Spain | 2013–2015 | 2017 | CS | 6,228 | 1986 | 349 | MIC | 1 | |
| Yoon et al. (2014) | South Korea | 2005–2010 | 2014 | RET | 204 | 52.5 | 212 | 18 | MIC | 1 |
| Miftahussurur et al. (2017) | Dominican | 2017 | CS | 158 | 47.1 | 64 | 2 | MIC | 8 | |
| Mohammad et al. (2011) | Iran | 2007–2007 | 2011 | CS | 263 | 84 | 19 | MIC | 1 | |
| Ha et al. (2019) | Vietnam | 2012–2017 | 2018 | CS | 185 | 42.3 | 104 | 56 | MIC | 1 |
| Tanih, Ndip & Ndip (2011) | South Africa | 2011 | CS | 254 | 44.5 | 200 | 40 | MIC | 1 | |
| Yeganeh et al. (2019) | Israel | 2016–2016 | 2019 | PCS | 218 | 42 | 218 | 96 | MIC | 1 |
| Liu et al. (2019) | China | 2010–2017 | 2019 | RET | 1,463 | 1463 | 296 | MIC | 0.5 | |
| Zhu et al. (2013) | China | 2002–2006 | 2012 | CS | 365 | 365 | 42 | MIC | 1 | |
| Farzi et al. (2019) | Iran | 2014–2015 | 2018 | CS | 97 | Ranging 10–70 | 40 | 14 | MIC | 0.25 |
| Abdollahi et al. (2019) | Iran | 2017–2018 | 2019 | CS | 191 | 38.2 | 63 | 20 | DD | 21 |
| Lee et al. (2019) | South Korea | 2015–2018 | 2018 | CS | 1,422 | 140 | 43 | MIC | 0.5 | |
| De Francesco et al. (2014) | Italy | 2011–2012 | 2014 | CS | 82 | 82 | 42 | MIC | 0.5 | |
| Seo et al. (2013) | South Korea | 1990–1994 2005–2009 |
2013 | CS | 91 | 11.8 | 91 | 10 | MIC | 1 |
| Kouitcheu Mabeku et al. (2019) | Cameroon | 2013–2015 | 2019 | CS | 140 | 140 | 19 | DD | 21 | |
| Yin et al. (2020) | China | 2016–2016 | 2016 | CS | 267 | 9.4 | 169 | 57 | MIC | 1 |
| Chen et al. (2018) | China | 2018 | CS | 12 | 12 | 6 | MIC | 1 | ||
| Kakiuchi et al. (2020) | Japan | 2018–2018 | 2020 | CS | 71 | 14.7 years | 23 | 7 | MIC | 0.5 |
| Cuadrado-Lavín et al. (2012) | Spain | 2010–2010 | 2011 | CS | 76 | 68 | 10 | MIC | 2 | |
| Gehlot et al. (2016) | India | 2011–2014 | 2015 | CS | 68 | Range: 18–86 | 68 | 8 | MIC | 0.5 |
| Ogata, Gales & Kawakami (2014) | Brazil | 2008–2009 | 2014 | CS | 77 | 11.1 | 77 | 16 | MIC | 1 |
| Eng et al. (2015) | Canada | 2012–2013 | 2015 | CS | 301 | 20 | 8 | MIC | 0.5 | |
| Alarcón et al. (2017) | Spain | 2007–2014 | 2017 | CS | 824 | 26 | 824 | 422 | MIC | 0.5 |
| Akhtereeva et al. (2018) | Russia | 2011–2013 | 2018 | CS | 76 | 13.6 | 30 | 9 | DD | 30 |
| Selgrad et al. (2013) | Germany | 2005–2012 | 2013 | RET | 436 | 51.7 | 159 | 12 | MIC | 1 |
| Gunnarsdottir et al. (2017) | Iceland | 2012–2013 | 2017 | PRO | 613 | 57 | 105 | 9 | MIC | 1 |
| Mahmoudi et al. (2017) | Iran | 2014–2015 | 2017 | CS | 90 | 9.4 | 32 | 7 | MIC | 1 |
| Shokrzadeh et al. (2011) | Iran | 2007–2008 | 2010 | CS | 92 | 45 ± 18 M 38 ± 14 F | 42 | 6 | MIC | 1 |
| Savari et al. (2010) | Iran | 2009–2009 | 2010 | CS | 191 | Range: 14–84 | 63 | 19 | DD | 21 |
| Shu et al. (2018) | China | 2012–2014 | 2018 | CS | 1,390 | 9.5 | 545 | 112 | MIC | 8 |
| Mosites et al. (2018) | USA | 2000–2016 | 2018 | CS | 763 | 52 | 800 | 238 | MIC | 1 |
| Parra-Sepúlveda et al. (2019) | Chile | 2005–2007 2015–2017 |
2019 | CS | 1,655 | 48.8 | 405 | 96 | DD | 21 |
| Fiorini et al. (2018) | Italy | 2010–2016 | 2018 | CS | 1,730 | 51.1 | 1424 | 114 | MIC | 0.5 |
| Shao et al. (2018) | China | 2013–2016 | 2017 | CS | 2,283 | 2283 | 519 | MIC | 1 | |
| Li et al. (2020) | China | 2019–2019 | 2021 | CS | 157 | 10.9 | 87 | 48 | MIC | 0.5 |
| Su et al. (2013) | China | 2010–2012 | 2013 | CS | 51,891 | 17731 | 3810 | MIC | 1 | |
| Hojsak et al. (2012) | Croatia | 2001–2010 | 2012 | RET | 2,313 | 12.9 | 168 | 20 | MIC | 1 |
| Hamidi et al. (2020) | Iran | 2017–2018 | 2020 | CS | 80 | 50.2 | 50 | 11 | MIC | 0.5 |
| An et al. (2013) | Korea | 2009–2012 | 2013 | RET | 165 | 165 | 20 | MIC | 1 | |
| Shiota et al. (2015) | USA | 2009–2013 | 2015 | CS | 656 | 128 | 6 | MIC | 1 | |
| Li et al. (2017) | China | 2009–2015 | 2017 | RET | 5,610 | 14 | 1746 | 286 | MIC | 1 |
| Bolor-Erdene et al. (2017) | Mongolia | 2011–2014 | 2017 | CS | 320 | 43.7 | 152 | 54 | MIC | 1 |
| Boehnke et al. (2017) | Peru | 2011–2013 | 2017 | CS | 109 | 76 | 27 | MIC | 0.5 | |
| Ahmad, Zakaria & Mohamed (2011) | Malaysia | 2004–2007 | 2011 | CS | 777 | 187 | 4 | MIC | 1 | |
| Rasheed et al. (2014) | USA | 2011–2012 | 2014 | CS | 93 | 47.4 | 46 | 22 | MIC | 1 |
| Guo et al. (2019) | China | 2016–2017 | 2018 | CS | 346 | Range: 1–15 | 22 | 8 | MIC | 1 |
| Jiang et al. (2021) | China | 2017–2019 | 2021 | CS | 1,533 | 1533 | 721 | MIC | 0.5 | |
| Butenko et al. (2017) | Slovenia | 2011–2014 | 2017 | RET | 107 | 12 | 104 | 25 | MIC | 8 |
| Tveit et al. (2011) | Alaska | 2000–2008 | 2011 | CS | 1,181 | 51 | 531 | 159 | MIC | 1 |
| Tuan et al. (2019) | Vietnam | 2019 | CS | 206 | 45.3 | 55 | 14 | MIC | 8 | |
| Maev et al. (2020) | Russia | 2015–2018 | 2020 | CS | 27 | 27 | 3 | MIC | 0.5 | |
| Figueroa et al. (2012) | Colombia | 2012 | CS | 203 | 40 | 146 | 29 | MIC | 1 | |
| Kim et al. (2011) | Korea | 2008–2008 | 2011 | CS | 99 | 54.6 | 99 | 26 | MIC | 1 |
| Adeniyi et al. (2012) | Nigeria | 2012 | CS | 52 | Range: 10–90 | 43 | 3 | DD | 30 | |
| Yao et al. (2019) | Taiwan | 2013–2014 | 2019 | RET | 719 | 61.2 | 41 | 14 | MIC | 1 |
| Honma et al. (2019) | Japan | 2012–2015 | 2018 | CS | 1,298 | 14 | 13 | 5 | MIC | 1 |
| Bayati et al. (2019) | Iran | 2014–2015 | 2019 | CS | 170 | Range: 30–75 | 55 | 27 | MIC | 0.5 |
| Pichon et al. (2020) | France | 2012–2014 | 2020 | CS | 3 | 33.3 | 189 | 1 | MIC | 0.5 |
| Tanabe et al. (2018) | Japan | 2013–2016 | 2018 | RET | 1,355 | 212 | 50 | MIC | 1 | |
| Karabiber et al. (2014) | Turkey. | 2014 | CS | 159 | 98 | 23 | DD | 30 | ||
| Saracino et al. (2020) | Italy | 2009–2019 | 2020 | NA | 3,178 | 52.3 | 1646 | 553 | MIC | 0.5 |
| Liang et al. (2020) | Taiwan | 2013–2019 | 2020 | RET | 1,369 | 54.0 ± 11.9 | 1369 | 226 | MIC | 1 |
| Khademi et al. (2014) | Iran | 2011–2012 | 2014 | CS | 130 | 30 | 4 | MIC | 1 | |
| Milani et al. (2012) | Iran | 2010–2011 | 2012 | CS | 395 | 35 ± 19 | 112 | 16 | MIC | 1 |
| Famouri et al. (2018) | Iran | 2015–2018 | 2018 | CS | 102 | 8.65 ± 3.88 | 48 | 17 | MIC | 2 |
| Bruce et al. (2019) | Alaska | 1998–2006 | 2019 | PRO | 362 | 260 | 74 | MIC | 1 | |
| Park et al. (2020) | Korea | 2017–2019 | 2020 | PRO | 174 | 70 | 20 | MIC | 0.5 | |
| Binh et al. (2013) | Vietnam | 2008–2008 | 2013 | CS | 103 | 44.8 | 103 | 34 | MIC | 1 |
| Keshavarz Azizi Raftar et al. (2015) | Iran | 2013 | CS | 246 | 45.78 ± 16.23 | 95 | 32 | MIC | 1 | |
| Ang et al. (2016) | Singapore | 2000–2014 | 2016 | RET | 708 | 708 | 97 | MIC | 1 | |
| Gościniak et al. (2014) | Poland | 2008–2011 | 2014 | CS | 165 | 165 | 50 | MIC | 1 | |
| Wang et al. (2019) | China | 1998–2017 | 2019 | CS | 454 | 50.74 ± 10.942 | 100 | 31 | MIC | 1 |
| Bai et al. (2015) | China | 2013–2013 | 2015 | CS | 181 | 44.9 | 181 | 56 | MIC | 0.5 |
| Mégraud et al. (2021) | France | 2014–2018 | 2020 | CS | 951 | 52.4 ± 15.7 | 741 | 157 | MIC | 0.5 |
| Sadeghifard et al. (2013) | Iran | 2009–2010 | 2013 | CS | 50 | 50 | 16 | DD | 20 | |
| Bedoya-Gómez et al. (2020) | Colombia | 2019 | PRO | 115 | 41.8 | 61 | 5 | MIC | 0.5 | |
| Miftahussurur et al. (2016) | Japan | 2012–2015 | 2016 | PRO | 849 | 49.25 | 77 | 7 | MIC | 0.25 |
| Erkut et al. (2020) | Turkey | 2010–2011 | 2020 | PRO | 344 | 39.3 | 104 | 29 | MIC | 1 |
| Zhang et al. (2018) | China | 2013 | 2018 | CS | 394 | 136 | 10 | MIC | 1 | |
| Tsay et al. (2012) | Taiwan | 2005–2009 | 2011 | RET | 233 | 55.7 | 32 | 2 | MIC | 1 |
| Mascellino et al. (2018) | Italy | 2017 | 2020 | RET | 80 | 59 | 80 | 28 | MIC | 0.5 |
| Khoury et al. (2017) | Israel | 2012–2015 | 2017 | RET | 107 | 64 | 26 | MIC | 0.5 | |
| Saracino et al. (2020) | Italy | 2016–2019 | 2020 | RET | 270 | 51.4 | 221 | 202 | MIC | 0.5 |
| Lin et al. (2020) | Taiwan | 2008–2017 | 2019 | RET | 490 | 54.5 | 228 | 33 | MIC | 1 |
| Alfizah et al. (2014) | Malaysia | 2004–2007 | 2014 | CS | 99 | 161 | 2 | MIC | 1 | |
| Fasciana et al. (2015) | Italy | 2015 | CS | 100 | 100 | 25 | MIC | 0.5 | ||
| Ayala et al. (2011) | Mexico | 2002–2004 | 2011 | CS/PRO | 460 | 90 | 9 | MIC | 2 | |
| Picoli et al. (2014) | Brazil | 2011–2012 | 2014 | CS | 342 | 54 | 6 | MIC | 1 | |
| Larsen et al. (2013) | Norway | 2008–2009 | 2012 | CS | NA | 102 | 6 | MIC | 0.5 | |
| Kumar et al. (2020) | USA | 2009–2019 | 2019 | RET | 109 | 65 | 39 | MIC | 0.5 | |
| Khademi et al. (2013) | Iran | 2011–2012 | 2013 | CS | 260 | 45.8 ± 17.8 | 78 | 12 | MIC | 1 |
| Peretz et al. (2014) | Israel | 2011– 2012 | 2014 | CS | 176 | 85 | 20 | MIC | 1 | |
| Chung et al. (2012) | Korea | 2004–2007 | 2011 | CS | 185 | 50.7 ± 14.4 | 185 | 20 | MIC | 1 |
| Ghotaslou et al. (2013) | Iran | 2013 | CS | 123 | 35 ± 18 | 123 | 21 | DD | 30 | |
| Kostamo et al. (2011) | Finland | 2000–2008 | 2010 | RET | 3,045 | 62 | 1037 | 83 | MIC | 1 |
| Demiray-Gürbüz et al. (2017) | Turkey | 2006–2011 | 2016 | CS | 234 | 43.8 ± 14.0 | 114 | 32 | MIC | 1 |
| Agudo et al. (2011) | USA | 2008 | 2011 | CS | 118 | 118 | 42 | MIC | 1 | |
| Matta, Zambrano & Pazos (2018) | Colombia | 2018 | CS | 409 | 74 | 34 | MIC | 1 | ||
| Song et al. (2014) | China | 2008–2012 | 2014 | PRO/CS | 600 | 42.5 ± 13.2 | 600 | 225 | MIC | 0.5 |
| Wüppenhorst et al. (2014) | Germany | 2001–2012 | 2014 | PRO | 1,651 | 1523 | 475 | MIC | 1 | |
| Shi, Jiang & Zhao (2016) | China | 2016 | CS | 328 | 328 | 78 | MIC | 1 | ||
| Talebi Bezmin Abadi et al. (2012) | Iran | 2009–2010 | 2011 | CS | 170 | 38.6 | 150 | 51 | MIC | 1 |
| Boyanova et al. (2017) | Bulgaria | 2011–2016 | 2017 | CS | 233 | 59.1 | 233 | 60 | MIC | 0.5 |
| Manfredi et al. (2015) | Italy | 2011–2012 | 2015 | CS | 66 | 9.8 | 46 | 12 | MIC | 4 |
| Morilla et al. (2019) | Spain | 2004–2016 | 2019 | RET | 3,426 | 55.7 ± 16.9 | 1439 | 278 | MIC | 0.5 |
| Vekens et al. (2013) | Belgium | 2009–2010 | 2013 | PRO | 507 | 48.8 | 180 | 24 | MIC | 1 |
| Maleknejad et al. (2015) | Iran | 2012–2014 | 2015 | CS | 169 | 7.30 ± 3.12 | 21 | 1 | DD | 30 |
| Oleastro et al. (2011) | Portugal | 2000–2009 | 2011 | PRO | 1,115 | 10.17 ± 4.03 | 1115 | 387 | MIC | 1 |
| Zhang et al. (2015) | China | 2009–2010 2013–2014 |
2015 | PRO/CS | 1,555 | 42.4 | 1321 | 648 | MIC | 0.5 |
| Dargiene et al. (2018) | Lithuania | 2013–2015 | 2017 | CS | 297 | 32.85 | 79 | 2 | MIC | 0.5 |
| Liu et al. (2011) | China | 2009–2010 | 2011 | CS | 120 | 10.0 ± 5.8 | 73 | 62 | MIC | 1 |
| Liu et al. (2018) | China | 2010–2016 | 2017 | PRO | 1,117 | 960 | 247 | MIC | 1 | |
| Tang et al. (2020) | China | 2017–2019 | 2020 | CS | 400 | 44.7 | 117 | 52 | MIC | 0.5 |
| Bachir et al. (2018) | Algeria | 2012–2015 | 2017 | CS | 200 | 151 | 38 | MIC | 0.5 | |
| Seck et al. (2013) | Senegal | 2007–2009 | 2013 | CS | 108 | 45.3 | 108 | 1 | MIC | 1 |
| Karczewska et al. (2011) | Poland | 2006–2008 | 2011 | CS | 115 | 115 | 39 | MIC | 1 | |
| Lee et al. (2019) | South Korea | 2003–2018 | 2019 | PRO | 740 | 56.3 | 740 | 280 | MIC | 1 |
| Raaf et al. (2017) | Algeria | 2015–2016 | 2017 | PRO | 147 | 43 | 16 | DD | 17 | |
| Hansomburana et al. (2012) | Thailand | 2006–2008 | 2012 | PRO | 200 | 52.8 | 82 | 11 | MIC | 1 |
| Mirzaei et al. (2013) | Iran | 2011–2011 | 2013 | CS | 110 | 34 | 48 | 7 | MIC | 1 |
| Lee et al. (2013) | Korea | 2003–2012 | 2013 | PRO | 433 | 55.53 | 433 | 127 | MIC | 1 |
| Shokrzadeh et al. (2015) | Iran | 2010–2011 | 2014 | CS | 197 | 46 | 111 | 29 | MIC | 1 |
| Oporto et al. (2019) | Chile | 2018 | 2019 | CS | 229 | 50.68 | 44 | 18 | MIC | 0.5 |
| Aumpan et al. (2020) | Thailand | 2019 | 2020 | CS | 58 | 43.8 | 14 | 4 | MIC | 0.5 |
| Vilaichone et al. (2020) | Thailand | 2010–2015 | 2020 | CS | 1,178 | 41.5 | 357 | 7 | MIC | 0.5 |
| Cerqueira et al. (2011) | Portugal | 2011 | CS | NA | 33 | 21 | MIC | 1 | ||
| Binyamin et al. (2017) | Israel | 2015–2016 | 2017 | CS | 85 | 54 | 34 | MIC | 1 | |
| Camorlinga-Ponce et al. (2021) | Chile | 1997–2017 | 2021 | CS | 167 | 50.72 | 167 | 15 | MIC | 0.5 |
| Biernat et al. (2020) | Poland | 2016–2019 | 2020 | RET | 108 | 12.5 | 91 | 28 | MIC | 0.5 |
| Trespalacios et al. (2013) | Colombia | 2009–2011 | 2013 | CS | 256 | 276 | 42 | MIC | 1 | |
| Lok et al. (2020) | China | 2018–2019 | 2020 | CS | 176 | 48.4. | 65 | 34 | MIC | 0.5 |
| Bahmaninejad et al. (2021) | Iran | 2020–2020 | 2021 | CS | 100 | 50 | 33 | MIC | 1 | |
| Draeger et al. (2015) | Germany | 2004–2013 | 2015 | RET | 481 | 481 | 409 | MIC | 1 | |
| Zerbetto De Palma et al. (2017) | Argentina | 2011–2013 | 2015 | CS | 52 | 52 | 14 | MIC | 0.5 | |
| Boyanova et al. (2012) | Bulgaria | 2004–2010 | 2012 | CS | 519 | 52.16 | 519 | 93 | MIC | 1 |
| Tshibangu-Kabamba et al. (2020) | Congo | 2017–2018 | 2020 | CS | 220 | 45.3 ± 15.3 | 102 | 24 | MIC | 0.5 |
| Okuda et al. (2017) | Japan | 1997–2013 | 2016 | RET | 332 | 11.6 ± 3.4 | 76 | 33 | MIC | 1 |
| Vilaichone et al. (2013) | Thailand | 2004–2012 | 2013 | CS | 3,964 | 53.3 | 400 | 15 | MIC | 0.5 |
| Zhang et al. (2020) | China | 2017–2019 | 2020 | CS | 238 | 238 | 84 | MIC | 0.5 | |
| Zhang et al. (2020) | China | 2012–2014 | 2020 | CS | 79 | 9.7 ± 2.8 | 79 | 29 | MIC | 1 |
| Mansour et al. (2016) | France | 2009–2009 | 2015 | PRO | 149 | 53.65 | 42 | 12 | MIC | 1 |
| Kuo et al. (2021) | Taiwan | 2017–2020 | 2021 | CS | 64 | 53.8 | 41 | 38 | MIC | 0.5 |
| Miendje Deyi et al. (2011) | Belgium | 1990–2009 | 2011 | CS | 9,430 | 29.3 | 9430 | 524 | MIC | 1 |
| Han et al. (2016) | China | 2015–2015 | 2016 | CS | 325 | 47.2 | 325 | 65 | MIC | 1 |
| Bińkowska et al. (2018) | Italy | 2008–2016 | 2018 | CS | 170 | 170 | 29 | MIC | 1 | |
| Bachir et al. (2018) | Algeria | 2014–2016 | 2018 | PRO | 270 | 212 | 53 | MIC | 0.5 | |
| Hanafiah et al. (2019) | Malaysia | 2014–2015 | 2019 | CS | 288 | 52.41 ± 16.44 | 59 | 21 | MIC | 1 |
| Vazirzadeh et al. (2020) | Iran | 2018–2018 | 2020 | CS | 165 | 50:3 ± 15:5 | 83 | 21 | MIC | 0.5 |
| Rezaei, Abadi & Mobarez (2020) | Iran | 2015–2018 | 2019 | CS | 200 | 54 | 73 | 17 | MIC | 0.5 |
| Yakoob et al. (2013) | Pakistan | 2008– 2010 | 2013 | CS | 120 | 41 ± 13 | 47 | 17 | MIC | 1 |
| Gehlot et al. (2016) | India | 2011–2013 | 2016 | CS | 483 | 43 | 68 | 8 | MIC | 0.5 |
| Boyanova et al. (2013) | Bulgaria | 2007– 2012 | 2013 | RET | 588 | 588 | 118 | MIC | 1 | |
| Boyanova et al. (2015) | Bulgaria | 2012–2014 | 2015 | CS | 53 | 50.7 | 53 | 9 | MIC | 0.5 |
| Otth et al. (2011) | Chile | 2010 | CS | 240 | 54.5 ± 15.7 | 88 | 8 | MIC | 2 | |
| McNulty et al. (2012) | Uk | 2009–2010 | 2012 | CS | 2,063 | 241 | 86 | MIC | 1 | |
| Wang et al. (2018) | China | 2013–2014 | 2018 | CS | NA | 100 | 13 | MIC | 0.5 | |
| Alavifard et al. (2021) | Iran | 2017–2019 | 2020 | CS | 82 | 49.7 ± 3.33 | 82 | 36 | MIC | 0.5 |
| Regnath et al. (2017) | Germany | 2002–2015 | 2016 | RET | 582 | 12 years | 608 | 75 | MIC | 0.5 |
| Lu et al. (2019) | Taiwan | 1998–2018 | 2019 | RET | 70 | 13.2 ± 3.2 | 70 | 16 | MIC | 1 |
| Di Giulio et al. (2016) | Italy | 2010–2014 | 2015 | CS | 115 | 181 | 131 | MIC | 0.5 | |
| Enany & Abdalla (2015) | Egypt | 2015 | CS | 150 | 107 | 6 | DD | 40 | ||
| Trespalacios et al. (2015) | Colombia | 2014 | CS | 127 | 107 | 42 | MIC | 1 | ||
| Gatta et al. (2018) | Italy | 2010–2015 | 2018 | RET | 1,682 | 1325 | 478 | MIC | 0.5 | |
| Goudarzi et al. (2016) | Iran | 2015–2015 | 2016 | CS | 154 | 110 | 28 | MIC | 1 | |
| Bayati et al. (2020) | Iran | 2019 | CS | 170 | 30 ± 75. | 55 | 27 | MIC | 0.5 | |
| Dang et al. (2020) | Vietnam | 2014–2016 | 2020 | CS | 153 | 38.3 ± 10.7 | 153 | 111 | MIC | 1 |
| Phan et al. (2015) | Vietnam | 2012–2014 | 2014 | CS | 92 | 44.1 ± 13.4 | 92 | 39 | MIC | 1 |
| Khashei et al. (2016) | Iran | 2014–2014 | 2016 | CS | 318 | 41.5 | 100 | 20 | MIC | 1 |
| Shetty et al. (2019) | Australia | 2014–2017 | 2019 | CS | 180 | 46.2 ± 14 | 113 | 23 | MIC | 0.5 |
| Macías-García et al. (2017) | Spain | 2014–2016 | 2017 | PROCS | 217 | 64 | 76 | 17 | MIC | 1 |
| Farzi et al. (2019) | Iran | 2016–2017 | 2019 | CS | 160 | 46.5 ± 8.3 | 68 | 23 | MIC | 1 |
| Lyu et al. (2020) | China | 2016–2018 | 2020 | PRO | 1,113 | 43 | 791 | 271 | MIC | 0.5 |
| Shmuely et al. (2020) | Israel | 2013–2017 | 2020 | RET/CS | 128 | 45 | 128 | 70 | MIC | 256 |
| Ogata et al. (2013) | Brazil | 2008–2009 | 2013 | CS | 77 | 11.1 ± 3.9 | 77 | 15 | MIC | 2 |
| Abadi et al. (2011) | Iran | 2008–2010 | 2011 | CS | 147 | 34.5 | 147 | 32 | MIC | 1 |
| korn Vilaichone et al. (2017) | Thailand | 2016–2016 | 2017 | CS | 148 | 56.3 ± 13.3 | 50 | 1 | MIC | 0.5 |
| Ferenc et al. (2017) | Poland | 2011 and 2013 | 2016 | CS | 185 | 49 ± 16.8 | 67 | 37 | MIC | 1 |
| Azzaya et al. (2020) | Mongolia | 2014–2016 | 2020 | CS | 361 | 44.3 ± 13.4 | 361 | 108 | MIC | 0.5 |
| Mi et al. (2021) | China | 2018–2018 | 2021 | CS | 48 | 65 | 21 | MIC | 0.5 | |
| Boyanova et al. (2014) | Bulgaria | 2012–2013 | 2014 | CS | 50 | 50.5 | 50 | 11 | MIC | 0.5 |
| Boyanova et al. (2016) | Bulgaria | 2010–2015 | 2015 | CS | 299 | 47.3 | 299 | 84 | MIC | 0.5 |
| Megraud et al. (2021) | France | 2018–2019 | 2021 | PRO | 1,211 | 51.2 | 1211 | 259 | MIC | 0.5 |
| Megraud et al. (2013) | France | 2008–2009 | 2013 | PRO | 2,204 | 2204 | 431 | MIC | 1 | |
| Ducournau et al. (2016) | France | 2014–2015 | 2016 | CS | 984 | 51.5 ± 15.9 | 266 | 59 | MIC | 1 |
| Bouihat et al. (2017) | France | 2015–2016 | 2016 | PRO | 255 | 47.5 | 177 | 45 | MIC | 0.5 |
| Fernández-Reyes et al. (2019) | Spain | 2014–2017 | 2019 | PRO | 112 | 99 | 12 | MIC | 0.5 | |
| Saniee et al. (2018) | Iran | 2010–2017 | 2018 | CS | 985 | 218 | 75 | DD | 2 | |
| Mokhtar et al. (2019) | Malaysia | 2015–2016 | 2019 | CS | 352 | 52 | 13 | 4 | MIC | 0.5 |
| Montes et al. (2015) | Spain | 2008–2012 | 2014 | RET | 143 | 74 | 25 | MIC | 1 | |
| Deyi et al. (2019) | Belgium | 2015–2016 | 2019 | CS | 846 | 846 | 141 | MIC | 0.5 | |
| Tang et al. (2020) | China | 2016–2019 | 2020 | CS | NA | 301 | 201 | MIC | 0.5 | |
Study selection
All records obtained from online databases were imported into EndNote (Version 20), and duplicates were eliminated. M-H and S-K independently assessed the titles and abstracts; V-H-K resolved discrepancies. Studies were considered to be appropriate for the analysis if they presented data concerning the prevalence of H. pylori resistant to CLA. An English language restriction was imposed, while abstracts, conferences, case reports, case series, reviews, studies with unclear results, and duplicate articles were excluded from the analysis.
Data extraction
Our study included studies based on pre-defined criteria and evaluated as full-text articles. Two reviewers conducted the data extraction process independently (M-H, S-K). Any discrepancies were discussed and resolved by consensus of the two reviewers. The primary outcome of focus was the prevalence of clarithromycin-resistant Helicobacter pylori. Information extracted from each study included the first author’s name, year of publication, geographical location, antimicrobial susceptibility testing method, breakpoints for interpretation of the test results, sample size, and the number of clarithromycin-resistant H. pylori. All extracted data are available in an accompanying Supplemental File.
Quality assessment
Two reviewers (S-K and M-H) evaluated the quality of the studies using the Newcastle Ottawa Scale (NOS). In cases of disagreement, a third author (M-SH) was consulted to determine a consensus. The assessment of the studies was based on three criteria: selection, comparability, and exposure/outcome assessments.
Statistical analysis
For the present study, the sample size of isolates for antimicrobial susceptibility testing (AST) and the number of resistances to each antibiotic were used to calculate a weighted pooled resistance and their 95% confidence intervals. In order to prevent the exclusion of studies from the meta-analysis due to 0 or 100 resistance prevalence, the Inverse of Freeman-Tukey double arcsine transformation was conducted using Metaprop command in STATA software (version 17.1). A random-effects model was implemented to estimate pool proportions (Egger et al., 1997; Harbord et al., 2010). The I2 with a P ≤ 0.05 was used to identify significant heterogeneity. The presence of a small-study effect or publication bias was assessed using Egger’s linear regression test and Begg’s test (Harbord, Harris & Sterne, 2009). Subgroup analyses were conducted to determine the impact of the country, continent, publication year (2010–2017, 2018–2021), (AST) (Disc diffusion, Gradient methods), and breakpoints for interpretation of AST results on the variation.
Results
Descriptive statistics
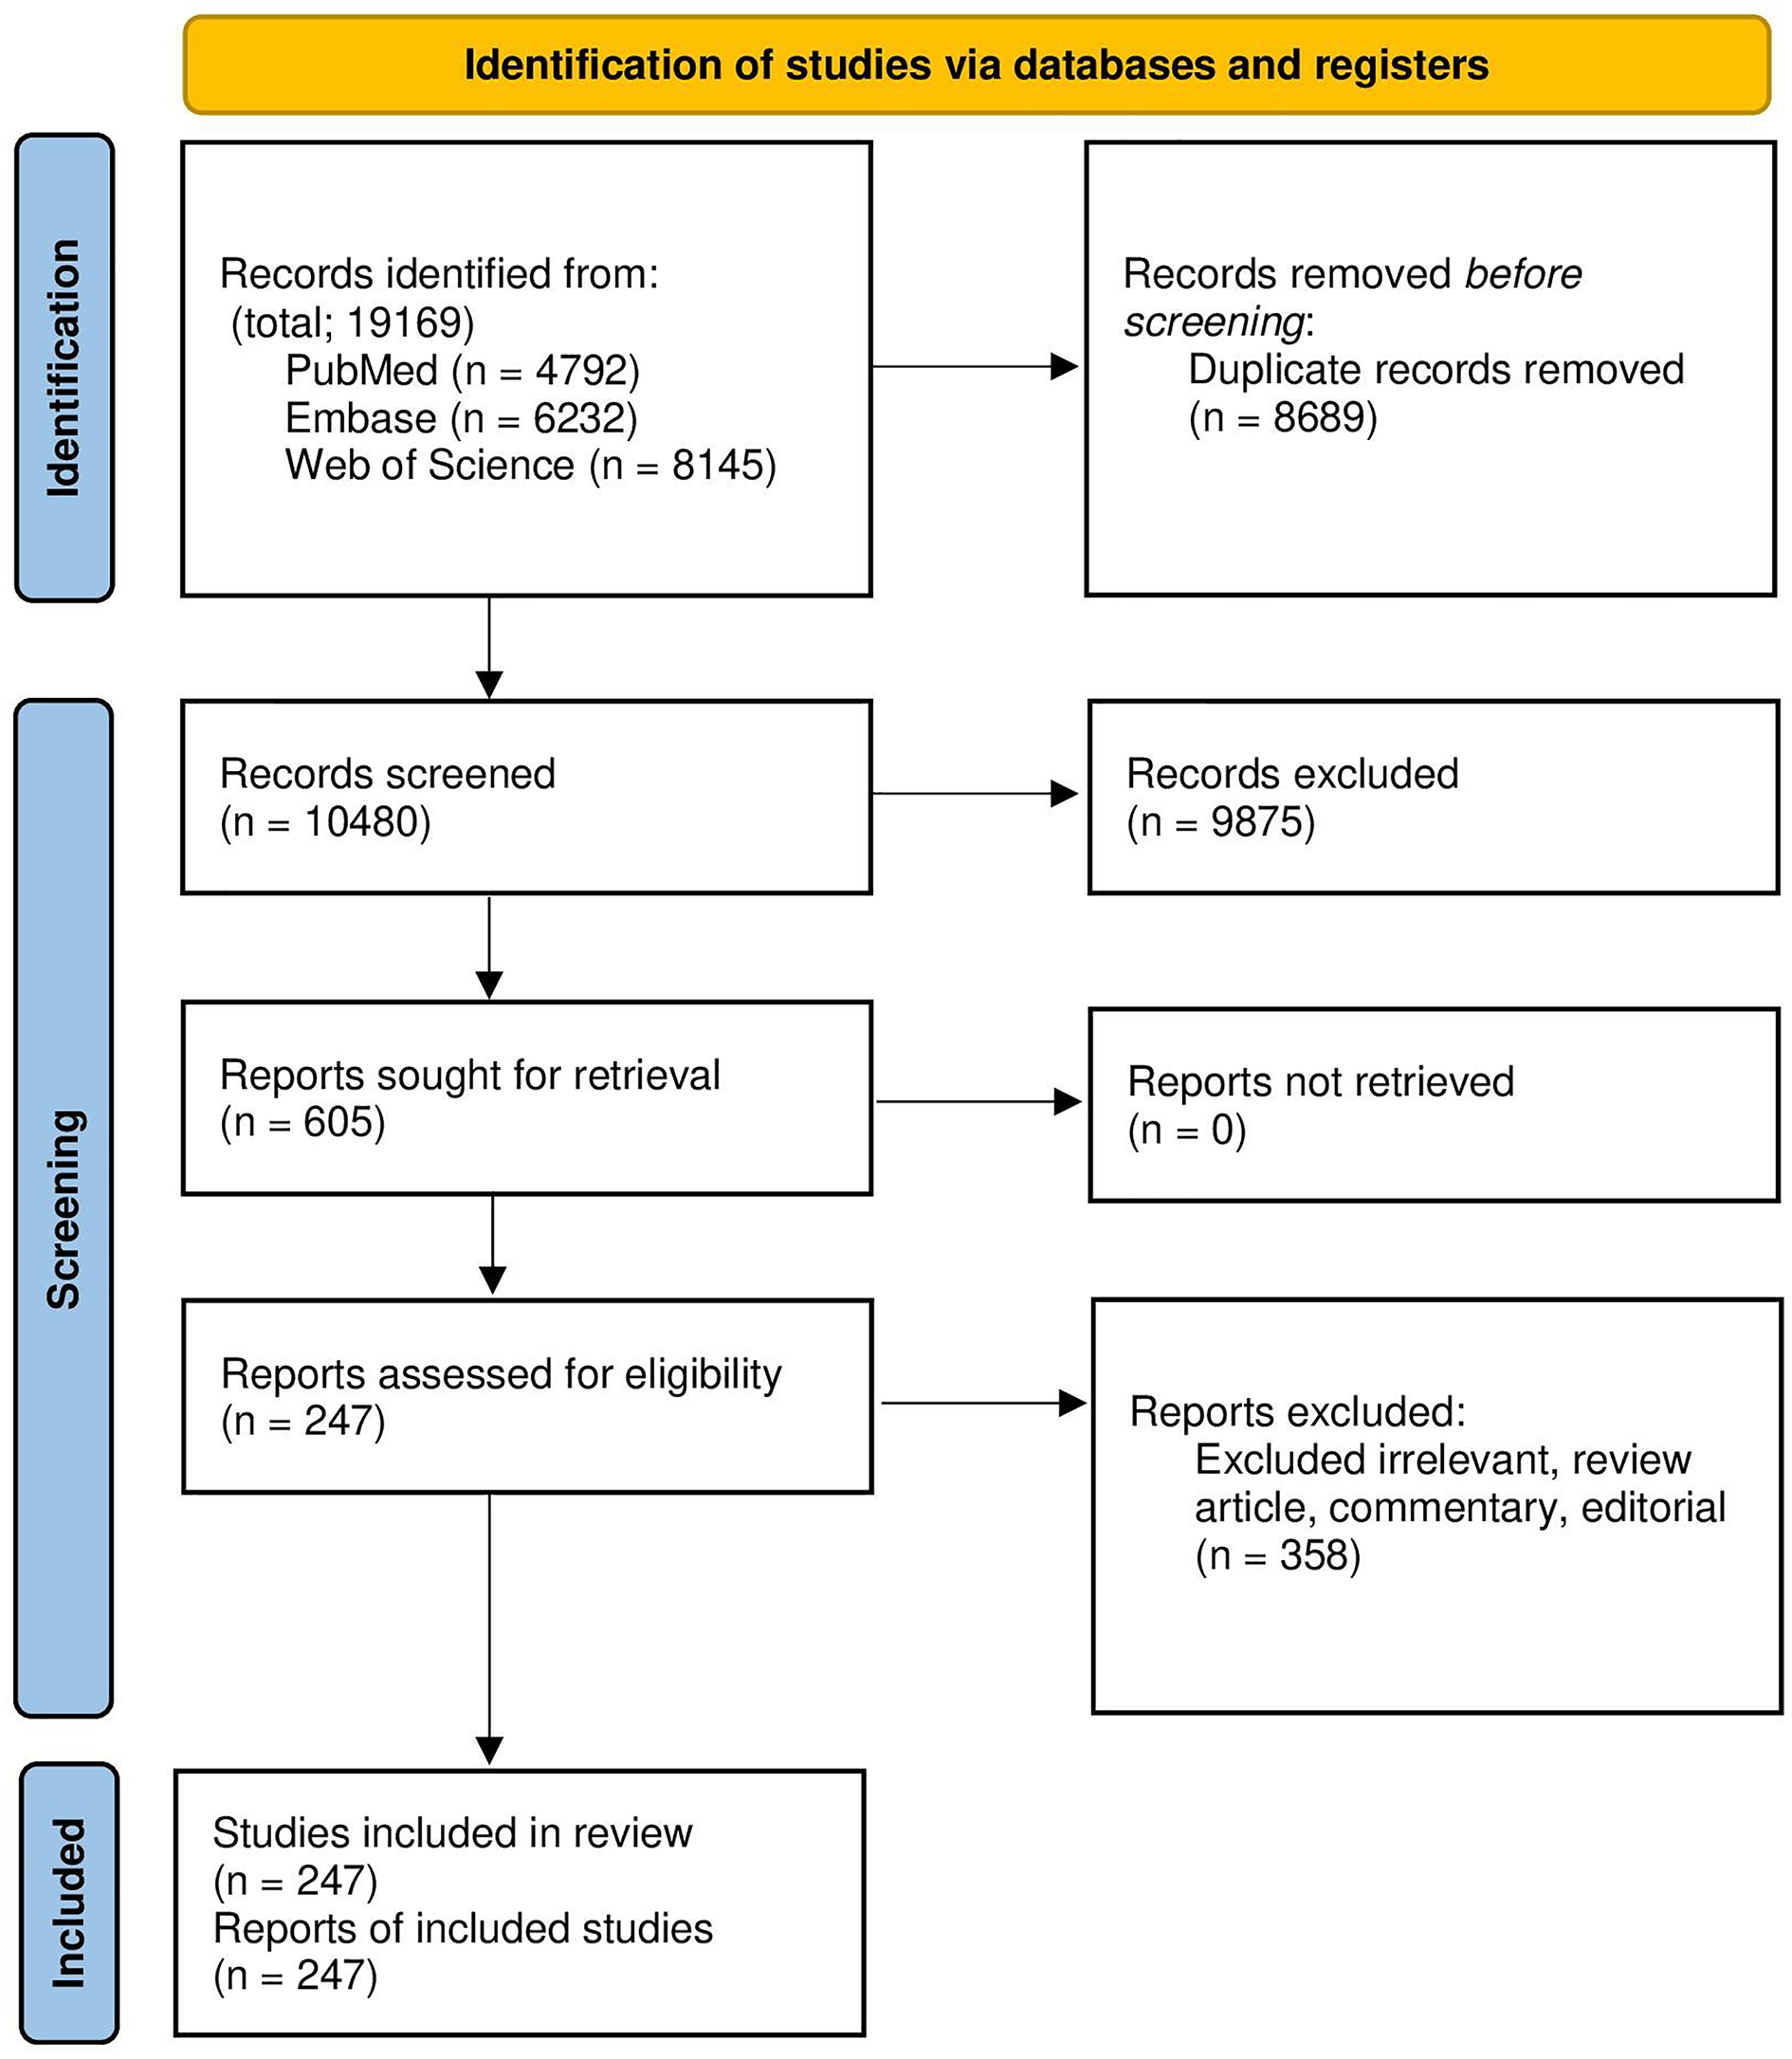
In this research, 19,169 records were acquired in EndNote version 20, a reference manager software. A total of 8,689 duplicated articles were then removed, leaving a total of 247 eligible studies that were included in the systematic review and meta-analysis. The screening and selection presage were summarized in the PRISMA flow chart (Fig. 1). Overly 20,936 H. pylori isolates have been investigated in included articles. More than half of the isolates were investigated in Asia (55.10% Isolated). Although most pieces were from Iran (38 articles), the highest number of isolates among the countries was that investigated from China (32,130 Isolates, 36.52% of total isolates). Description data are summarized in Table 2.
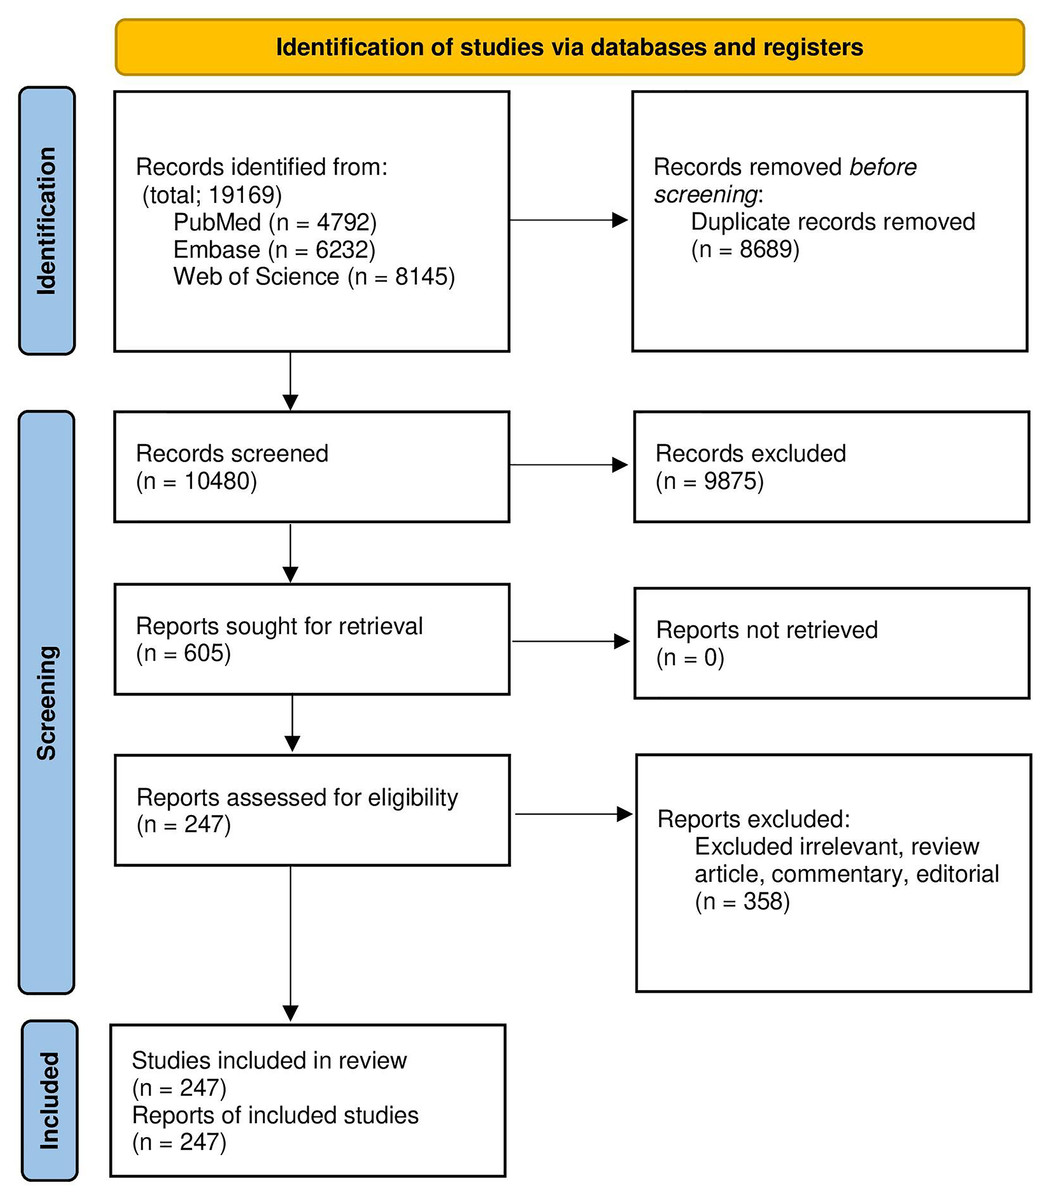
Figure 1: The study PRISMA flow diagram.
| No of article | Clar-resistant, Total isolates | Proportion (LCI, HCI) | Weight | I2 (P) | |
|---|---|---|---|---|---|
| Overall | 248 | 8736, 87991 | 27.53 (25.41, 29.69) | 100.00 | 97.80% (P = 0.00) |
| 2010–2017 | 143 | 12891, 60452 | 24.28 (21.7, 26.96) | 57.68 | 97.91% (P = 0.00) |
| 2018–2021 | 105 | 8045, 27476 | 32.14 (28.69, 35.69) | 42.32 | 97.24% (P = 0.00) |
| Iran | 38 | 1193, 3628 | 27.24 (21.68, 33.18) | 14.91 | 93.14% (P = 0.00) |
| Finland | 1 | 83, 1037 | 8.00 (6.43, 9.83) | 0.43 | NA |
| Chile | 4 | 137, 704 | 18.56 (8.47, 31.34) | 1.62 | 91.76% (P = 0.00) |
| Brazil | 4 | 40, 247 | 15.29 (9.79, 21.7) | 1.55 | 38.94% (P = 0.18) |
| Romania | 1 | 22, 70 | 31.43 (20.85, 43.63) | 0.40 | NA |
| Austria | 1 | 16, 96 | 16.67 (9.84, 25.65) | 0.41 | NA |
| France | 8 | 990, 4873 | 21.13 (15.26, 27.66) | 3.31 | 95.23% (P = 0.00) |
| Eastern Cape | 1 | 40, 200 | 20 (14.69, 26.22) | 0.42 | NA |
| Spain | 8 | 1161, 4650 | 27.41 (17.03, 39.18) | 3.30 | 98.22% (P = 0.00) |
| Malaysia | 5 | 38, 522 | 10.2 (1.59, 23.94) | 1.91 | 93.33% (P = 0.00) |
| Alaska | 2 | 233, 791 | 29.45 (26.31, 32.68) | 0.86 | NA |
| Korea | 5 | 213, 952 | 20.59 (12.26, 30.37) | 2.07 | 90.69% (P = 0.00) |
| Taiwan | 10 | 453, 2088 | 29.16 (15.9, 44.45) | 3.92 | 96.85% (P = 0.00) |
| Mexico | 2 | 17, 135 | 12.3 (7.14, 18.53) | 0.78 | NA |
| USA | 5 | 347, 1157 | 32.98 (17.21, 50.95) | 2.03 | 95.84% (P = 0.00) |
| Portugal | 5 | 541, 1428 | 48.11 (30.07, 66.41) | 1.97 | 95.52% (P = 0.00) |
| China | 32 | 8227, 32130 | 34.05 (29.33, 38.92) | 13.14 | 98.16% (P = 0.00) |
| Poland | 6 | 178, 601 | 29.77 (18.41, 42.52) | 2.42 | 90.49% (P = 0.00) |
| Belgium | 3 | 689, 10456 | 11.28 (3.95, 21.67) | 1.29 | NA |
| Turkey | 7 | 170, 684 | 25.78 (19.44, 32.67) | 3.22 | 76.74% (P = 0.00) |
| Croatia | 1 | 20, 168 | 11.9 (7.43, 17.79) | 0.42 | #VALUE! |
| Colombia | 5 | 152, 664 | 24.26 (12.96, 37.68) | 2.04 | 92.33% (P = 0.00) |
| Nigeria | 2 | 44, 147 | 28.22 (21.13, 35.86) | 0.78 | NA |
| Norway | 1 | 6, 102 | 5.88 (2.19, 12.36) | 0.41 | NA |
| Thailand | 7 | 54, 1097 | 6.24 (2.73, 10.86) | 2.73 | 81.45% (P = 0.00) |
| Bulgaria | 6 | 375, 1742 | 21.89 (18.2, 25.81) | 2.48 | 66.49% (P = 0.01) |
| UK | 1 | 86, 241 | 35.68 (29.64, 42.09) | 0.42 | NA |
| South Korea | 7 | 560, 1778 | 31.4 (19.68, 44.43) | 2.88 | 96.35% (P = 0.00) |
| Germany | 4 | 971, 2771 | 32.08 (6.55, 65.66) | 1.71 | 99.64% (P = 0.00) |
| Vietnam | 5 | 254, 507 | 45.72 (28.85, 63.11) | 2.02 | 93.56% (P = 0.00) |
| Senegal | 1 | 1, 108 | 0.93 (0.02, 5.05) | 0.41 | NA |
| Pakistan | 2 | 22, 139 | 13.33 (8.04, 19.63) | 0.78 | NA |
| Australia | 2 | 31, 124 | 23.47 (16.01, 31.75) | 0.67 | NA |
| Japan | 12 | 854, 2494 | 35.89 (27.02, 45.26) | 4.68 | 93.72% (P = 0.00) |
| India | 3 | 63, 216 | 25.25 (2.81, 59.01) | 1.19 | NA |
| Italy | 11 | 1663, 5367 | 40.38 (25.65, 56.04) | 4.55 | 99.12% (P = 0.00) |
| Israel | 6 | 272, 597 | 46.12 (35.66, 56.75) | 2.39 | 84.00% (P = 0.00) |
| Bangladesh | 1 | 22, 56 | 39.29 (26.5, 53.25) | 0.39 | NA |
| Canada | 1 | 8, 20 | 40.00 (19.12, 63.95) | 0.32 | NA |
| Argentina | 1 | 14, 52 | 26.92 (15.57, 41.02) | 0.38 | NA |
| Egypt | 2 | 18, 127 | 10.61 (5.53, 16.89) | 0.73 | NA |
| Singapore | 1 | 97, 708 | 13.70 (11.25, 16.46) | 0.43 | NA |
| Dominican | 1 | 2, 64 | 3.13 (0.38, 10.84) | 0.39 | NA |
| Iceland | 1 | 9, 105 | 8.57 (3.99, 15.65) | 0.41 | NA |
| Mongolia | 2 | 162, 513 | 31.54 (27.57, 35.64) | 0.84 | NA |
| Peru | 1 | 27, 76 | 35.53 (24.88, 47.34) | 0.40 | NA |
| Slovenia | 1 | 25, 104 | 24.04 (16.2, 33.41) | 0.41 | NA |
| Lithuania | 1 | 2, 79 | 2.53 (0.31, 8.85) | 0.40 | NA |
| Algeria | 3 | 107, 406 | 26.62 (21.42, 32.15) | 1.21 | NA |
| Russia | 3 | 28, 333 | 13.34 (2.11, 30.9) | 1.12 | NA |
| Honduras | 1 | 13, 116 | 11.21 (6.1, 18.4) | 0.41 | NA |
| Switzerland | 2 | 145, 216 | 67.16 (60.71, 73.31) | 0.81 | NA |
| Cameroon | 1 | 19, 140 | 13.57 (8.37, 20.38) | 0.41 | NA |
| Congo | 1 | 24, 102 | 23.53 (15.69, 32.96) | 0.41 | NA |
Note:
High confidence interval, HCI; low confidence interval, LCI; I-squared, I2; Degrees of freedom, DF.
Publication bias
The publication bias was significant by the regression-based Egger test for small-study effects (P = 0.04), but Begg’s test for small-study effects was insignificant (P = 0.09). The Nonparametric trim-and-fill analysis of publication bias also did not change the effect size. The funnel plot also did not have significant evidence of publication bias (Fig. 2A). The sensitivity analysis or one leave-out method also had no significant bias.
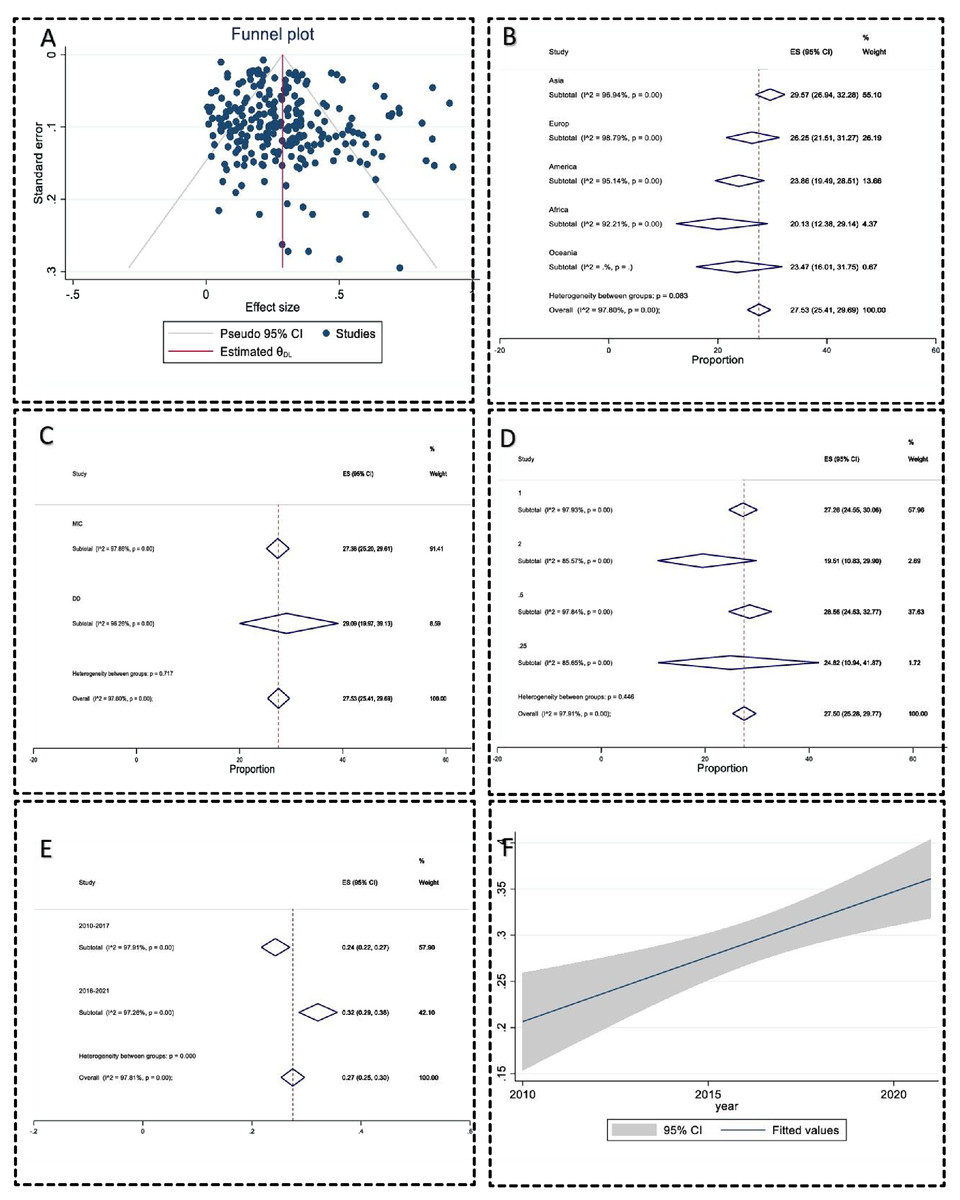
Figure 2: Meta-analysis charts.
(A) The funnel plot of clarithromycin-resistant Helicobacter pylori prevalence did not have significant evidence of publication bias; (B) the subgroup analysis forest plot of clarithromycin-resistant Helicobacter pylori prevalence in different continents; (C) the subgroup analysis forest plot of clarithromycin-resistant Helicobacter pylori prevalence using different AST methods; (D) subgroup analysis forest plot of clarithromycin-resistant Helicobacter pylori prevalence in different breakpoints to interpret antimicrobial susceptibility test data; (E) subgroup analysis forest plot of clarithromycin-resistant Helicobacter pylori prevalence in years; (F) the regression analysis of clarithromycin-resistant Helicobacter pylori prevalence over years with 95% Confidence interval had a significant correlation 0.013 (95% CI [0.01–0.02]) (P < 0.001).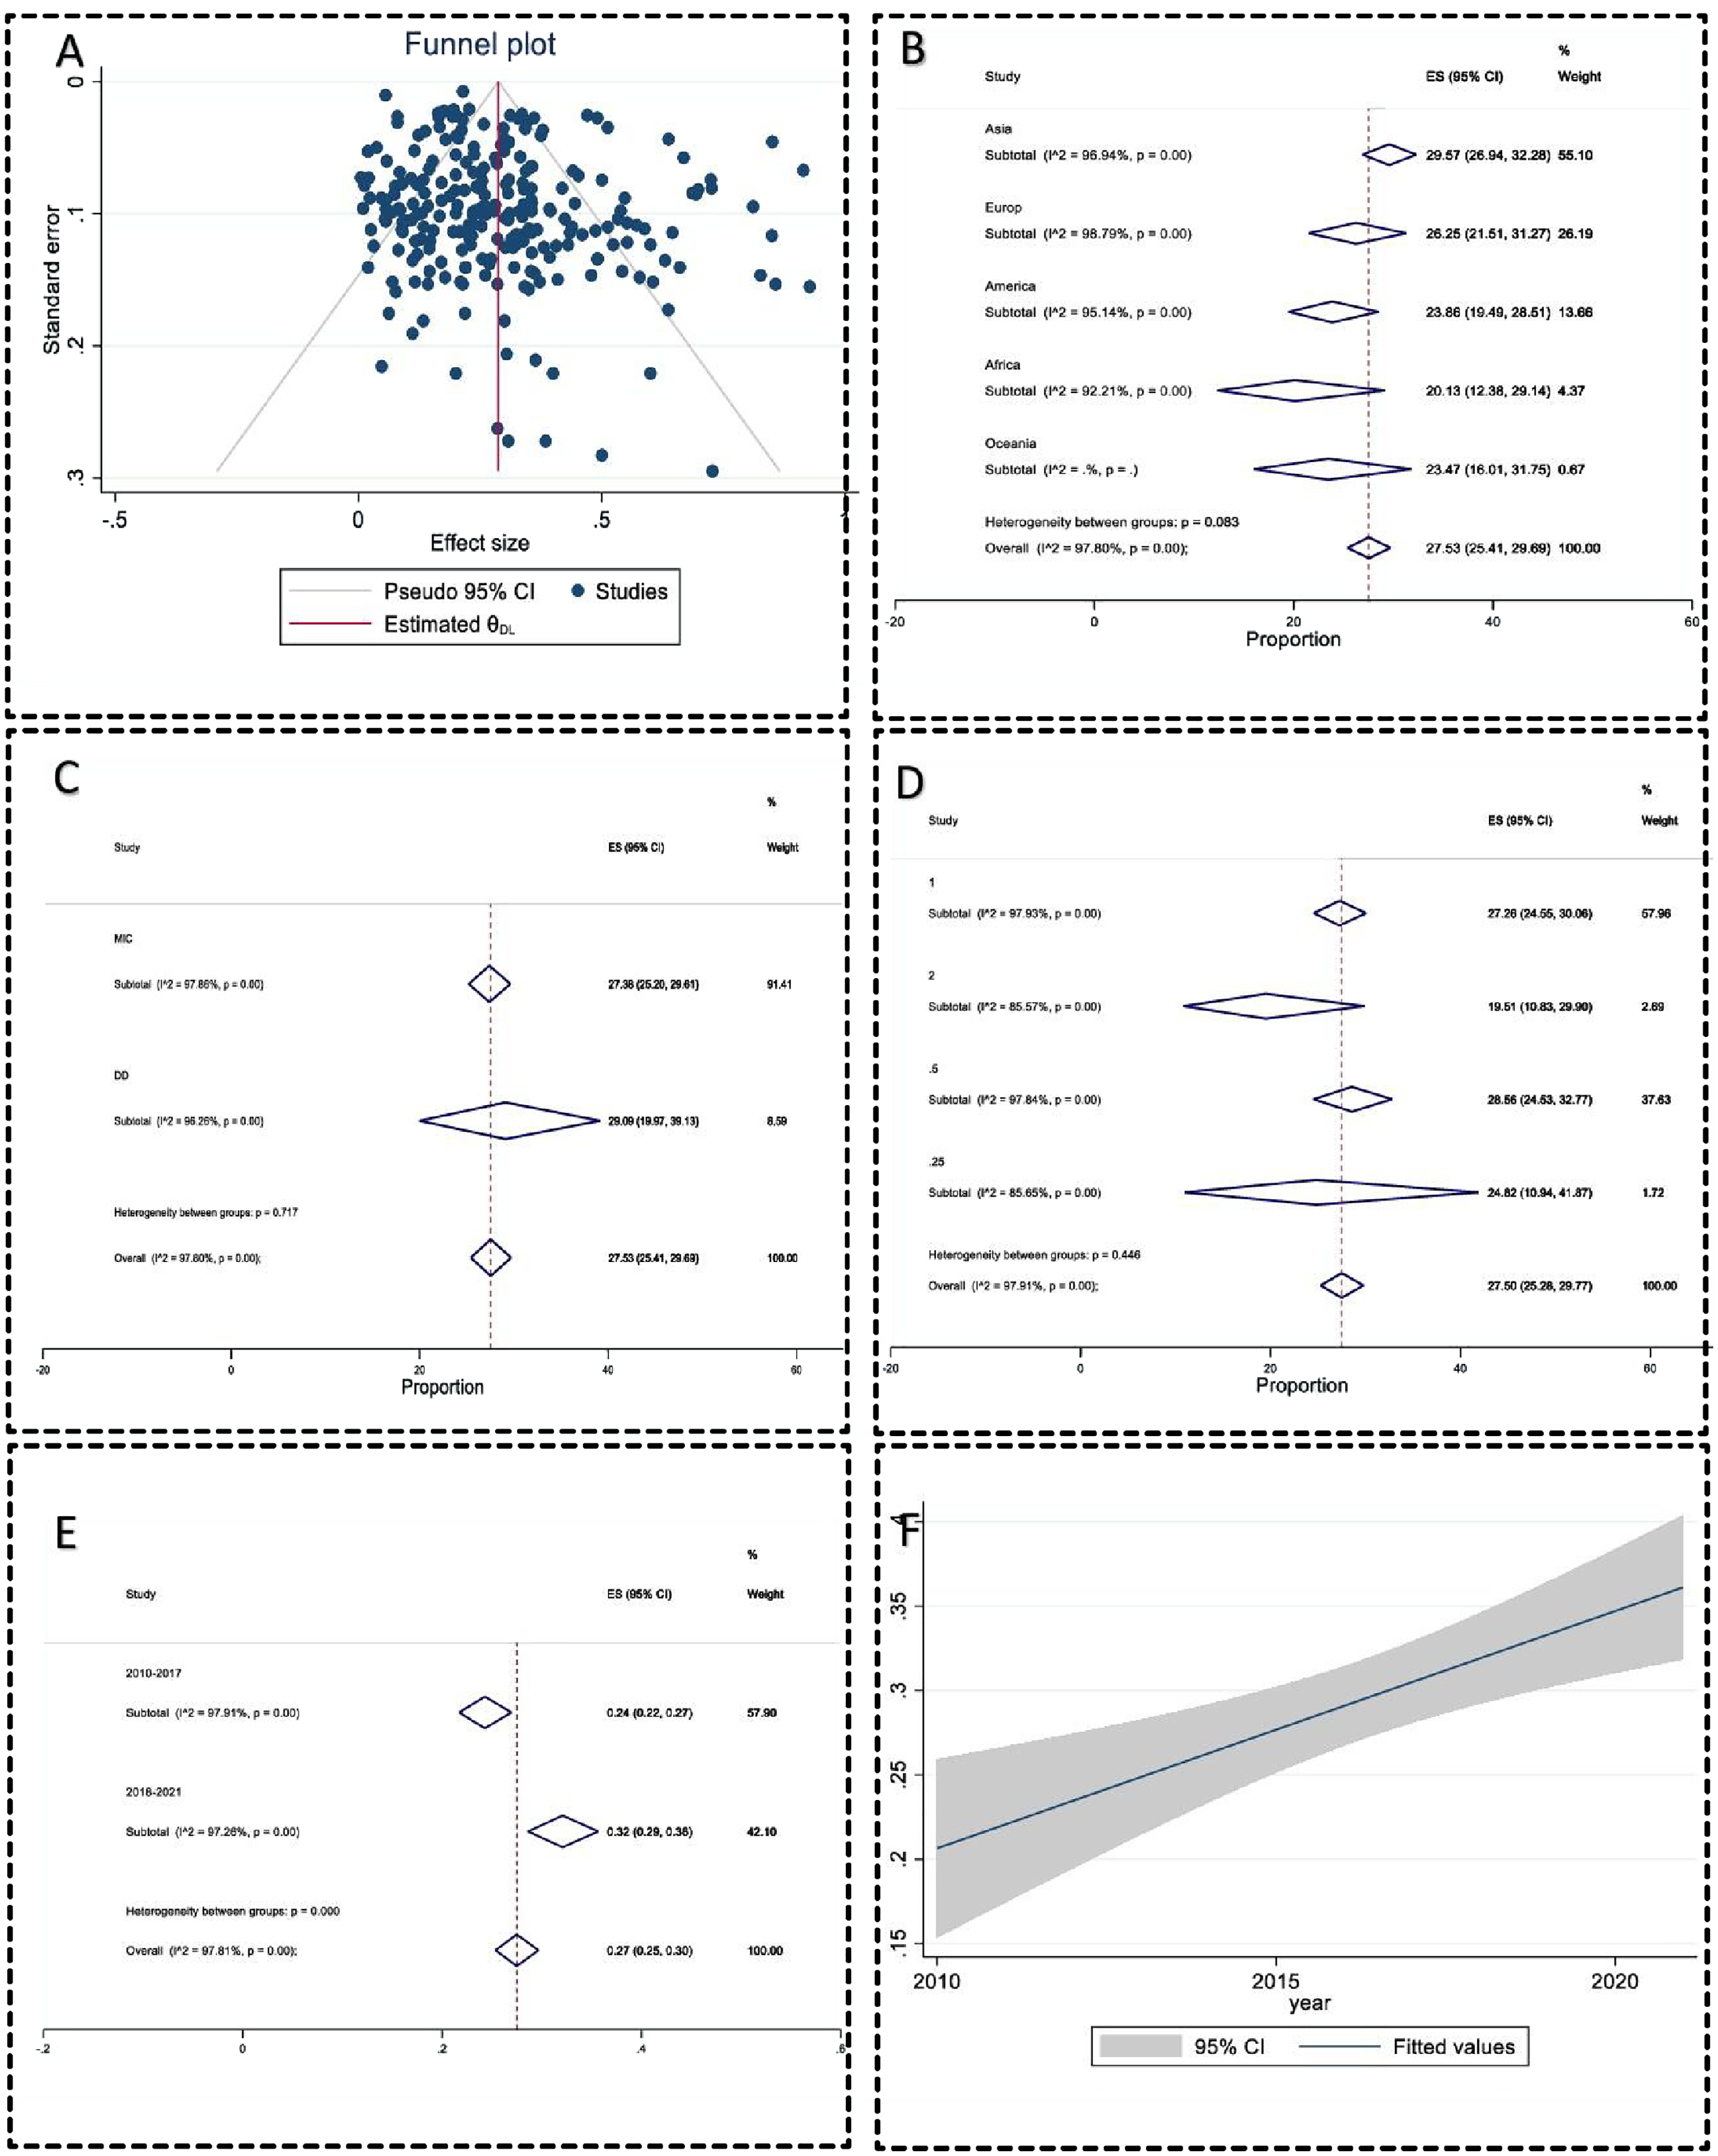
Meta-analysis
In 248 included studies, 20,936 isolates have been investigated, and 8,736 isolates have been reported as resistant. The pooled prevalence of CLA-resistance H. pylori was 27.53 (95% CI [25.41–29.6]). Heterogeneity between reports was significant (I2 = 97.80, P < 0.01). The heterogeneity between countries was substantial (P < 0.001). Switzerland, Portugal, and Israel had the highest resistance rates (67.16%, 48.11%, and 46.12%, respectively), and Senegal, Lithuania, and the Dominican Republic had the lowest resistance prevalence, 0.93%, 2.53%, and 3.13%, respectively) (Table 2). The heterogeneity between the continent subgroups was insignificant (P > 0.05) (Fig. 2B). The heterogeneity between the AST methods subgroup was insignificant (Fig. 2C). The breakpoints for the interpretation AST subgroup were insignificant (P > 0.05) (Fig. 2D). The CLA-resistant H. pylori prevalence increased from 24.28% in 2010–2017 to 32.14% in the 2018–2021 years period (P < 0.01) (Fig. 2E). All statistics are summarized in Table 2. The regression meta-analysis for resistance rate over the publication year had a significant correlation of 0.013 (95% CI [0.01–0.02]) (P < 0.001) (Fig. 2F).
Discussion
Over the past years, the treatment of H. pylori infections has been performed using the standard triple therapy regimen, including CLA, a proton pump inhibitor, with either metronidazole or amoxicillin (Gong et al., 2020). However, in recent years, it is revealed that some H. pylori isolates have developed resistance to CLA (Sanches et al., 2016). Therefore, the efficacy of the standard triple therapy regimen is in decline. In 2017, WHO listed the CLA-resistant H. pylori among antibiotic-resistant priority pathogens that need research and development of new antibiotics (Khani, Abadi & Mobarez, 2019). Globally, surveillance and being aware of the frequency of resistance to antibiotics among pathogens is critical, and obtained results can be helpful in different sections such as the design of screening or follow-up programs, and the development of antimicrobial stewardship programs (Azimi et al., 2019; Pormohammad, Nasiri & Azimi, 2019).
In the present systematic review and meta-analysis study, we surveyed and analyzed the worldwide prevalence of CLA resistance among H. pylori isolates from 2010 to 2021. The awareness of CLA resistance among different countries of the world and effective treatment of H. pylori infections are the main goal of the current study. The present systematic review and meta-analysis study included 247 eligible studies from 54 different countries. Our analyses revealed that the overall prevalence of clarithromycin-resistance H. pylori was 27.53%, worldwide.
Resistance to CLA among H. pylori is occur in two different levels including (1) a high level of resistance (MIC more than 64 mg l−1) and (2) a low level of resistance (0.5 ≤ MIC ≤ 1 mg l−1) (He et al., 2021). Point mutations, multidrug efflux pump systems, and synergistic effect of mutations in genes rpl22 (ribosomal protein L22) and infB (translation initiation factor IF-2) with 23S rRNA point mutations are the main CLA resistance mechanisms among H. pylori isolates (Marques et al., 2020; Li et al., 2021). Moreover, it is presumed that some outer-membrane proteins have a role in CLA resistance in H. pylori isolates (Marques et al., 2020). In the Western world and among developed countries, more than 90% of CLA resistance is related to point mutations in the peptidyl transferase region of the V domain of 23S rRNA gene (Mégraud, 2004). The main point mutations related to CLA resistance are A2142G, A2143G (adenine-to-guanine transition at either position 2142 or 2143), A2142C (adenine-to-cytosine transversion at position 2142), A2115G, A2144T, G2141A, G2144T, T2289C, T2717C, and C2694A (Gong et al., 2020; Marques et al., 2020; Li et al., 2021). Moreover, hp1181 and hp1184 mutations are associated with CLA resistance (Li et al., 2021). Mutation in the 2142 and 2143 positions leads to restricted resistance and different levels of resistance, respectively (Kim et al., 2020).
In the present research, more than half of the included studies were performed in Asia. These results demonstrated that CLA resistance is a main public health issue in most Asian countries. Among studies surveyed CLA resistance rates in 54 different countries, Switzerland (67.16%) and Senegal (0.93%) had the highest and lowest resistance rates, respectively. The high level of CLA resistance can be due to the following reasons: (1) inappropriate prescription and unregulated or widespread use of CLA, and (2) the use of CLA in other infections such as respiratory tract infections or intestinal parasites infections (Chen et al., 2017). Time trend analyses revealed that the CLA-resistant rates among H. pylori isolate increased from 24.28% in 2010–2017 to 32.14% in the 2018–2021 years’ period. An increase in CLA resistance rates is an alarming finding. In areas where CLA-resistance is more than 15%, it is recommended to perform susceptibility testing before prescribing the standard triple therapy regimen (Sanches et al., 2016; Abadi, 2017). Combination therapy with other drugs such as tinidazole can be helpful in the treatment of H. pylori infections. It is revealed that CLA combined with tinidazole can reduce the CLA resistance rate, decrease inflammatory reactions, and can effectively eliminate H. pylori infections (He et al., 2021). One of the limitations of this study was that we evaluated the CLA resistance rate only and the other antibiotics were not considered.
Conclusion
Our analysis revealed that CLA resistance rates varied among studies performed in different 54 countries. Altogether, results showed that the overall CLA resistance rate is 27.53%, worldwide. The difference in CLA resistance rate among the included studies can be due to several reasons such as differences in antibiotic prescription rates in various geographic areas, use of different MIC breakpoints or inaccurate criteria in performed studies, and the emergence of multidrug-resistant (MDR) strains. We performed a time trend analysis and the results revealed that the clarithromycin-resistance rates in increasing in recent years. Based on our findings, systematic surveillance, and proper monitoring of CLA resistance rates, as well as monitoring the use of CLA in patients, and performing the CLA susceptibility test before prescription may be critical actions for the inhibition and control of H. pylori infections.