An RNAi screen unravels the complexities of Rho GTPase networks in skin morphogenesis
- Howard Hughes Medical Institute, The Rockefeller University, United States
Figures
Figure 1

A screen strategy to identify Rho GTPase regulators of skin morphogenesis.
(A) Schematic representation of the different staggered stages of HF development in embryonic mouse skin. (B) Screen strategy to identify Rho GTPase regulators of skin morphogenesis. (C) Dispase treatment allows for successful separation of the epidermal and HF (dermal) fractions at E18.5. Representation of n = 3 embryos. Krt14-Actin-GFP animals were used to visualize epidermal and HF cells. Scale bars, 50 μm. (D) Schematic representation of the competition assays. (E) Competition assay in the epidermal fraction. Error bars represent standard error of the mean (SEM) from n = 11 (shScr/shScr), n = 13 (shCtnnb1/shScr) and n = 18 embryos (shMyh9/shScr). Normal distribution of the data was tested using the Shapiro-Wilk test. Nonparametric unpaired two-tailed independent Mann-Whitney test was used to compare the data. (F) Competition assay in the HF fraction. Error bars represent SEM from n = 11 (shScr/shScr), n = 13 (shCtnnb1/shScr) and n = 18 embryos (shMyh9/shScr). Normal distribution of the data was tested using the Shapiro-Wilk test. Nonparametric unpaired two-tailed independent Mann-Whitney test was used to compare the data. (G) Top: Planar; Bottom: sagittal views of E14.5 skin showing similar level of transduction of the epidermis (left) and hair placode (right). RFP verifies transduction. Scale bars, 25 μm. (H) Analyses reveal that epidermal and hair placode cells are transduced in similar proportions. Error bars represent SEM from n = 15 fields from n = 3 embryos. Normal distribution of the data was tested using the Shapiro-Wilk test. Parametric unpaired two-tailed t-test was used to compare the data. (I) Placode cells represent a smaller fraction than epidermal cells in the E14.5 skin. Error bars represent SEM from n = 12 IFE fields and n = 15 placode fields from three embryos. Normal distribution of the data was tested using the Shapiro-Wilk test. Parametric unpaired two-tailed t-test was used to compare the data.
-
Figure 1—source data 1
Source data related to Figure 1E,F,H and I.
- https://doi.org/10.7554/eLife.50226.003
Figure 2 with 2 supplements
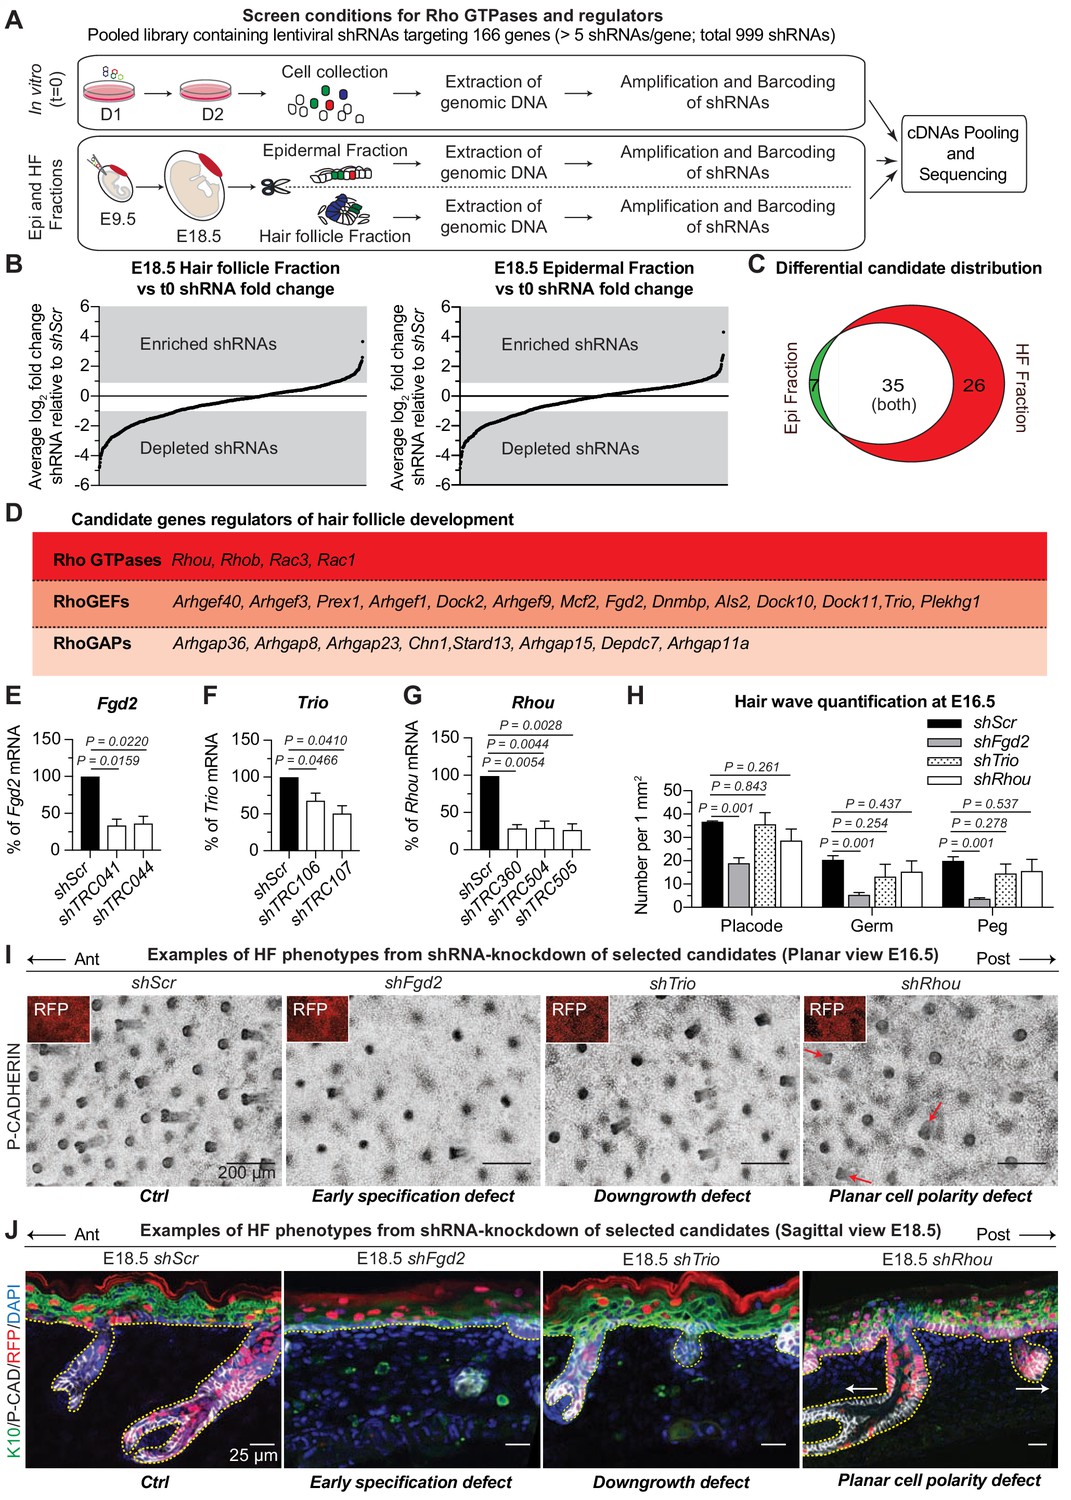
RNAi screen hits reveal Rho GTPase regulators of hair follicle morphogenesis.
(A) Schematic representation of our in vivo screen for Rho GTPases and their regulators. (B) In vivo screen results showing the absolute log2 fold change for each individual shRNA present in the HF (left) and epidermal (right) fractions relative to their initial representation and normalized to 20 Scr-shRNA controls. (C) Venn diagram showing distribution of gene candidates among the epidermal and HF fractions. Candidates preferentially enriched or depleted in the epidermal fraction are highlighted in green and candidates preferentially affected in the HF fraction are highlighted in red. (D) Functional classification of the 26 candidates that were specifically either enriched or depleted in the HF fraction. (E–G) qPCR analyses in mouse keratinocytes validate shRNA-mediated knockdown of selected screen candidates. Error bars represent SEM from n = 3 experiments. Normal distribution of the data was tested using the Shapiro-Wilk test. Parametric paired two-tailed independent t-test was used to compare the data, (H) Quantifications of the numbers of placodes, germs and pegs from the different staggered HF waves in shScr, shFgd2, shTrio and shRhou -transduced E16.5 head skin. Error bars represent SEM from shScr n = 3, shFgd2 n = 3, shTrio n = 3 and shRhou n = 5 embryos. Normal distribution of the data was tested using the Shapiro-Wilk test. Parametric independent two-tailed unpaired t-test was used to compare the data.(I) Examples of HF phenotypes from shRNA-knockdown of selected candidates. Z-projections of planar views from whole-mount immunofluorescence of transduced E16.5 head skins. RFP (insets) verifies transduction. Representation of n = 3 embryos for each condition. Scale bars, 200 μm. (J) Examples of HF phenotypes. Immunofluorescence of sagittal sections from transduced E18.5 skins. Representation of n = 3 embryos for each condition. Scale bars, 25 μm.
-
Figure 2—source data 1
Source data related to Figure 2E,F,G and H.
- https://doi.org/10.7554/eLife.50226.007
Figure 2—figure supplement 1

Expression of Rho GTPases and their regulators in embryonic epidermis versus hair placodes.
Transcriptome profilings of (A) Rho GTPases (B) RhoGAPs (C) RhoGEFs (D) and RhoGDIs in the epidermis and placodes of E14.5 embryos. Data are taken from the hair-gel platform (Rezza et al., 2016; Sennett et al., 2015). Note that expression of Rhou mRNA is reduced in the placode compared to the epidermis at E14.5.
Figure 2—figure supplement 2
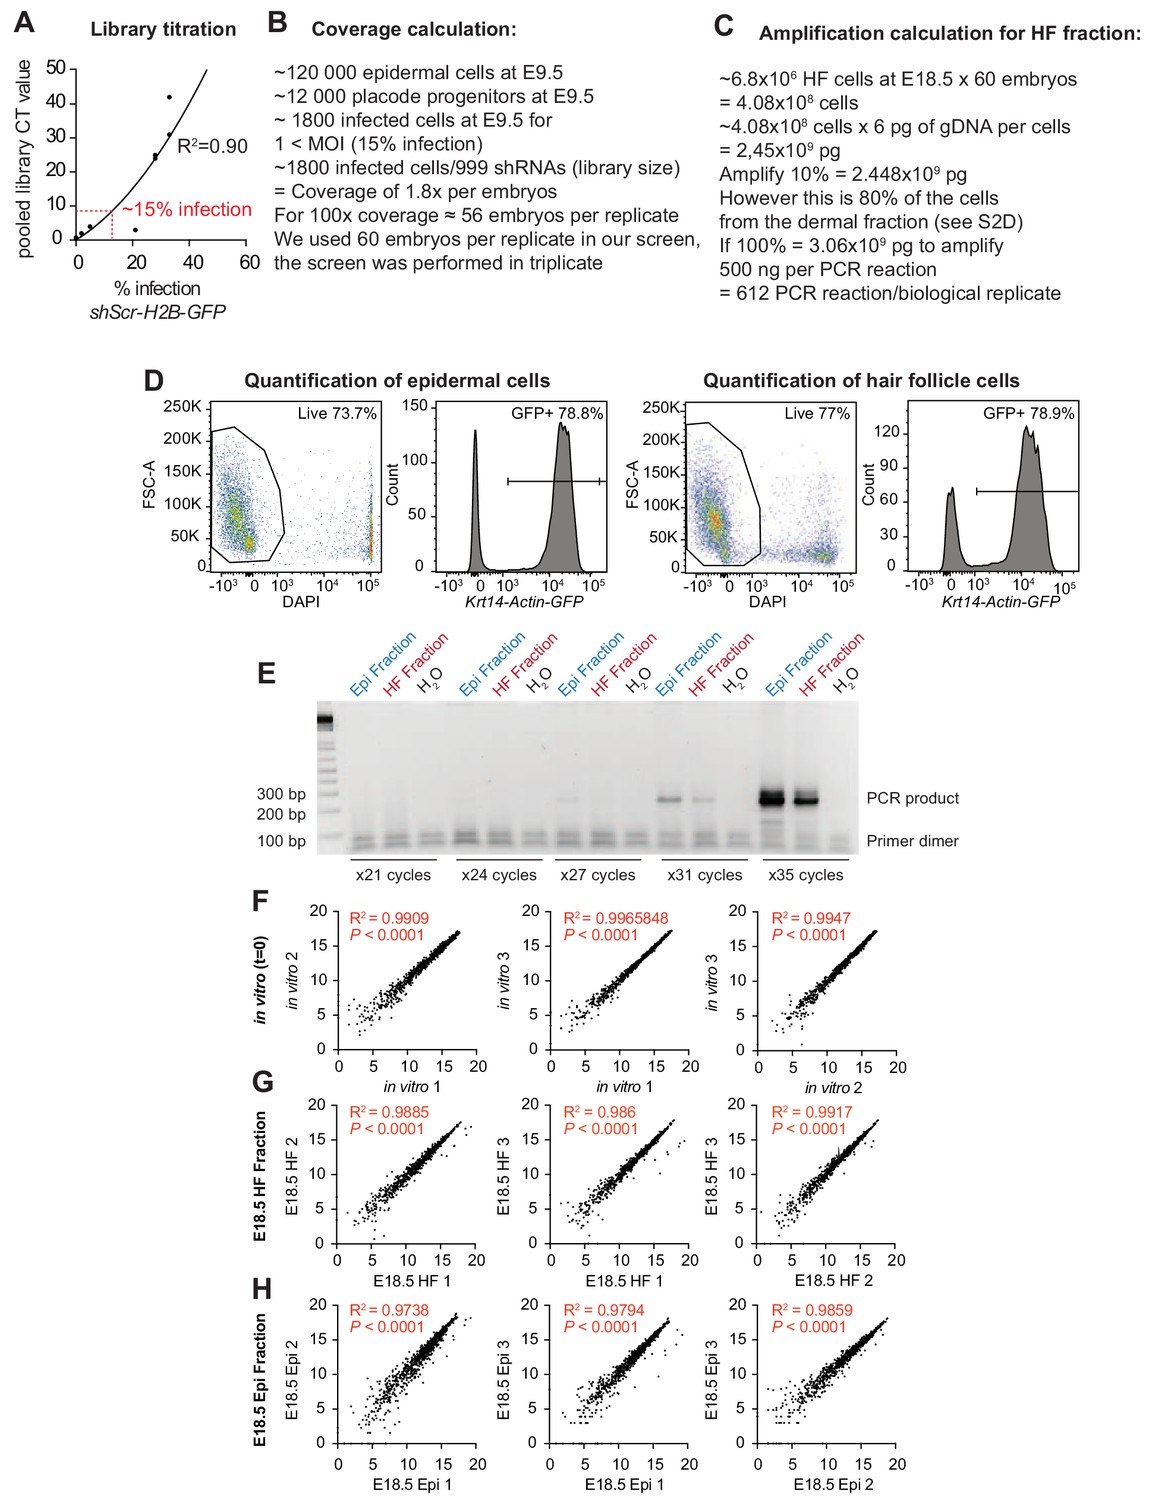
Establishment of conditions for the screen.
Screen set up, parameters and correlation between biological replicates. (A) Titration of the lentiviral library so that only ~15% of the E9.5 skin progenitors were infected, thereby ensuring a multiplicity of infection <1. (B) Screen coverage calculation. ~56 embryos are required per biological replicates to ensure that at least 100 E9.5 skin progenitors that will become HF progenitors are transduced with the same shRNA (100x coverage). (C) Calculations to ensure adequate amplification of genomic DNAs at E18.5. Shown are calculations for the HF fraction. Refer to Beronja et al. (2013) for details on the epidermal fraction. (D) Flow cytometry analysis of dispase separated epidermal and HF fractions from Krt14-Actin-GFP mice. The separated dermal fraction contains a high proportion (80%) of HF cells at E18.5 (GFP+), which is used in our amplification calculation. Representation of n = 3 embryos. (E) The sequencing library was prepared using custom primers containing adapter and sequencing features for the Illumina flow cells as well as a four nucleotide barcode for multiplex sequencing to amplify the shRNAs present in each population (Beronja et al., 2013). Shown is a representative example showing that the PCR reaction produces a clean PCR product after 31 cycles of amplification. (F–H) Correlation between biological replicates. Spearman correlation, R2 and P values for each comparison are indicated on the corresponding graphs.
Figure 3 with 1 supplement
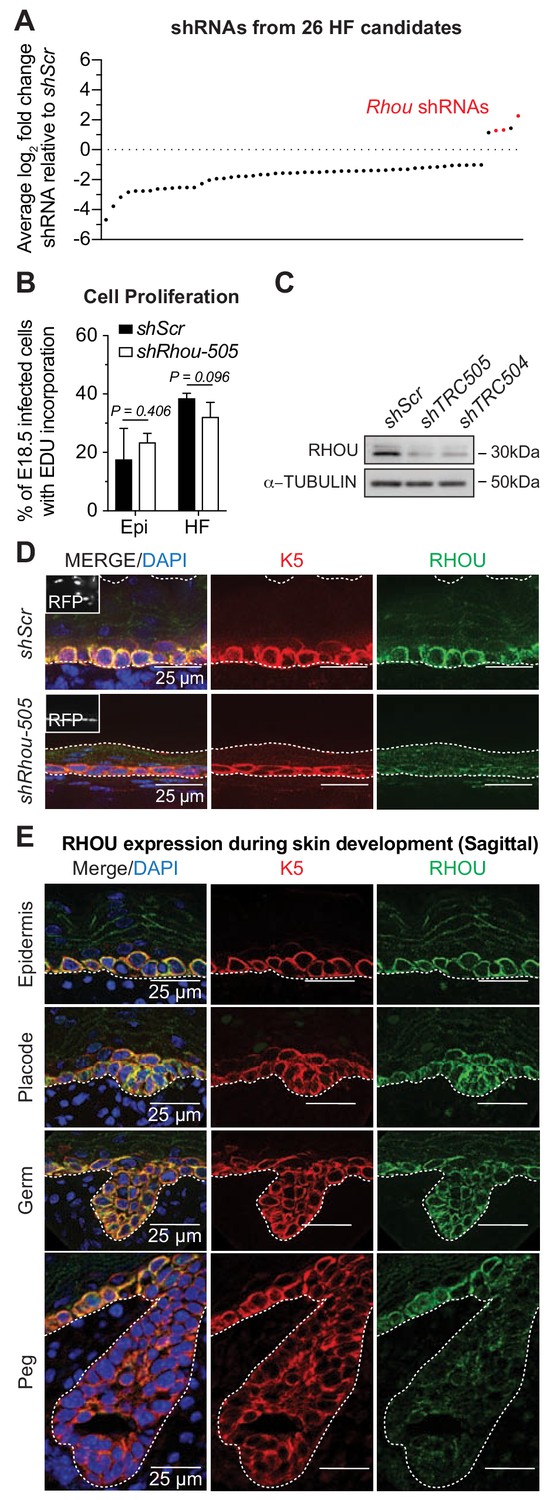
RHOU, an unusual positive hit from our RNAi screen for Rho GTPase regulators of morphogenesis.
(A) In vivo screen results show the absolute log2 fold changes of shRNAs targeting the 26 candidates specifically enriched or depleted in the HF fraction. shRNAs targeting Rhou are highlighted in red. (B) Epidermal and HF cell proliferation is not affected by RHOU loss. Quantifications of epidermal and HF EDU incorporation to quantify the numbers of S-phase cells. Error bars represent SEM from n = 3 shScr and n = 3 shRhou-505 embryos. Normal distribution of the data was testes using the Shapiro-Wilk test. Parametric independent unpaired two-tailed t-test was used to compare the data. (C–D) RHOU immunoblot (C) and immunofluorescence (D) of E16.5 skin substantiate antibody efficacy and effective RHOU depletion by shRNA-mediated knockdown in vitro and in vivo. Scale bars, 25 μm. (E) RHOU immunofluorescence reveals expression in basal epidermal progenitors, but downregulation as HF morphogenesis proceeds. Representation of n = 3 embryos. Scale bars, 25 μm.
-
Figure 3—source data 1
Source data related to Figure 3B.
- https://doi.org/10.7554/eLife.50226.010
Figure 3—figure supplement 1
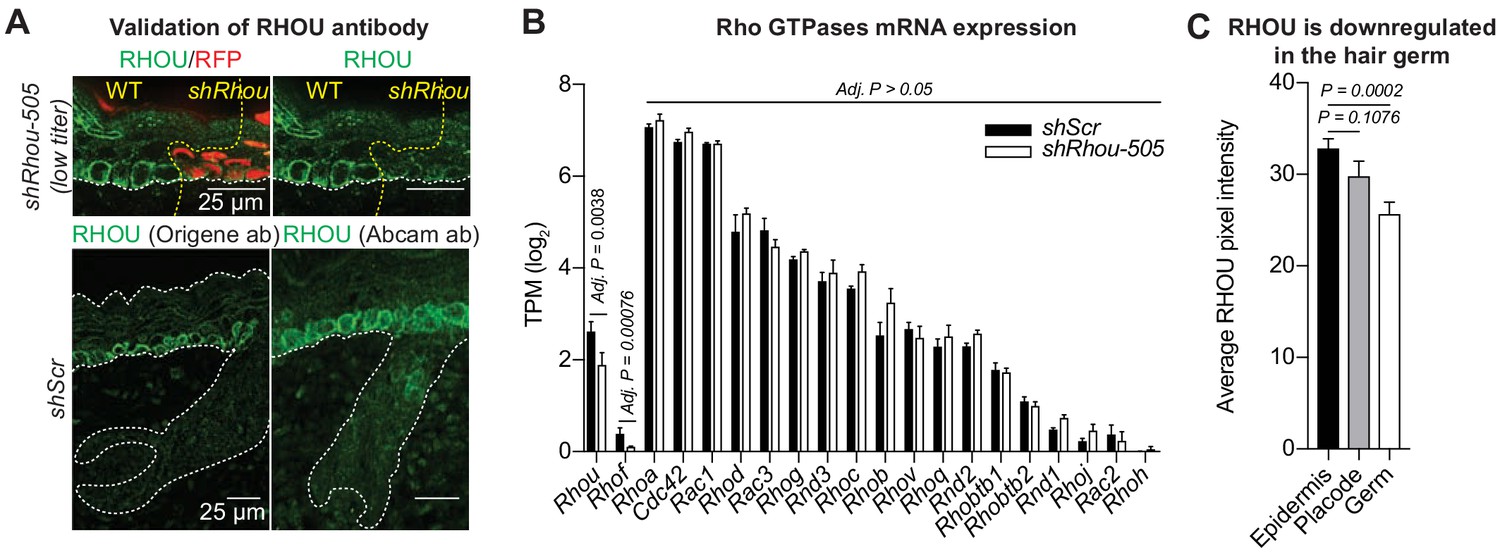
Validation of the shRhou knockdown and RHOU antibody specificity.
(A) Validation of Rhou knockdown and specificity of anti-RHOU antibody for immunofluorescence. (Top panel): Shown is immunofluorescence of sagittal sections showing a shRhou-transduced and a non transduced region. (Bottom panel): RHOU expression pattern in the skin was confirmed using a second antibody. Scale bars, 25 μm (B) Differential gene expression analysis using DESeq2 shows that a dozen other Rho GTPases, including closely related Rhov, which were expressed in the skin epithelium at comparable or higher levels than Rhou, showed no change in expression levels in RHOU-deficient skin. (C) Quantifications of RHOU mean pixel intensity in the epidermis, placode and hair germ. Error bars represent SEM from n = 14 epidermis regions, n = 10 placodes, n = 10 hair germs. Normal distribution of the data was determined using the Shapiro-Wilk test. Parametric independent two-tailed unpaired t-test was used to compare the data.
Figure 4 with 1 supplement
RHOU: a prerequisite to establishing planar cell polarity in the skin.
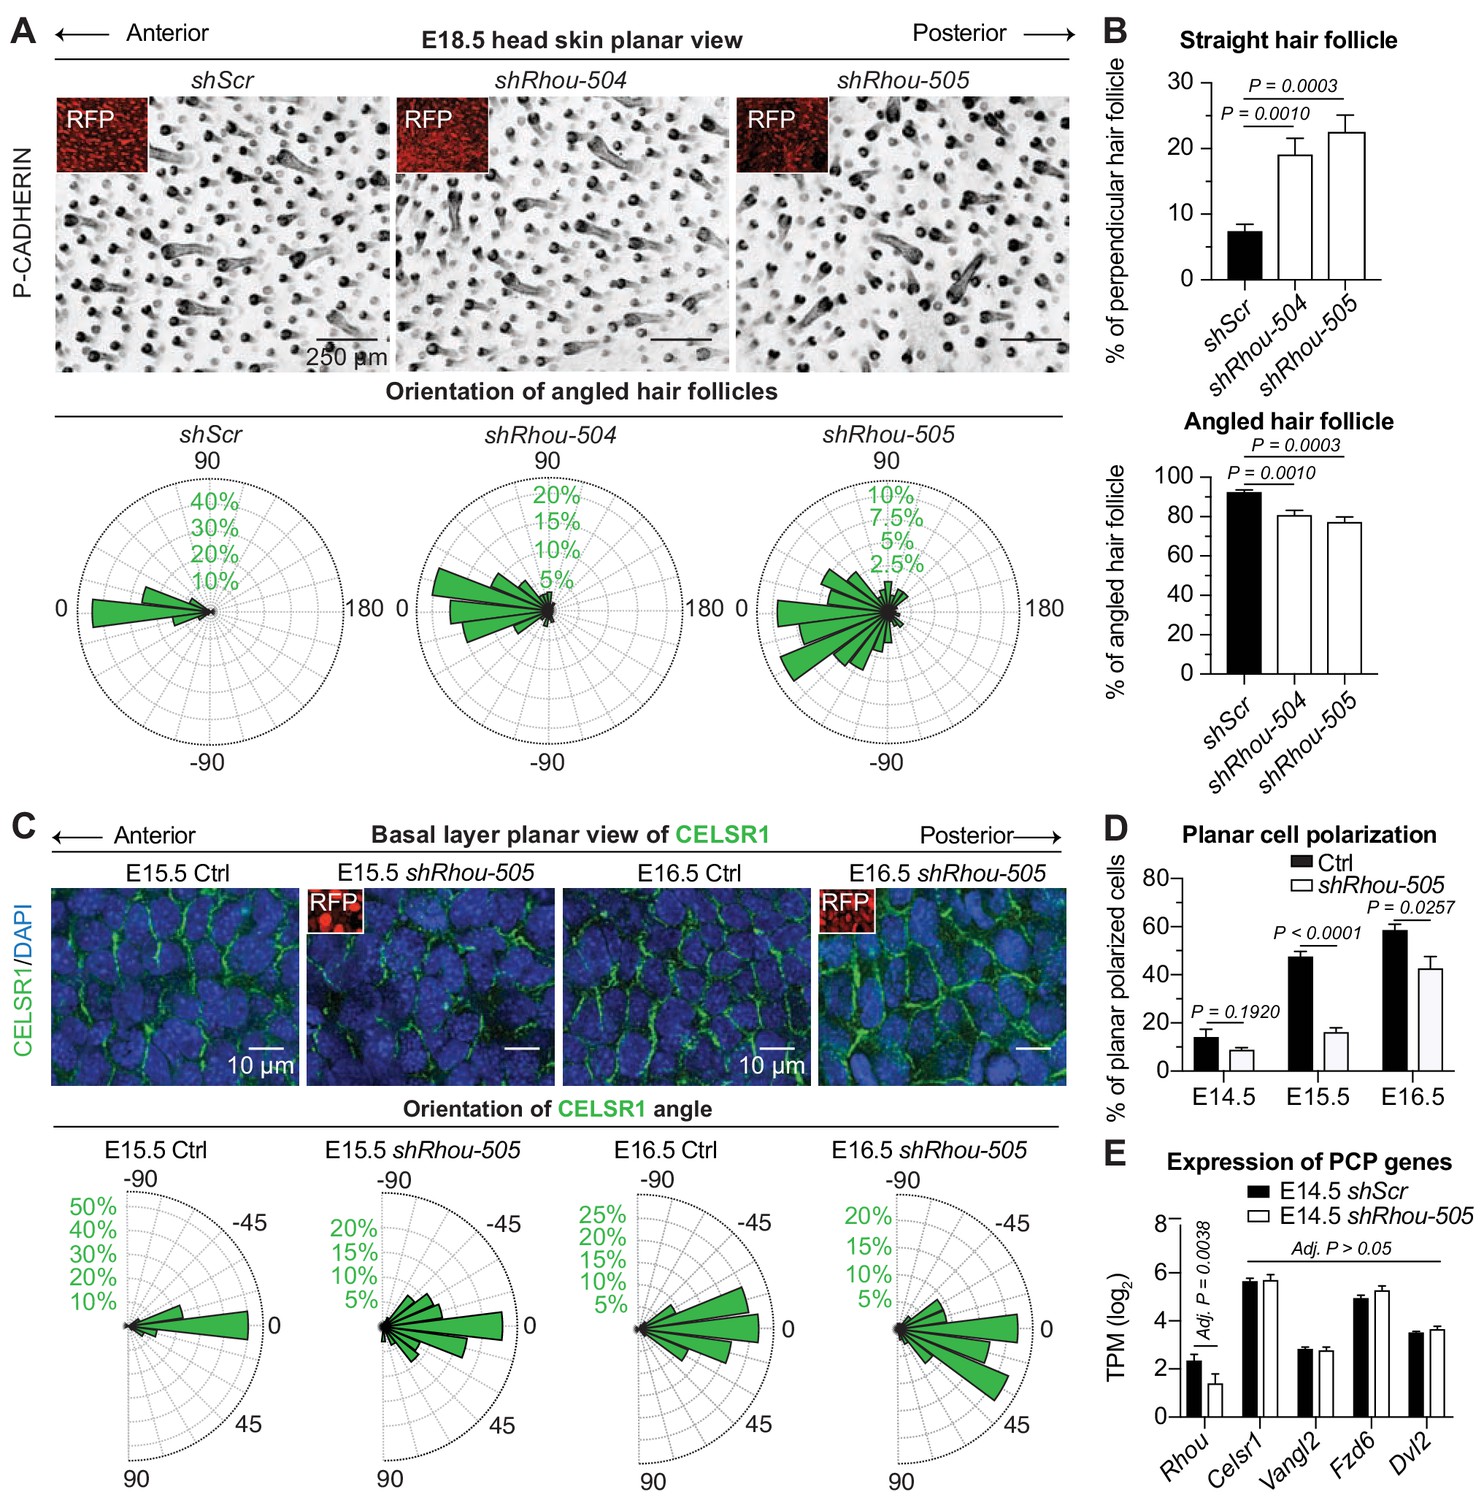
(A) RHOU-depleted skins have misoriented HFs. (Top): Z-projections of planar views from whole-mount P-CADHERIN immunofluorescence of shScr and shRhou-transduced E18.5 head skins. RFP (insets) verifies transduction. Representation of n = 3 embryos per shRNA. Scale bars, 250 μm. (Bottom): Frequency distribution of HF orientations. shScr n = 471 HFs; shRhou-504 n = 470 HFs; shRhou-505 n = 484 HFs from n = 3 embryos. P =< 0.0001 (shScr vs shRhou-504), p<0.0001 (shScr vs shRhou-505) (Kolmogorov-Smirnov test). (B) Quantifications of the average percentage of perpendicular (top panel) and angled (bottom panel) HFs per mouse. shScr n = 527, shRhou-504 n = 407, sRhou-505 n = 552 HFs from n ≥ 3 embryos. Normal distribution of the data was tested using the Shapiro-Wilk test. Parametric independent two-tailed unpaired t-test was used to compare the data. (C,D) Planar cell polarization during skin development. CELSR1 immunofluorescence was used to measure the anterior-posterior polarization of each cell. (C) (Top): Planar views from CELSR1 whole-mount immunofluorescence of transduced E15.5 and E16.5 head skins. Shown are the midplanes of the basal cell layer. Representations from n = 3 embryos per condition. Scale bars, 10 μm. (Bottom): Frequency distribution of the orientation of CELSR1 polarity along the anterior:posterior axis. E15.5 Ctrl = 184, E15.5 shRhou-505 = 81, E16.5 Ctrl = 319 and E16.5 shRhou-505 = 158 cells from ≥3 embryos. p=0.0033 (E15.5 Ctrl vs shRhou-505), P =<0.0001 (E16.5 Ctrl vs shRhou-505). Kolmogorov-Smirnov test was used to compare the distribution. (D) Temporal changes in the percentages of planar polarized cells. Error bars represent SEM from E14.5 n = 3, E15.5 n = 4 and E16.5 n = 4 embryos for each time point;>100 cells per embryo per conditions where analyzed. Normal distribution of the data was tested using the Shapiro-Wilk test. Parametric unpaired two-tailed independent t-test was used to compare the data. (E) Differential gene expression analysis (DESeq2) of transcriptome profiling from E14.5 transduced epidermal cells. Note that shRhou did not affect the levels of core PCP transcripts.
-
Figure 4—source data 1
Source data related to Figure 4A,B,C and D.
- https://doi.org/10.7554/eLife.50226.013
Figure 4—figure supplement 1
RHOU controls the proper shape of early basal epidermal progenitors which in turn is needed for tissue development.
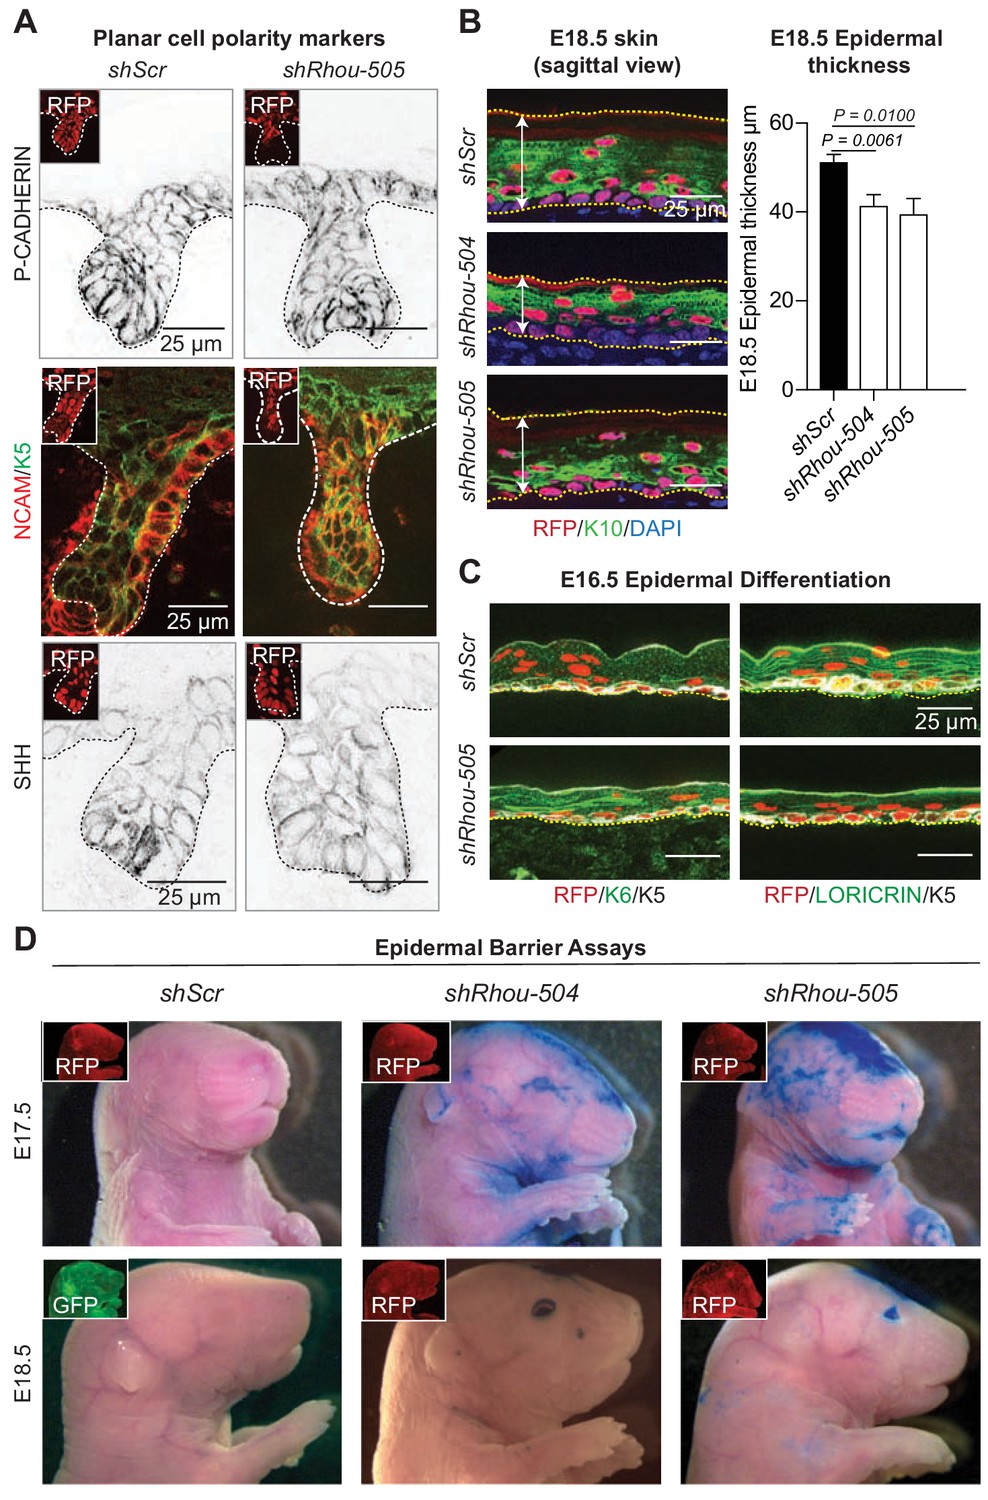
(A) Immunofluoresence of sagittal sections from E18.5 transduced skins showing the lack of polarization of PCP markers (P-CADHERIN, NCAM and SHH). Representation from n = 3 embryos. Scale bars, 25 μm (B) Epidermal thickness is reduced in the absence of RHOU. (Left panel): Immunofluorescence of sagittal sections from E18.5 transduced skins. Scale bars, 25 μm (Right panel): Quantifications of epidermal thickness. Error bars represent SEM from shScr n = 8, shRhou-504 n = 4, shRhou-505 n = 9 embryos. Normal distribution of the data was determined using the Shapiro-Wilk test. Parametric independent two-tailed unpaired t test was used to compare the data. (C) Epidermal differentiation is delayed in the absence of RHOU. Immunofluorescence of sagittal sections from E16.5 transduced skins. RFP insets verify transduction. Representation of n = 3 embryos. (D) Barrier assays on E17.5 and E18.5 transduced animals. RFP and GFP immunofluorescence shows transduction of the animals. Representation of n = 3 embryos per conditions.
Figure 5 with 2 supplements

Functions of RHOU in orchestrating cellular junction dynamics within the developing epidermis.
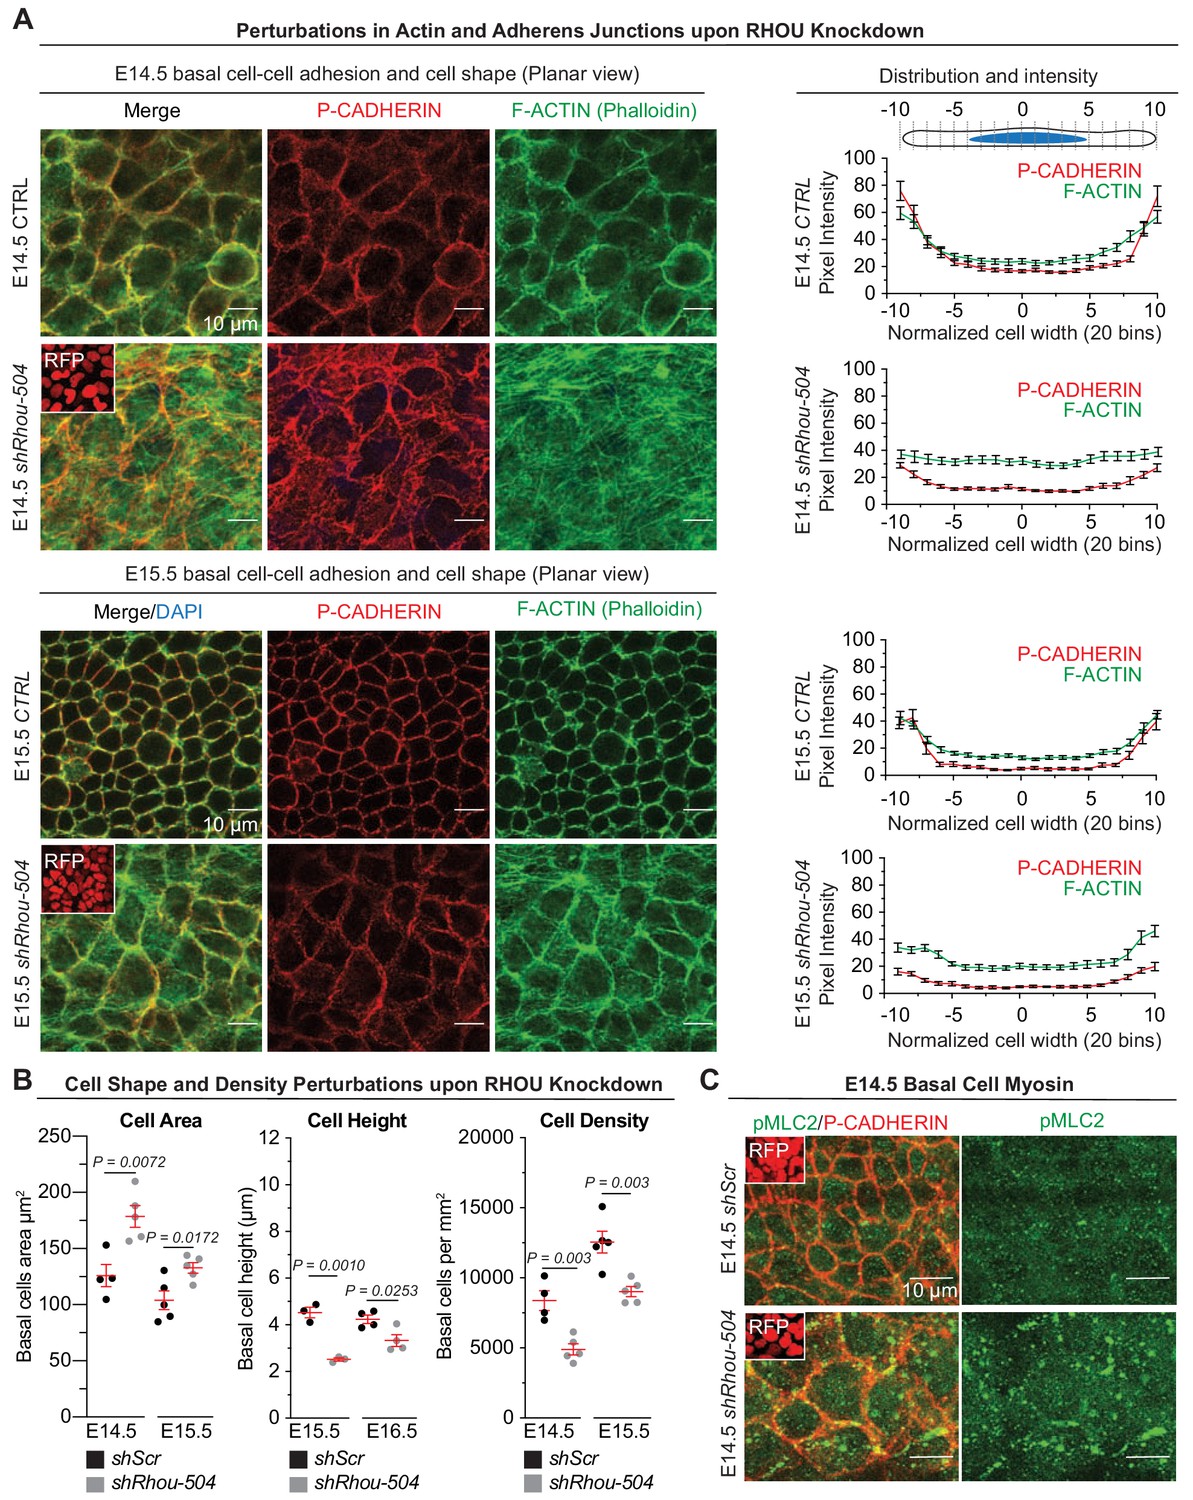
(A) Perturbations in cortical distribution of F-ACTIN and P-CADHERIN upon shRhou knockdown. Planar views from whole-mount immunofluorescence of transduced E14.5 (Top) and E15.5 (Bottom) head skins. P-CADHERIN marks adherens junctions, Phalloidin marks F-ACTIN, RFP verifies transduction. Shown are representative images from the midplanes of the basal cell layers. Representation of n = 3 embryos. Scale bars, 10 μm. (Right) Pixel intensity measurements across the diameter of basal progenitors. Note the broader distribution of P-CADHERIN and the increase intensity of F-ACTIN in the cytoplasm of shRhou-transduced cells. (B) Cell measurements reveal perturbations upon Rhou knockdown in the area, height and density of basal progenitors within the epidermal plane. For cell area, error bars represent SEM from E14.5 shScr n = 6, E14.5 shRhou-505 n = 7, E15.5 shScr n = 6 and E15.5 shRhou-505 n = 7 embryos. Normal distribution of the data was determined using the Shapiro-Wilk test. Parametric unpaired independent two-tailed t-test was used to compare the data. For quantifications of basal cell height, error bars represent SEM from E15.5 shScr n = 5, E15.5 shRhou-505 n = 5, E16.5 shScr n = 4 and E16.5 shRhou-505 n = 4 embryos. Normal distribution of the data was determined using the Shapiro-Wilk test. Parametric unpaired independent two-tailed t-test was used to compare the data. For quantifications of basal cell densities, error bars represent SEM from E14.5 shScr n = 7, E14.5 shRhou-505 n = 6, E15.5 shScr n = 5 and E15.5 shRhou-505 n = 5 embryos. Normal distribution of the data was determined using the Shapiro-Wilk test. Parametric unpaired independent two-tailed t-test was used to compare the data. (C) RHOU depletion increases the level of Myosin II light chain phosphorylation. Planar views from whole-mount immunofluorescence of transduced E14.5 skins. P-CADHERIN and pMLC2 immunofluorescence. RFP verifies transduction. Shown are representative images from the midplanes of the basal cell layers from n = 3 embryos. Scale bars, 10 μm.
-
Figure 5—source data 1
Source data related to Figure 5A and B.
- https://doi.org/10.7554/eLife.50226.017
Figure 5—figure supplement 1
RHOU depletion via shRhou-504 results in analogous defect in orchestrating cellular junction dynamics within the developing epidermis.
(A) Perturbations in cortical distribution of F-ACTIN and P-CADHERIN upon shRhou-504 knockdown. Planar views from whole-mount immunofluorescence of transduced E14.5 (Top) and E15.5 (Bottom) head skins. P-CADHERIN marks adherens junctions, Phalloidin marks F-ACTIN, RFP verifies transduction. Shown are representative images from the midplanes of the basal cell layers. n = 3 embryos. Scale bars, 10 μm. (Right) Pixel intensity measurements across the diameter of basal progenitors. (B) Cell area, height and density measurements reveal perturbations upon RHOU knockdown within the epidermal plane. For quantifications of cell area error bars represent SEM from E14.5 shScr n = 4, E14.5 shRhou-504 n = 5, E15.5 shScr n = 5 and E15.5 shRhou-504 n = 5 embryos. For quantifications of basal cell heights, error bars represent SEM from E15.5 shScr n = 3, E15.5 shRhou-504 n = 3, E16.5 shScr n = 4 and E16.5 shRhou-504 n = 4 embryos. For quantifications of basal cell densities, error bars represent SEM from E14.5 shScr n = 4, E14.5 shRhou-504 n = 5, E15.5 shScr n = 5 and E15.5 shRhou-504 n = 5 embryos. Normal distribution of the data was determined using the Shapiro-Wilk test. Parametric, independant, unpaired two-tailed t-test was used to compare the data. (C) Increase in the phosphorylation of Myosin II light chain upon shRhou-504 knockdown. Planar views from whole-mount immunofluorescence of transduced E14.5 skins. P-CADHERIN and pMLC2 immunofluorescence. RFP verifies transduction. Shown are representative images from the midplanes of the basal cell layers. n = 3 embryos. Scale bars, 10 μm.
Figure 5—figure supplement 2

RHOU regulates epidermal cell adhesion and junction dynamics.
(A) Formation of adherens junctions is delayed in the absence of RHOU. Primary mouse keratinocytes transfected with shRNAs were cultured in low-Ca2+ (growth) media, which prevents adherens junction formation. Cultures were switched to high-Ca2+ (differentiation) media to induce adherens junction formation. Cultures were immunolabeled for E-CADHERIN. DAPI denotes nuclei. Note that without RHOU, the active formation of adherens junction, which requires associated actin dynamics (Vasioukhin et al., 2000) is impaired. At later times, passive adherens junction formation not requiring actin dynamics still occurs. (B–D) RHOU regulates focal adhesion dynamics. Cultured primary keratinocytes transfected with shRNAs were plated for 24 hr on fibronectin before being processed for immunofluoresce microscopy. (B) Representative immunofluorescence images for each condition from n = 3 experiments. Note that F-ACTIN stress fibers, stained by phalloidin, are accentuated and focal adhesions are enlarged when RHOU is depleted. Both are indicative of a reduction in focal adhesion dynamcis. (C) Quantifications of focal adhesion areas as measured by VINCULIN immunolabeling. Error bars shows SEM from shScr n = 2196, shRhou-504 n = 2046 and shRhou-505 n = 1792 focal adhesions from three independent experiments. Parametric unpaired independant two-tailed t-test. (D) Quantifications of focal adhesion lengths as measured by VINCULIN immunolabeling. Error bars show SEM from shScr n = 2196 shRhou-504 n = 2046 and shRhou-505 n = 1792 focal adhesions from three independent experiments. Parametric, unpaired independant two-tailed t-test.
Figure 6 with 2 supplements
RHOU as a coordinator of cell-cell and cell-substratum junctions.
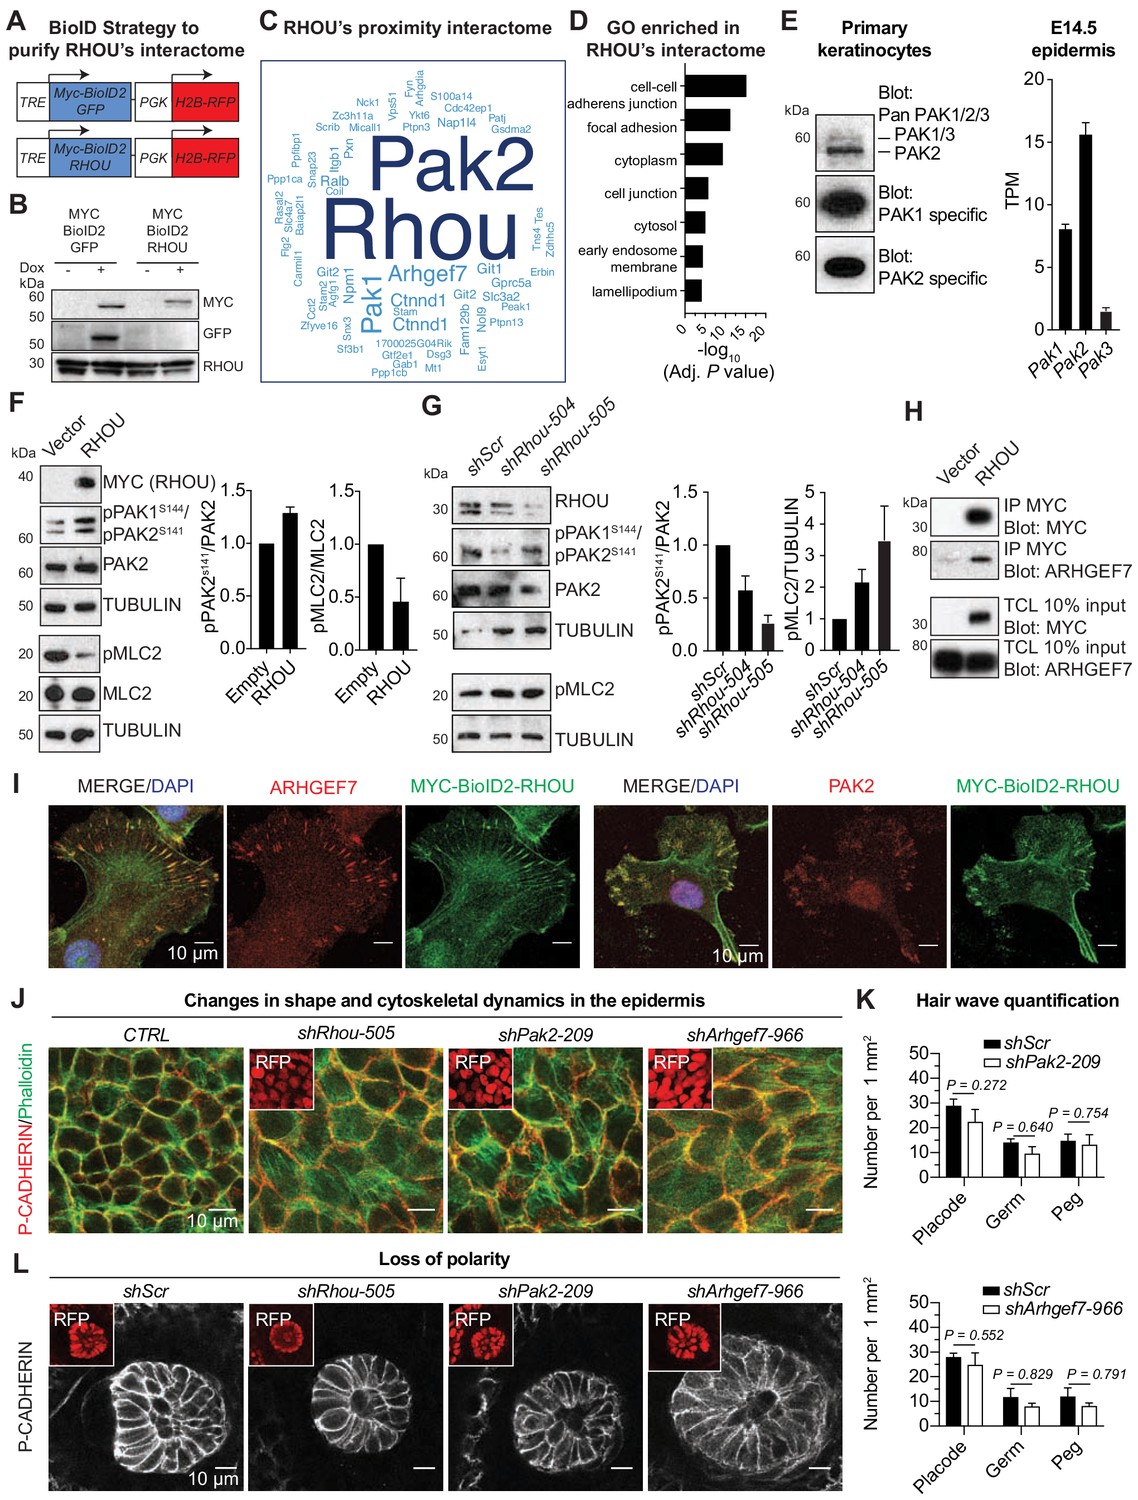
(A) BioID2 constructs used to generate stably transduced lines from primary Krt14-rtTA mouse keratinocytes. TRE, tetracycline regulatory element used with a minimal promoter to drive expression of MYC-BioID2-GFP or MYC-BioID2-RHOU proteins. PGK, constitutively active promoter, used to drive expression of H2B-RFP to mark transduced cells. (B) Immunoblot of lysates from Krt14rtTA+ keratinocytes transduced with Tre-Myc-BioID2-GFP-pgk-H2B-RFP or Tre-Myc-BioID2-Rhou-pgk-H2B-RFP lentiviruses and then treated for 2 days with doxycycline. Immunoblots were probed with MYC, GFP and RHOU antibodies. (C) Cloud analysis representing RHOU’s proximity interactome. Font size represents frequency of most abundant proteins in the interactome. (D) Gene ontology (GO) analysis reveals a significant enrichment for ‘cell-cell adherens junction’ and ‘focal adhesion’ proteins in RHOU’s proximity interactome. (E) Of the three PAK family members, PAK2 is the most highly expressed at both protein (left) and transcript (right) levels in primary keratinocytes and epidermis. (Left): Immunoblot of lysates from Krt14rtTA+ mouse keratinocytes showing the higher expression of PAK2. Immunoblots were probed with a PAN PAK1/2/3, a specific PAK1 and a specific PAK2 antibody. (Right): Transcriptome profiling from E14.5 transduced epidermal cells revealed Pak2 as the most highly expressed Pak1/2/3 gene. (F) Overexpression of RHOU promotes PAK2 activation and decreases phosphorylation of MLC2. (Left): Primary keratinocytes were transfected with either empty vector or Myc-Rhou. Immunoblot of lysates were probe with MYC, pPAK1Ser144/pPAK2Ser141, PAK2, pMLC2, MLC2 and TUBULIN antibodies. (Right): Quantification of protein lysates. Data are represented as SEM from n = 3 experiments. (G) Depletion of RHOU reduces the activation of PAK2 and promotes the phosphorylation of MLC2. Primary keratinocytes were transfected with shScr, shRhou-504 or shRhou-505. Immunoblots of lysates were probed with RHOU, pPAK1Ser144/pPAK2Ser141, PAK2, pMLC2 and TUBULIN antibodies. (Right): Quantification of protein lysates. Data are represented as SEM from n = 3 experiments for PAK2 level of phosphorylation and n = 4 for pMLC2 level of phosphorylation. (H) ARHGEF7 co-immunoprecipitates (co-IP) with MYC-RHOU in primary keratinocytes. Immunoblot of lysates and co-IP transfected with either an empty vector or Myc-Rhou. Immunoblots were probed with MYC and ARHGEF7 antibodies. (I) Immunofluorescence showing the co-localization of MYC-BioID2-RHOU with ARHGEF7 and PAK2 at focal adhesions in primary keratinocytes. Scale bars, 10 μm (J–L) Similarities between RHOU, PAK2 and ARHGEF7 deficiency phenotypes in skin. (J) Planar views from whole-mount immunofluorescence of transduced E15.5 headskin epidermis. P-CADHERIN marks adherens junctions; Phalloidin marks F-ACTIN; RFP verifies transduction. Shown are representative images from the midplanes of the basal cell layers. Representation from n = 3 embryos. Scale bars, 10 μm. (K) Quantifications of the numbers of placodes, germs and pegs from the different staggered HF waves in shScr, shPak2-209 and shArhgef7-966 transduced E16.5 head skin. Error bars represent SEM from shScr for Pak2 n = 5, shPak2-209 n = 5, shScr for Arhgef7 n = 4 and shArhgef7 n = 4 embryos. Normal distribution of the data was tested using the Shapiro-Wilk test. Parametric independent unpaired two-tailed t-test was used except for the comparison of shScr germ vs shArhgef7 germ and shScr peg vs shArgef7 peg for which a Mann-Whitney test was used. (L) Planar view of P-CADHERIN immunofluoresence of transduced hair peg imaged at the midplane and showing the loss of planar polarized distribution in the absence of RHOU, PAK2 and ARHGEF7. Representation from n = 3 embryos. Scale bars, 10 μm.
-
Figure 6—source data 1
Source data related to Figure 6F,G and K.
- https://doi.org/10.7554/eLife.50226.021
Figure 6—figure supplement 1
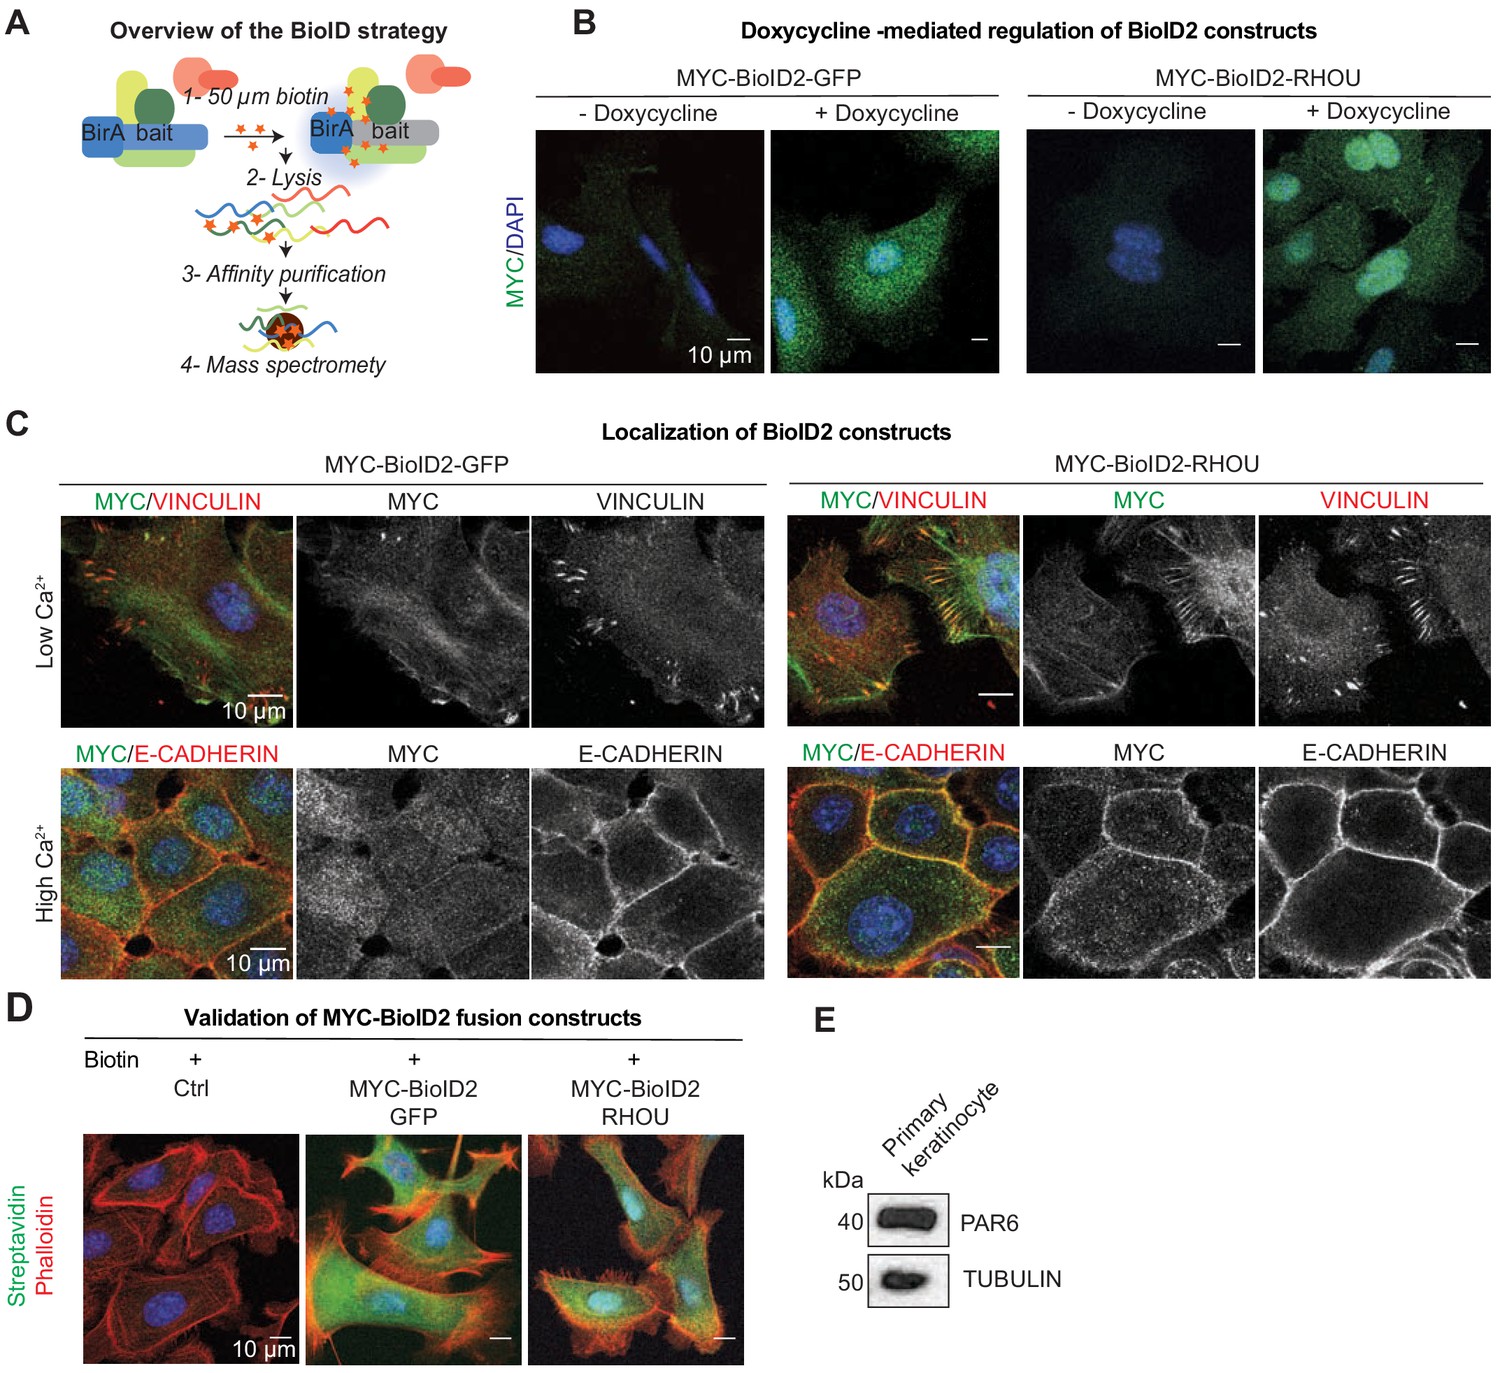
Overview of BioID strategy and validation of fusion constructs.
(A) Overview of BioID purification strategy. (B) MYC-BioID2-GFP and MYC-BioID2-RHOU are induced upon doxycycline treatment for 1 day. Representative MYC immunofluorescence on primary keratinocytes transduced with the BioID2 fusion constructs. Scale bars, 10 μm. (C) MYC-BioID2-RHOU localize to focal adhesions as marked by VINCULIN in growth conditions (Low Ca2+) and is relocated at adherens junction as marked by E-CADHERIN upon keratinocytes differentiation (High Ca2+). Representation of MYC, VINCULIN and E-CADHERIN immunofluorescence on primary keratinocytes transduced with the BioID2 fusion constructs. Scale bars, 10 μm. (D) MYC-BioID2-GFP and MYC-BioID2-RHOU are able to induce byotinilation of protein in cells in the presence of biotin. Representative immunofluorescence of Streptavidin and Phalloidin on primary keratinocytes transduced with the BioID2 fusion constructs. Scale bars, 10 μm. (E) Immunoblot of lysates from Krt14rtTA+ keratinocytes showing expression of PAR6 in these cells. Immunoblots were probed with PAR6 and TUBULIN antibodies.
Figure 6—figure supplement 2

Similarities between RHOU, PAK2 and ARHGEF7 deficiency phenotypes in skin.
(A) qPCR analyses in mouse keratinocytes validate shRNA mediated knockdown of Arhgef7. Error bars represent SEM from n = 8 experiments. Normal distribution of the data was tested using the Shapiro-Wilk test. Parametric paired two-tailed t-test was used to compare the data. (B) Pixel intensity measurements across the diameter of basal progenitors. Note the broader distribution of P-CADHERIN and the increase intensity of F-ACTIN in the cytoplasm of shRhou, shPak2 and shArhgef7-transduced cells.
Figure 7 with 1 supplement
Functional implications of RHOU in cellular shape dynamics involved in hair follicle morphogenesis.
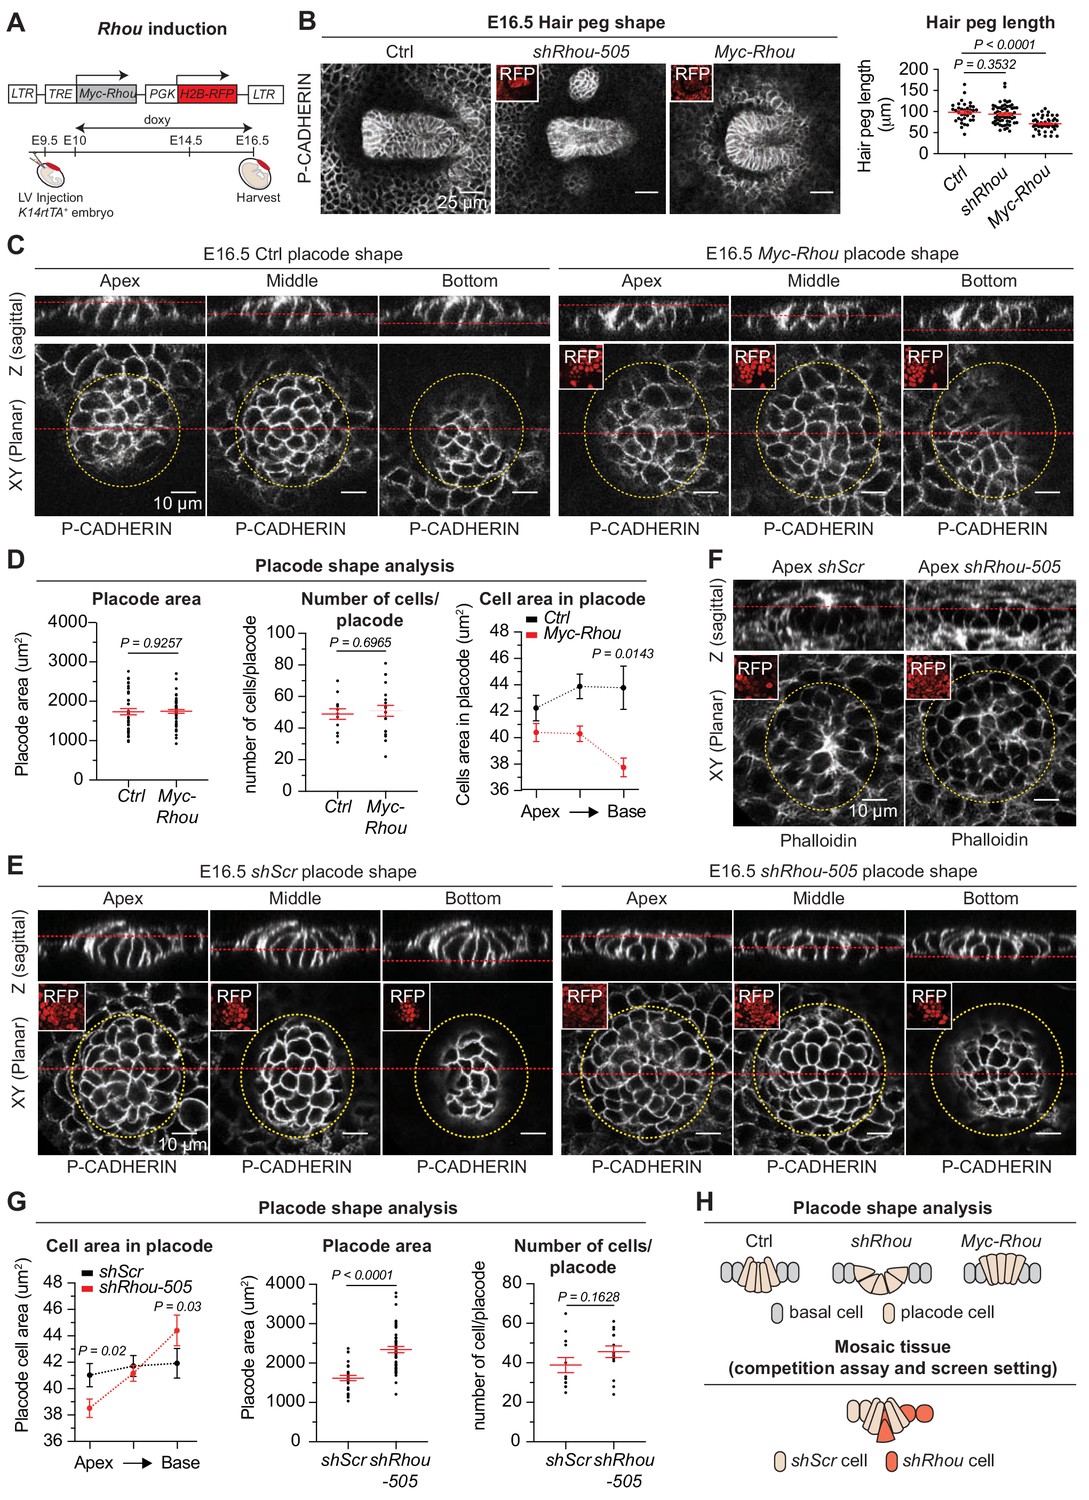
(A) Strategy to induce Rhou expression in embryonic skin. (B) Sustained RHOU in developing HFs perturbs their downgrowth. (Left panel): Planar views from whole-mounts of E16.5 Ctrl, shRhou and Myc-Rhou transduced hair pegs. Representation of n > 3 embryos. Scale bars, 25 μm. (Right panel): Quantification of hair peg length. Error bars represent SEM from E16.5 Ctrl n = 36, shRhou-505 n = 58 and Myc-Rhou n = 50 hair pegs from ≥3 embryos. Normal distribution of the data was tested using the Shapiro-Wilk test. Parametric independent two-tailed unpaired t-test was used to compare the data. (C) Perturbations in placode shape upon RHOU overexpression. Views from whole-mount of E16.5 Ctrl and Myc-Rhou transduced placodes at the indicated representative plane. Representation of n = 3 embryos. In all images, RFP insets verify transduction of the tissue. Scale bars for all images, 10 μm. (D) Placode shape analysis. (Left panel): Quantification of placode areas. Error bars represent SEM from E16.5 Ctrl n = 39 and Myc-Rhou n = 49 placodes from >3 embryos. Normal distribution of the data was tested using the Shapiro-Wilk test. Parametric unpaired two-tailed t-test was used to compare the data. (Middle panel): Quantifications of the number of cells per placode. Error bars represent SEM from E16.5 Ctrl n = 12 and Myc-Rhou n = 20 placodes from >3 embryos Normal distribution of the data was determined using the Shapiro-Wilk test. Parametric unpaired two-tailed t-test was used to compare the data. (Right panel): Quantifications of the cell area in placodes at the indicated plane. Error bars represent SEM from E16.5 Ctrl Top n = 453, Ctrl Middle n = 443, Ctrl Bottom n = 396, Myc-Rhou Top n = 1053, Myc-Rhou Middle n = 1111 and Myc-Rhou Bottom n = 1026. Normal distribution of the data was determined using the Shapiro-Wilk test. Nonparametric unpaired two-tailed Mann Whitney test was used to compare the data. Note the marked reduction in the basal surface of RHOU-sustained placode cells. (E) Cellular remodeling in the early steps of HF morphogenesis is perturbed in the absence of RHOU. Views from whole-mount immunofluorescence of transduced placodes at the indicated representative plane. Representation of n > 3 embryos. (F) F-ACTIN (as detected by Phalloidin) is normally enriched at the placode apex, but is perturbed in the absence of RHOU. Views from whole-mount of transduced placodes. Representation of >3 embryos. (G) Placode shape analysis. (Left panel): Quantifications of the cell areas within the placodes at the indicated planes. Error bars represent SEM from E16.5 shScr Top n = 491, shScr Middle n = 467, shScr Bottom n = 449, shRhou-505 Top n = 627, shRhou-505 Middle n = 685 and shRhou-505 Bottom n = 506 of the cells from >3 embryos. Normal distribution of the data was determined using the Shapiro-Wilk test. Nonparametric unpaired two-tailed Mann-Whitney test was used to compare the data. (Middle panel): Quantifications of the placode area reveals a broadening of shRhou-transduced placodes. Error bars represent SEM from E16.5 shScr n = 31 and shRhou-505 n = 48 placodes from n = 4 embryos. Normal distribution of the data was determined using the Shapiro-Wilk test. Parametric unpaired two-tailed t-test was used to compare the data. (Right panel): Quantifications of the numbers of cells per placode. Error bars represent SEM from E16.5 shScr n = 12 and shRhou-505 n = 15 placodes from n > 3 embryos. Normal distribution of the data was tested using the Shapiro-Wilk test. Parametric unpaired two-tailed t-test was used to compare the data. (H) Model for how the natural changes in RHOU expression during HF morphogenesis drive the cell shape dynamics needed for invagination and downgrowth (top) and how in a mosaic setting as it is the case in our screen RHOU-depleted cells might have an advantage (bottom).
-
Figure 7—source data 1
Source data related to Figure 7B,D and G.
- https://doi.org/10.7554/eLife.50226.024
Figure 7—figure supplement 1
Schematic representation of RHOU’s role during skin morphogenesis.
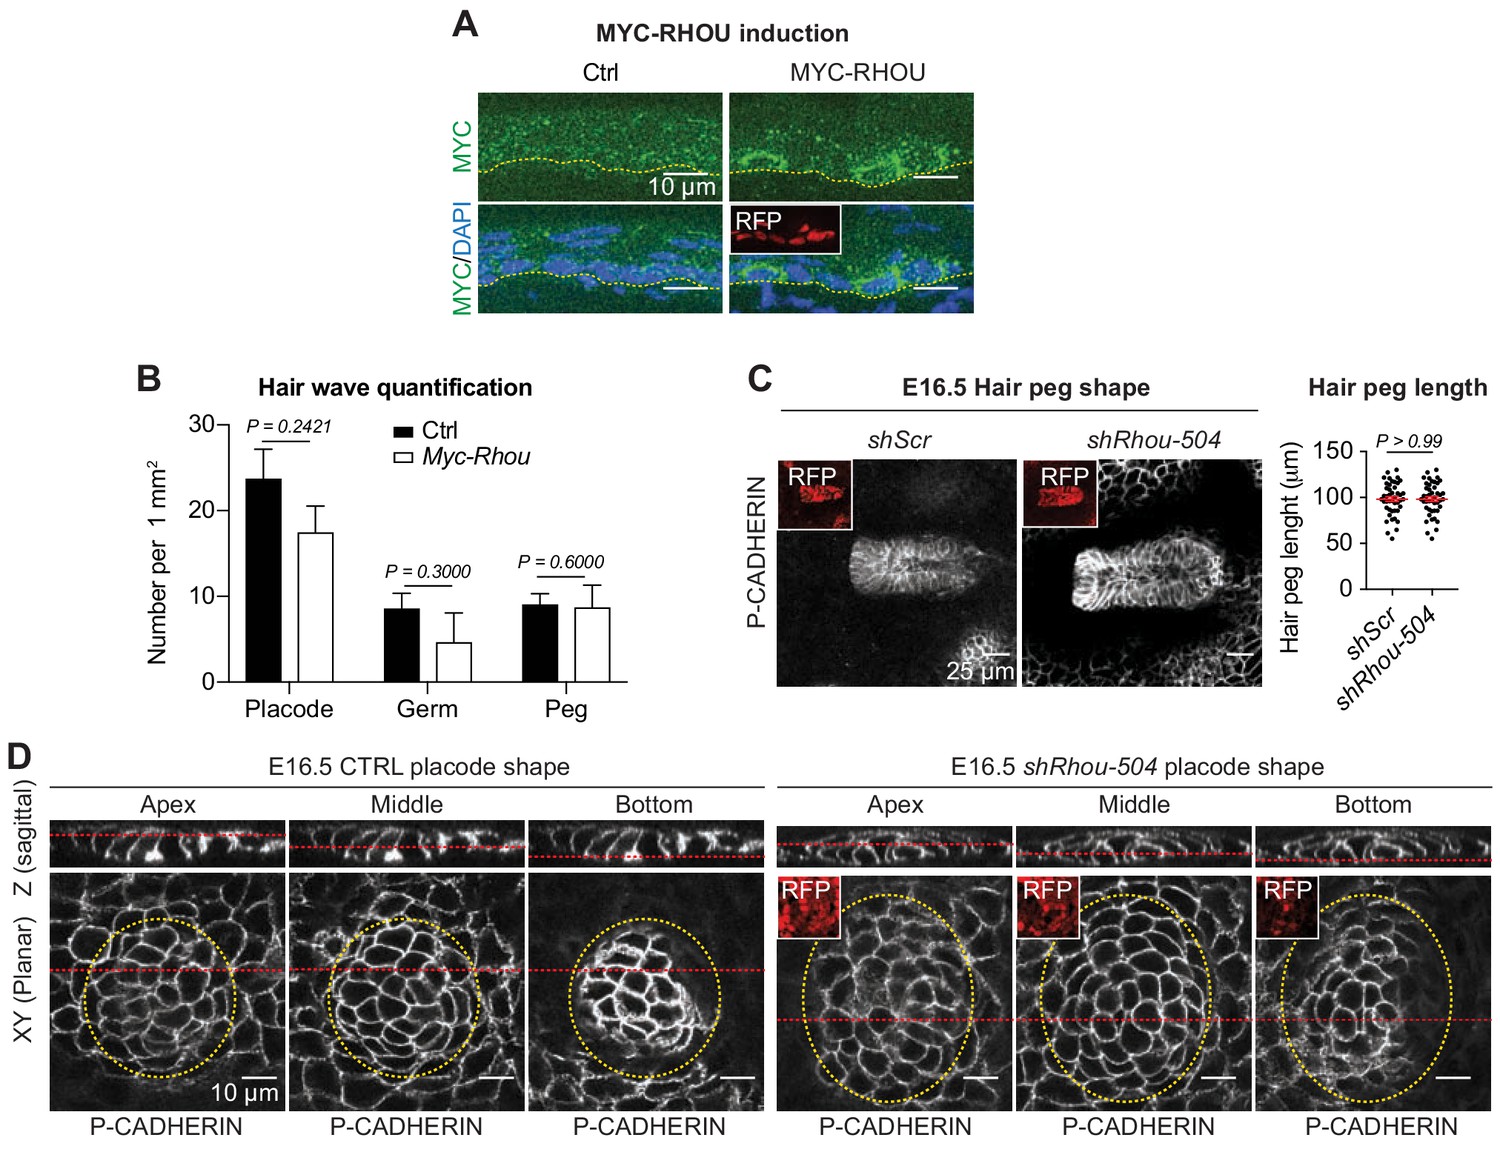
(A) Immunofluorescence of sagittal sections from E16.5 Ctrl and transduced skins showing induction of MYC-RHOU expression. (B) Quantifications of the numbers of hair placodes, germs and pegs from the staggered HF waves in Ctrl and Myc-Rhou transduced E16.5 skins. Error bars represent SEM from Ctrl n = 3 and Myc-Rhou n = 3 embryos. Normal distribution of the data was determined using the Shapiro-Wilk test. Parametric unpaired two-tailed t-test was used to compare the placode data. Nonparametric unpaired two-tailed Mann-Whitney tests were used to compare the germ and peg data. (C) RHOU knockdown using shRhou-504 in developing HFs does not perturbs their downgrowth. (Left panel): Planar views from whole-mounts of E16.5 shScr and shRhou-504. Representation of n = 3 embryos. (Right panel): Quantification of hair peg length. Error bars represent SEM from E16.5 shScr n = 45 and shRhou-504 n = 45 hair pegs from three embryos. Data normal distribution was determined using the Shapiro-Wilk test. Paramentric two-tailed unpaired t-test was used to compare the data. (D) RHOU depletion via shRhou-504 results in analogous defects in placode shape. Views from whole-mount immunofluorescence of CTRL and shRhou-504 transduced placodes at the indicated representative plane. Note the larger placode area (dotted yellow line) in RHOU-depleted tissue. Representation of n > 3 embryos.
Figure 8
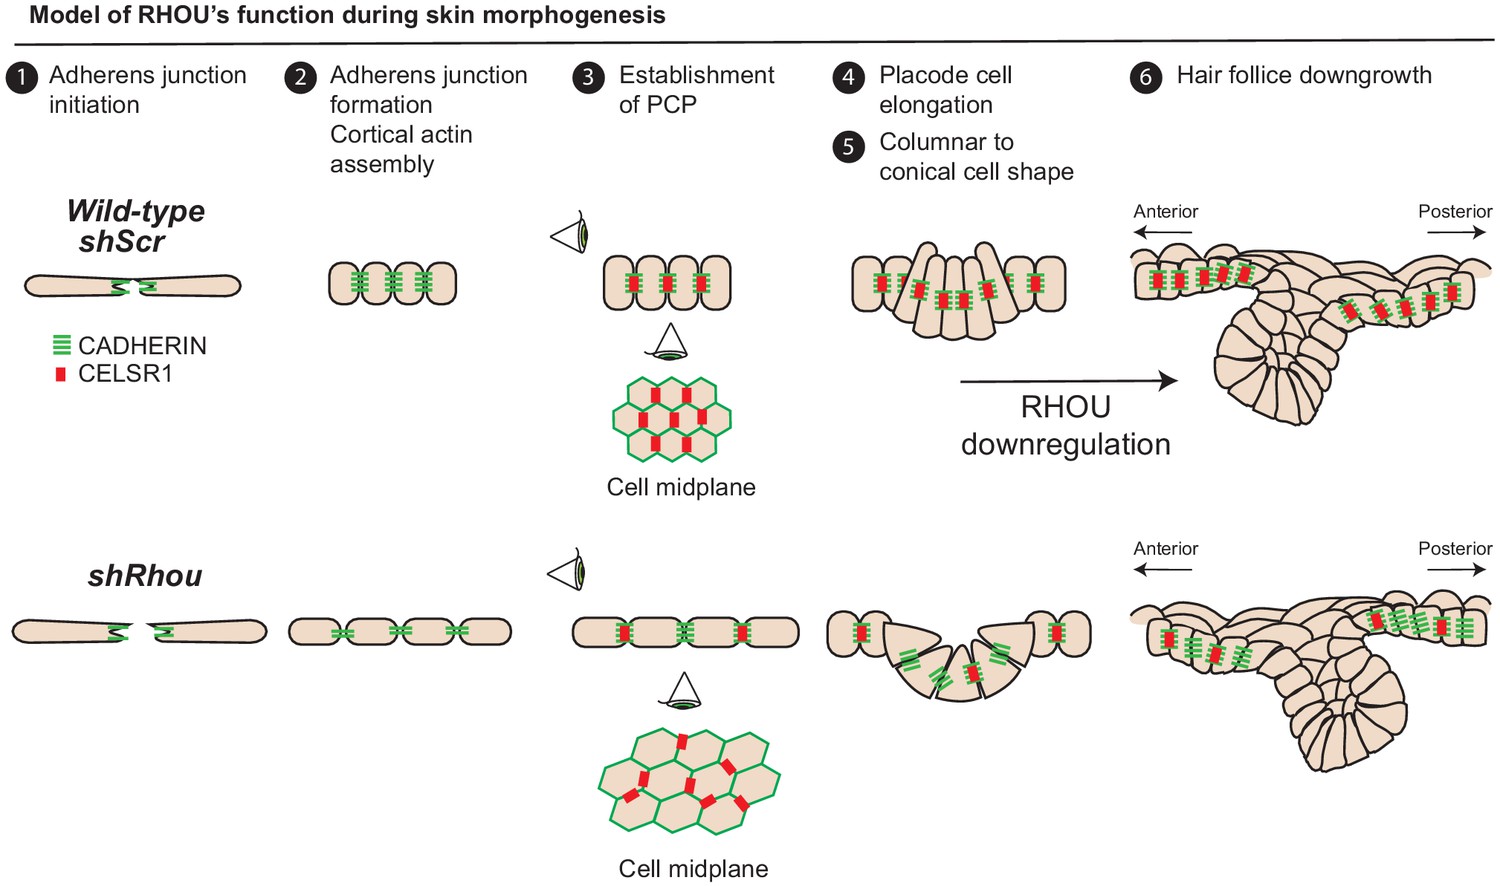
Model of RHOU’s function during skin morphogenesis.
RHOU organizes the cortical actin network and promote adherens junctions formation required to establish CELSR1 and PCP within the basal plane of the epidermis. PCP establishment within the epidermis is required to orient the angling of hair follicle downgrowth. RHOU also binds and orchestrates the localization of a shuttling complex that controls the inverse relation between intercellular adherens junctions and integrin-mediated cell substratum junctions. As such, downregulation of RHOU generates the conical shape (enhanced basal surface and decreased apico-lateral surfaces) required for HF invagination and downgrowth.
Additional files
-
Supplementary file 1
shRNA Library Composition.
- https://doi.org/10.7554/eLife.50226.026
-
Supplementary file 2
Sequence Based Reagents.
- https://doi.org/10.7554/eLife.50226.027
-
Supplementary file 3
Genes With ≥Two shRNAs Showing an Absolute Enrichment or Depletion in The Hair Follicle Fraction.
- https://doi.org/10.7554/eLife.50226.028
-
Supplementary file 4
Genes With ≥Two shRNAs Showing an Absolute Enrichment or Depletion in The Epidermal Fraction.
- https://doi.org/10.7554/eLife.50226.029
-
Supplementary file 5
Genes With ≥Two shRNAs Showing an Absolute Enrichment or Depletion Only in The HF Fraction.
- https://doi.org/10.7554/eLife.50226.030
-
Supplementary file 6
List of RHOU’s Interaction Partner in Growth Conditions.
- https://doi.org/10.7554/eLife.50226.031
-
Supplementary file 7
Key Resources Table.
- https://doi.org/10.7554/eLife.50226.032
-
Transparent reporting form
- https://doi.org/10.7554/eLife.50226.033
Download links
A two-part list of links to download the article, or parts of the article, in various formats.
Downloads (link to download the article as PDF)
Open citations (links to open the citations from this article in various online reference manager services)
Cite this article (links to download the citations from this article in formats compatible with various reference manager tools)
An RNAi screen unravels the complexities of Rho GTPase networks in skin morphogenesis
eLife 8:e50226.
https://doi.org/10.7554/eLife.50226


