Tight bending of the Ndc80 complex provides intrinsic regulation of its binding to microtubules
- University of Washington, United States
Figures
Figure 1 with 3 supplements
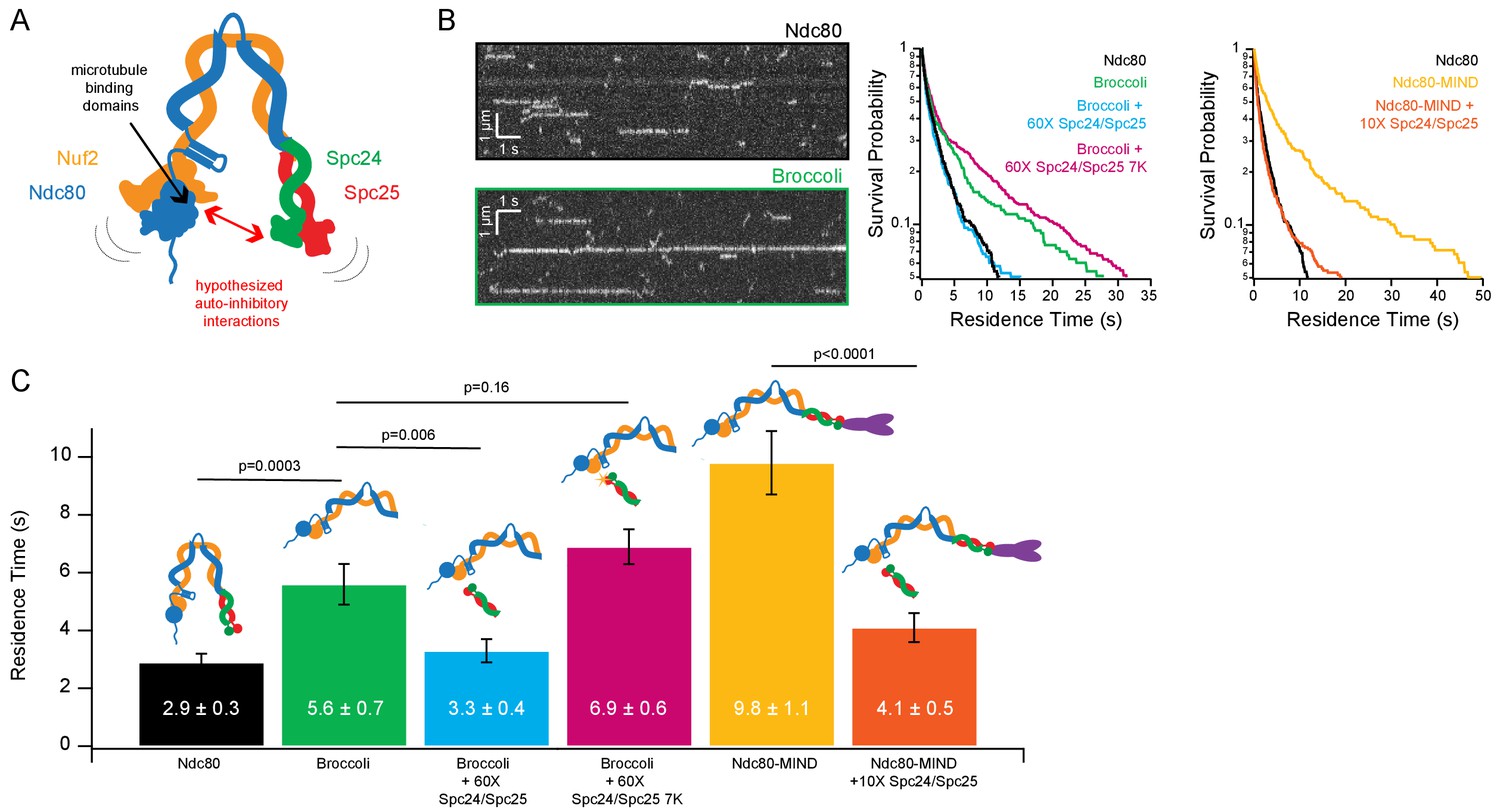
Ndc80 complex microtubule binding is auto-inhibited by the Spc24/Spc25 dimer.
(A) Cartoon of hypothesized model of auto-inhibition of the Ndc80 complex. Red arrow indicates hypothesized regions of intra-complex interactions. Black arrow indicates calponin homology domains on the Ndc80/Nuf2 dimer responsible for microtubule binding. (B) (Left) Representative kymographs of Ndc80 and Broccoli. (Right) Survival probability curves of residence times of the Ndc80 complex (n = 537), Broccoli (n = 315), Broccoli + 60X Spc24/Spc25 (n = 398), Broccoli + 60 x Spc24/Spc25 7K (n = 586) and the Ndc80 complex (repeated), Ndc80-MIND (n = 279), Ndc80-MIND + 10X Spc24/Spc25 (n = 674). (C) Bar graph of average residence times of the data represented in survival probability curves in Figure 1B. Error was calculated using bootstrapping analysis. p-Values were calculated using a two-tailed Student’s t test. Raw data of all residence times are included in Figure 1—source data 1. Additional supplementary data are included in Figure 1—figure supplement 1, Figure 1—figure supplement 2 and Figure 1—figure supplement 3.
-
Figure 1—source data 1
Residence times on microtubules measured for individual complexes of Ndc80, Broccoli, and Ndc80-MIND co-complexes, without and with the addition of Spc24/Spc25 dimer.
- https://doi.org/10.7554/eLife.44489.008
Figure 1—figure supplement 1
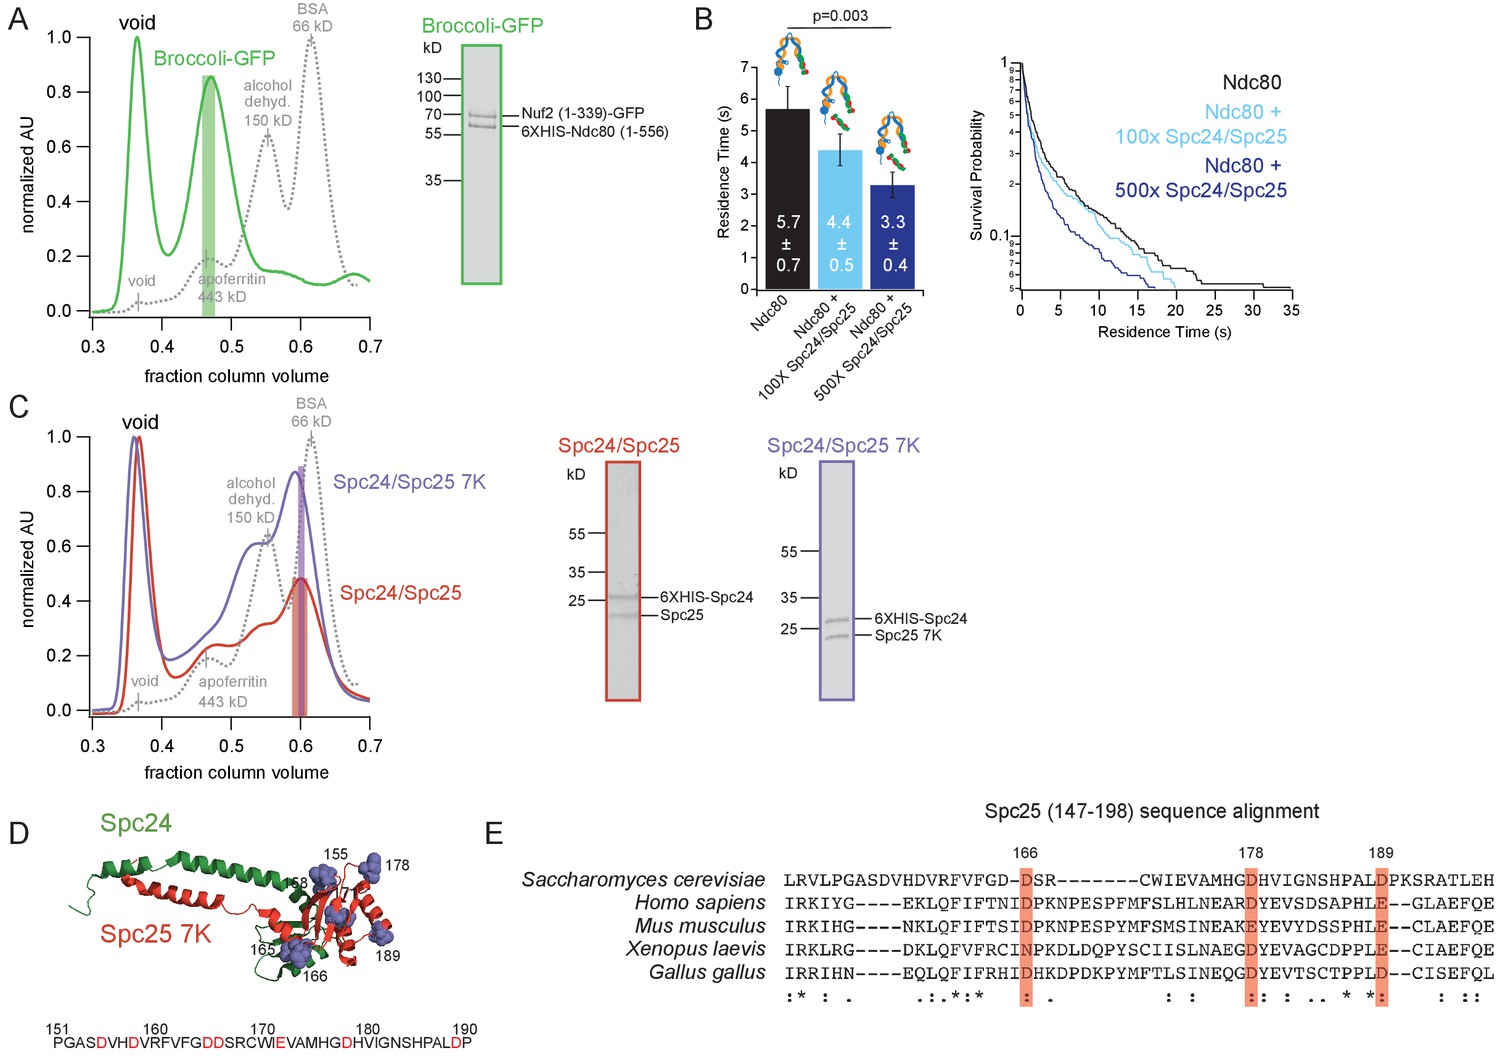
Purifications of Ndc80 complex constructs.
(A) (Left) Representative Superdex 200 16/60 elution profile of Broccoli-GFP, normalized to highest peak. Green bar shows SEC fractions collected. Dotted black line shows elution profile of gel filtration column standards, labeled with protein and size in kilodaltons. (Right) Coomassie blue-stained gel showing Broccoli-GFP. (B) (Left) Bar graph of average residence times of the Ndc80 complex (n = 414), Ndc80 complex +100X Spc24/Spc25 (n = 370) and Ndc80 complex +500X Spc24/Spc25 (n = 472). Error was calculated using bootstrapping analysis. Raw data of all residence times are included in Figure 1—figure supplement 1—source data 1. (Right) Survival probability curves of the data represented in the bar graph to left. (C) (Left) Representative Superdex 200 16/60 elution profiles of Spc24/Spc25 and Spc24/Spc25 7K, normalized to highest peak. Red and purple bar shows SEC fractions collected. Dotted black line shows elution profile of gel filtration column standards, labeled with protein and size in kilodaltons. (Right) Coomassie blue-stained gels showing Spc24/Spc25 and Spc24/Spc25 7K. (D) (Top) Mutations made for Spc24/Spc25 7K shown as lilac space-filling models at position of corresponding amino acid on the structure of the budding yeast Spc24/Spc25 dimer (DOI: 10.2210/pdb5TCS/pdb). (Bottom) Primary sequence of budding yeast Spc25 from amino acid 151 to 190 with residues in red indicating those mutated to lysine. (E). Multiple sequence alignment of Spc25 generated using EMBL-EBI MUSCLE. S. cerevisiae Spc25 primary amino acid sequence shown from 147 to 198, with alignments below. Red bars and amino acid number indicate subset of acidic residues mutated to lysine in D that are highly conserved between organisms. “*” indicates positions with fully conserved residue. “:” indicates conservation between groups of strongly similar properties. “.” indicates conservation between groups with weakly similar properties.
-
Figure 1—figure supplement 1—source data 1
Residences times on microtubules measured for Ndc80 complexes, without and with the addition of a large excess of Spc24/Spc25 dimer.
- https://doi.org/10.7554/eLife.44489.004
Figure 1—figure supplement 2
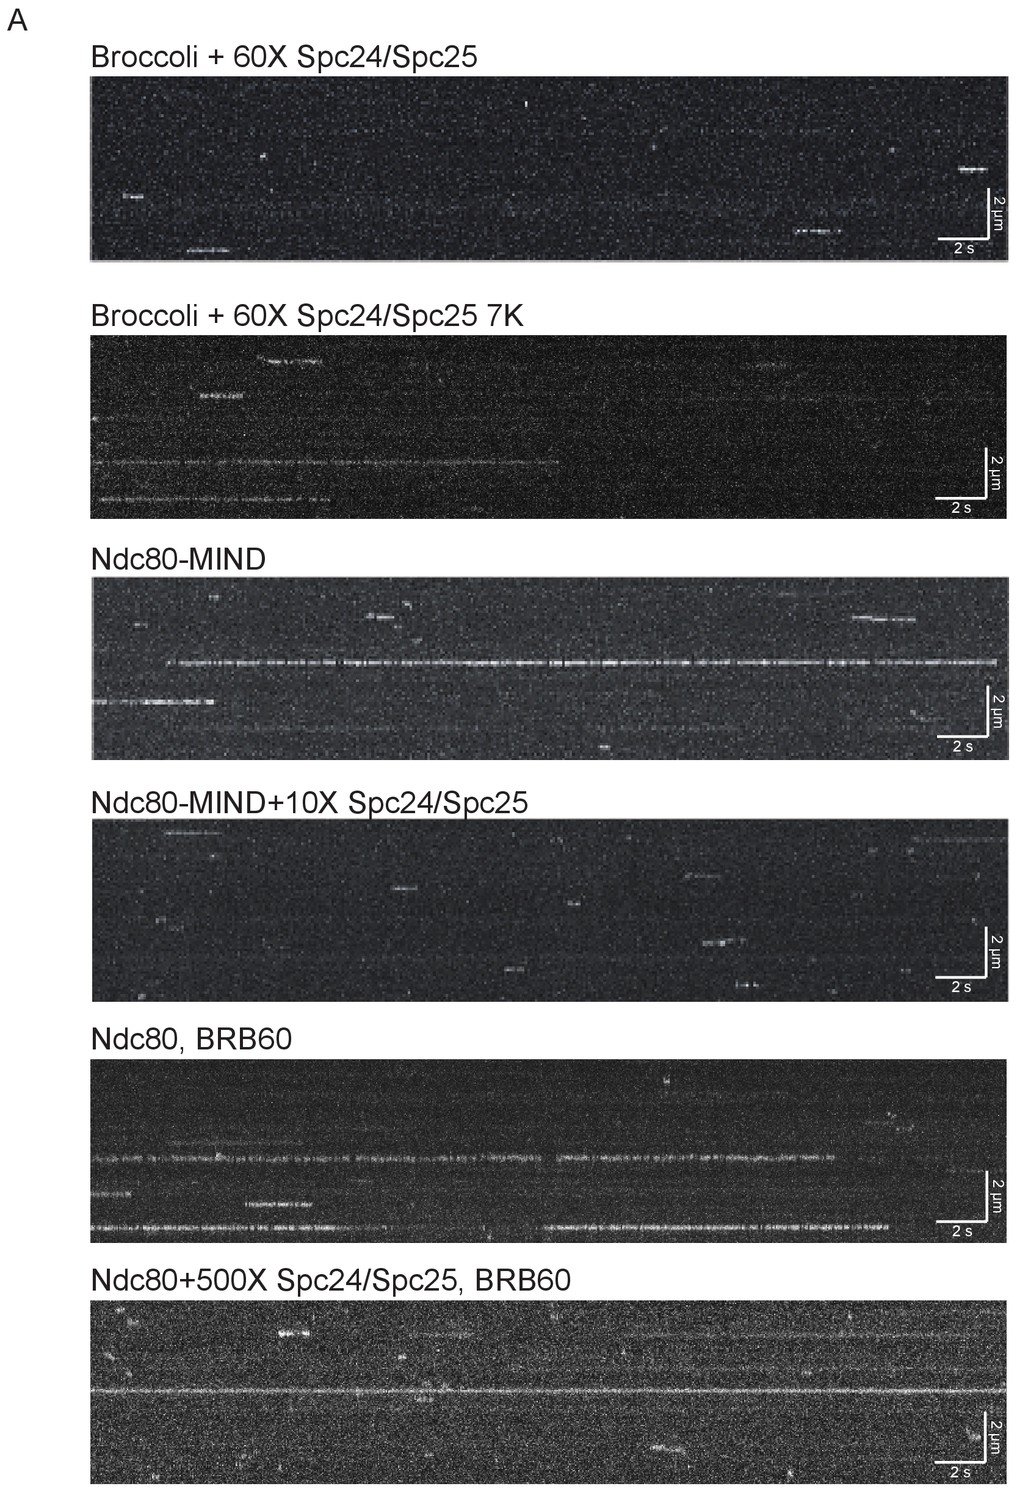
Representative kymographs of TIRF microscopy assays.
(A) Representative kymographs of each condition measured in Figure 1B,C. Brightness and contrast have been adjusted separately for each image for best visualization.
Figure 1—figure supplement 3
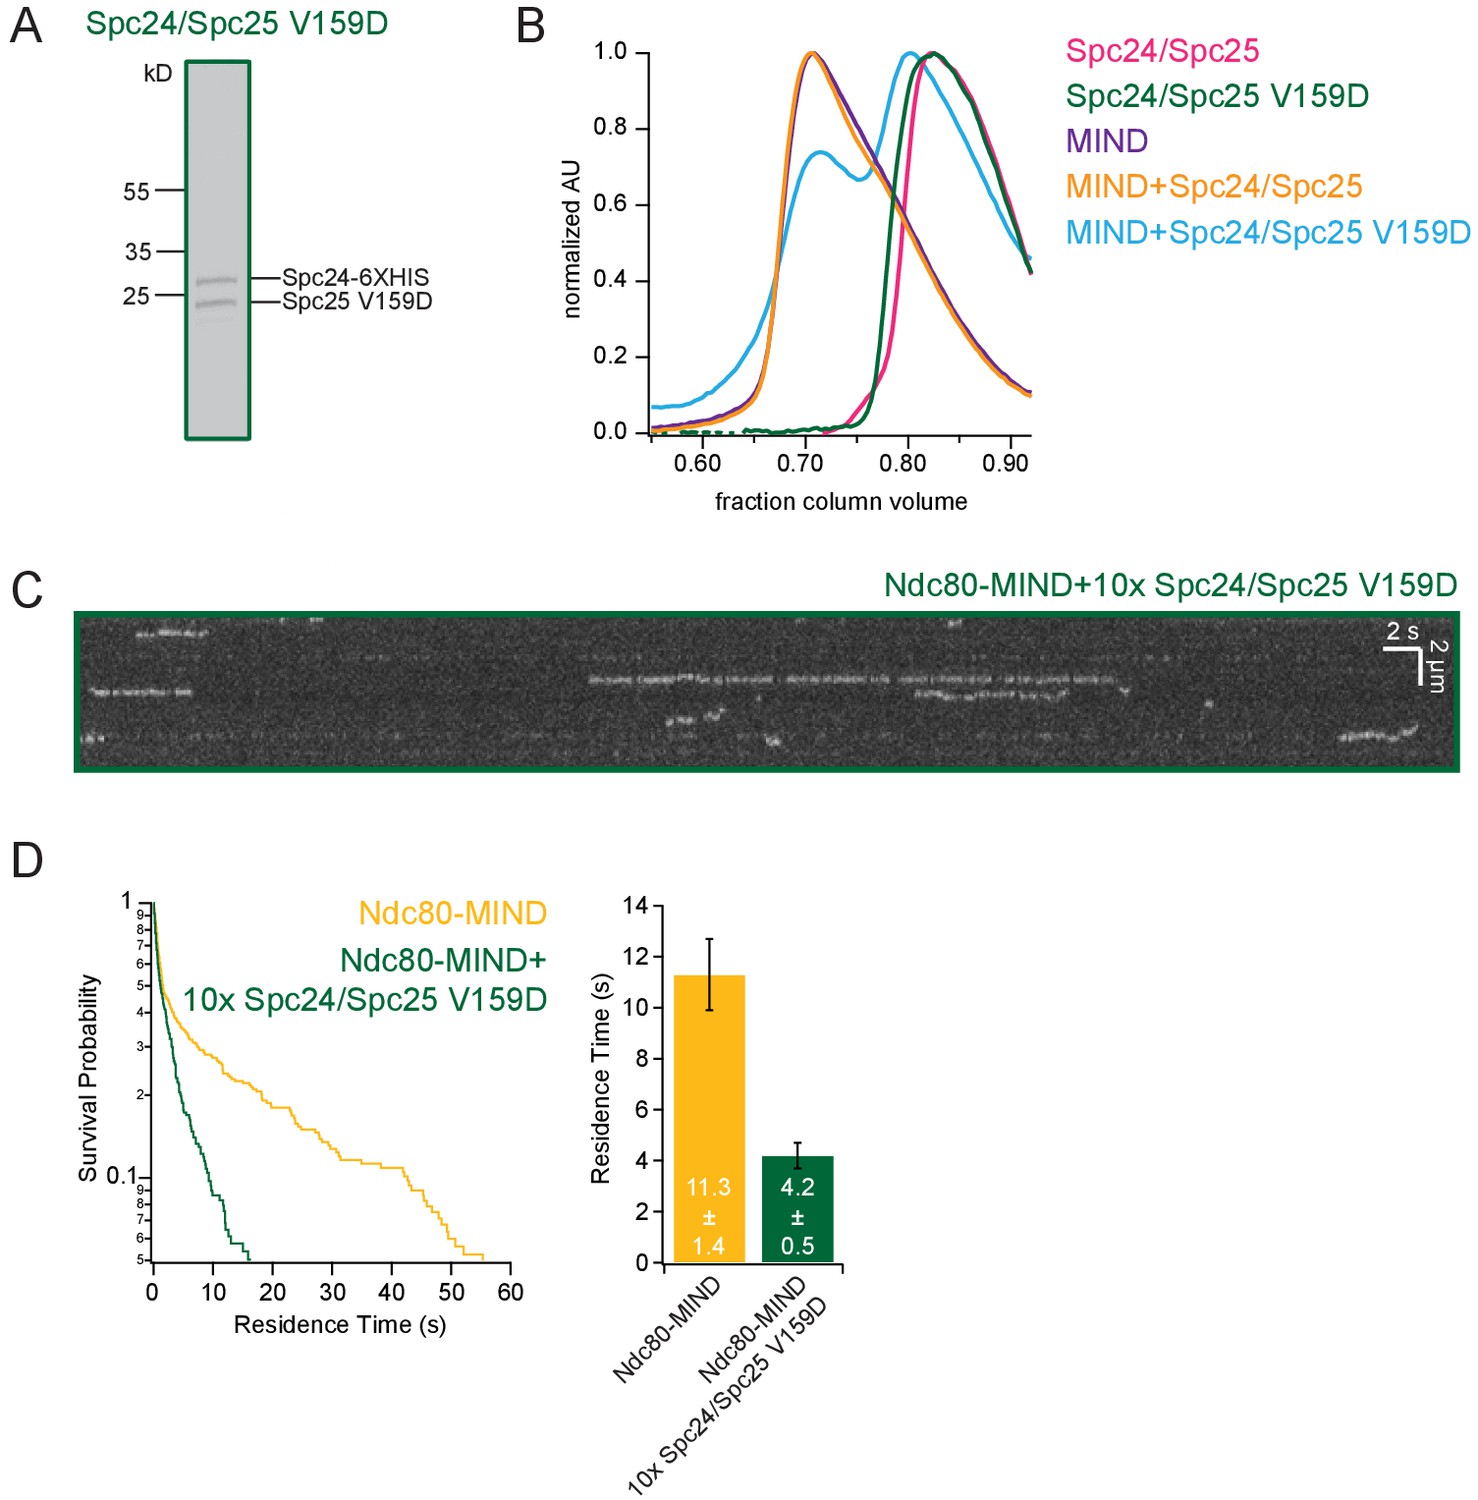
Spc24/Spc25 V159D dimer can inhibit the Ndc80-MIND co-complex.
(A) Coomassie blue-stained gel showing Spc24/Spc25 V159D. (B) Representative Superose 6 increase 3.2/300 elution profile of Spc24/Spc25, Spc24/Spc25 V159D, MIND, MIND +Spc24/Spc25 and MIND +Spc24/Spc25 V159D dimer (both mixed in 1:1 molar ratios), all normalized to highest peak. (C) Representative kymograph of Ndc80-MIND + 10X Spc24/Spc25 V159D dimer. (D) (Left) Survival probability curves of residence times for Ndc80-MIND (technical replicate of data in Figure 1B, n = 267) (yellow trace) and Ndc80-MIND + 10X Spc24/Spc25 V159D (n = 278) (green trace). (Right) Bar graph of average residence times of the data at left. Error was calculated using bootstrapping analysis. Raw data of all residence times are included in Figure 1—figure supplement 3 source data.
-
Figure 1—figure supplement 3—source data 1
Residence times on microtubules measured for individual Ndc80-MIND co-complexes, without and with the addition of mutant Spc24/Spc25 V159D dimer.
- https://doi.org/10.7554/eLife.44489.007
Figure 2 with 1 supplement

The Ndc80 complex can tightly bend.
(A) List of mutations made in the wild type Ndc80 complex to generate cysteine-light construct. (B) Model of the Ndc80 complex using the dwarf tetramer structure (DOI: 10.2210/pdb5TCS/pdb) plus inserted coiled coil between the tetramerization domain and globular domain of each dimer. Break in coiled coil indicates estimated location of Ndc80 loop, indicated by black arrow. Colored balls on each globular domain of the model indicate location of the cysteine residues (Nuf2 S2C, Spc25 S154C) used for dual end-labeling. (C) (Left) Survival probability curves of residence times for Ndc80-GFP (data repeated from Figure 1B) (black trace) and end-labeled Cy5-Ndc80-Cy3 (n = 1375) (pink trace). (Right) Bar graph of average residence times of the data at left. Error was calculated using bootstrapping analysis. p-Value was calculated using a two-tailed Student’s t test. Raw data of all residence times are included in Figure 2—source data 1. (D) Cartoon of approximate dye locations on the Ndc80 complex illustrating that in a more open conformation (Top), FRET would not occur. In a tightly bent conformation (Bottom), the dyes would be in close proximity and exhibit FRET. (E) Bulk FRET spectra of positive control double-stranded, dually-labeled oligonucleotide, negative control single-stranded singly-labeled oligonucleotides or end-labeled Ndc80 complex Nuf2 S2C Spc25 S154C. Displayed is the emission spectra of each construct from 560 nm to 730 nm under 550 nm (Cy3, donor) excitation. Dem and Aem denote the emission peaks of the donor (Cy3) and acceptor (Cy5). Values in parentheses indicate calculated relative FRET efficiency. Additional supplementary data are included in Figure 2—figure supplement 1.
-
Figure 2—source data 1
Residence times on microtubules measured for individual, dual end-labeled Ndc80 complexes.
- https://doi.org/10.7554/eLife.44489.011
Figure 2—figure supplement 1
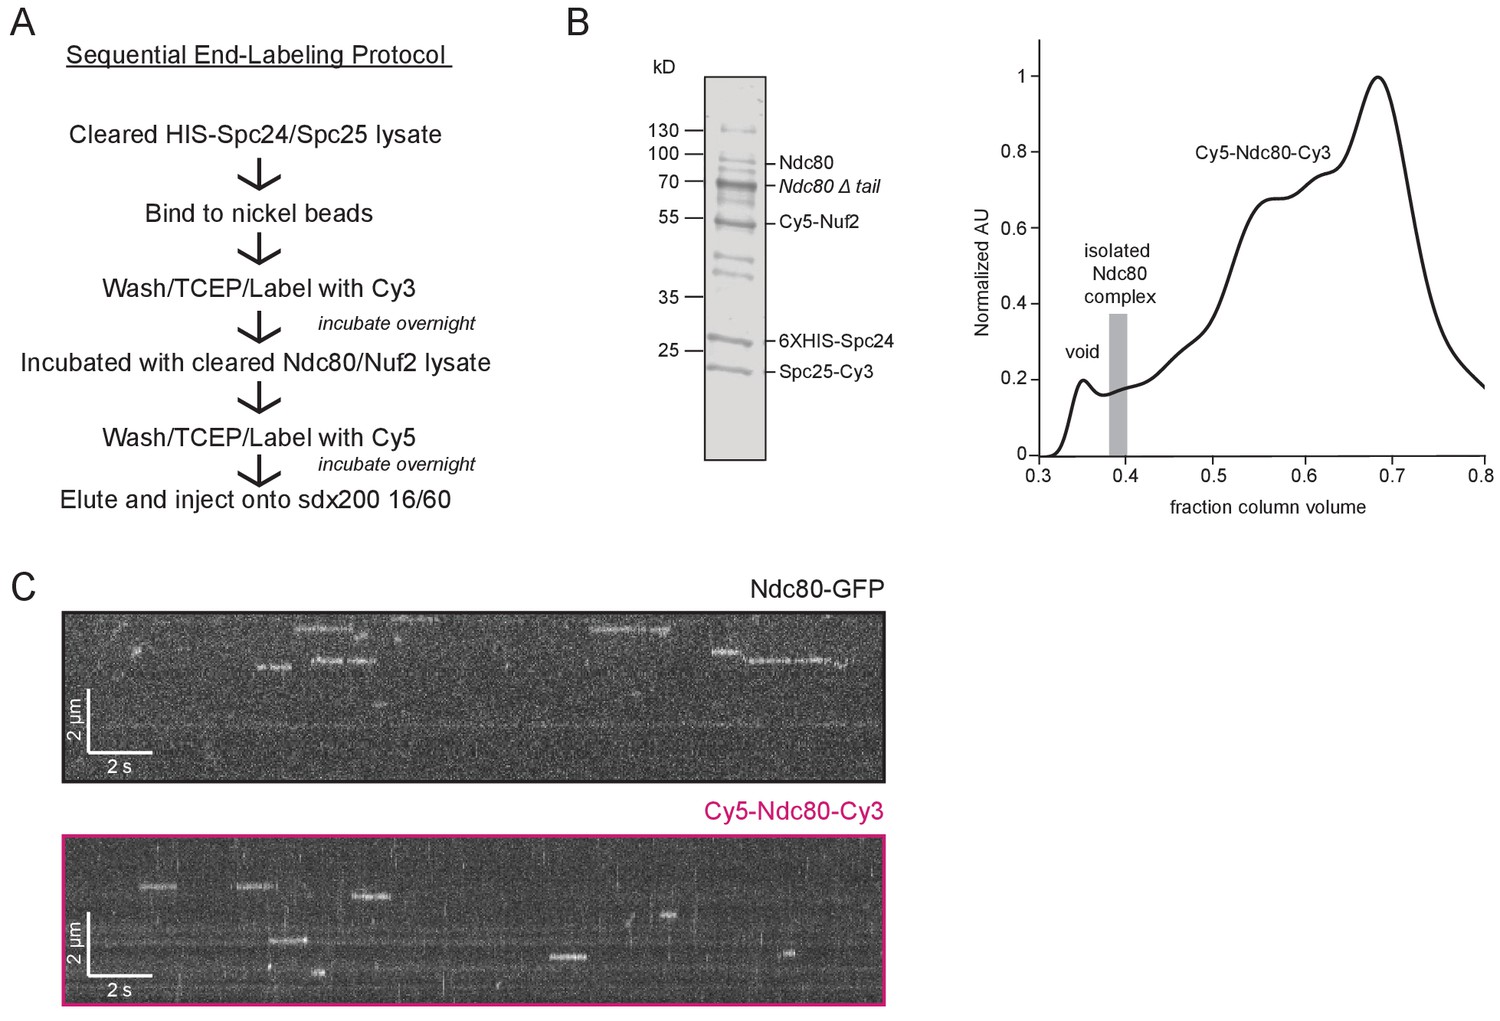
A functional Ndc80 complex can be sequentially end-labeled.
(A) Schematic of sequential end-labeling procotol for the Ndc80 complex used in bulk FRET assay. (B) (Left) Coomassie blue-stained gel showing end-labeled Ndc80 complex used in bulk FRET assay (SEC fraction shown as gray bar in elution profile to the right). Sequential overnight incubation with dyes leads to greater complex degradation, especially of the N-terminal tail on the Ndc80 protein, as seen in gel. (Right) Representative Superdex 200 16/60 elution profiles of end-labeled Ndc80 complex (Nuf2 S2C, Spc25 S154C) (black trace) used in bulk FRET assay normalized to highest peak. Gray bar shows SEC fractions collected. (C) Representative kymographs of Ndc80-GFP (black box) and Cy5-Ndc80-Cy3 (pink box).
Figure 3 with 1 supplement
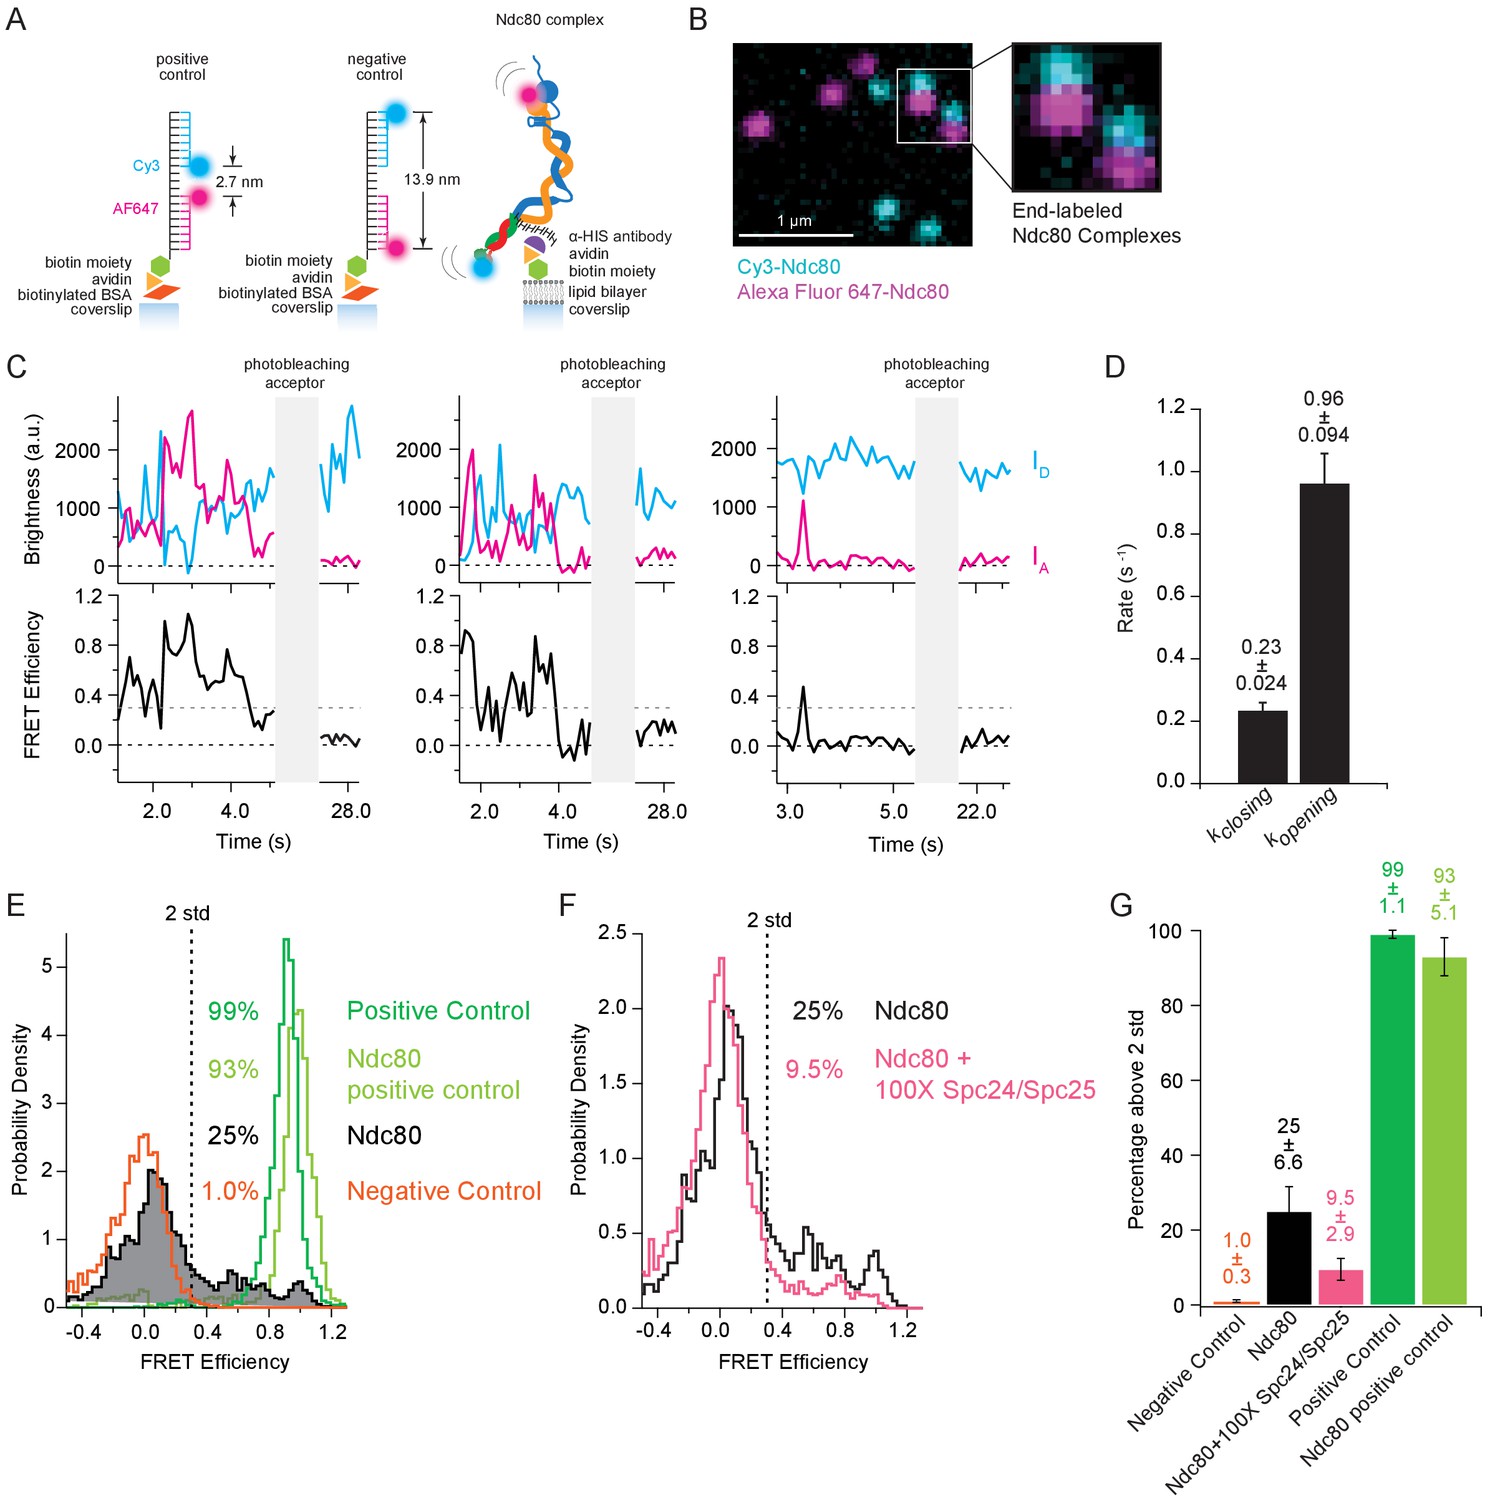
The Ndc80 complex fluctuates between tightly bent and more open conformations.
(A) (Left) Cartoon depicting method of tethering labeled control oligonucleotides to glass coverslip. (Left and middle) Cartoons show the distance in nanometers between FRET pair dyes for positive and negative control oligonucleotides. (Right) Cartoon depicting method of tethering end-labeled Ndc80 complex to coverslip via lipid bilayer. (B) Fluorescence image showing coverslip decorated with end-labeled Ndc80 Nuf2 S2C Spc25 S154C complexes. Zoom-in shows two Ndc80 complexes with both dyes present. Colors are off-set vertically. (C) (Top) Fluorescence traces for three examples of end-labeled Ndc80 complexes (first two panels, Ndc80 Nuf2 S2C Spc24 N185C, last panel Ndc80 Nuf2 S2C Spc25 S154C) before and after acceptor (Alexa Fluor 647) photobleaching. (Bottom) Corresponding traces of FRET efficiency before and after photobleaching acceptor for each top example. Black dotted line indicates 0.0 FRET efficiency. Gray dotted line indicates threshold (0.30) used for two-state thresholding analysis. (D) Bar graph of switching rates calculated for Ndc80 complex Nuf2 S2C Spc25 S154C from a two-state thresholding analysis. Full data set analyzed is included in Figure 3—source data 1. (E) Histograms of FRET values for positive oligonucleotide control (n = 2699, 75 particles), Ndc80 Spc25 S154C G177C-positive control (n = 1275, 60 particles), Ndc80 complex Nuf2 S2C Spc25 S154C (n = 2099, 85 particles) and negative oligonucleotide control (n = 3833, 154 particles). Percentage values represent the percentage of FRET values two standard deviations away from the mean of a Gaussian fit to the negative oligonucleotide data. ‘n’ refers to each 0.1 s FRET measurement for each condition. (F) Histograms of FRET values for Ndc80 complex Nuf2 S2C Spc25 S154C (n = 2099, 85 particles) (repeated from Figure 3E) and Ndc80 complex Nuf2 S2C Spc25 S154C + 100X Spc24/Spc25 (n = 4137, 152 particles). Percentage values represent the percentage of FRET values two standard deviations away from the mean of a Gaussian fit to the negative oligonucleotide data. ‘n’ refers to each 0.1 s FRET measurement for each condition. (G) Bar graph of the percentage of FRET values above two standard deviations away from the mean of a Gaussian fit to the negative oligonucleotide data. Error calculated as standard error of the mean of day to day variability of percentage above two standard deviations. The corrected FRET values included in each FRET efficiency histogram are included in Figure 3—source data 2. Additional supplementary data are included in Figure 3—figure supplement 1.
-
Figure 3—source data 1
Analysis of threshold crossing from records of Ndc80 FRET versus time.
- https://doi.org/10.7554/eLife.44489.015
-
Figure 3—source data 2
All individual FRET values measured for oligonucleotide controls and Ndc80 complexes.
- https://doi.org/10.7554/eLife.44489.016
Figure 3—figure supplement 1
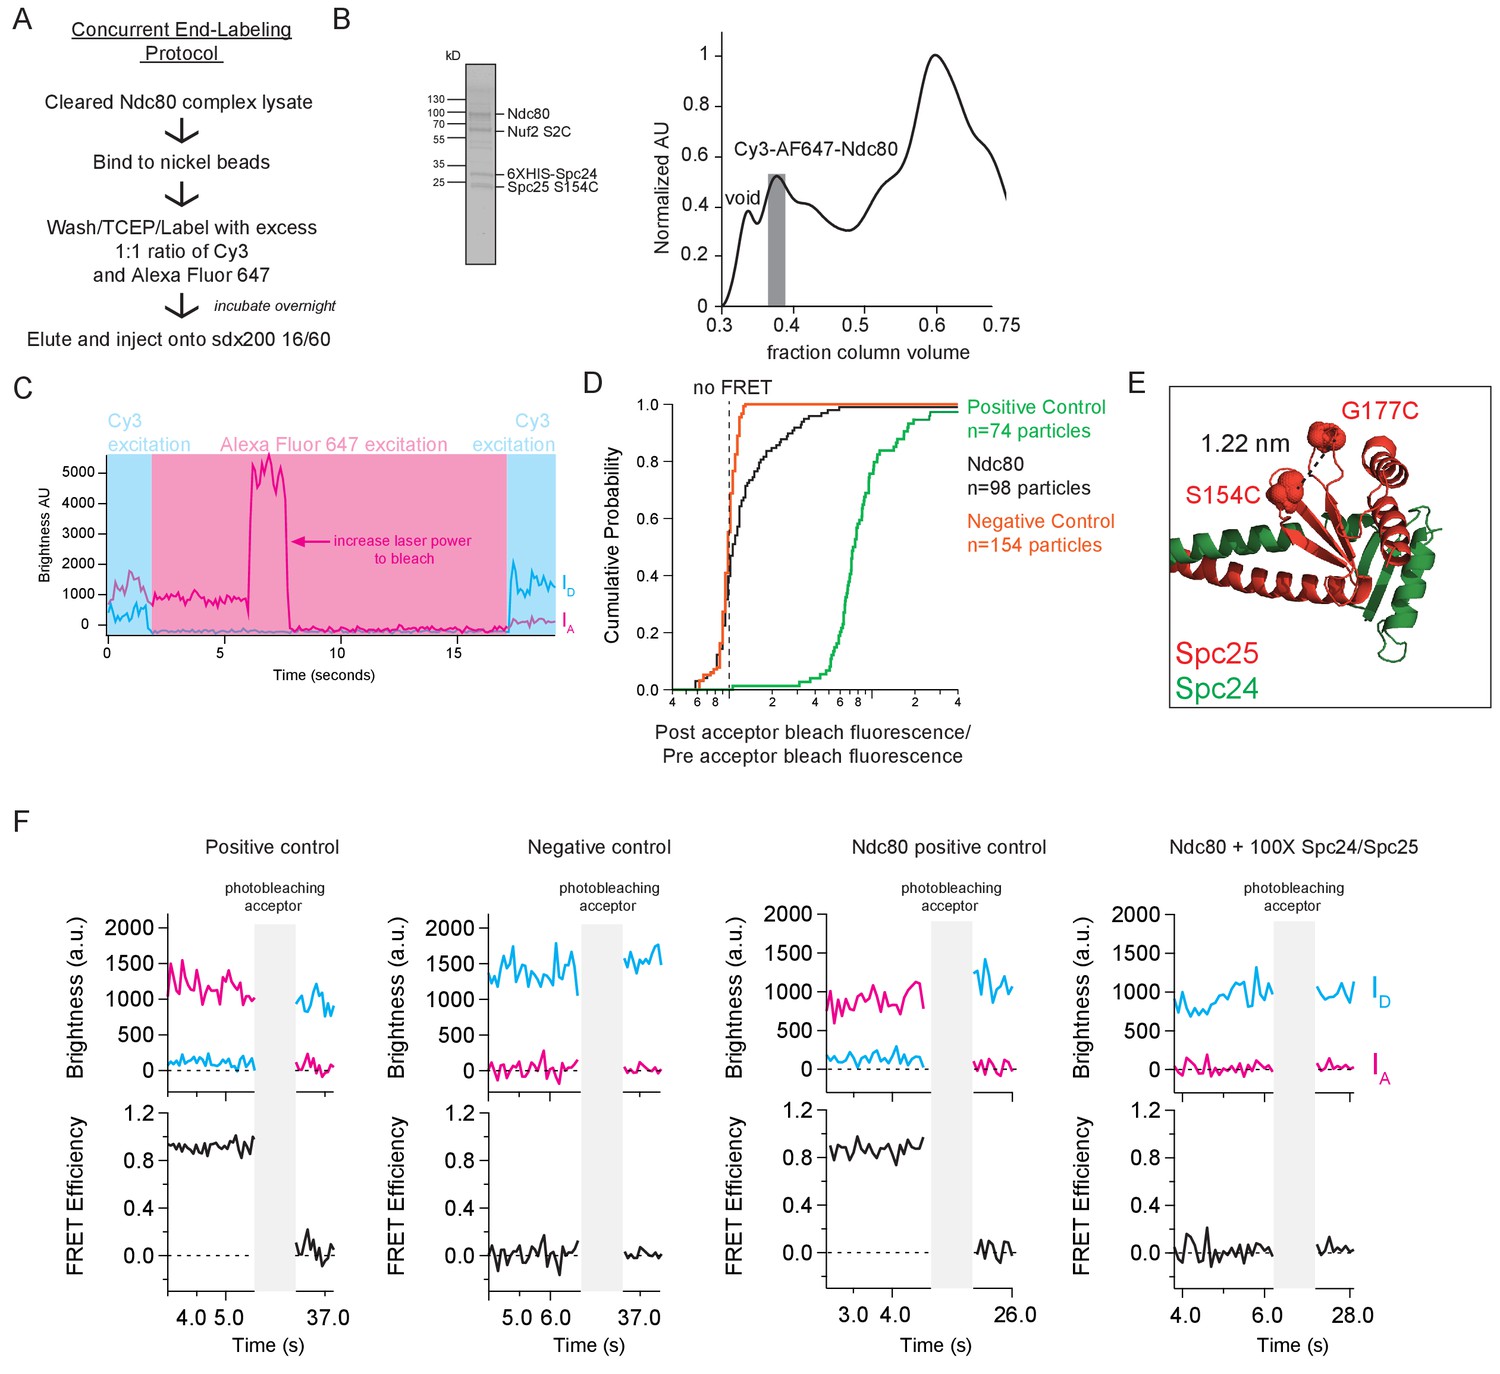
Concurrent labeling of the Ndc80 complex is used for single molecule FRET assays.
(A) Schematic of concurrent end-labeling procotol for Ndc80 complex constructs used in single molecule FRET assays. (B) (Left) Coomassie blue-stained gel showing end-labeled Ndc80 complex used in single molecule FRET assay (SEC fraction shown as gray bar in elution profile to the right) (Right) Representative Superdex 200 16/60 elution profile of end-labeled Ndc80 complex (Nuf2 S2C Spc25 S154C), normalized to highest peak. Gray bar shows SEC fractions collected. (C) Example of acceptor bleaching protocol used for the single molecule FRET assay, with Ndc80 Nuf2 S2C Spc25 S154C exhibiting FRET. After an initial period of donor excitation (light blue box), where direct FRET measurements are gathered, the acceptor is directly excited at the same power as the donor excitation, and then increased to a higher power to bleach (pink box). Finally, the donor is re-excited. Blue line indicates brightness trace of donor, Cy3. Pink line indicates brightness trace of acceptor, Alexa Fluor 647. (D) Cumulative probability curves for positive oligonucleotide control, Ndc80 complex Nuf2 S2C Spc25 S154C and negative oligonucleotide control of ratio of post acceptor beach fluorescence over pre-acceptor bleach fluorescence. Fluorescence values used to calculate ratio are averages of all Cy3 fluorescence values under direct excitation before and after acceptor bleaching. Raw data included in survival probability curves in shown in Figure 3—figure supplement 1—source data 1. (E) Crystal structure of yeast Spc24/Spc25 dimer (DOI: 10.2210/pdb5TCS/pdb). Space-filling model of residues Spc25 154 and Spc25 177 illustrate locations of cysteine mutations made for Ndc80 complex positive control. Dotted lines shows distance in nanometers between the two residues. (F) (Top) Fluorescence traces of one representative example of a positive oligonucleotide control, negative oligonucleotide control, Ndc80 complex positive control (Ndc80 Spc25 S154C G177C) and Ndc80 complex +100X Spc24/Spc25 before and after photobleaching acceptor (Alexa Fluor 647). (Bottom) Corresponding traces of FRET efficiency before and after photobleaching acceptor for each top example.
-
Figure 3—figure supplement 1—source data 1
Ratios of donor emission enhancement after photobleaching the acceptor dyes versus before photobleaching, measured for individual Ndc80 complexes and oligonucleotide control molecules.
- https://doi.org/10.7554/eLife.44489.014
Figure 4 with 2 supplements
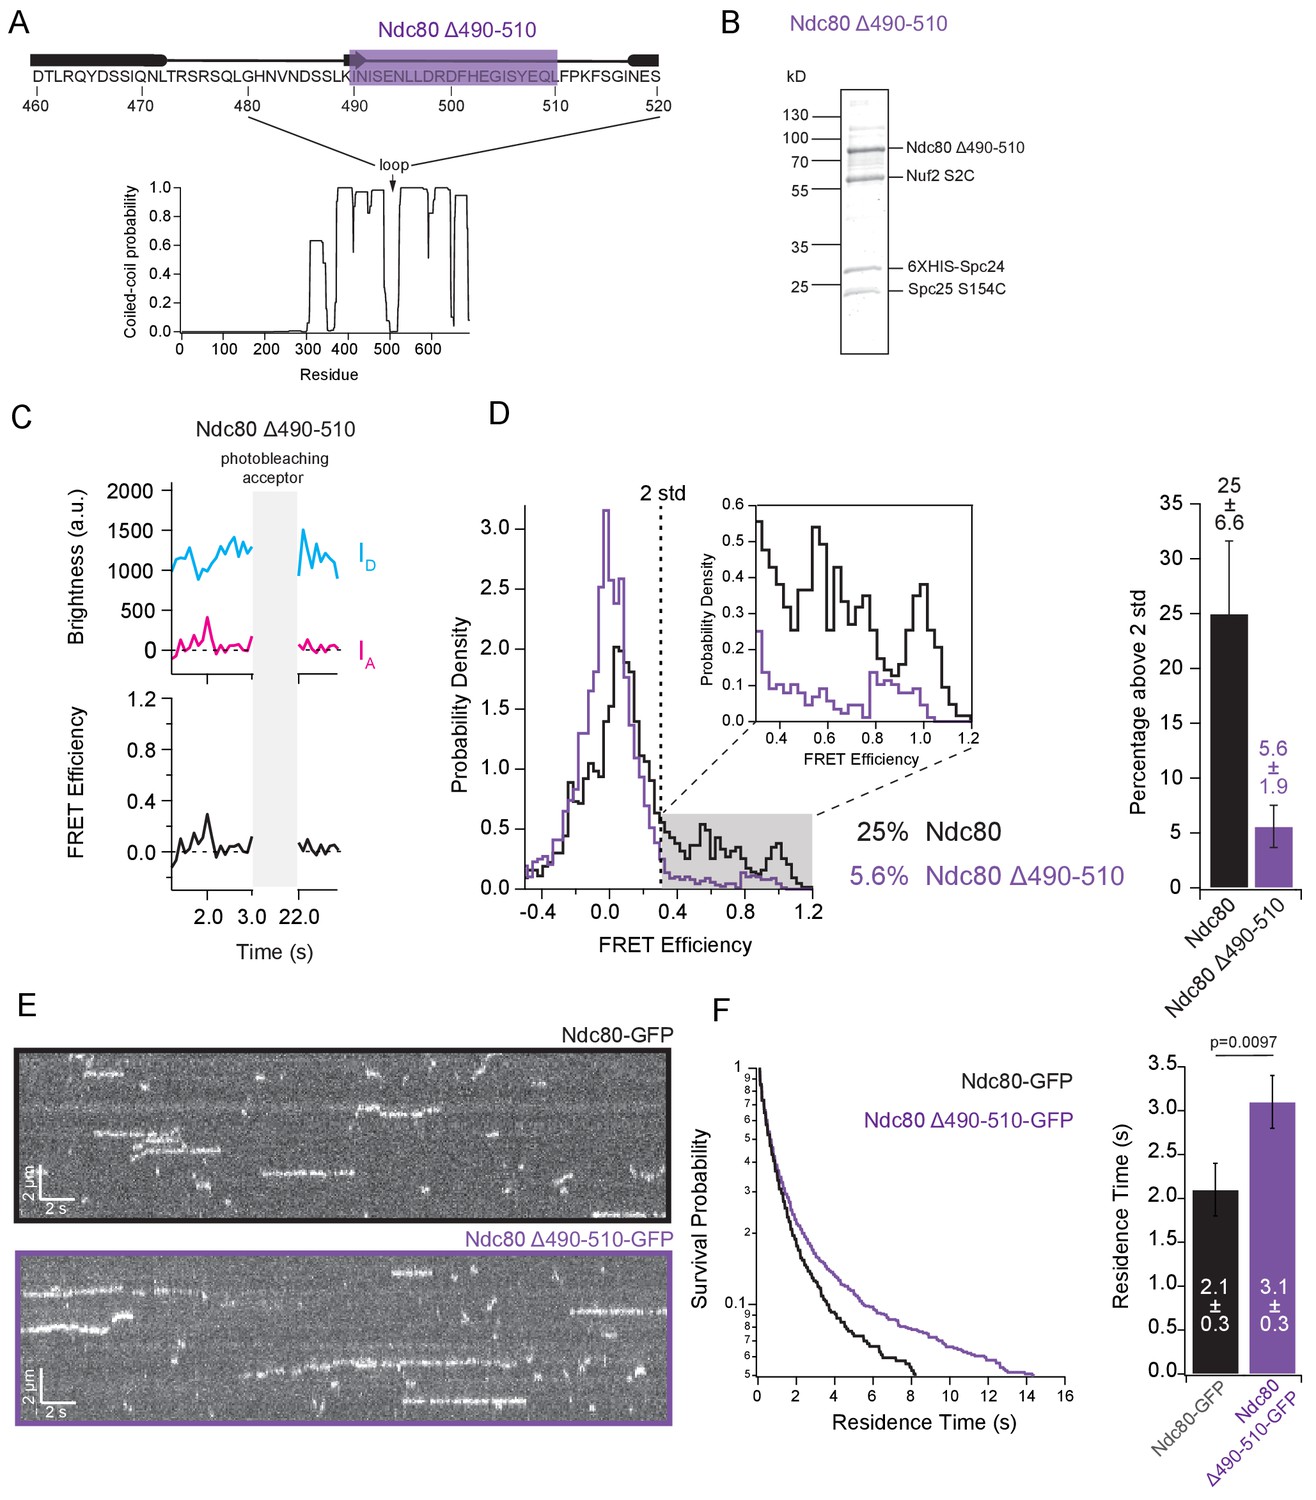
The loop region of Ndc80 contributes to tight bending of the complex.
(A) (Top) Primary sequence of Ndc80 protein amino acids 460–520. The purple bar highlights the region of the loop deleted for the following experiment. (Bottom) Graph of probability of coiled-coil as predicted by PCOILS of the Ndc80 protein. (B) Coomassie blue-stained gel showing end-labeled Ndc80 Δ490–510 complex used in single molecule FRET assay. (C) (Top) Fluorescence traces of one representative example of an end-labeled Ndc80 complex in Figure 4C before and after photobleaching acceptor (Alexa Fluor 647). (Bottom) Corresponding traces of FRET efficiency before and after acceptor photobleaching for the top example. (D) (Left) Histograms of FRET values for Ndc80 complex Nuf2 S2C Spc25 S154C (n = 2099, 85 particles) (data repeated from Figure 3E and F) and Ndc80 complex Ndc80 Δ490–510 Nuf2 S2C Spc25 S154C (n = 2926,143 particles). Percentage values represent the percentage of FRET values two standard deviations away from the mean of a Gaussian fit to the negative oligonucleotide data. ‘n’ refers to each 0.1 s FRET measurement for each condition. Zoom in of histograms depicting FRET values over two standard deviations. (Right) Bar graph of the percentage of FRET values above two standard deviations. Error calculated as standard error of the mean of day-to-day variability of percentage above two standard deviations. The corrected FRET values included in each FRET efficiency histogram are included in Figure 4—source data 1. (E) Representative kymographs of Ndc80-GFP and Ndc80 Δ490–510-GFP. Brightness and contrast have been adjusted separately for each image for best visualization. (F) (Left) Survival probability curves of residence times for Ndc80-GFP (n = 570) (black trace) and Ndc80 Δ490–510 (n = 1237) (purple trace). (Right) Bar graph of average residence times of the data at left. Error was calculated using bootstrapping analysis. p-Value was calculated using a two-tailed Student’s t test. Raw data of all residence times are included in Figure 4—source data 1. Additional supplementary data are included in Figure 4—figure supplement 2.
-
Figure 4—source data 1
All individual FRET values and residence times on microtubules measured for individual mutant Ndc80 ∆490-510 loop-deletion complexes.
- https://doi.org/10.7554/eLife.44489.021
Figure 4—figure supplement 1
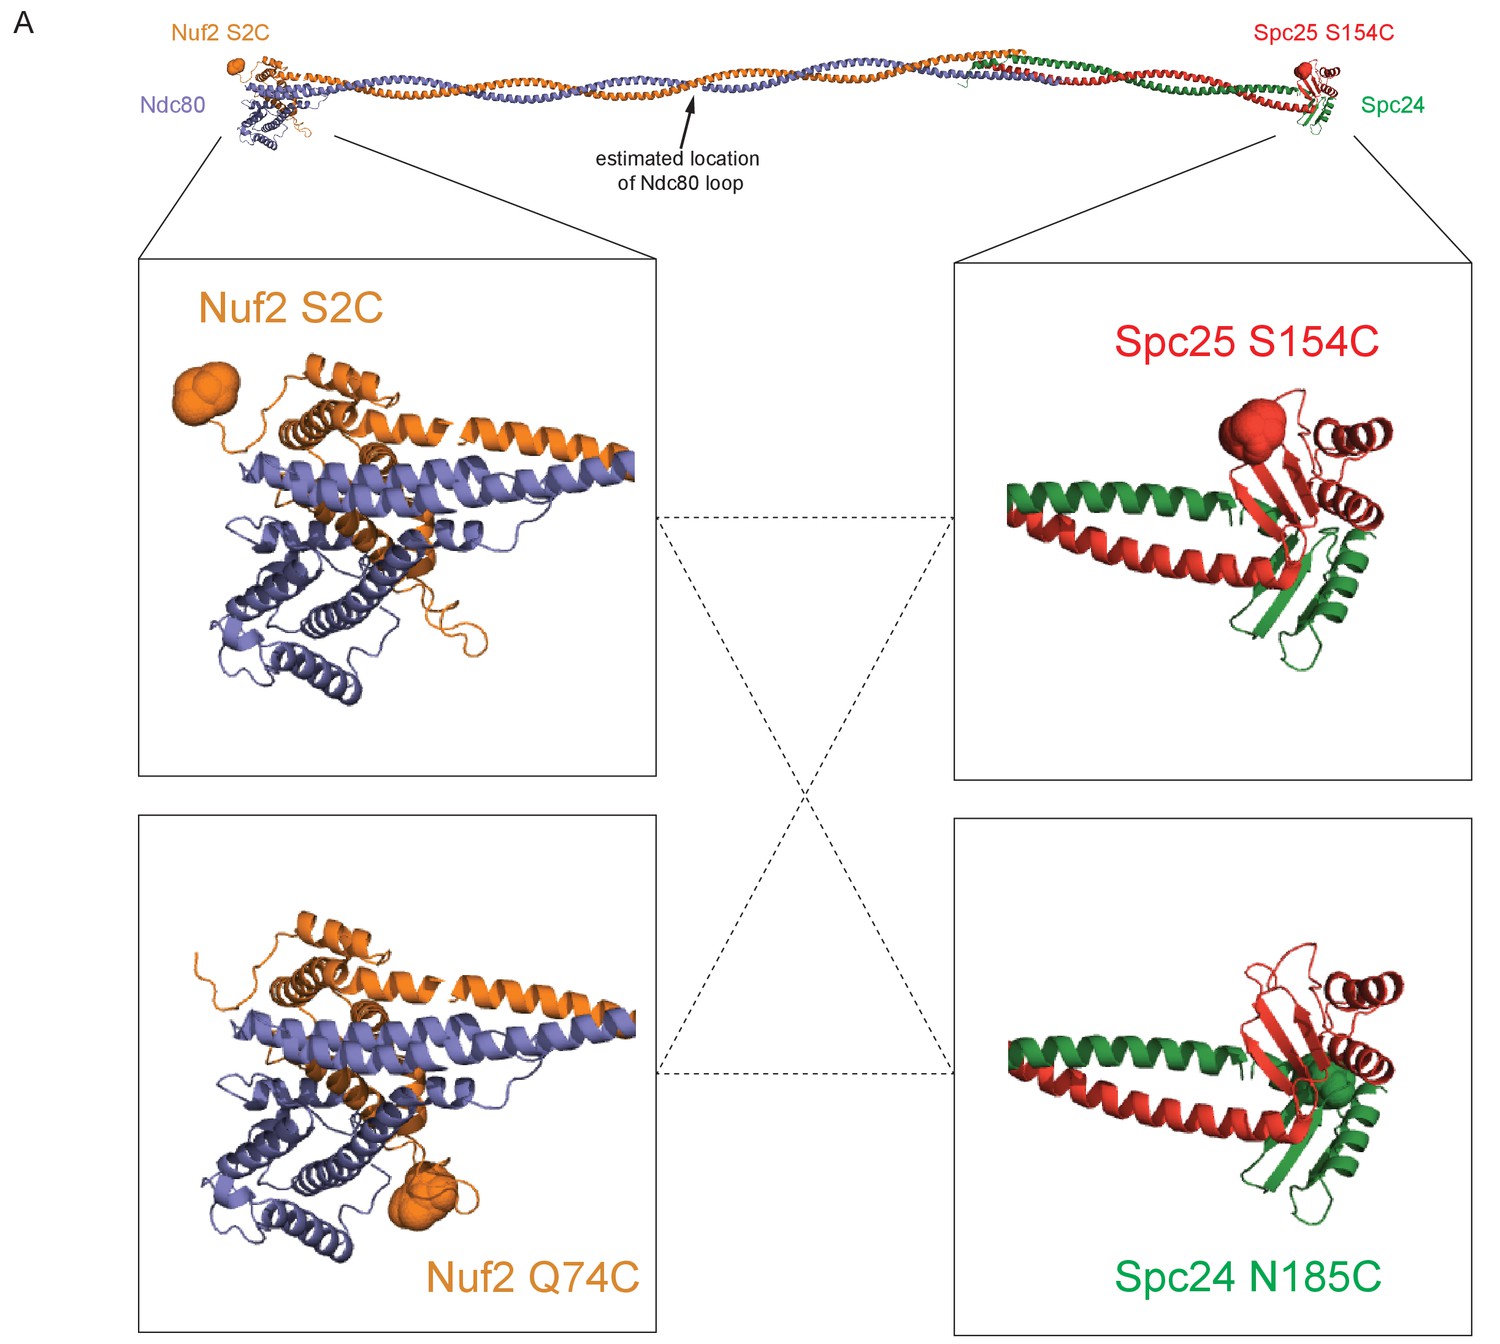
Model of the Ndc80 complex with all combinations of dye locations.
(A) Model of the Ndc80 complex using the dwarf tetramer structure (DOI: 10.2210/pdb5TCS/pdb) plus inserted coiled coil between the tetramerization domain and globular domain of each dimer. Break in coiled coil indicates estimated location of Ndc80 loop, as indicated by black arrow. Full-length model at top shows main Ndc80 complex construct (Nuf2 S2C, orange balls and Spc25 S154C, red balls) used throughout experiments. Zoomed in cut-outs below show all four cysteine locations used for dye placement, with dotted lines showing all four combinations of Ndc80 complex dye pairs constructed.
Figure 4—figure supplement 2
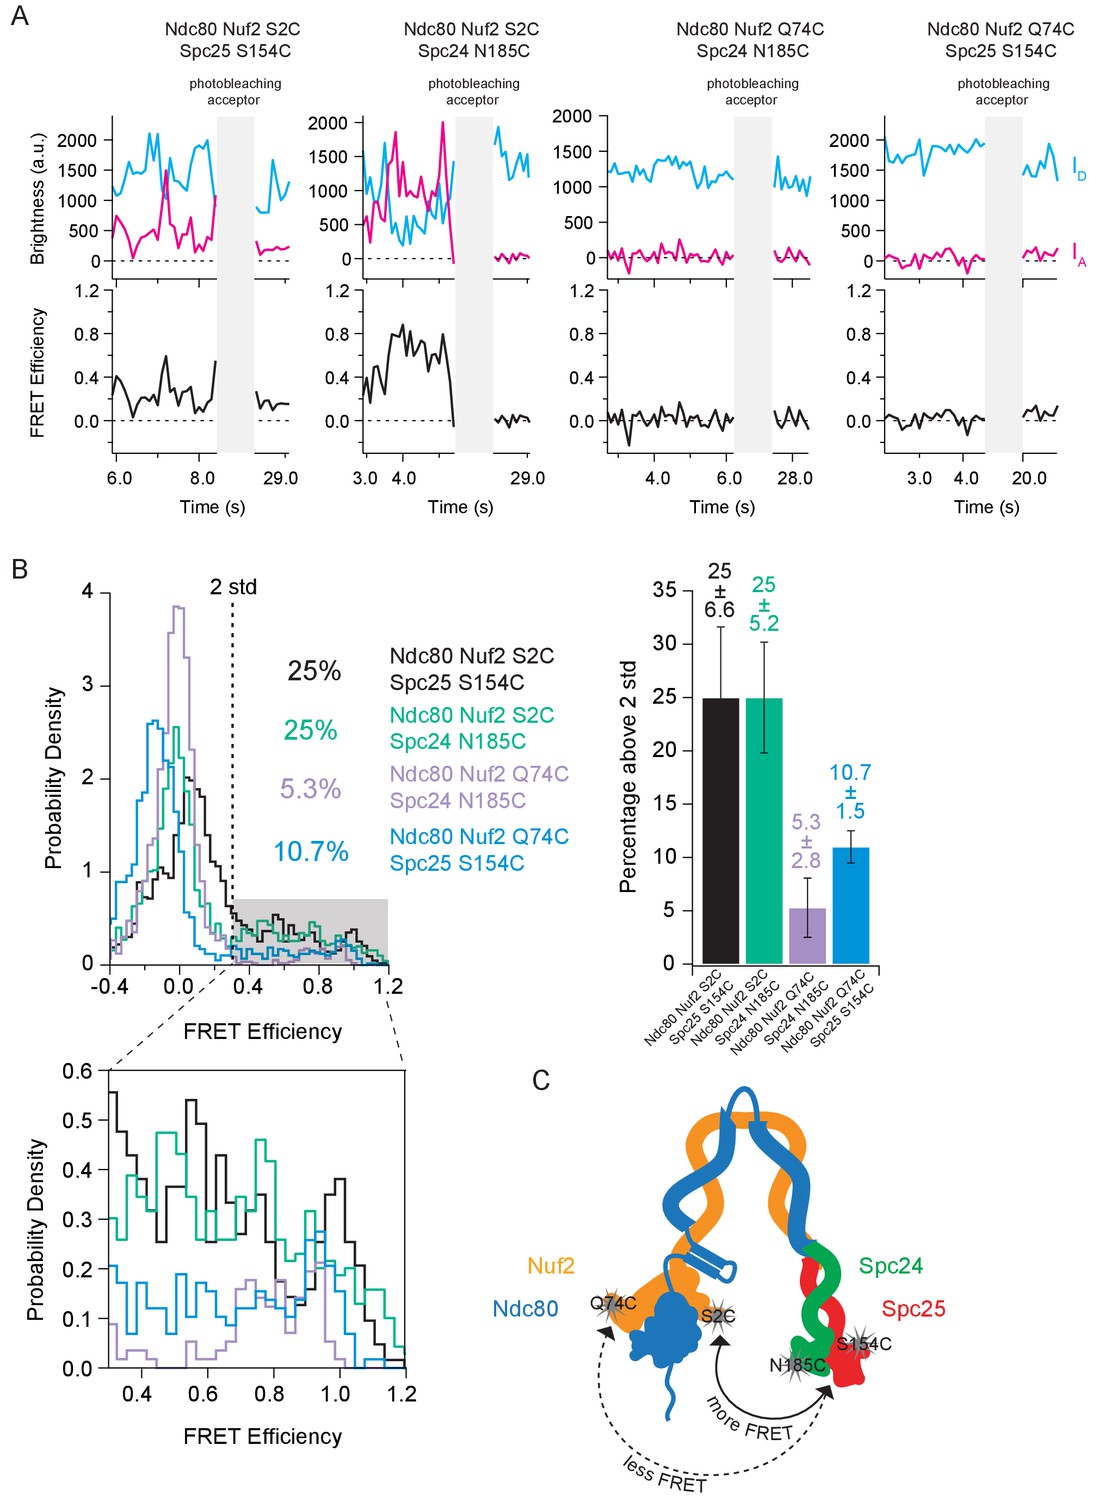
The Ndc80 complex has preferred orientations for intra-complex interactions.
(A) (Top) Fluorescence traces for one representative example of each combination of dye pairs for end-labeled Ndc80 complexes before and after photobleaching acceptor (Alexa Fluor 647). (Bottom) Corresponding traces of FRET efficiency before and after photobleaching acceptor for each top example. (B) (Left Top) Histograms of corrected FRET values for Ndc80 complex Nuf2 S2C Spc25 S154C (n = 2099, 85 particles) (data repeated from Figure 3E, Figure 4C, Figure 5D), Ndc80 complex Nuf2 S2C Spc24 N185C (n = 2319, 79 particles), Ndc80 complex Nuf2 Q74C Spc24 N185C (n = 1885, 63 particles) and Ndc80 complex Nuf2 Q74C Spc25 S154C (n = 1941, 72 particles). Percentage values represent the percentage of FRET values two standard deviations away from the mean of a Gaussian fit to the negative oligonucleotide data. ‘n’ refers to each 0.1 s FRET measurement for each condition. (Left Bottom) Zoom-in of histograms depicting FRET values over two standard deviations. (Right Top) Bar graph of the percentage of FRET values above two standard deviations. Error calculated as standard error of the mean of day-to-day variability of percentage above two standard deviations. The corrected FRET values included in each FRET efficiency histogram are included in Figure 4—figure supplement 2—source data 1. (C) Cartoon depicting locations of all four dye locations on a bent Ndc80 complex. When the dye is located on Nuf2 S2C, regardless of the dye location on the Spc24/Spc25 dimer, the Ndc80 complex exhibits more FRET relative to when the dye location on Nuf2 is Q74C.
-
Figure 4—figure supplement 2—source data 1
All individual FRET values measured for individual Ndc80 complexes with four pairwise combinations of dye locations.
- https://doi.org/10.7554/eLife.44489.020
Figure 5 with 1 supplement

Tight bending of the Ndc80 complex is inhibited by binding to either microtubules or the MIND complex.
(A) Fluorescence image of two end-labeled Ndc80 complexes (Nuf2 S2C Spc25 S154C) on Alexa Fluor 488 labeled-microtubules. Colors are off-set vertically. (B) (Top) Fluorescence traces of one representative example of an end-labeled Ndc80 complex in each condition shown in Figure 5D before and after photobleaching acceptor (Alexa Fluor 647). (Bottom) Corresponding traces of FRET efficiency before and after acceptor photobleaching for each top example. (C) Fluorescence image of two end-labeled Ndc80 complexes (Nuf2 S2C Spc25 S154C) next to each other on one coverslip, colocalized with MIND-GFP on the left, but not on the right. Colors are off-set vertically. (D) (Left) Histograms of FRET values for Ndc80 complex Nuf2 S2C Spc25 S154C (n = 2099, 85 particles) (data repeated from Figure 3E, Figure 4C), Ndc80 complex Nuf2 S2C Spc25 S154C on microtubules (n = 1682, 91 particles) and Ndc80 complex Nuf2 S2C Spc25 S154C bound to MIND (n = 718, 41 particles). Percentage values represent the percentage of FRET values two standard deviations away from the mean of a Gaussian fit to the negative oligonucleotide data. ‘n’ refers to each 0.1 s FRET measurement for each condition. Zoom in of histograms depicting FRET values over two standard deviations. (Right) Bar graph of the percentage of FRET values above two standard deviations. Error calculated as standard error of the mean of day-to-day variability of percentage above two standard deviations. The corrected FRET values included in each FRET efficiency histogram are included in Figure 5—source data 1. (E) Diagram of equilibrium between open and closed conformations of the Ndc80 complex, on and off the microtubule. Estimation of Keq values described in Materials and methods. Additional supplementary data are included in Figure 5—figure supplement 1.
-
Figure 5—source data 1
All individual FRET values measured for individual Ndc80 complexes bound to microtubules or bound to the MIND complex.
- https://doi.org/10.7554/eLife.44489.025
Figure 5—figure supplement 1
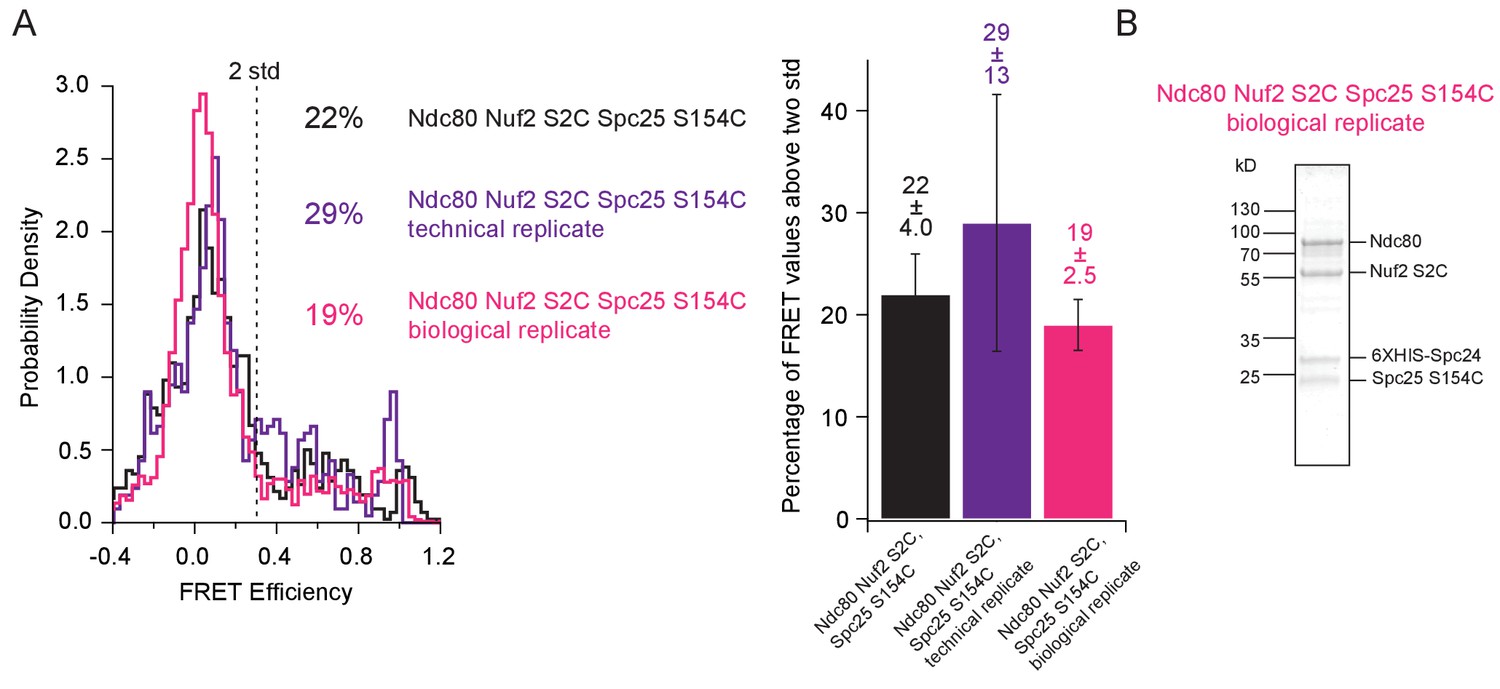
Reproducibility of Ndc80 complex single molecule FRET measurements.
(A) (Left) Histograms of corrected FRET values for Ndc80 complex Nuf2 S2C Spc25 S154C (n = 1395, 48 particles), Ndc80 complex Nuf2 S2C Spc25 S154C measured from slides with MIND-GFP, but not associated with MIND (n = 704, 37 particles), and a separate protein and labeling prep of Ndc80 complex Nuf2 S2C Spc25 S154C (n = 3224, 108 particles). Percentage values represent the percentage of FRET values two standard deviations away from the mean of a Gaussian fit to the negative oligonuleotide control. ‘n’ refers to each 0.1 s FRET measurement for each condition. (Right) Bar graph of the percentage of FRET values above two standard deviations. Error calculated as standard error of the mean of day-to-day variability of percentage above two standard deviations. The corrected FRET values included in each FRET efficiency histogram are included in Figure 5—figure supplement 1—source data 1. (B) Coomassie blue-stained gel showing a separate protein and labeling prep of Ndc80 complex Nuf2 S2C Spc25 S154C.
-
Figure 5—figure supplement 1—source data 1
All individual FRET values measured for individual Ndc80 complexes during technical and biological replicate experiments.
- https://doi.org/10.7554/eLife.44489.024
Tables
Key resources table
| Reagent type or resource | Designation | Source or reference | Identifiers | Additional information |
|---|---|---|---|---|
| Strain, E. coli | Rosetta (DE3) competent cells | Millipore Sigma | Cat#70954 | |
| Biological sample | Bovine brain tubulin | lab purification | Protocol adapted from Castoldi and Popov, 2003. | |
| Sequence-based reagent | Fluorescently-labeled oligonucleotides | IDT | ||
| Sequence-based reagent | Fluorescently-labeled, biotintylated oligonucleotides | IDT | ||
| Antibody | Penta-HIS biotin conjugate, monoclonal mouse | Qiagen | Cat#34440 | Diluted to 20 nM |
| Chemical compound | Alexa Fluor 488 succinimidyl ester | Thermo Fisher | Cat#A20000 | |
| Chemical compound | Alexa Fluor 647 maleimide | Thermo Fisher | Cat#A20347 | |
| Chemical compound | Alexa Fluor 568 succinimidyl ester | Thermo Fisher | Cat#A20003 | |
| Chemical compound | Cy3 maleimide | GE Healthcare Life Sciences | Cat#PA23031 | |
| Chemical compound | Cy5 maleimide | GE Healthcare Life Sciences | Cat#PA25031 | |
| Chemical compound | Trolox | Millipore Sigma | Cat#238813 | |
| Chemical compound | Glucose oxidase | Millipore Sigma | Cat#345386 | |
| Chemical compound | Catalase | Millipore Sigma | Cat#219261 | |
| Chemical compound | POPC | Avanti Polar Lipids | Cat#850457 | 1-palmitoyl-2-oleoyl-sn-glycero-3-phosphocholine |
| Chemical compound | Bio-cap-PE/BioPE | Avanti Polar Lipids | Cat#870273 | 1,2-dioleoyl-sn-glycero-3-phosphoethanolamine-N-(cap biotinyl) sodium salt |
| Chemical compound | Biotinylated bovine serum albumin (BSA) | Vector Laboratories | Cat#B-2007 | |
| Chemical compound | Avidin DN | Vector Laboratories | Cat#A-3100 | |
| Chemical compound | TCEP | Thermo Fisher | Cat#T2556 | |
| Chemical compound, drug | Paclitaxel/Taxol | Millipore Sigma | Cat#T7402 | |
| Software | Labview | National Instruments | ||
| Software | Igor Pro | Wavemetrics |
Additional files
-
Transparent reporting form
- https://doi.org/10.7554/eLife.44489.026
Download links
A two-part list of links to download the article, or parts of the article, in various formats.
Downloads (link to download the article as PDF)
Open citations (links to open the citations from this article in various online reference manager services)
Cite this article (links to download the citations from this article in formats compatible with various reference manager tools)
Tight bending of the Ndc80 complex provides intrinsic regulation of its binding to microtubules
eLife 8:e44489.
https://doi.org/10.7554/eLife.44489


