Ventral hippocampal projections to the medial prefrontal cortex regulate social memory
- The University of Alabama at Birmingham, United States
Figures
Figure 1 with 1 supplement
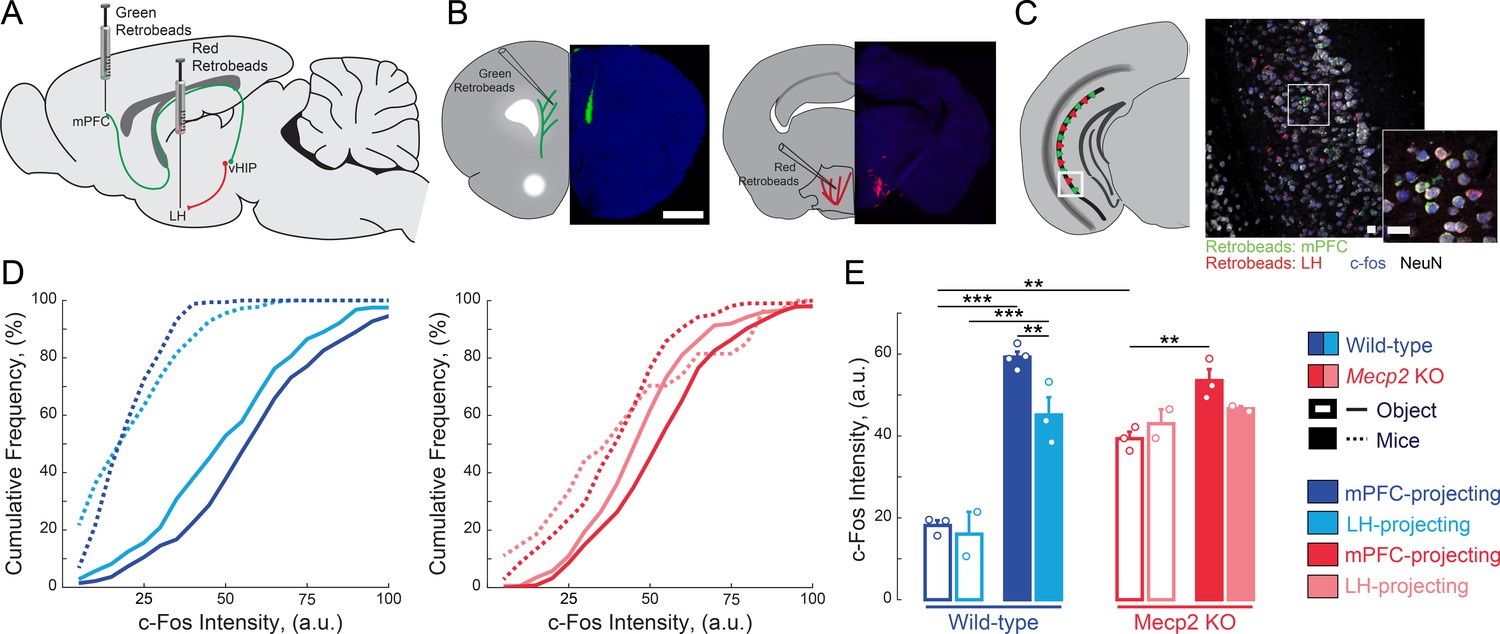
mPFC-projecting vHIP neurons are selectively activated during sequential social encounters with familiar and novel mice.
(A) Schematic of RetroBead injection for labeling mPFC- or LH-projecting vHIP neurons. (B) Injection sites. Scale bar 1 mm. (C) RetroBead labeling and c-Fos immunohistochemistry in vHIP sections. Scale bar 25 μm. (D) Cumulative probability distributions of c-Fos intensities of RetroBead-labeled neurons [n = 163 cells from 3 sections from three mice (163/3/3) WT mPFC-projecting with toy mice; n = 180/3/2 WT LH-projecting with toy mice; n = 275/6/4 WT mPFC-projecting with live mice; n = 271/4/3 WT LH-projecting with live mice; n = 105/6/3 Mecp2 KO mPFC-projecting with toy mice; n = 22/3/2 Mecp2 KO LH-projecting with toy mice; n = 247/4/3 Mecp2 KO mPFC-projecting with live mice; n = 172/5/2 Mecp2 KO LH-projecting with live mice]. (E) Mean c-Fos intensity of RetroBead-labeled neurons, averaged per mouse. [WT mPFC toy mice vs. WT LH toy mice, p 0.6463; WT mPFC toy mice vs. WT mPFC live mice, p<0.0001; WT LH toy mice vs. WT LH live mice, p<0.0001; WT mPFC live mice vs. WT LH live mice, p=0.0022; KO mPFC toy mice vs. KO LH toy mice, p=0.4612; KO mPFC toy mice vs. KO mPFC live mice, p=0.0034; KO LH toy mice vs. KO LH live mice, p=0.4885; KO mPFC live mice vs. KO LH live mice, p=0.1544; WT mPFC toy mice vs. KO mPFC toy mice, p=0.0001; WT mPFC live mice vs. KO mPFC live mice, p=0.1544; Projection p=0.0292; Genotype p<0.0001; Experience p<0.0001; Projection x Genotype p=0.1263; Genotype x Experience p<0.0001; Projection x Genotype x Experience p=0.8545; Three Way ANOVA with Benjamini and Hochberg Multiple Comparisons]. Mean ± SEM; *p<0.05, **p<0.01. Figure 1—source data 1. See also Figure 1—figure supplement 1.
-
Figure 1—source data 1
mPFC-projecting vHIP neurons are selectively activated during sequential social encounters with familiar and novel mice.
- https://doi.org/10.7554/eLife.44182.005
Figure 1—figure supplement 1

Higher number of c-Fos-positive neurons in the mPFC following social encounters.
(A) Schematic of behavioral paradigm, also applicable for Figure 1. (B) Representative images of c-Fos immunostaining in the mPFC. (C) Number of c-Fos positive neurons in the PL region of the mPFC of mice who had interacted with either toy mice or live mice 45 min prior to sacrifice (WT toy mice vs. Mecp2 KO toy mice, p=0.1019; WT toy mice vs. WT live mice, p=0.0077; Mecp2 KO toy mice vs. Mecp2 KO live mice, p=0.0234; WT live mice vs. Mecp2 KO live mice, p=0.0234; Interaction p=0.4001; Experience p=0.0008; Genotype p=0.0063; Two-Way ANOVA with Benjamini and Hochberg Multiple Comparisons; n = 9 mPFC sections from three mice in each condition). Scale bar 50 μm. Mean ± SEM; *p<0.05, **p<0.01.
-
Figure 1—figure supplement 1—source data 1
Higher number of c-Fos-positive neurons in the mPFC following social encounters.
- https://doi.org/10.7554/eLife.44182.004
Figure 2 with 2 supplements
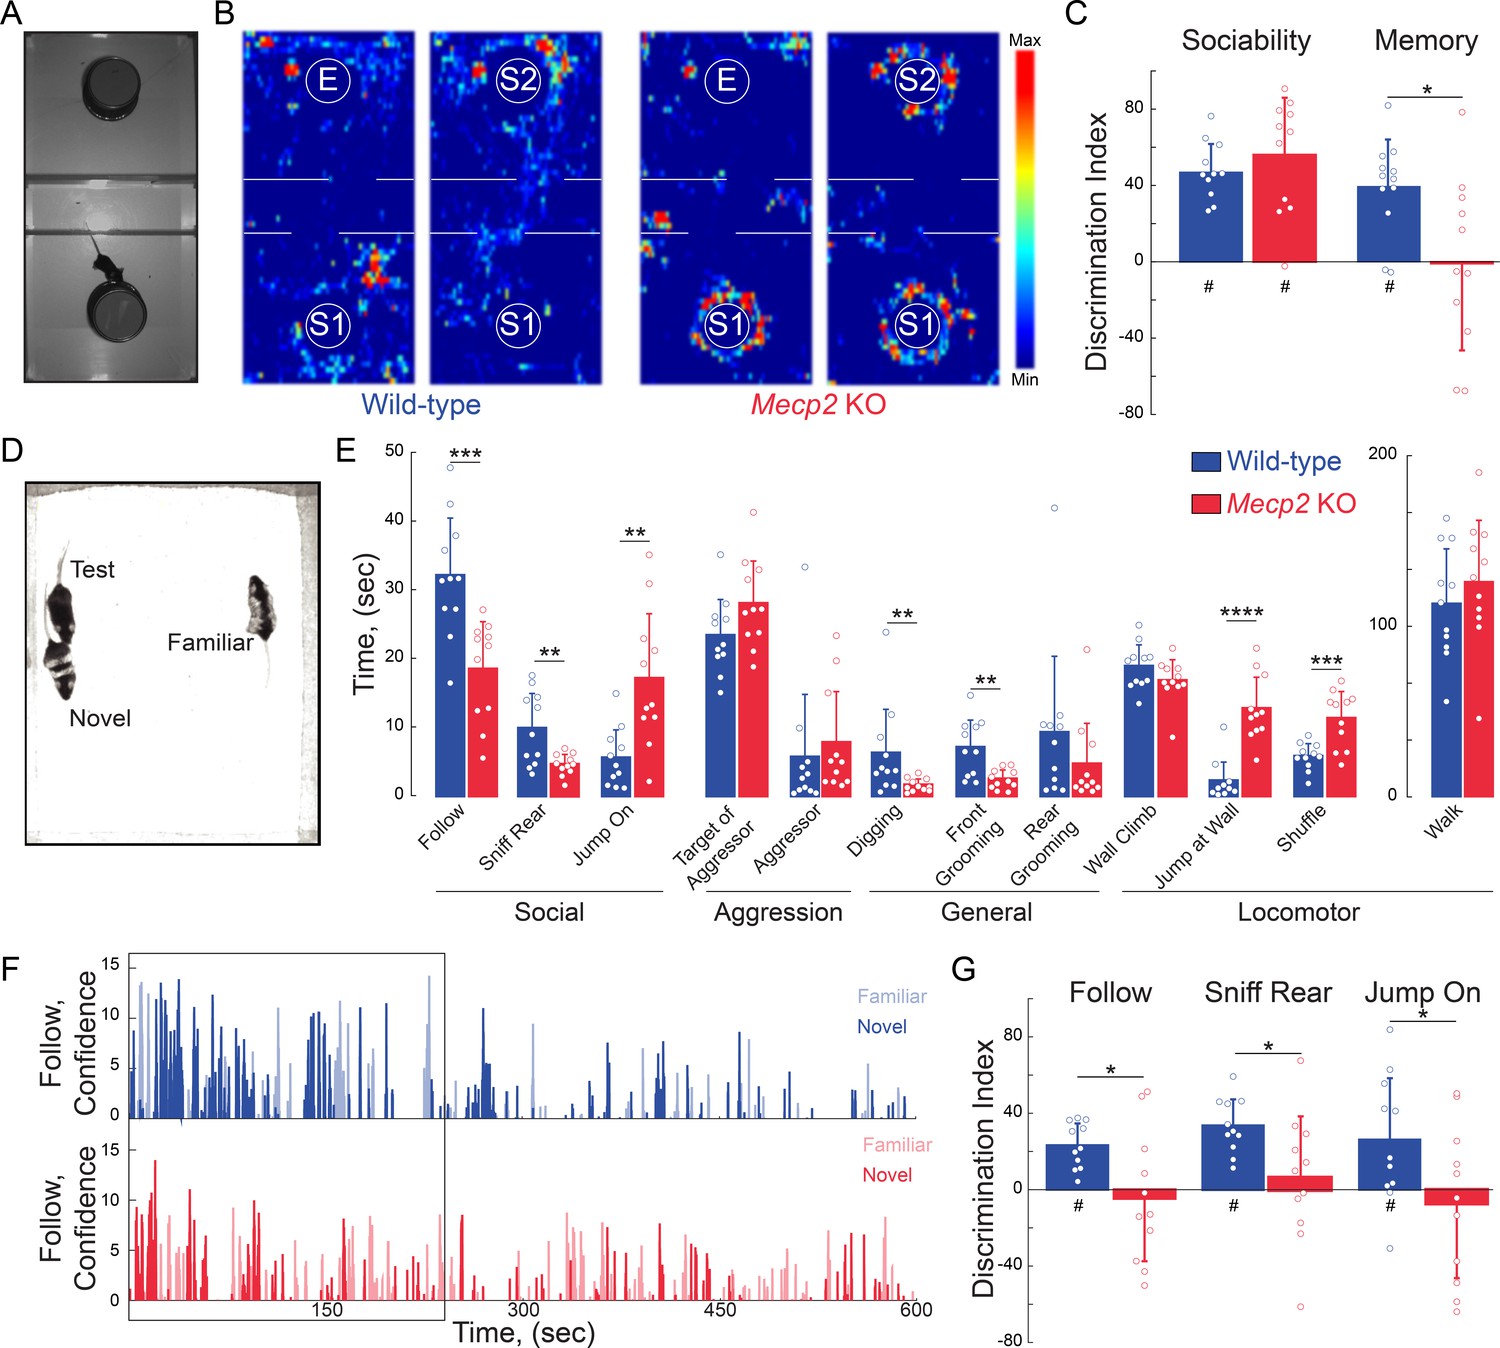
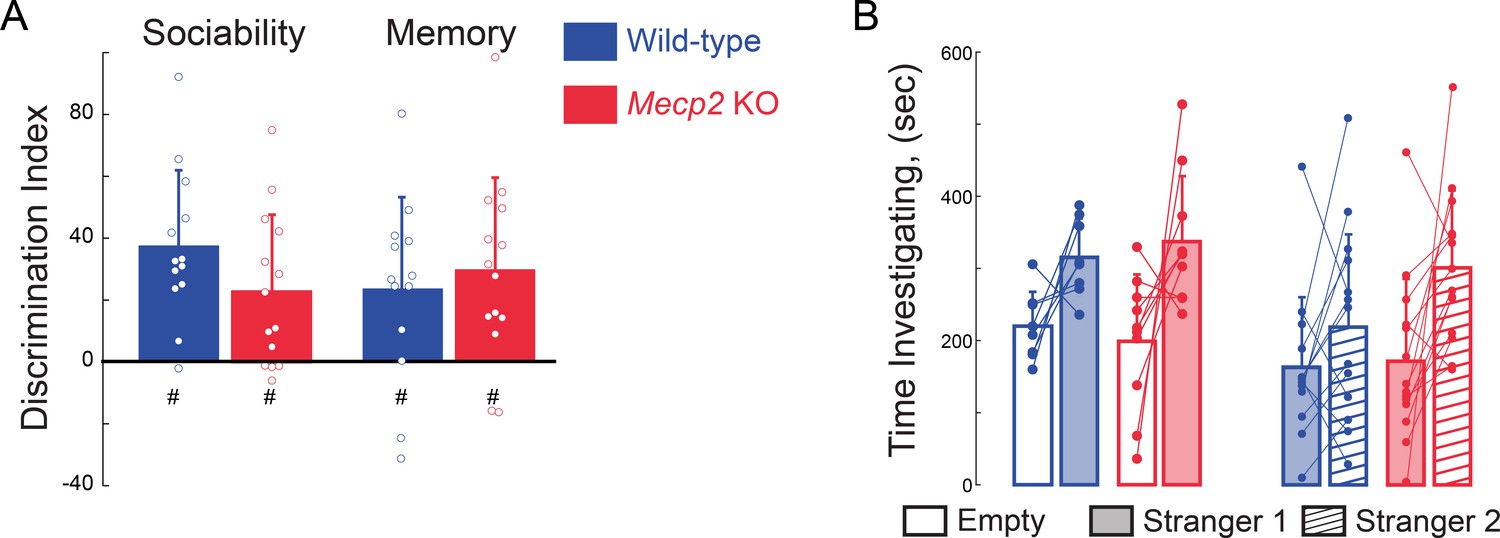
Mecp2 KO mice have impaired social memory and atypical social interactions.
(A) Schematic of three-chamber social test. (B) Representative heat maps of WT and Mecp2 KO mice during the three-chamber social test. (C) Discrimination indices of sociability and memory tests. (n = 12 WT mice; n = 11 Mecp2 KO mice; WT vs. Mecp2 KO sociability, p=0.3523; WT vs. Mecp2 KO, memory p=0.0140; Two-sample Student’s t-test; WT sociability DI vs. chance, p<0.0001; Mecp2 KO sociability DI vs. chance, p<0.0001; WT memory DI vs. chance, p=0.0002; Mecp2 KO memory vs. chance, p=0.9436; One-sample Student’s t-test). (D) Image of unrestricted social memory paradigm. (E) Time spent performing different behaviors using automated scoring of unrestricted social encounters (n = 11 WT mice; n = 11 Mecp2 KO mice; Follow, p=0.0008; Rear Sniff, p=0.0055; Jump On, p=0.0020; Target of Aggressor, p=0.0857; Aggressor, p=0.1513; Digging, p=0.0052; Grooming Front, p=0.0025; Grooming Rear, p=0.1875; Wall Climb, p=0.1713; Wall Jump, p<0.0001; Shuffle, p=0.0007; Walk, p=0.4135; Student’s t-test or Mann-Whitney test dependent on normalcy). (F) Computer confidence scores in following behavior over the course of representative videos separated by target: novel mouse in bold and familiar opaque, first 4 min boxed. (G) Time the test mouse spent following, sniffing rear, or ‘jumping on’ either the novel or familiar mouse during the first 4 min of the video (n = 11 WT; n = 11 KO mice; WT Follow DI vs. chance, p<0.0001; WT Rear Sniff, p<0.0001; WT Jump On, p=0.0279; Mecp2 KO Follow p=0.6683, Mecp2 KO Rear Sniff, p=0.5656; Mecp2 KO Jump On, p=0.5665; Two-sample Student’s t-test;WT vs. Mecp2 KO Follow, p=0.0200; WT vs. Mecp2 KO Sniff, p=0.0229; WT vs. Mecp2 KO Jump On, p=0.0493; One-sample Student’s t-test). Mean ± SD; *p<0.05, **p<0.01. For memory tasks (C and G), * indicate comparisons between genotypes while # indicates differences of the discrimination indices from chance value (0). Figure 2—source data 1. See also Figure 2—figure supplements 1–2.
-
Figure 2—source data 1
Mecp2KO mice have impaired social memory and atypical social interactions.
- https://doi.org/10.7554/eLife.44182.010
Figure 2—figure supplement 1
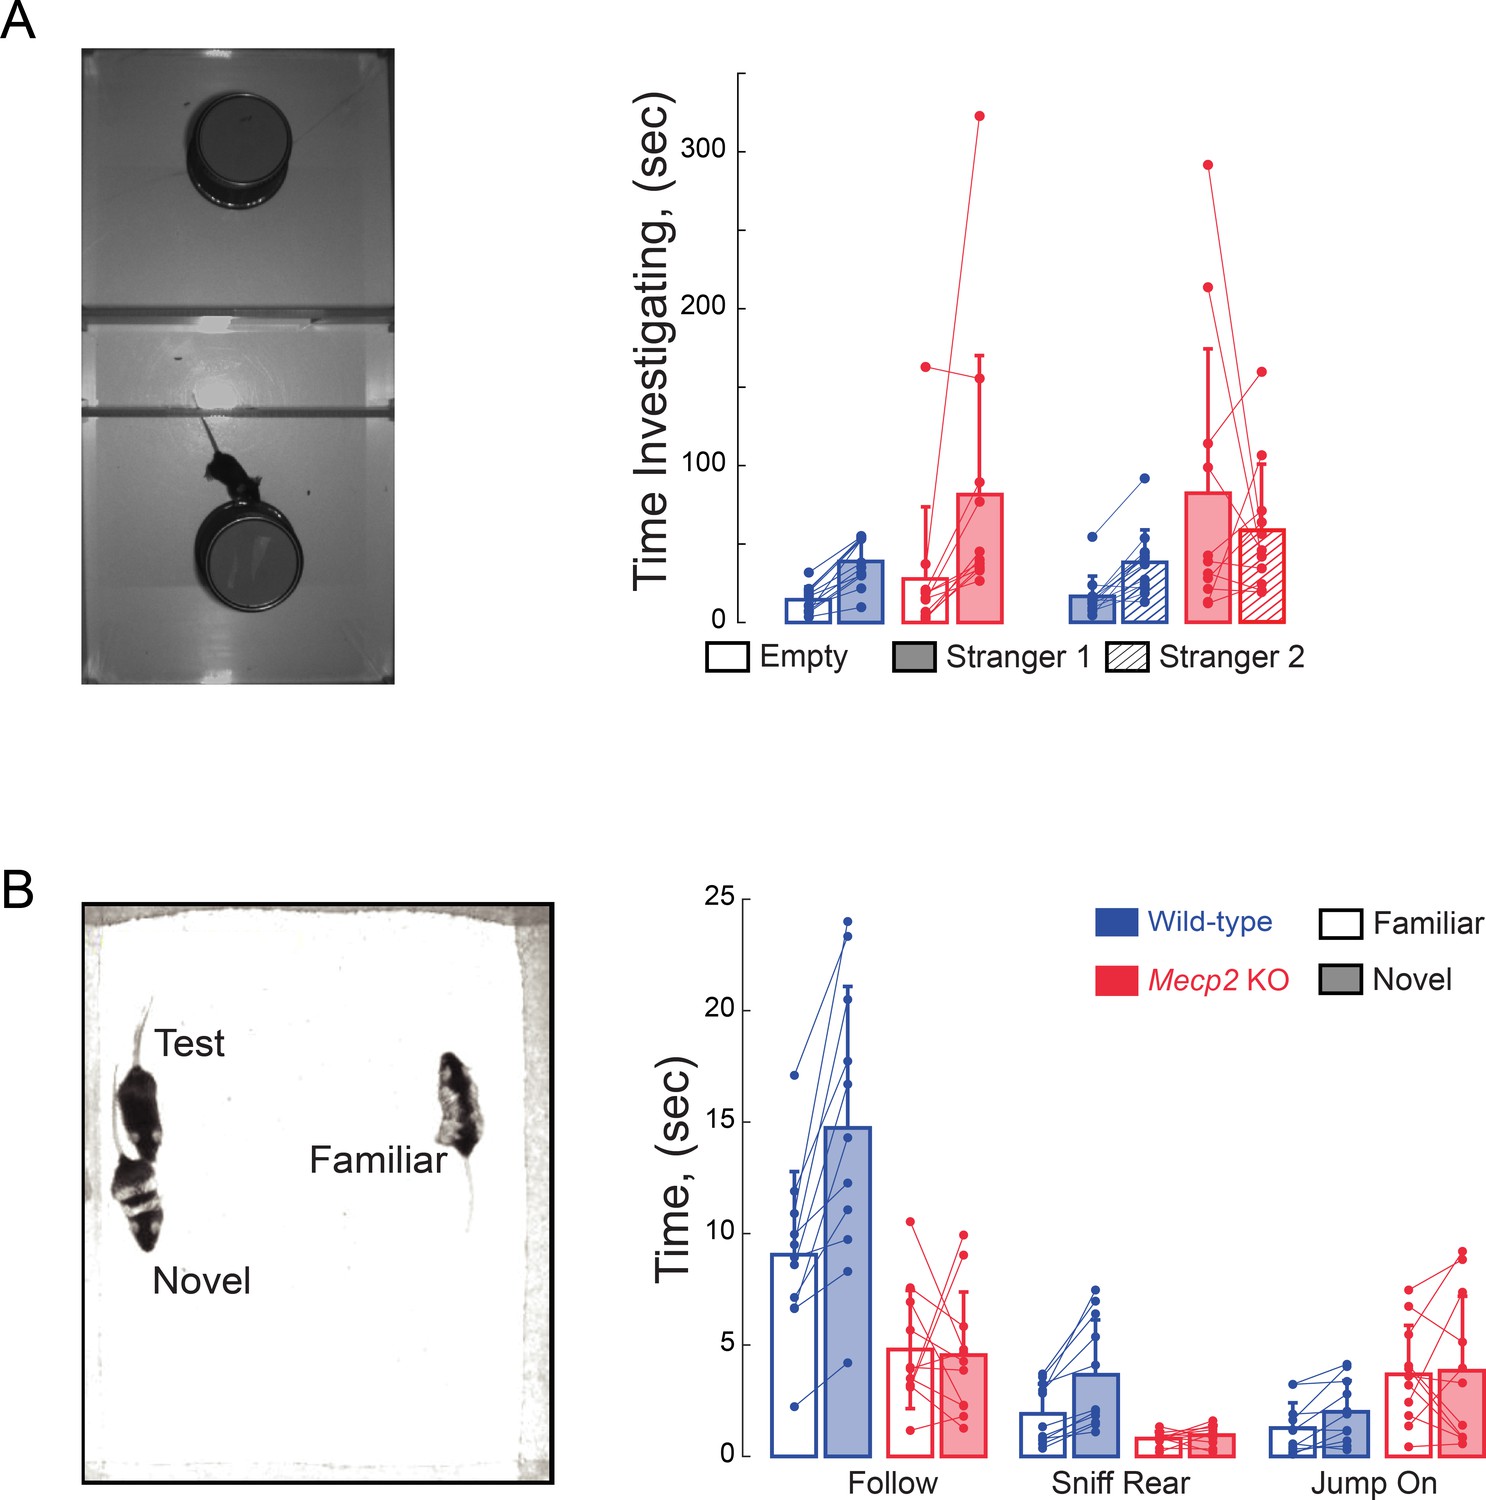
Impaired social memory in Mecp2 KO mice.
(A) Total investigation times in the three-chamber sociability and social memory tests (n = 12 WT mice; n = 11 Mecp2 KO mice). (B) Total times during unrestricted social behaviors (n = 11 WT mice; n = 11 Mecp2 KO mice). Mean ± SD.
-
Figure 2—figure supplement 1—source data 1
Impaired social memory in Mecp2KO mice.
- https://doi.org/10.7554/eLife.44182.008
Figure 2—figure supplement 2
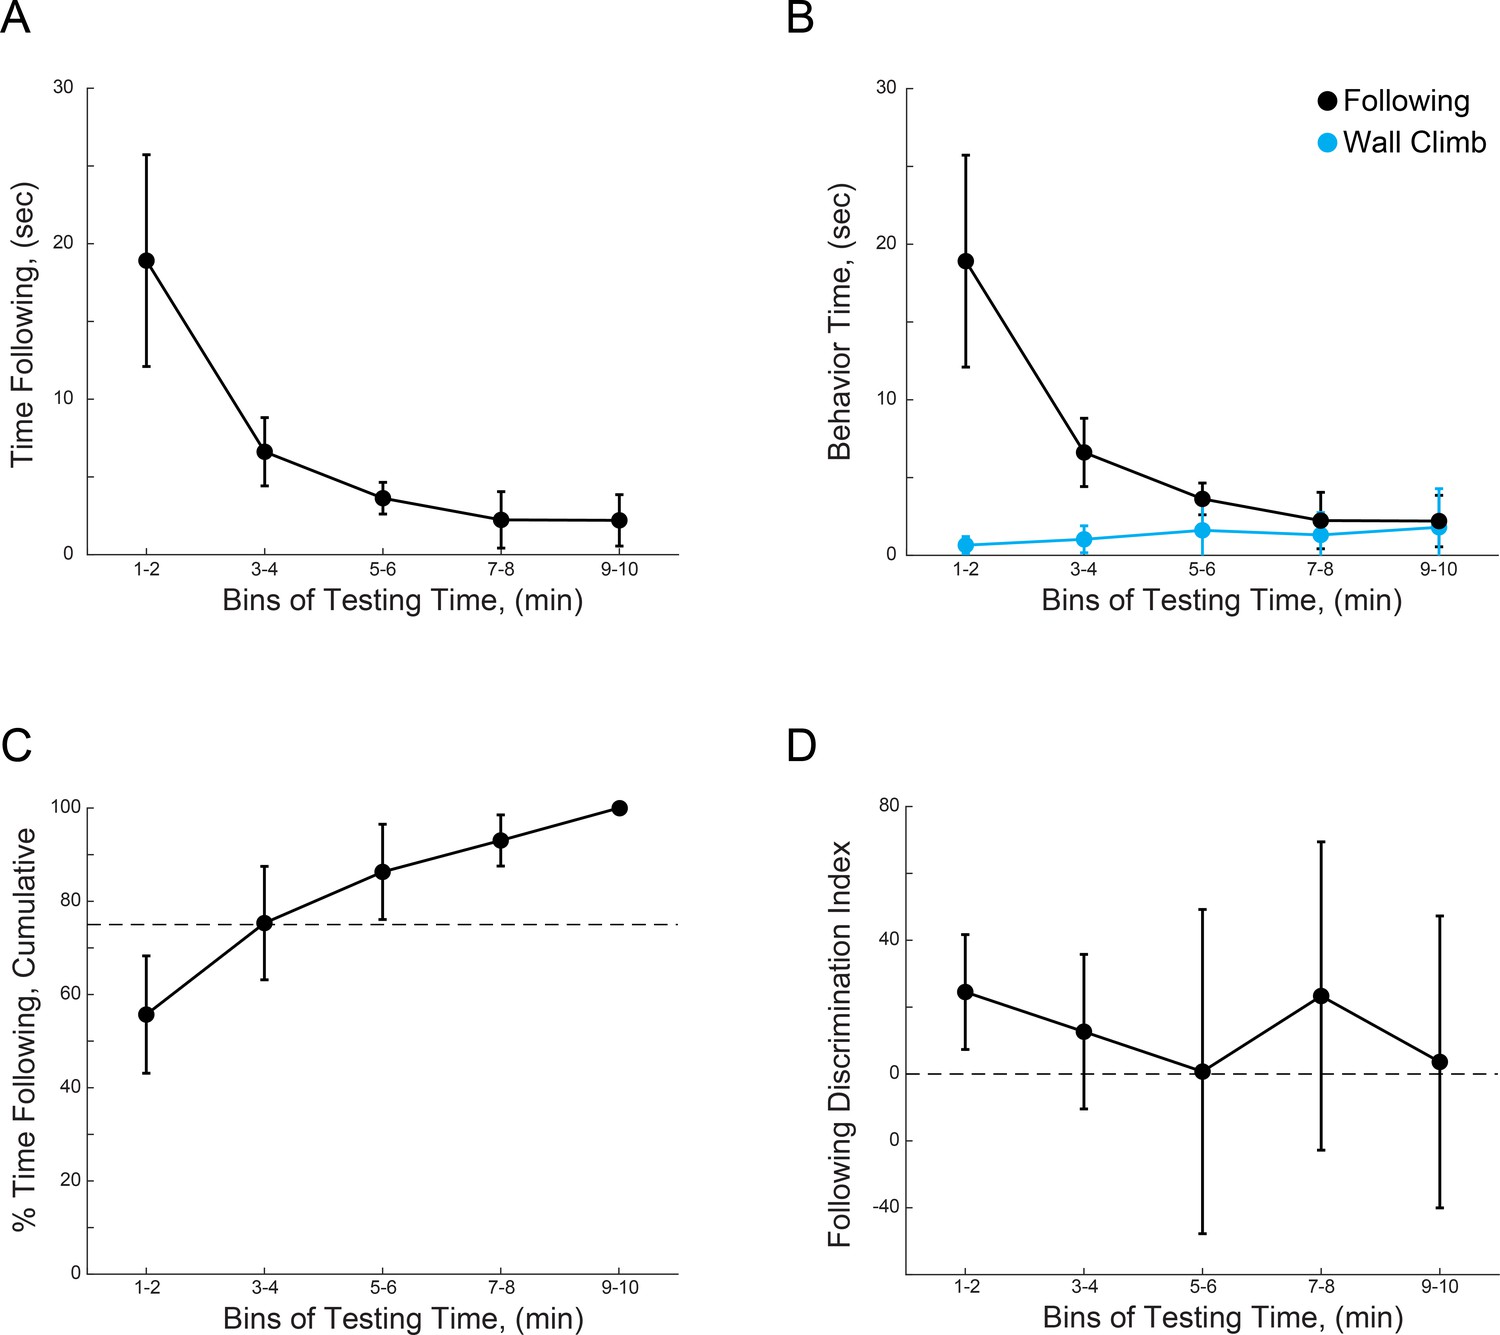
WT mice show preference for novel mice during the first 4 min of unrestricted interactions.
(A) Time spent by test mice actively following sentinel mice over the total testing time. (B) Time spent by test mice actively following sentinel mice over the total testing time, plotted vs. the time spent by test mice investigating the chamber. (C) Cumulative percentage of following behavior over time, dotted line indicates 75%. (D) Discrimination index between novel and familiar sentinels over test time. (n = 10 WT mice).
Figure 3 with 2 supplements
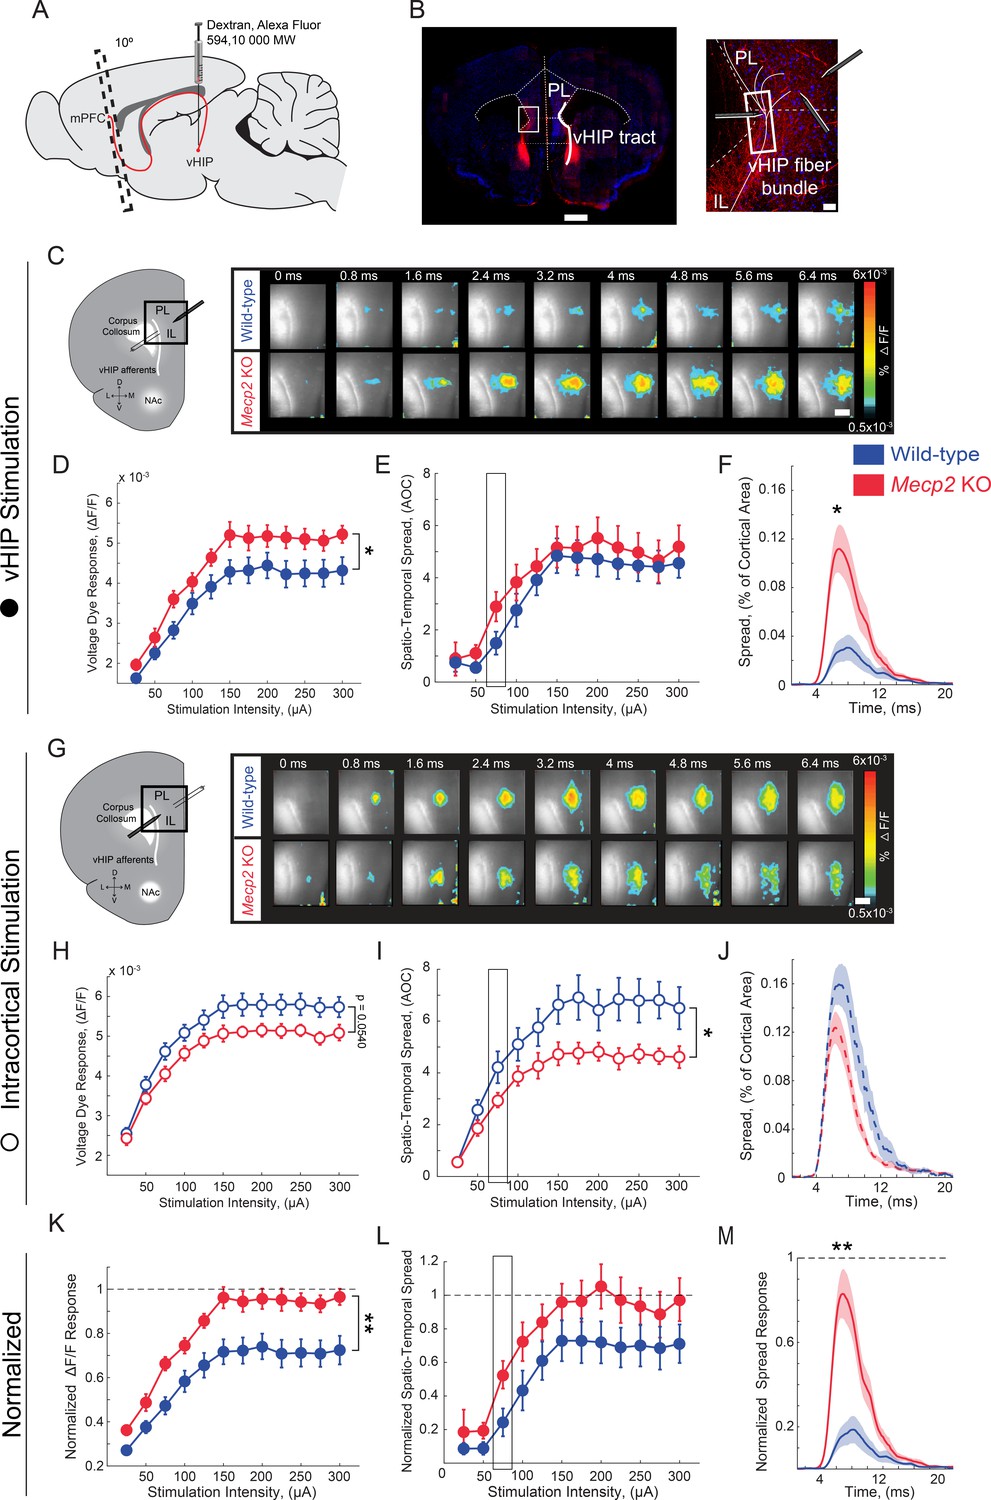
Increased influence of vHIP axons in the mPFC of Mecp2 KO mice.
(A) Schematic of dextran injection into the vHIP. (B) Visualization of vHIP fibers in mPFC slices. Scale bar 0.5 mm; inset 100 µm. (C) VSD responses are proportional to the amplitude and follow the kinetics of fEPSPs. (D) Representative VSD responses evoked by stimulation of fluorescently-labeled vHIP fibers. Scale bar 100 µm (D and H). (E–G) Input-output relationship of peak VSD responses (E) p=0.047, Two-way ANOVA), spatiotemporal spread (F) p=0.4529, Two-way ANOVA), and spread over time (G) p=0.0133, Mann-Whitney) (at 75 µA intensity) evoked by vHIP fiber stimulation. (H) Representative VSD responses evoked by intracortical stimulation. (I–K) Input-output relationship of peak VSD responses (I) p=0.4553, Two-way ANOVA), spatiotemporal spread (J) p=0.0498, Two-way ANOVA), and spread over time (K) p=0.1025, Student’s t-test) (at 75 µA intensity) evoked by intracortical stimulation. (L–N) Peak VSD responses (L) p=0.0015, Two-way ANOVA), spatiotemporal spread (M) p=0.0767, Two-way ANOVA), and spread over time (N) p=0.0002, Mann-Whitney) evoked by vHIP fiber stimulation normalized to those evoked by intracortical stimulation. [n = 11 slices from seven mice (11/7) WT mice; n = 11/5 Mecp2 KO]. Spatiotemporal spread = AOC created by spread of the cortical area (% of total) and time (ms). Mean ± SEM; *p<0.05, **p<0.01. Figure 3—source data 1. See also Figure 3—figure supplements 1–2.
-
Figure 3—source data 1
Increased influence of vHIP axons in the mPFC of Mecp2KO mice.
- https://doi.org/10.7554/eLife.44182.015
Figure 3—figure supplement 1

Input-output curves of VSD signal amplitudes and initial slope of fEPSP.
(A) Representative images of VSD signals at different stimulus intensities from a representative experiment. (B) Representative traces of dF/F VSD signals and fEPSPs evoked by different stimulus intensities. (C) Input/output relationships of the initial slope of fEPSPs and VSD signals from a representative experiment.
Figure 3—figure supplement 2
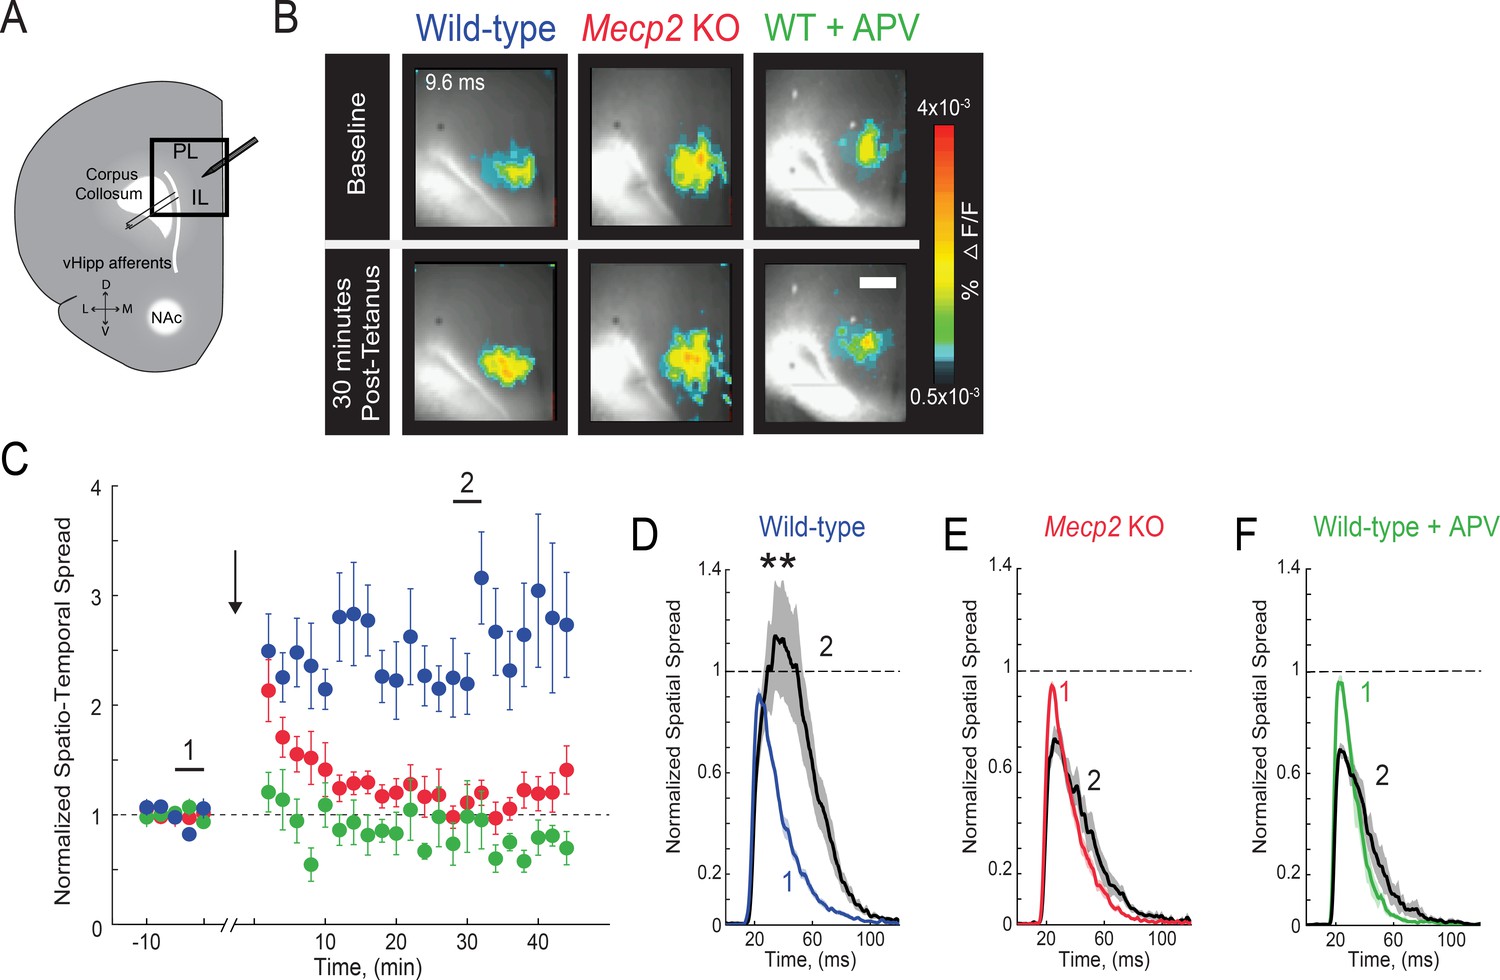
Impaired LTP at vHIP-mPFC synapses in Mecp2 KO mice.
(A) Schematic of VSD imaging in an mPFC slice during stimulation of vHIP fibers. (B) Representative images of peak VSD responses to a single pulse stimulation before and after high-frequency stimulation to induce LTP. Scale bar 100 µm. (C) Normalized spatiotemporal spread of single test VSD responses before and after LTP induction; high-frequency stimulation given at arrow. (D–F) Spread over time of single test VSD responses at baseline (1) and 30 min after LTP induction (2), normalized to baseline spread in WT slices (D), Mecp2 KO slices (E), and WT slices in the presence of the NMDA receptor antagonist APV (25 μM) (F) (p=0.0013 Student’s paired t-test, n = 10 slices from 7 WT mice; p=0.2705 Student’s paired t-test, n = 9/5 Mecp2 KO mice; p=0.9205 Student’s paired t-test, n = 4/4 WT mice in APV). Mean ± SEM; *p<0.05, **p<0.01.
-
Figure 3—figure supplement 2—source data 1
Impaired LTP at vHIP-mPFC synapses in Mecp2KO mice.
- https://doi.org/10.7554/eLife.44182.014
Figure 4 with 5 supplements
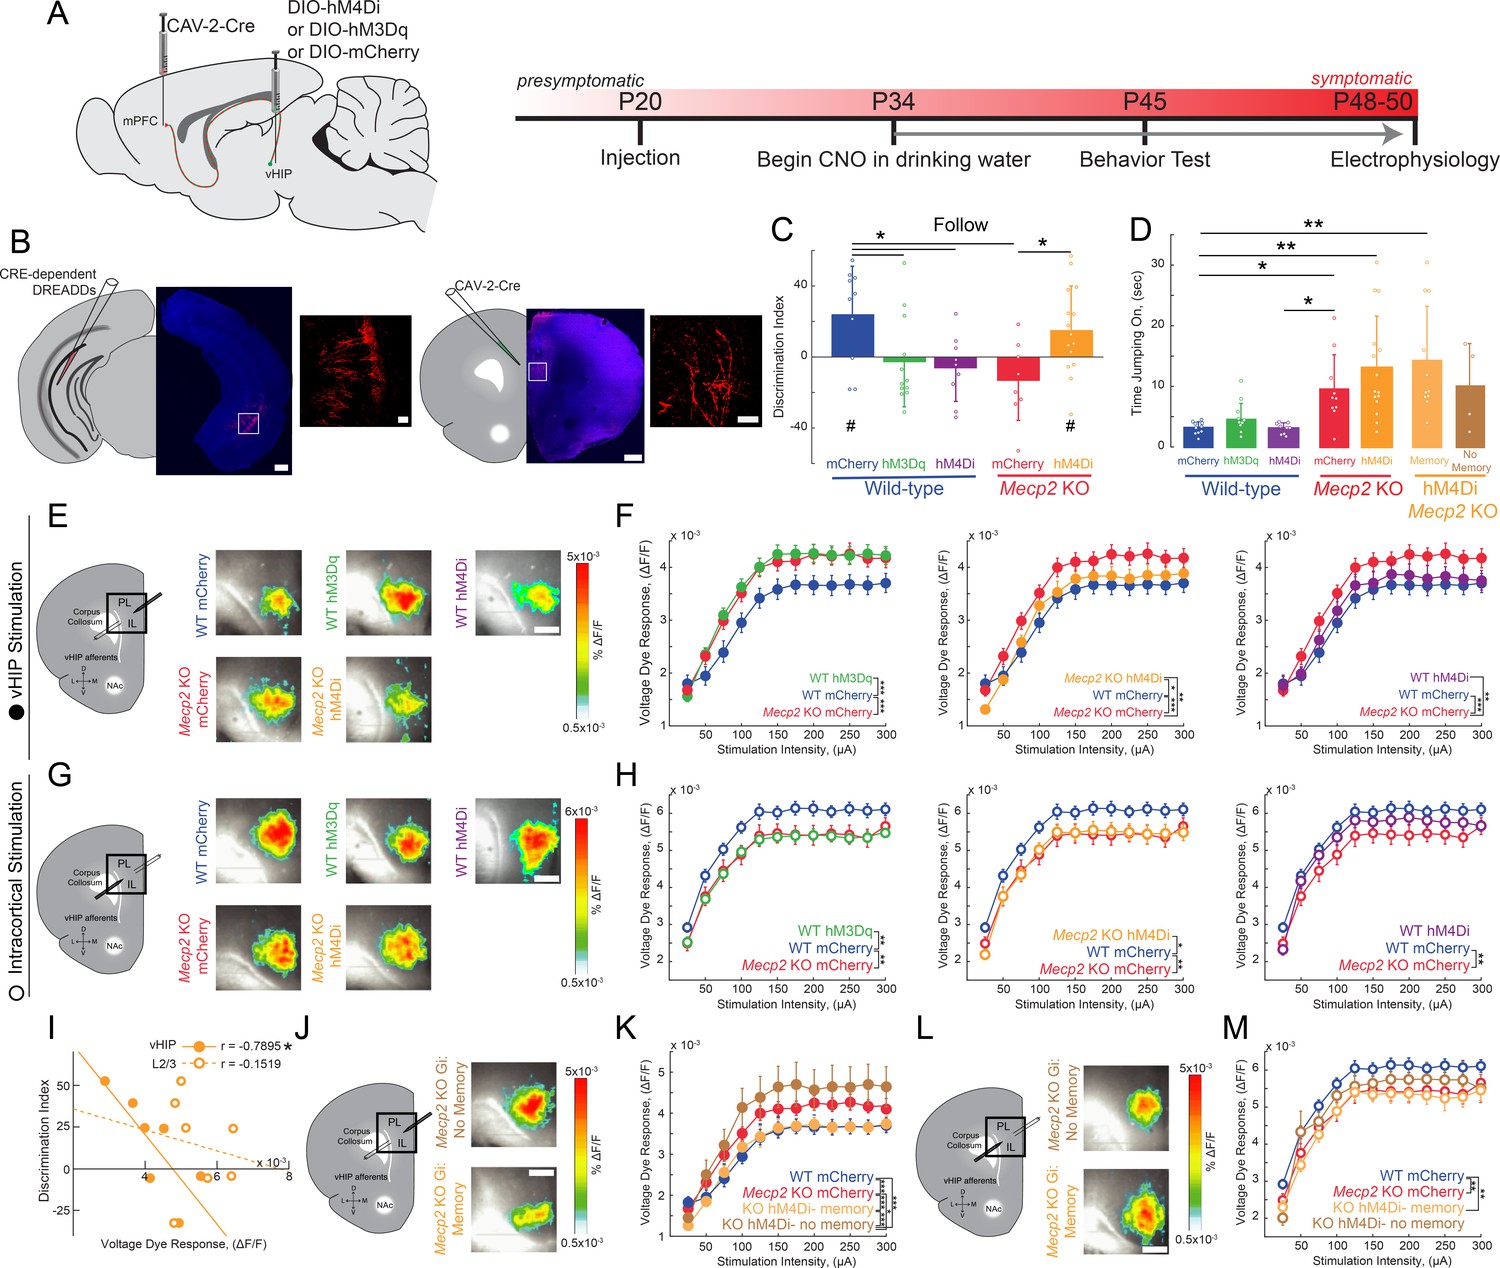
Activity of mPFC-projecting vHIP neurons modulates social memory in WT and Mecp2 KO mice.
(A) Schematic of CAV2-Cre and DREADD injections and experimental timeline. (B) Injection sites show sparse mCherry labeling of vHIP neurons with identifiable axons in the mPFC. Scale bar 500 µm large, 100 µm inset. (C) Discrimination Index of following familiar versus novel mice in unrestricted social interaction, scored by JAABA (n = 10 mCherry WT mice, p=0.0202; n = 12 hM3Dq WT mice, p=0.6905; n = 9 hM4Di WT mice, p=0.3332; n = 10 mCherry Mecp2 KO, p=0.1322; n = 15 Mecp2 KO mice, p=0.0312; One-sample Student’s t-test against chance. mCherry WT vs. hM3Dq WT mice, p=0.0287; mCherry WT vs. hM4Di WT mice, p=0.0081; mCherry WT vs. mCherry Mecp2 KO mice, p=0.0187; mCherry Mecp2 KO vs. hM3Dq WT mice p=0.4674; mCherry Mecp2 KO vs. hM4Di WT mice, p=0.6108; mCherry Mecp2 KO mice vs. hM4Di Mecp2 KO mice, p=0.0287; ANOVA p=0.0048; One-Way ANOVA with Benjamini and Hochberg Multiple Comparisons). (D) Time spent ‘jumping on’ other mice during unrestricted social interaction (n = 9 mCherry WT mice; n = 12 hM3Dq WT mice; n = 9 hM4Di WT mice; n = 10 mCherry Mecp2 KO; n = 15 hM4Di Mecp2 KO mice; mCherry WT vs. mCherry Mecp2 KO, p=0.0215; hM3Dq WT vs. mCherry WT, p>0.9999; hM3Dq WT vs. hM4Di WT, p>0.9999; hM3Dq WT vs. mCherry Mecp2 KO, p=0.2119; hM4Di WT vs. mCherry WT, p>0.9999; hM4Di WT vs. mCherry Mecp2 KO, p=0.0194; mCherry Mecp2 KO vs. hM4Di (All) Mecp2 KO, p>0.9999; hM4Di (All) Mecp2 KO vs. mCherry WT, p=0.0016; Memory hM4Di vs. mCherry KO, p>0.9999; Memory hM4Di vs. mCherry WT, p=0.0012; No Memory hM4Di vs. mCherry Mecp2 KO, p>0.9999; No Memory hM4Di vs. mCherry WT, p=0.8023; Memory hM4Di vs. No Memory hM4Di, p>0.9999, Kruskal-Wallis test with Dunn’s multiple corrections). (E) Representative VSD responses evoked by vHIP fiber stimulation in CNO-treated mice. Scale bar 200 µm. (F) Input-output relationships of peak VSD responses evoked by vHIP fiber stimulation. (mCherry WT vs. mCherry Mecp2 KO, p<0.001; hM3Dq WT vs. mCherry WT, p<0.0001; hM3Dq WT vs. mCherry Mecp2 KO, p=0.6530; mCherry WT vs. hM4Di, p=0.0642; hM4Di WT vs. mCherry Mecp2 KO, p=0.0013; hM4Di Mecp2 KO vs. mCherry WT, p=0.0333; hM4Di Mecp2 KO vs. mCherry Mecp2 KO, p=0.0016; Interaction p<0.0001; Stim p<0.0001; Group p=0.0193; Two-way RM ANOVA with Benjamini and Hochberg Multiple Comparisons). (G) Representative VSD responses evoked by intracortical stimulation in CNO-treated mice. (H) Input-output relationships of peak VSD responses evoked by intracortical stimulation (mCherry WT vs. mCherry Mecp2 KO, p<0.0001; hM3Dq WT vs. mCherry WT, p<0.0001; hM3Dq WT vs. mCherry Mecp2 KO, p 0.2164; mCherry WT vs. hM4Di WT, p=0.8296; hM4Di WT vs. mCherry Mecp2 KO, p<0.0001; hM4Di Mecp2 KO vs. mCherry WT, p=0.0023; hM4Di Mecp2 KO vs. mCherry Mecp2 KO, p=0.0726; Interaction p=0.2985; Stim p<0.0001; Group p=0.0479; Two-way RM ANOVA with Benjamini and Hochberg Multiple Comparisons). (I) Correlation between social memory DIs and VSD responses evoked by either vHIP fiber (closed circles) or intracortical stimulation (open circles) (n = 7 slices from 7 hM4Di Mecp2 KO mice; Spearman r correlation; r = −0.7895, p=0.0347 vHIP fiber; r = −0.1519, p=0.7451 intracortical). (J–K) Input-output relationships of peak VSD responses evoked by vHIP fiber stimulation in slices from hM4Di Mecp2 KO mice with intact or impaired social memory (Memory vs. mCherry WT, p=0.3043; Memory vs. mCherry Mecp2 KO, p<0.0001; No Memory vs. mCherry WT, p<0.0001; No Memory vs. mCherry Mecp2 KO, p=0.0406; Memory vs. No Memory, p<0.0001; Interaction p<0.0001; Stim p<0.0001; Group p=0.0056; Two-way RM ANOVA with Benjamini and Hochberg Multiple Comparisons). (L–M) Input-output relationships of peak VSD responses evoked by intracortical stimulation in slices from hM4Di Mecp2 KO mice with intact or impaired social memory (Memory vs. mCherry WT, p=0.0002; Memory vs. mCherry Mecp2 KO, p=0.3043; No Memory vs. mCherry WT, p=0.2171, No Memory vs. mCherry Mecp2 KO, p=0.0720; Memory vs. No Memory, p=0.2171; Interaction p=0.2241; Stim p<0.0001; Group p=0.0761; Two-way RM ANOVA with Benjamini and Hochberg Multiple Comparisons). (E–M) n = 18 slices from 9 mCherry (18/9) WT mice; n = 12/8 hM3Dq WT mice; n = 16/9 hM4Di WT mice; n = 17/8 mCherry Mecp2 KO mice; n = 20/10 hM4Di Mecp2 KO mice; n = 11/6 hM4Di Mecp2 KO memory mice; n = 6/4 hM4Di Mecp2 KO no memory mice). (C–D) Mean ± SD; (F,H,K,M) Mean ± SEM; *p<0.05, **p<0.01. Figure 4—source data 1. See also Figure 4—figure supplements 1–5.
-
Figure 4—source data 1
VSD responses to vHIP stimulation in mPFC slices and LTP at vHIP-mPFC synapses are not altered in presymptomatic Mecp2KO mice.
- https://doi.org/10.7554/eLife.44182.027
Figure 4—figure supplement 1
Social memory is not altered in presymptomatic Mecp2 KO mice.
(A) Discrimination index of time spent investigating the empty inverted pencil cup or the cup containing either stranger 1 or stranger 2 (WT sociability, p=0.0001; Mecp2 KO sociability, p=0.0046; WT memory, p=0.0149; Mecp2 KO memory, p=0.0027; One-sample t-test against chance; WT vs.Mecp2 KO sociability, p=0.1394; WT vs. Mecp2 KO memory, p=0.6001; two-sample t-test; n = 8 WT mice; n = 10 Mecp2 KO). * denotes significant differences between groups, # denotes significant difference from chance values. (B) Absolute times for three chamber social task. Mean ± SD; *, # p<0.05, **p<0.01.
-
Figure 4—figure supplement 1—source data 1
VSD responses to vHIP stimulation in mPFC slices and LTP at vHIP-mPFC synapses are not altered in presymptomatic Mecp2KO mice.
- https://doi.org/10.7554/eLife.44182.018
Figure 4—figure supplement 2

VSD responses to vHIP stimulation in mPFC slices and LTP at vHIP-mPFC synapses are not altered in presymptomatic Mecp2 KO mice.
(A) Schematic of VSD imaging in an mPFC slice during stimulation of vHIP fibers and representative VSD responses evoked by a single vHIP fiber stimulation. Scale bar 100 µm. (B–D) Input-output relationships of VSD peak responses (B) p=0.424, Two-way ANOVA), spatiotemporal spread (C) p=0.625, Two-way RM ANOVA), and spread over time (D) p=0.2918 Student’s t-test) (at 150 µA intensity) evoked by a single vHIP fiber stimulation. (E) Schematic of VSD imaging in an mPFC slice during stimulation of intracortical fibers and representative VSD responses evoked by a single intracortical stimulation. (F–H) Input-output relationships of VSD peak responses (F) p=0.4663, Two-way ANOVA), spatiotemporal spread (G) p=0.3972, Two-Way RM ANOVA), and spread over time (H) p=0.2582, Student’s t-test) (at 150 µA intensity) evoked by a single intracortical stimulation. (I–K) Peak VSD responses (I) p=0.2278, Two-way RM ANOVA), spatiotemporal spread (J) p=0.5857, Two-way ANOVA), and spread over time (K) p=0.9145, Student’s t-test) evoked by a single vHIP fiber stimulation normalized to those evoked by a single intracortical stimulation. (A–K) n = 14 slices from five mice WT; n = 18 5 Mecp2 KO mice). (L) Representative images of peak VSD responses to a single test stimulation before and after high-frequency stimulation to induce LTP. (M) Normalized spatiotemporal spread of single test VSD responses before and after LTP induction; high-frequency stimulation given at arrow. (N–O) Spread over time of single test VSD responses at baseline (1) and 40 min after LTP induction (2), normalized to baseline peak spread in WT slices (N) p=0.0159, Wilcoxon paired test) and Mecp2 KO slices (o) p=2.165×10⁻⁵, Wilcoxon paired test) (L–N) n = 5 slices from 5 WT mice; n = 9/5 Mecp2 KO mice). Spatiotemporal spread is the AOC created by spread of the cortical area (% of total) and time (ms). Mean ± SEM; *p<0.05, **p<0.01.
-
Figure 4—figure supplement 2—source data 1
VSD responses to vHIP stimulation in mPFC slices of Mecp2KO mice do not develop in a typical manner.
- https://doi.org/10.7554/eLife.44182.020
Figure 4—figure supplement 3
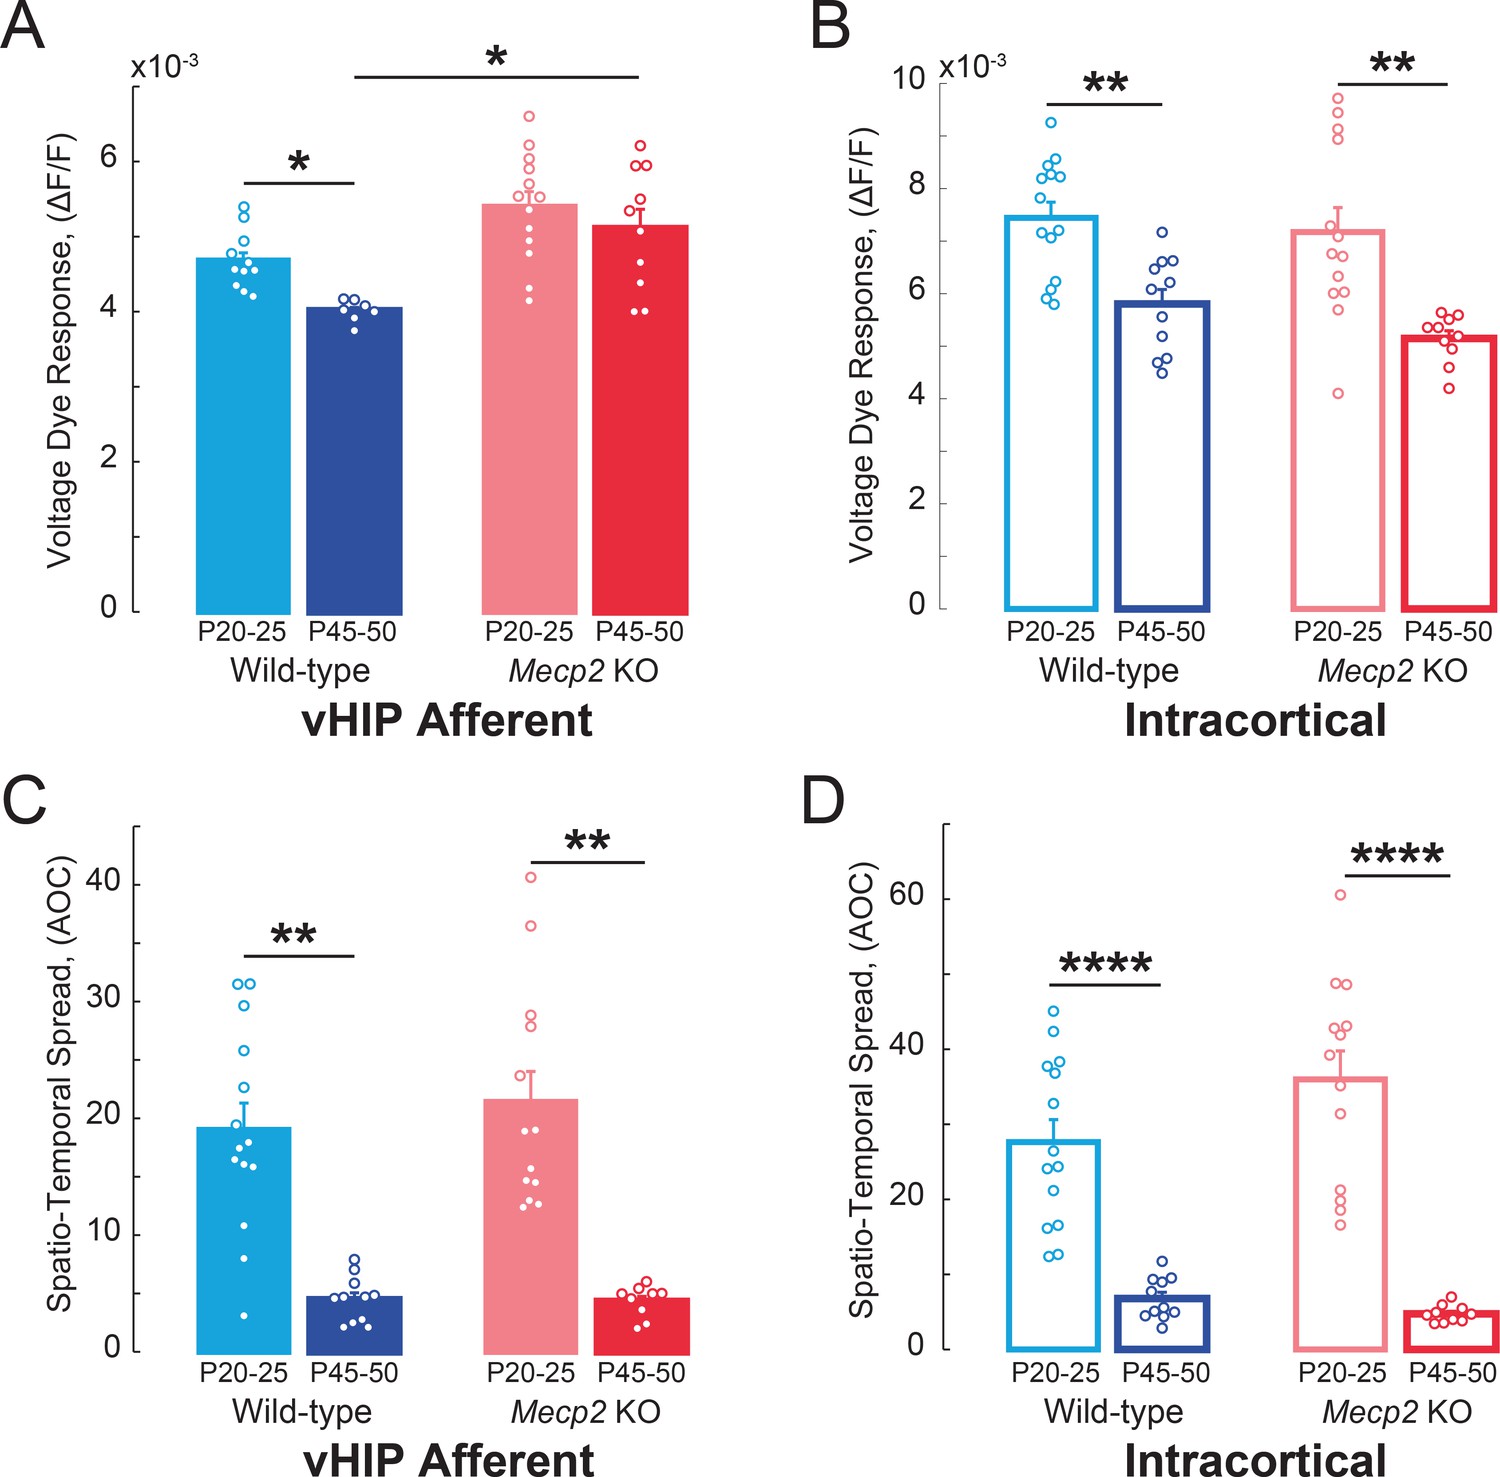
VSD responses to vHIP stimulation in mPFC slices of Mecp2 KO mice do not develop in a typical manner.
(A–B) Peak VSD responses evoked by either (A) a single vHIP fiber stimulation or (B) a single intracortical stimulation in mPFC slices from WT and Mecp2 KO mice at P20-25 and P45-50 (WT young vs.WT adult vHIP p=0.0151; WT young vs. Mecp2 KO young vHIP p=0.4678; Mecp2 KO young vs. Mecp2 KO adult vHIP p=0.4678; WT adult vs. Mecp2 KO adult vHIP p=0.0157; Interaction p=0.1166; Age p=0.0061; Genotype p=0.0099; Two-Way ANOVA with Benjamini and Hochberg Multiple Comparisons; WT young vs. WT adult intracortical p=0.0020; WT young vs. Mecp2 KO young intracortical p=0.4145; Mecp2 KO young vs. Mecp2 KO adult intracortical p=0.0018; WT adult vs. Mecp2 KO adult intracortical p=0.3699; Interaction p=0.8253; Age p<0.0001; Genotype p=0.1946; Two-Way ANOVA with Benjamini and Hochberg Multiple Comparisons). (C–D) Spatiotemporal spread of VSD signals evoked by (C) vHIP afferent stimulation or (D) intracortical stimulation in mPFC slices from WT and Mecp2 KO mice at P20-25 and P45-50 (WT young vs. WT adult vHIP p<0.0001; WT young vs. Mecp2 KO young vHIP, p=0.9532; Mecp2 KO young vs. Mecp2 KO adult vHIP, p<0.001; WT adult vs. Mecp2 KO adult vHIP, p=0.9532; Interaction p=0.9336; Age p<0.0001; Genotype p=0.8700; Two-Way ANOVA with Benjamini and Hochberg Multiple Comparisons; WT young vs. WT adult intracortical, p<0.0001; WT young vs. Mecp2 KO young intracortical, p=0.2549; Mecp2 KO young vs. Mecp2 KO adult intracortical p<0.0001; WT adult vs. Mecp2 KO adult intracortical, p=0.6539; Interaction p=0.2358; Age p<0.0001; Genotype p=0.5842; Two-Way ANOVA with Benjamini and Hochberg Multiple Comparisons) (n = 14 slices from 5 P20-25 WT mice; n = 18/5 P20-25 Mecp2 KO, n = 11/7 P45-55 WT mice, n = 11/5 P45-55 Mecp2 KO mice; Spatiotemporal spread = AOC created by spread of the cortical area (% of total) and time (ms). Mean ± SEM; *p<0.05, **p<0.01.
-
Figure 4—figure supplement 3—source data 1
Lack of effects of long-term DREADD stimulation by CNO on anxiety and general (non-social memory) behaviors.
- https://doi.org/10.7554/eLife.44182.022
Figure 4—figure supplement 4
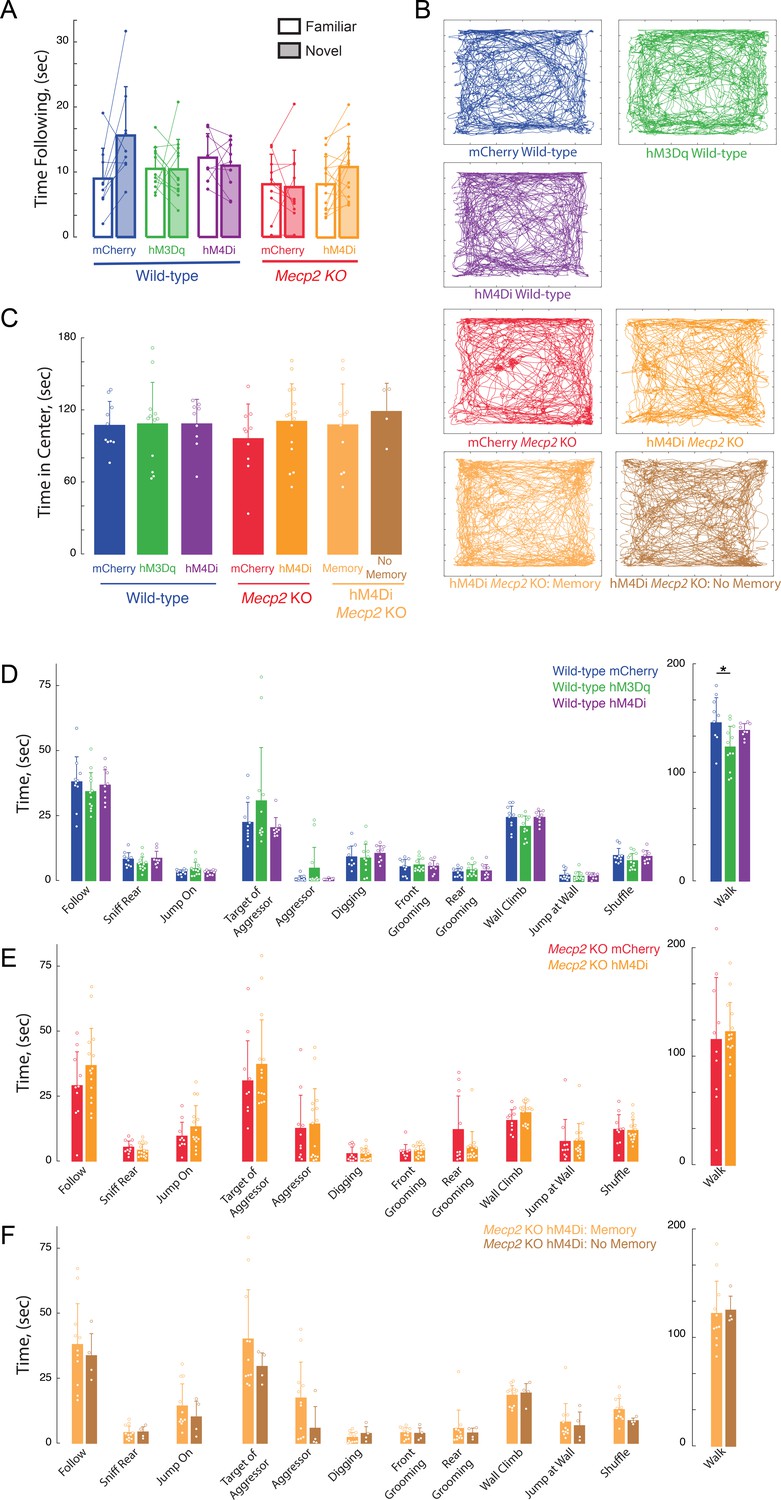
Lack of effects of long-term DREADD stimulation by CNO on anxiety and general (non-social memory) behaviors.
(A) Total times spent following novel vs. familiar sentinels. (B) Representative tracks of individual trajectories of test mice during social encounters in an open field. (C) Average time spent in the center of the open field, as a measure of anxiety (mCherry vs. hM3Dq WT p>0.9999; mCherry WT vs. Mecp2 KO, p=0.9793; hM3Dq WT vs. mCherry Mecp2 KO, p=0.9566; mCherry vs. hM4Di WT, p>0.9999; hM4Di WT vs. mCherry Mecp2 KO, p=0.9695; hM3Dq WT vs. hM4Di WT p>0.9999; mCherry vs. hM4Di (All) Mecp2 KO, p=0.8910; hM4Di (All) Mecp2 KO vs. mCherry WT, p>0.9999; mCherry NAc vs. mCherry mPFC WT, p=0.9492; mCherry vs. hM3Dq NAc WT, p=0.9952; Memory vs. mCherry Mecp2 KO, p=0.9727; Memory vs. mCherry WT, p>0.9999; No Memory vs. mCherry Mecp2 KO, p=0.8493; No Memory vs. mCherry WT, p=0.9941; Memory vs. No Memory, p=0.9947; One-way ANOVA with Turkey’s multiple comparisons). (D–F) Time spent engaging in social, aggressive, general, and locomotor behaviors during the unrestricted social interaction assay in (D) DREADD-expressing WT mice, (E) Mecp2 KO mice, and hM4Di Mecp2 KO mice separated by memory performance (F) after long-term CNO treatment (n = 9 mCherry WT mice; n = 12 hM3Dq WT mice; n = 9 hM4Di WT mice; One-Way ANOVA or Kruskal-Wallis test dependent on normalcy; n = 10 mCherry Mecp2 KO; n = 15 hM4Di Mecp2 KO mice; Student’s t-test or Mann-Whitney test dependent on normalcy).
-
Figure 4—figure supplement 4—source data 1
Memory Discrimination correlates to vHIP input to the mPFC in Mecp2KO mice.
- https://doi.org/10.7554/eLife.44182.024
Figure 4—figure supplement 5
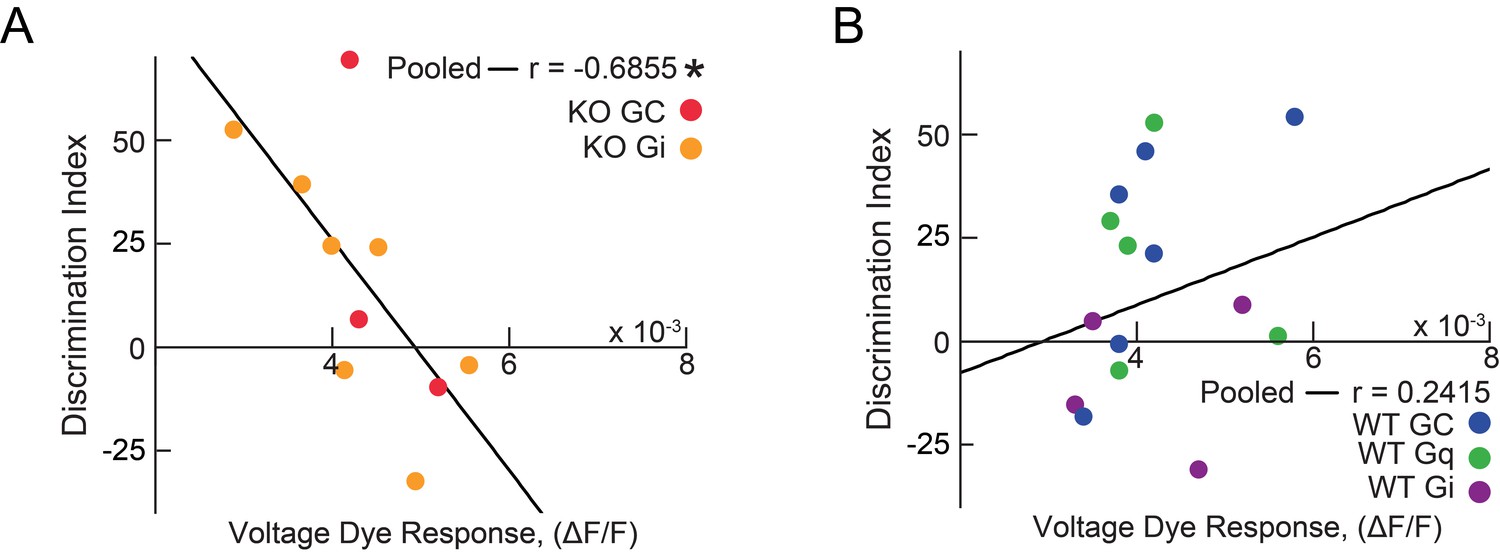
Memory Discrimination correlates to vHIP input to the mPFC in Mecp2 KO mice.
(A) Correlation between social memory DI and VSD responses evoked by vHIP fiber stimulation in Mecp2 KO mice expressing mCherry (red) or hM4Di (yellow), with correlation for pooled data (n = 10 slices from 10 Mecp2 KO mice; Spearman r correlation; r = −0.6855, p=0.0287). (B) Correlation between social memory DI and VSD responses evoked by vHIP fiber stimulation in WT KO mice expressing mCherry (blue), hM3Dq (green), or hM4Di (purple), with correlation for pooled data (n = 15 slices from 15 WT KO mice; Spearman r correlation; r = 0.2415, p=0.3859).
-
Figure 4—figure supplement 5—source data 1
Activity of mPFC-projecting vHIP neurons modulates social memory in WT and Mecp2KO mice.
- https://doi.org/10.7554/eLife.44182.026
Figure 5 with 1 supplement
Acute manipulation of activity of vHIP-mPFC projection neurons regulates social memory in a task- and projection-specific manner.
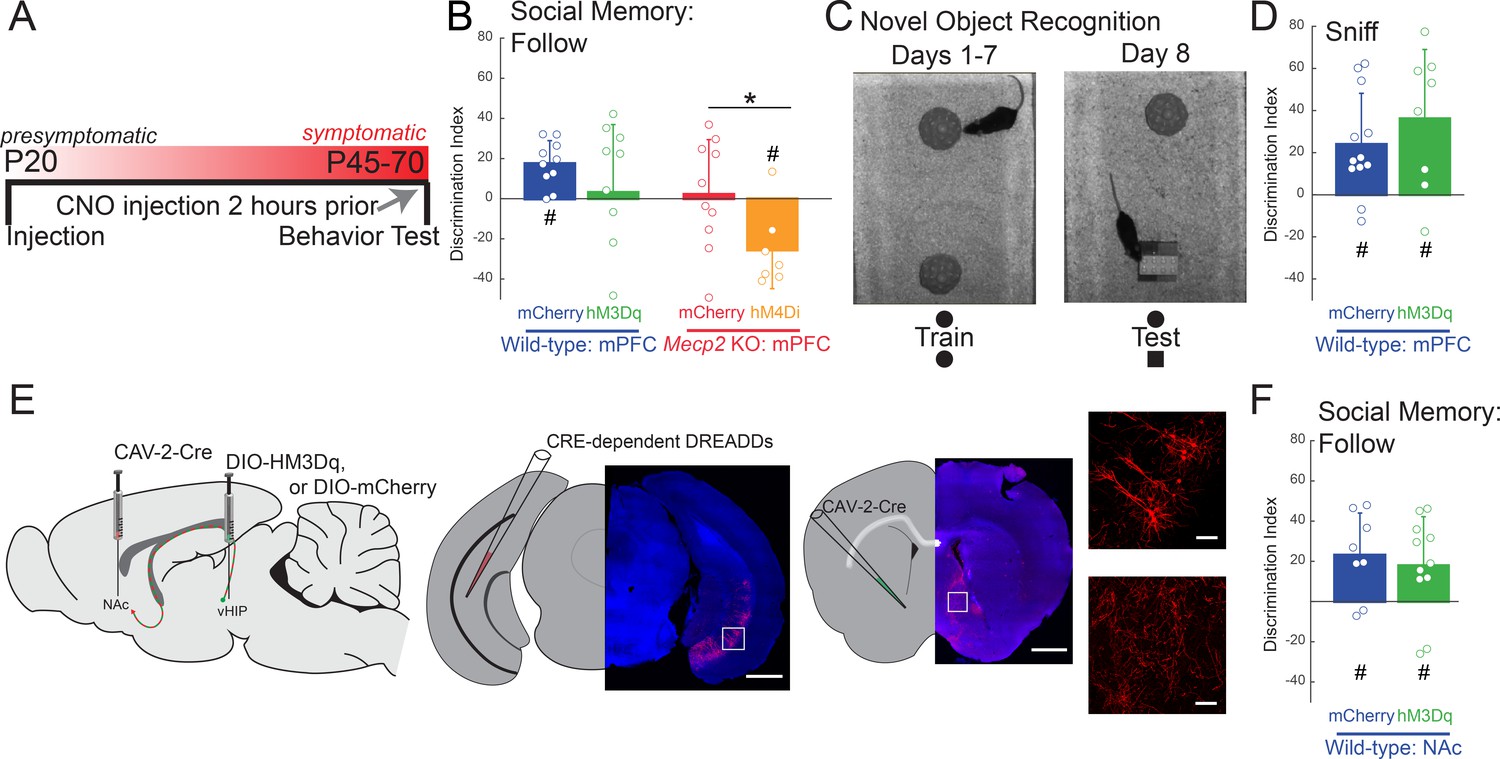
(A) Experimental timeline for acute DREADD manipulation of the vHIP-mPFC projection. (B) Time spent following either familiar or novel mice in unrestricted social interaction, scored by JAABA (n = 8 vHIP-mPFC mCherry WT mice, p=0.0135 Student’s paired t-test; n = 10 vHIP-mPFC hM3Dq WT mice, p=0.6052 Student’s paired t-test; n = 10 vHIP-mPFC mCherry Mecp2 KO mice, p=0.9219 Wilcoxon paired test; n = 8 vHIP-mPFC hM4Di Mecp2 KO mice, p=0.0469 Wilcoxon paired test). (C) Schematic of novel object recognition test. (D) Time spent sniffing either the familiar or novel object, scored by JAABA (n = 8 vHIP-mPFC mCherry WT mice, p=0.006 Student’s paired t-test; n = 10 vHIP-mPFC hM3Dq WT mice, p=0.0266 Student’s paired t-test). (E) Schematic of CAV2-Cre and DREADD injections to manipulate the vHIP-NAc projection. Injection sites show sparse mCherry labeling of vHIP neurons with identifiable axons in the NAc. Time spent following either familiar or novel mice in unrestricted social interaction, scored by JAABA (n = 10 vHIP-NAc mCherry WT mice, p=0.0391 Wilcoxon paired test; n = 11 vHIP-NAc hM3Dq WT mice, p=0.0189 Student’s paired t-test). Mean ± SD; *p<0.05, **p<0.01. Figure 5—source data 1. See also Figure 5—figure supplement 1.
-
Figure 5—source data 1
Acute manipulation of activity of vHIP-mPFC projection neurons regulates social memory in a task- and projection-specific manner.
- https://doi.org/10.7554/eLife.44182.031
Figure 5—figure supplement 1
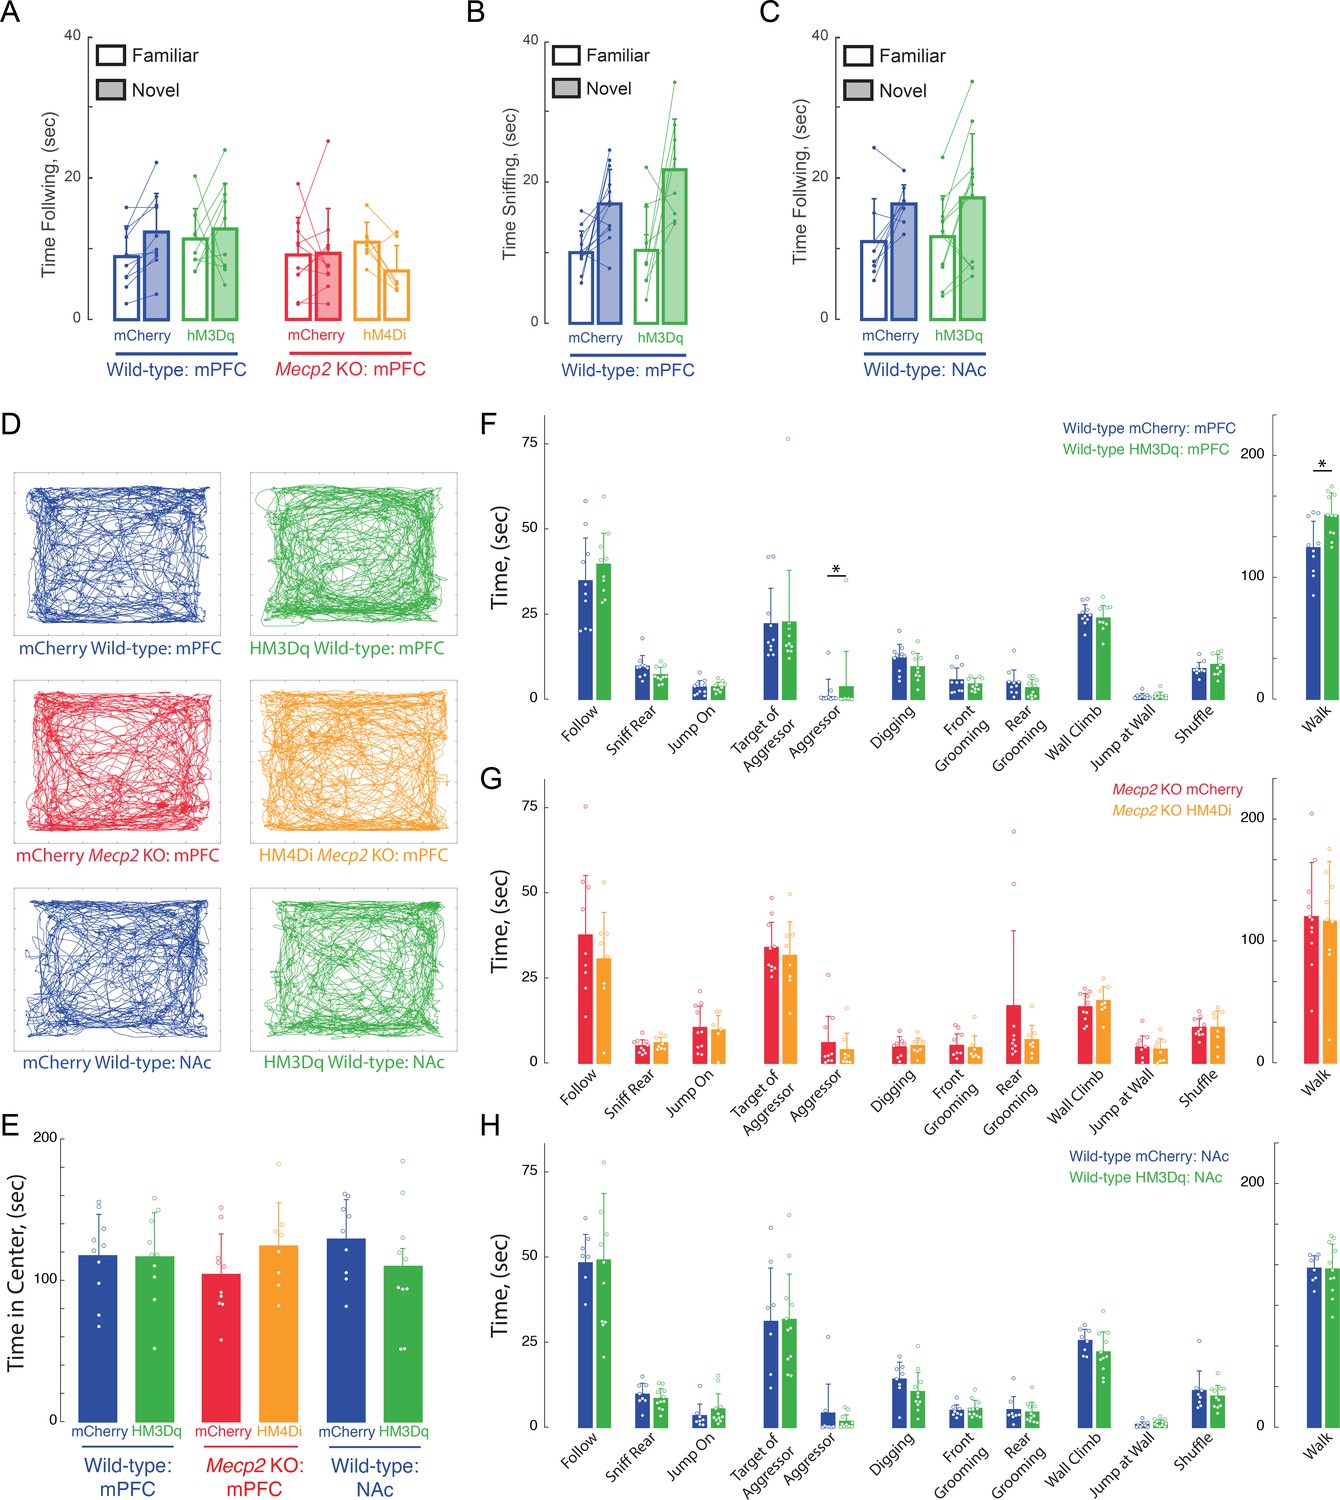
Lack of effects of Acute DREADD stimulation by CNO on anxiety and general (non-social memory) behaviors.
(A and C) Total times spent following novel vs.familiar sentinels in DREADDs expressed in mPFC-projecting vHIP neurons (A) or NAc-Projecting vHIP neurons (C). (B) Total times spent for sniffing novel vs. familiar objects in DREADDs expressed in mPFC-projecting vHIP neurons. (D) Representative tracks of individual trajectories of test mice during social encounters in an open field. (E) Average time spent in the center of the open field, as a measure of anxiety (mCherry mPFC vs. mPFC hM3Dq WT, p>0.9999; mCherry mPFC WT vs. Mecp2 KO, p=0.9937; hM3Dq WT mPFC vs. mCherry mPFC Mecp2 KO, p=0.9718; mCherry vs. hM4Di mPFC Mecp2 KO, p=0.8502; hM4Di mPFC Mecp2 KO vs. mCherry mPFC WT, p=0.9916; One-Way ANOVA). (F–H) Time spent engaging in social, aggressive, general, and locomotor behaviors during the unrestricted social interaction assay in (F) vHIP-mPFC DREADD-expressing WT mice, (G) and vHIP-mPFC Mecp2 KO mice (n = 10 vHIP-mPFC mCherry WT mice; n = 10 vHIP-mPFC hM3Dq WT mice; n = 11 vHIP-mPFC mCherry Mecp2 KO; n = 8 vHIP-mPFC hM4Di Mecp2 KO mice). (H) Time spent engaging in social, aggressive, general, and locomotor behaviors during the unrestricted social interaction assay in DREADD-expressing vHIP-NAc WT mice after acute CNO treatment (n = 8 vHIP-NAc mCherry WT mice; n = 10 vHIP-NAc hM3Dq WT mice; mCherry NAc vs. mCherry mPFC WT, p=0.9492; mCherry vs. hM3Dq NAc WT, p=0.9952; hM3Dq NAc WT vs. mCherry mPFC WT, p=0.9982; hM3Dq NAc WT vs. mCherry mPFC Mecp2 KO, p=0.9009; Student’s t-test or Mann-Whitney Test dependent on Normalcy). Mean ± SD; *p<0.05, **p<0.01.
-
Figure 5—figure supplement 1—source data 1
Acute manipulation of activity of vHIP-mPFC projection neurons regulates social memory in a task- and projection-specific manner.
- https://doi.org/10.7554/eLife.44182.030
Figure 6 with 1 supplement
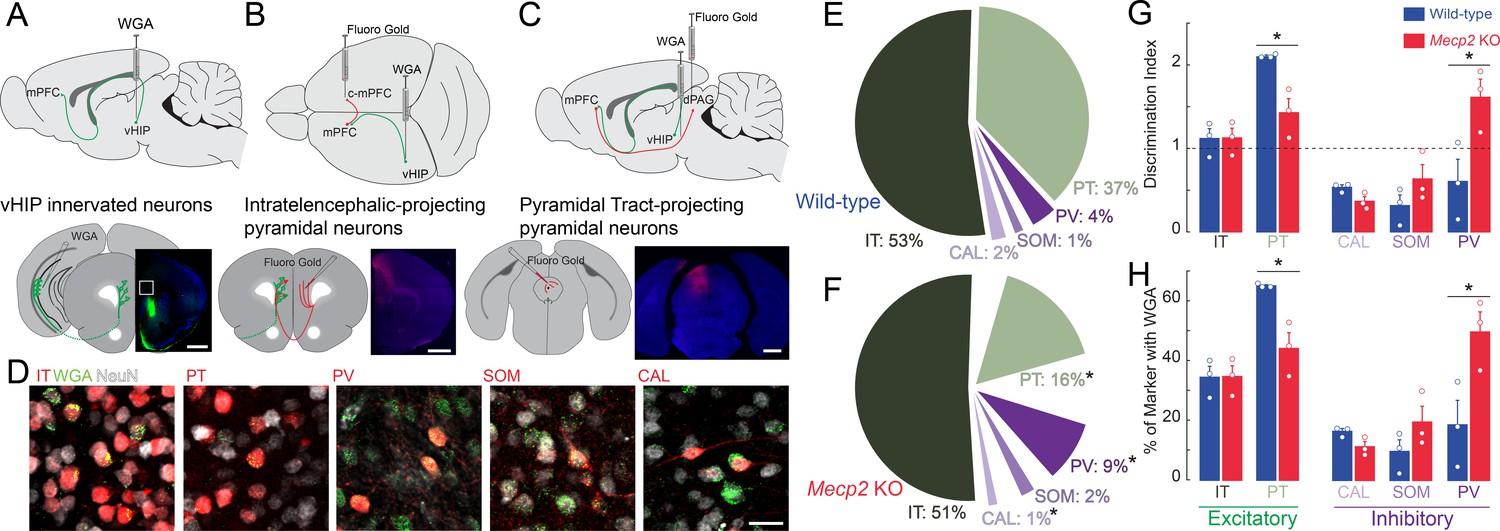
Trans-synaptic tracing of vHIP target neurons in the mPFC.
(A) WGA injection sites for brains to be used for immunohistochemistry of interneuron markers. Scale bar = 1 mm. (B) Injection sites for brains to be used for identifying contralateral projecting mPFC neurons. Scale bar = 1 mm. (C) Injection sites for brains to be used for identifying dPAG projecting mPFC neurons. Scale bar = 1 mm. (D) Representative examples of WGA identification of inhibitory and excitatory neurons receiving vHIP innervation. Scale bar = 25 µm. (E–F) Breakdown of WGA innervated neurons by subtype in WT (E) and Mecp2 KO mice (F) (IT p=0.8695; PT p=0.0128; CAL p=0.0621; SOM p=0.259; PV p=0.0477, Student’s t-test). (G) Discrimination index of innervated cells, with at ‘at chance’ innervation being 1 (IT p=0.9646; PT p=0.0161; CAL p=0.591; SOM p=0.208; PV p=0.0425, Student’s t-test). (H) Percent of neuron subtype receiving vHIP innervation (IT p=0.9646; PT p=0.0161; CAL p=0.591; SOM p=0.208; PV p=0.0425, Student’s t-test) (n = 9 sections three mice for all groups). Mean ± SEM; *p<0.05, **p<0.01. Figure 6—source data 1. See also Figure 6—figure supplement 1.
-
Figure 6—source data 1
Trans-synaptic tracing of vHIP target neurons in the mPFC.
- https://doi.org/10.7554/eLife.44182.034
Figure 6—figure supplement 1
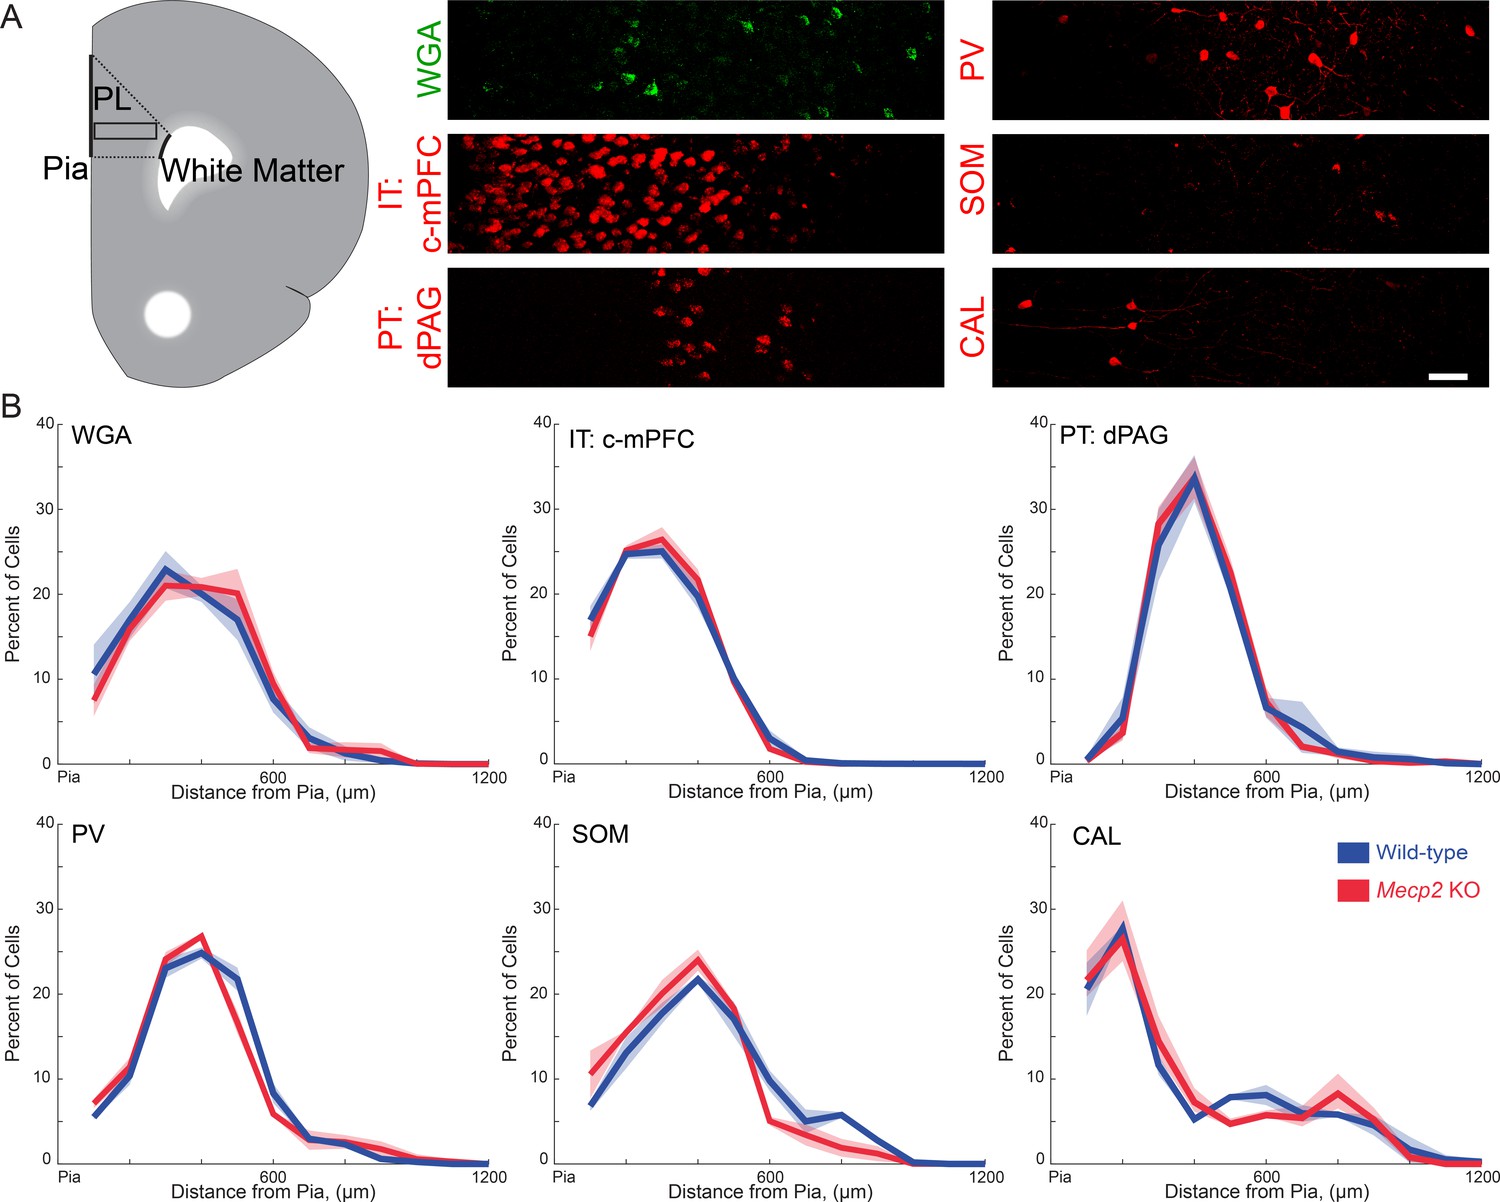
Spatial distribution of different neuronal subtypes in the mPFC that are innervated by vHIP fibers in wild-type and Mecp2 KO mice.
(A) Schematic of the PL region of the mPFC (left), and representative images of immunostaining for trans-synaptic WGA; PV, SOM, and CAL interneurons; and retrograde FluoroGold labeling of c-mPFC and dPAG pyramidal neurons in the PL-mPFC. Scale bar 50 μm. (B) Percent of each neuronal subtype as a function of distance from the pial surface (inter-hemispheric midline) (n = 15 sections from five mice each for WT and Mecp2 KO WGA staining, n = 9/3 for both WT and Mecp2 KO mice with c-mPFC, dPAG, PV, SOM, and CAL). Mean ± SEM (shaded area).
Figure 7 with 1 supplement

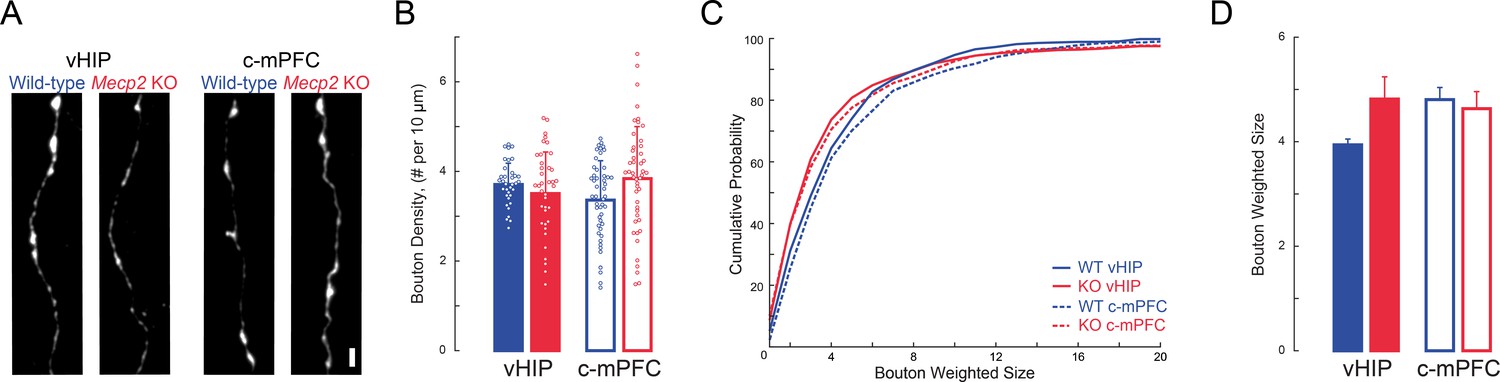
The size of presynaptic boutons is altered in layer 5 of the mPFC of Mecp2 KO mice.
(A–B) Schematic and representative examples of AAV2-hSyn-mCherry injection sites for identifying vHIP axons (A) or contralateral mPFC axons (B). Scale bars 1 mm. (C) Schematic of vHIP axons in the mPFC. (D) Axonal swellings identified as presynaptic boutons co-labeled for mCherry and VGLUT1. Scale bar 2 µm. (E) Representative examples of mCherry-filled presynaptic boutons. Scale bar 2 µm. (F) Numerical densities of axonal boutons per length of vHIP and c-mPFC axons located in layer 5 of mPFC (n = 45 axons WT vHIP; n = 36 Mecp2 KO vHIP; n = 49 WT c-mPFC; n = 43 KO c-mPFC; WT vHIP vs. Mecp2 KO vHIP, p=0.9925; WT vHIP vs. WT c-mPFC, p=0.8317 Mecp2 KO vHIP vs. Mecp2 KO c-mPFC, p=0.6765; WT c-mPFC vs. Mecp2 KO c-mPFC, p=0.6765; Interaction p=0.0135; Axon p=0.9592; Genotype p=0.3102; Two-way ANOVA with Benjamini and Hochberg multiple comparisons). Mean ± SD. (G) Cumulative probability distributions of the estimated size of presynaptic boutons comparing vHIP and c-mPFC axons in mPFC layer 5 of WT and Mecp2 KO mice. (H) Average weighted bouton sizes (vHIP WT mice vs. Mecp2 KO mice, p<0.0001; c-mPFC WT mice vs. Mecp2 KO mice, p=2320; vHIP vs. c-mPFC WT mice, p<0.0001; vHIP vs. c-mPFC Mecp2 KO mice, p=0.0133; n = 993 WT vHIP boutons; n = 682 KO vHIP; n = 792 WT c-mPFC; n = 577 KO c-mPFC; Interaction p=0.1193; Axon p=0.3135; Genotype p=0.2967; Two-way ANOVA with Benjamini and Hochberg multiple comparisons). Mean ± SEM; *p<0.05, **p<0.01. Figure 7—source data 1. See also Figure 7—figure supplement 1.
-
Figure 7—source data 1
The size of presynaptic boutons is altered in layer 5 of the mPFC of Mecp2KO mice.
- https://doi.org/10.7554/eLife.44182.038
Figure 7—figure supplement 1
Presynaptic boutons are not altered in Layer 2/3 of the mPFC in Mecp2 KO mice.
(A) Representative examples of mCherry-filled presynaptic boutons. Scale bar 2 µm. (B) Numerical densities of axonal boutons per length of vHIP and c-mPFC axons located in layer 2/3 of mPFC (n = 37 WT vHIP; n = 41 KO vHIP; n = 49 WT c-mPFC; n = 49 KO c-mPFC; WT vHIP vs. Mecp2 KO vHIP, p=0.4746; WT vHIP vs. WT c-mPFC, p=0.1711; Mecp2 KO vHIP vs. Mecp2 KO c-mPFC, p=0.1711; WT c-mPFC vs. Mecp2 KO c-mPFC, p=0.0601; Two-way ANOVA with Benjamini and Hochberg Multiple Comparisons). Mean ± SD. (C) Cumulative probability distributions of axonal bouton sizes comparing vHIP and c-mPFC axons in layer 2/3 of WT and Mecp2 KO mice. (D) Average axonal bouton sizes. (vHIP WT mice vs. Mecp2 KO mice, p=2565; c-mPFC WT mice vs. Mecp2 KO mice, p=8422; vHIP vs. c-mPFC WT mice, p=0.2565; vHIP vs. c-mPFC Mecp2 KO mice, p=0.8422; n = 543 boutons WT vHIP; n = 733 KO vHIP; n = 543 WT c-mPFC; n = 818 KO c-mPFC; Two-way ANOVA with Benjamini and Hochberg Multiple Comparisons). Mean ± SEM; *p<0.05, **p<0.01.
-
Figure 7—figure supplement 1—source data 1
The size of presynaptic boutons is altered in layer 5 of the mPFC of Mecp2KO mice.
- https://doi.org/10.7554/eLife.44182.037
Figure 8 with 1 supplement
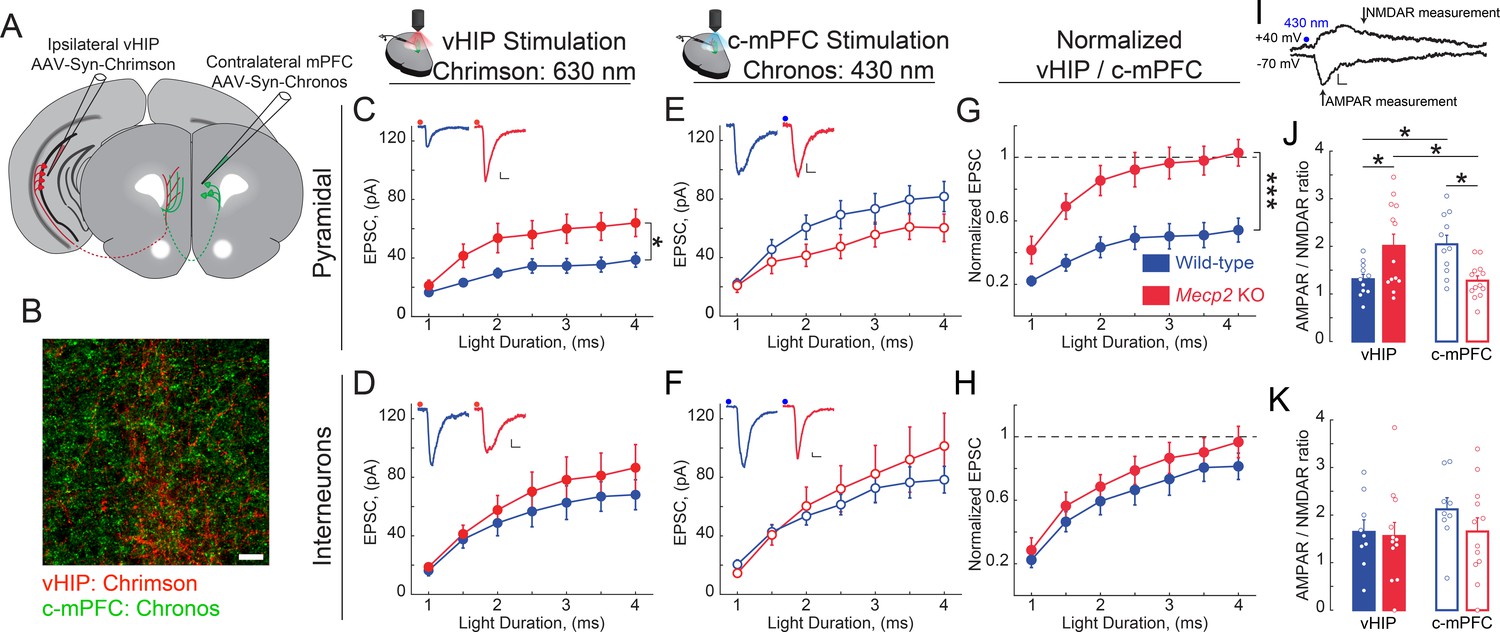
vHIP synapses on mPFC layer five pyramidal neurons are stronger in Mecp2 KO mice.
(A) Schematic of injection sites for Chrimson in the ipsilateral vHIP and Chronos in the contralateral mPFC. (B) Representative image of an mPFC slice with Chrimson-expressing vHIP afferents and Chronos-expressing c-mPFC afferents. Scale bar 50 µm. (C and D) Input-output relationship of vHIP afferent (red light) evoked responses in pyramidal neurons (C) Interaction p=0.0093; Stim p<0.0001; Genotype p=0.0118, Two-way RM ANOVA) and interneurons (D) Interaction p=0.2692; Stim p<0.0001; Genotype p=0.4327, Two-way RM ANOVA) with representative traces (inset). (E and F) Input-output relationship of c-mPFC afferent (blue light) evoked responses in pyramidal neurons (E) Interaction p=0.69643; Stim p<0.0001; Genotype p=0.1617, Two-way RM ANOVA) and interneurons (F) Interaction p=0.4222; Stim p<0.0001; Genotype p=0.6129, Two-way RM ANOVA) with representative traces (inset) (Scale bars 10 pA/12 ms). (G and H) The amplitude of vHIP afferent (red light)-evoked EPSCs was normalized to the peak EPSCs evoked by blue light stimulation of c-mPFC afferents in pyramidal neurons (G) Interaction p=0.0098; Stim p<0.0001; Genotype p=0.0003, Two-way RM ANOVA) and interneurons (H) Interaction p=0.9644; Stim p<0.0001; Genotype p=0.3208, Two-way RM ANOVA) (n = 17 cells from 6 slices from six mice WT pyramidal neurons, 11/7/7 WT interneurons, 11/5 KO pyramidal cells, 12/9/9 KO interneurons). (I) Representative example trace showing the time windows were measurements were made to calculate the AMPAR/NMDAR ratio (Scale bar 5 pA/10 ms). (J and K) AMPAR/NMDAR ratios of vHIP afferent (red light)-evoked and c-mPFC afferent (blue light)-evoked responses in pyramidal cells (J) WT vs. Mecp2 KO vHIP, p=0.0114, WT vs. Mecp2 KO c-mPFC, p=0.0038; WT vHIP vs. WT c-mPFC, p=0.0114; Mecp2 KO vHIP vs. Mecp2 KO c-mPFC, p=0.0114; Interaction p=0.0002; Input p0.9912; Genotype p=0.8544; Two-way ANOVA with Benjamini and Hochberg multiple comparisons) and interneurons (K) WT vs. Mecp2 KO vHIP, p=0.8843; WT vs. Mecp2 KO c-mPFC, p=0.8121; WT vHIP vs. WT c-mPFC, p=0.8121; Mecp2 KO vHIP vs. Mecp2 KO c-mPFC, p=0.8843; Interaction p=0.4896; Input p=0.2825; Genotype p=0.6265; Two-way ANOVA with Benjamini and Hochberg multiple comparisons) (n = 11 cells from 6 slices from six mice WT pyramidal cells; 9/7/7 WT interneurons; 13/5/5 Mecp2 KO pyramidal cells for both vHIP and c-mPFC stimulation; 11/9/9 Mecp2 KO interneurons). Mean ± SEM; *p<0.05, **p<0.01. Figure 8—source data 1. See also Figure 8—figure supplement 1.
-
Figure 8—source data 1
vHIP synapses on mPFC layerfivepyramidal neurons are stronger in Mecp2KO mice.
- https://doi.org/10.7554/eLife.44182.042
Figure 8—figure supplement 1

Specific activation of axons expressing opsins with non-overlapping light sensitivity.
(A) EPSCs evoked by red light (630 nm) in a layer 5 mPFC neuron in a slice from a mouse with Chrimson injection in the vHIP; the same neuron did not respond to blue light (430 nm). (B) EPSCs evoked by blue light (430 nm) in a layer 5 mPFC neuron in a slice from a mouse with Chronos injection in the c-mPFC; the same neuron did not respond to red light (630 nm). (C) Input resistance and (D) whole-cell capacitance of visually identified pyramidal neurons and interneurons in layer 5 of mPFC (n = 17 pyramidal neurons from 8 slices from 8 WT mice, 15/8/8 WT interneurons, 14/5/5 Mecp2 KO pyramidal neurons, 14/8/8 Mecp2 KO interneurons; p=0.0002 WT pyramidal vs. interneuron input resistance, p=0.0035 Mecp2 KO pyramidal vs. interneuron; Interaction p=0.5739; Neuron Type p<0.0001; Genotype p=0.4085; Two-Way ANOVA with Benjamini and Hochberg Multiple Comparisons; p<0.0001 WT pyramidal vs. interneuron capacitance, p=0.0018 Mecp2 KO pyramidal vs. interneuron; Interaction p=0.4428; Neuron Type p<0.0001; Genotype p=0.3026; Two-Way ANOVA with Benjamini and Hochberg Multiple Comparisons). The whole-cell capacitance was estimated from the time constant of the exponential decay of the current response to a test voltage step. Mean ± SEM; *p<0.05, **p<0.01.
-
Figure 8—figure supplement 1—source data 1
vHIP synapses on mPFC layerfivepyramidal neurons are stronger in Mecp2KO mice.
- https://doi.org/10.7554/eLife.44182.041
Tables
Key resources table
| Reagent type (species) or resource | Designation | Source or reference | Identifiers | Additional information |
|---|---|---|---|---|
| Strain, strain background (Mus musculus) | Mecp2tm1.1Jae | Mutant Mouse Resource and Research Center | MMRRC:000415-UCD | |
| Genetic reagent (Virus) | AAV-hSyn-Chronos-GFP | UNC Vector Core | UNC Vector Core | AAV2 |
| Genetic reagent (Virus) | AAV-hSyn-ChrimsonR-tdTomato | UNC Vector Core | UNC Vector Core | AAV2 |
| Genetic reagent (Virus) | AAV-hSyn-mCherry | UNC Vector Core | UNC Vector Core | AAV2 |
| Genetic reagent (Virus) | CAV-2-Cre-GFP | CNRS Biocampus Montpellier | CNRS Biocampus Montpellier | |
| Genetic reagent (Virus) | pAAV8-DIO-hSyn-HM4D(Gi)-mCherry | Addgene | 44362 | AAV8 |
| Genetic reagent (Virus) | pAAV-DIO-hSyn-HM3D(Gq)-mCherry | Addgene | 44361 | AAV8 |
| Genetic reagent (Virus) | pAAV-DIO-hSyn-mCherry | Addgene | 50459 | AAV8 |
| Antibody | Anti-mCherry (Rabbit polyclonal) | Abcam | ab167453 | (1:500) |
| Antibody | Anti-vGlut1 (Guinea Pig polyclonal) | Synaptic Systems | 135304 | (1:500) |
| Antibody | Anti-GFP (chicken polyclonal) | Abcam | ab13970 | (1:500) |
| Antibody | Anti-PV (Rabbit polyclonal) | Abcam | ab11427 | (1:500) |
| Antibody | Anti-PV (Guinea Pig polyclonal) | Synaptic Systems | 195004 | (1:750) |
| Antibody | Anti-cFos (Guinea Pig polyclonal) | Synaptic Systems | 226004 | (1:500) |
| Antibody | Anti-CAL (Chicken polyclonal) | Synaptic Systems | 214106 | (1:750) |
| Antibody | Anti-SST (Guinea Pig polyclonal) | Synaptic Systems | 366004 | (1:750) |
| Antibody | Anti-NeuN (Mouse monoclonal) | Synaptic Systems | 266011 | (1:500) |
| Antibody | Anti-NeuN (Guinea Pig polyclonal | Synaptic Systems | 266004 | (1:1000) |
| Antibody | Anti-Lectin (Rabbit polyclonal) | Sigma | T4144-1VL | (1:2000) |
| Antibody | Alexa Fluor 488 Goat Anti-Rabbit | Jackson ImmunoResearch | 111-545-003 | (1:500) |
| Antibody | Alexa Fluor 594 Goat Anti-Rabbit | Jackson ImmunoResearch | 111-585-003 | (1:500) |
| Antibody | Alexa Fluor 594 Goat Anti-Guinea Pig | Jackson ImmunoResearch | 106-585-003 | (1:500) |
| Antibody | Alexa Fluor 594 Goat Anti-Chicken | Jackson ImmunoResearch | 103-585-155 | (1:500) |
| Antibody | Alexa Fluor 647 Goat Anti-Mouse | Jackson ImmunoResearch | 115-605-003 | (1:500) |
| Antibody | Biotinylated Goat Anti-Rabbit | Vector Laboratories | BA-1000 | (1:200) |
| Antibody | Biotinylated Goat Anti-Guinea Pig | Vector Laboratories | BA-7000 | (1:200) |
| Antibody | Streptavidin, Alexa Fluor 405 | Thermo Fisher Scientific | S-32351 | (1:1500) |
| Antibody | Streptavidin, Alexa Fluor 488 | Thermo Fisher Scientific | S-32354 | (1:1500) |
| Antibody | Streptavidin, Alexa Fluor 594 | Thermo Fisher Scientific | S-32356 | (1:1500) |
| Chemical compound, drug | Dextran-Alexa-594 10,000 MW | Thermo Fisher Scientific | D22913 | |
| Chemical compound, drug | Wheat Germ Agglutinin | Vector Laboratories | L-1020 | |
| Chemical compound, drug | FluoroGold | Fluorochrome | ||
| Chemical compound, drug | RetroBeads | Lumafluor Inc | ||
| Chemical compound, drug | Tetrodotoxin | Alomone Labs | ||
| Chemical compound, drug | 4-Aminopyridine | Sigma | 275875 | |
| Chemical compound, drug | D-AP5 | Tocris | 106 | |
| Software, algorithm | Motr | Janelia research center | https://github.com/motr/motr | |
| Software, algorithm | JAABA | Janelia research center | https://github.com/kristinbranson/JAABA | |
| Software, algorithm | Novel Object Recognition Add-on for JAABA | This paper | https://github.com/PhillipsML/NOR | |
| Software, algorithm | Voltage Sensitive Dye Analysis Code | This paper | https://github.com/PhillipsML/VoltageDyeAnalysis | |
| Software, algorithm | GraphPad Prism, version 8 | GraphPad | RRID:SCR_002798 | |
| Software, algorithm | TIWB | DOI: 10.1093/jmicro/dfy015. | ||
| Software, algorithm | Neuroplex | Red Shirt Imaging | ||
| Software, algorithm | ImageJ, FIJI | DOI: 10.1038/nmeth.2019 | ||
| Software, algorithm | Matlab, 2015b & 2017b | Mathworks | ||
| Other | Born Blonde Maxi | Clairol |
Additional files
-
Transparent reporting form
- https://doi.org/10.7554/eLife.44182.043
Download links
A two-part list of links to download the article, or parts of the article, in various formats.
Downloads (link to download the article as PDF)
Open citations (links to open the citations from this article in various online reference manager services)
Cite this article (links to download the citations from this article in formats compatible with various reference manager tools)
Ventral hippocampal projections to the medial prefrontal cortex regulate social memory
eLife 8:e44182.
https://doi.org/10.7554/eLife.44182


