Kinesin-6 regulates cell-size-dependent spindle elongation velocity to keep mitosis duration constant in fission yeast
- PSL Research University, CNRS, UMR 144, France
- University of Pennsylvania, United States
Figures
Figure 1 with 2 supplements
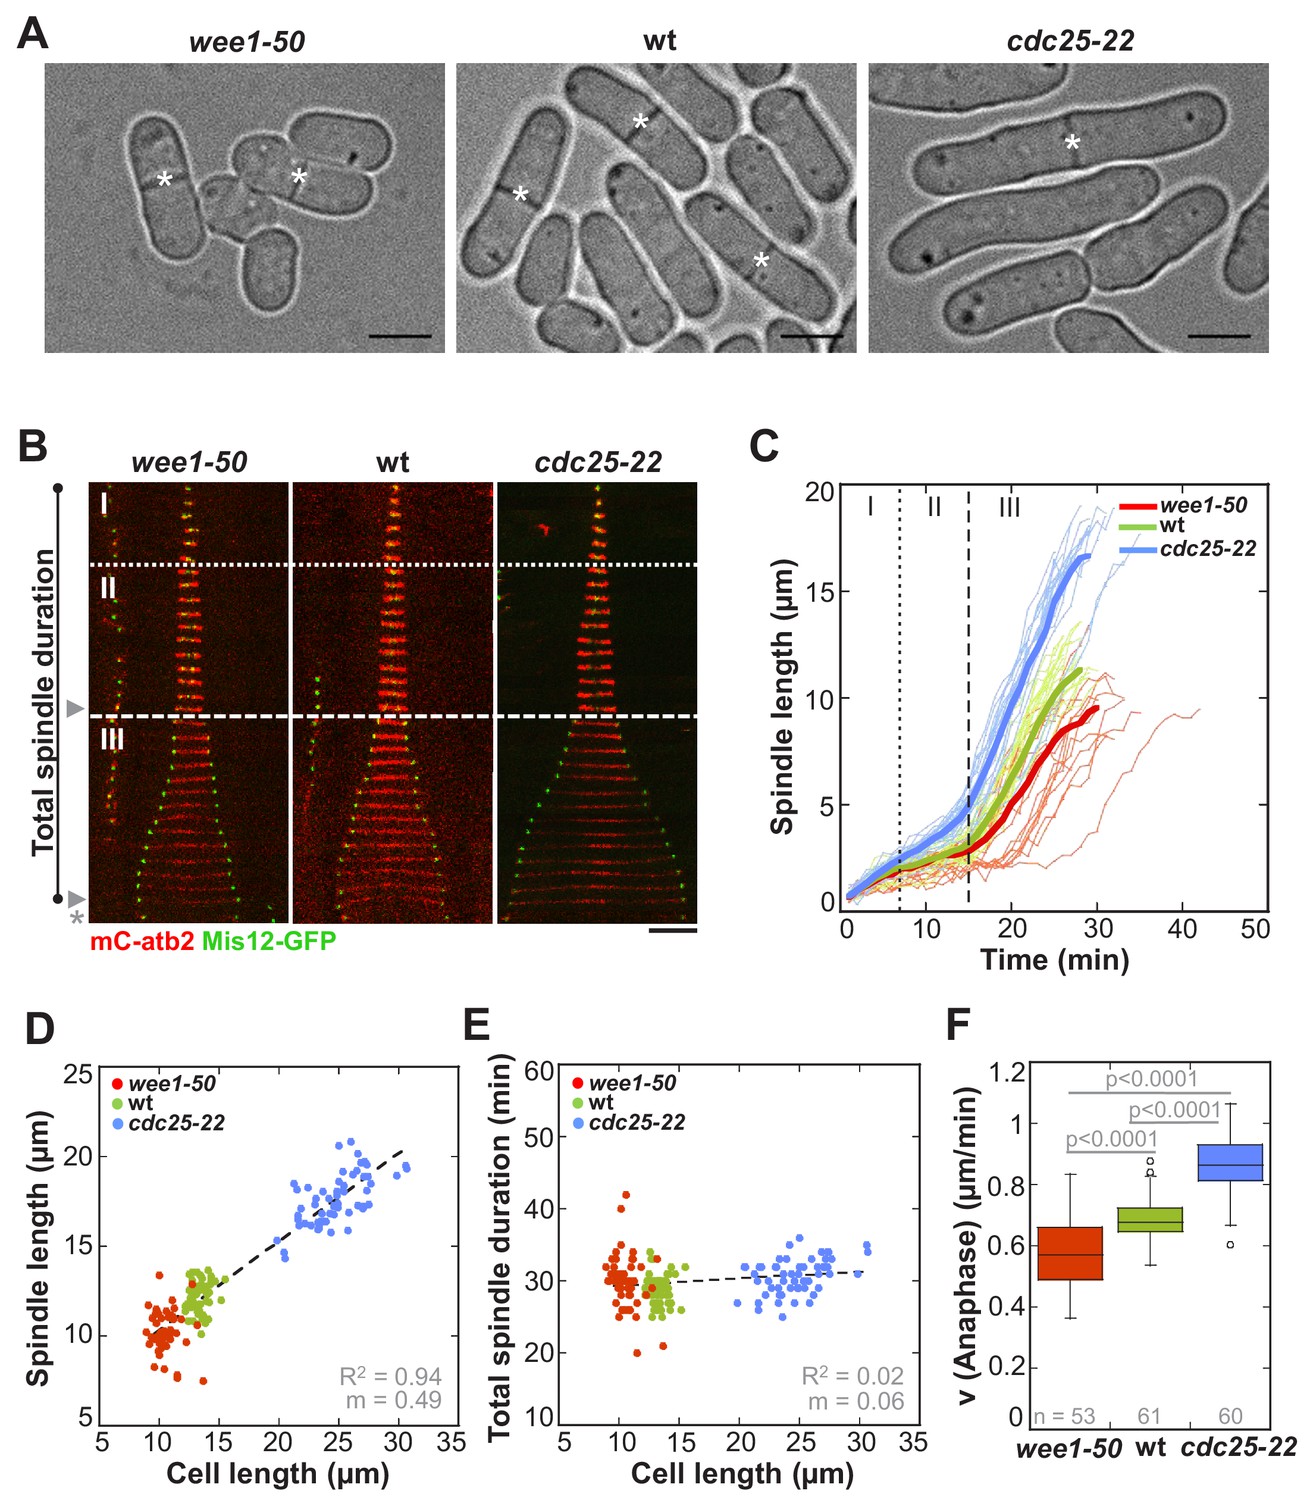
In S. pombe spindle length scales with cell size but total spindle duration is kept constant.
(A) Brightfield images of S. pombe wild-type cells (central panel) and cell cycle mutants wee1-50 (left panel) and cdc25-22 (right panel). Cells reach their maximum cell length at mitosis/cell division, represented by the septum (asterisk). Scale bar, 5 µm. (B) Time-lapse images of wee1-50, wild-type (wt) and cdc25-22 cells expressing mCherry-Atb2 (tubulin) and Mis12-GFP from spindle assembly to spindle breakdown (asterisk). Dotted line corresponds to transition from phase I to II (prophase to metaphase). Dashed line corresponds to transition from phase II to III (metaphase to anaphase). Arrowheads indicate the last time point of phase II or III, corresponding to spindle length plotted in (D) and Figure 1—figure supplement 1. Each frame corresponds to 1 min interval. Scale bar, 5 µm. (C) Comparative plot of spindle length dynamics of wee1-50 (red curves, n = 20), wild-type (green curves, n = 20) and cdc25-22 cells (blue curves, n = 20). Bold curves correspond to mean spindle dynamics. As in (B) dotted and dashed lines display phase transitions. (D) Final spindle length plotted against cell length (wee1-50: n = 53, wt: n = 61, cdc25-22: n = 60). (E) Total spindle duration plotted against cell length (wee1-50: n = 53, wt: n = 61, cdc25-22: n = 60). Data in (D–E) was fitted by linear regression (dashed lines), showing the regression coefficient R2 and the slope m. (F) Boxplot comparison of anaphase B spindle elongation velocities (v) in wee1-50, wild-type and cdc25-22 cells. Data from n cells was collected from three independent experiments. P values were calculated by Mann-Whitney U test.
-
Figure 1—source data 1
Mean values of spindle length and dynamics.
Mean values (bold) and corresponding standard deviations of cell length, total spindle duration and spindle length, duration and velocity for each mitotic phase: phase I (prophase), phase II (metaphase-anaphase A) and phase III (anaphase B) of wee1-50 (n = 53), wild-type (n = 61) and cdc25-22 cells (n = 60). Data obtained from n analyzed cells was collected from three independent experiments.
- https://doi.org/10.7554/eLife.42182.005
Figure 1—figure supplement 1
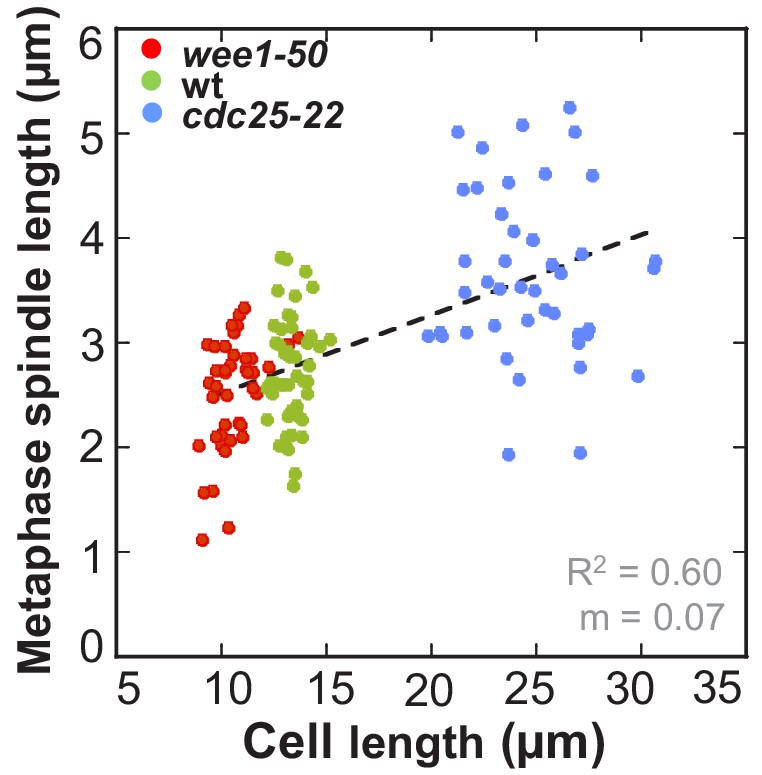
Metaphase spindle length plotted against maximum cell length.
Data was fitted by linear regression (dashed line), showing the regression coefficient R2 and the slope m. Data obtained from n analyzed cells (wee1-50: n = 53, wt: n = 61, cdc25-22: n = 60) was collected from three independent experiments.
Figure 1—figure supplement 2
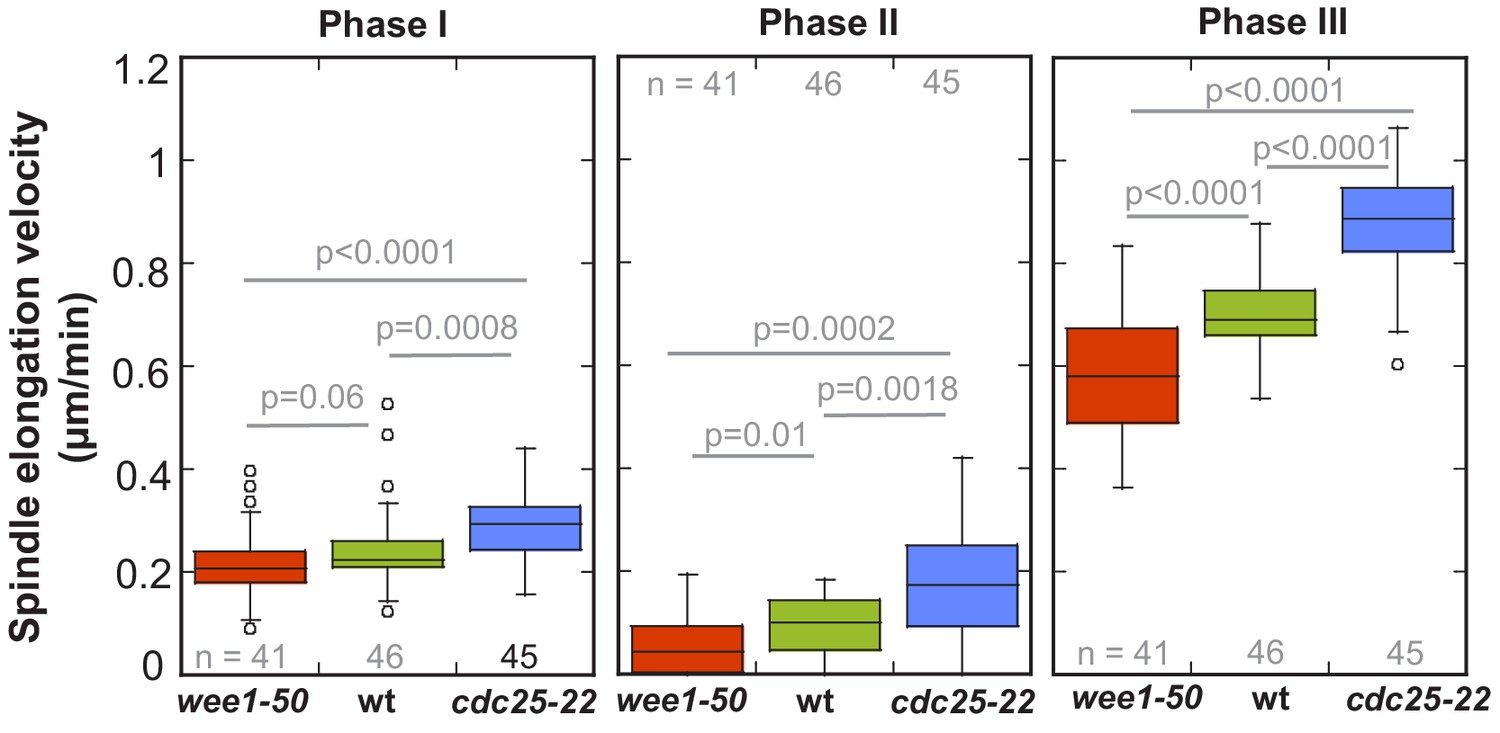
Boxplot comparison of spindle elongation velocity in prophase (I), metaphase (II) and anaphase B (III).
P values were calculated by Mann-Whitney U test. Data obtained from n analyzed cells was collected from three independent experiments.
Figure 2
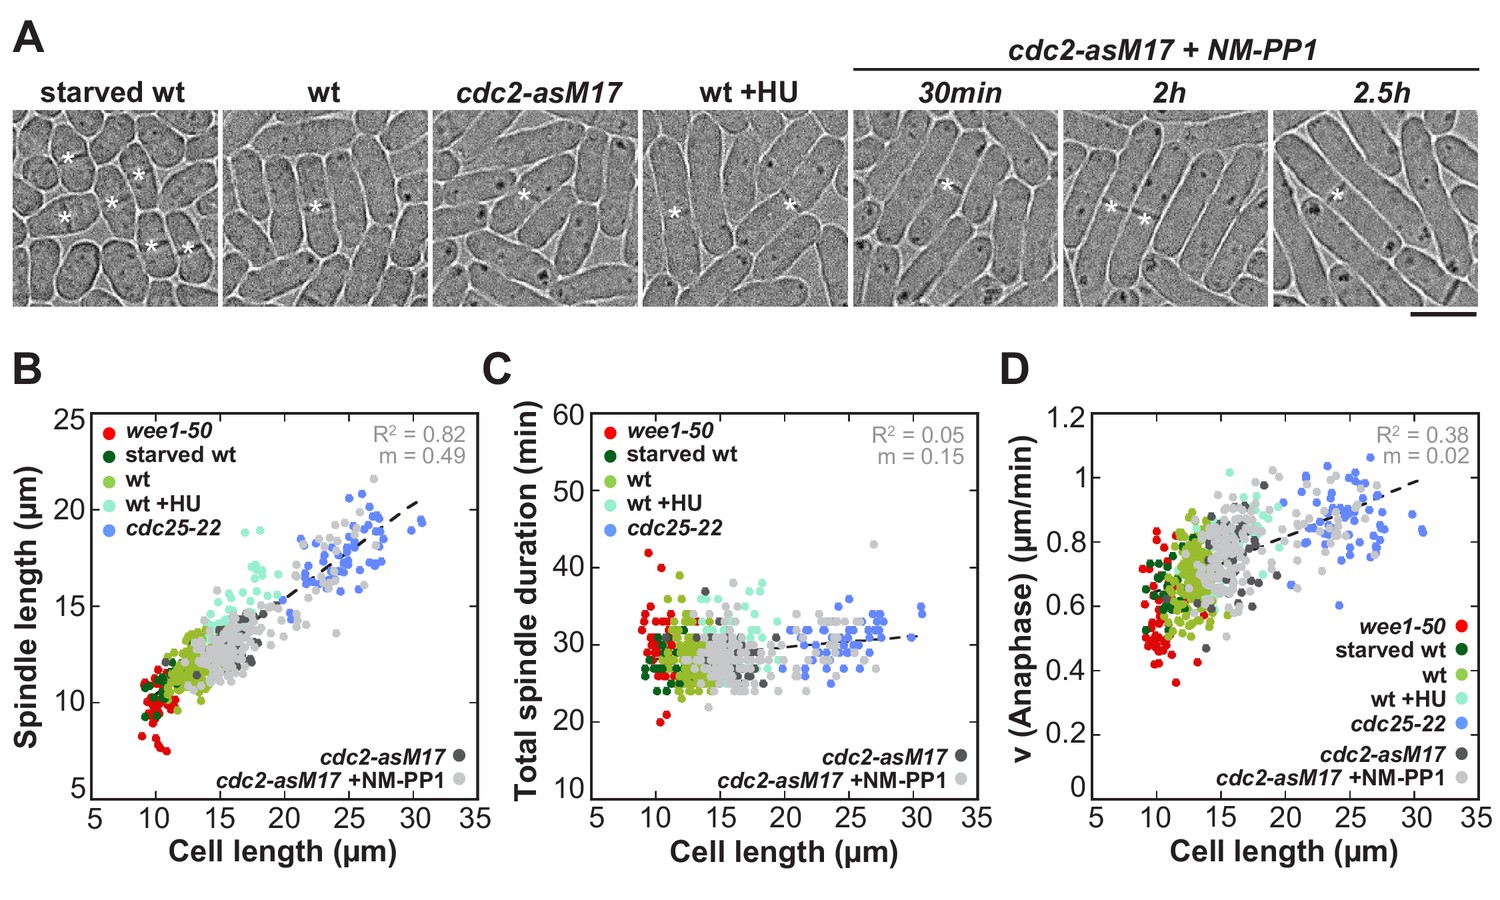
Spindle length and spindle elongation velocity scales with cell length in multiple conditions.
(A) Brightfield images of S. pombe wild-type cells in starvation (starved wt), wild-type cells in exponential growth phase (wt), cdc2-asM17 cells, wild-type cells treated with hydroxyurea (wt+HU), cdc2-asM17 cells treated with NM-PP1 for 30 min, 2 hr or 2.5 hr. Cells reach their maximum cell length at mitosis/cell division, represented by the septum (asterisk). Scale bar, 5 µm. (B) Final spindle length plotted against cell length. (C) Total spindle duration plotted against cell length. (D) Anaphase spindle elongation velocity plotted against cell length. Data in (B–D) was fitted by linear regression (dashed lines), showing the regression coefficient R2 and the slope m. Data was obtained from n cells (starved wt: n = 27, wt: n = 133, wt +HU: n = 52, cdc2-asM17: n = 49, cdc2-asM17 + NM-PP1: n = 163) was collected from three independent experiments.
Figure 3 with 3 supplements
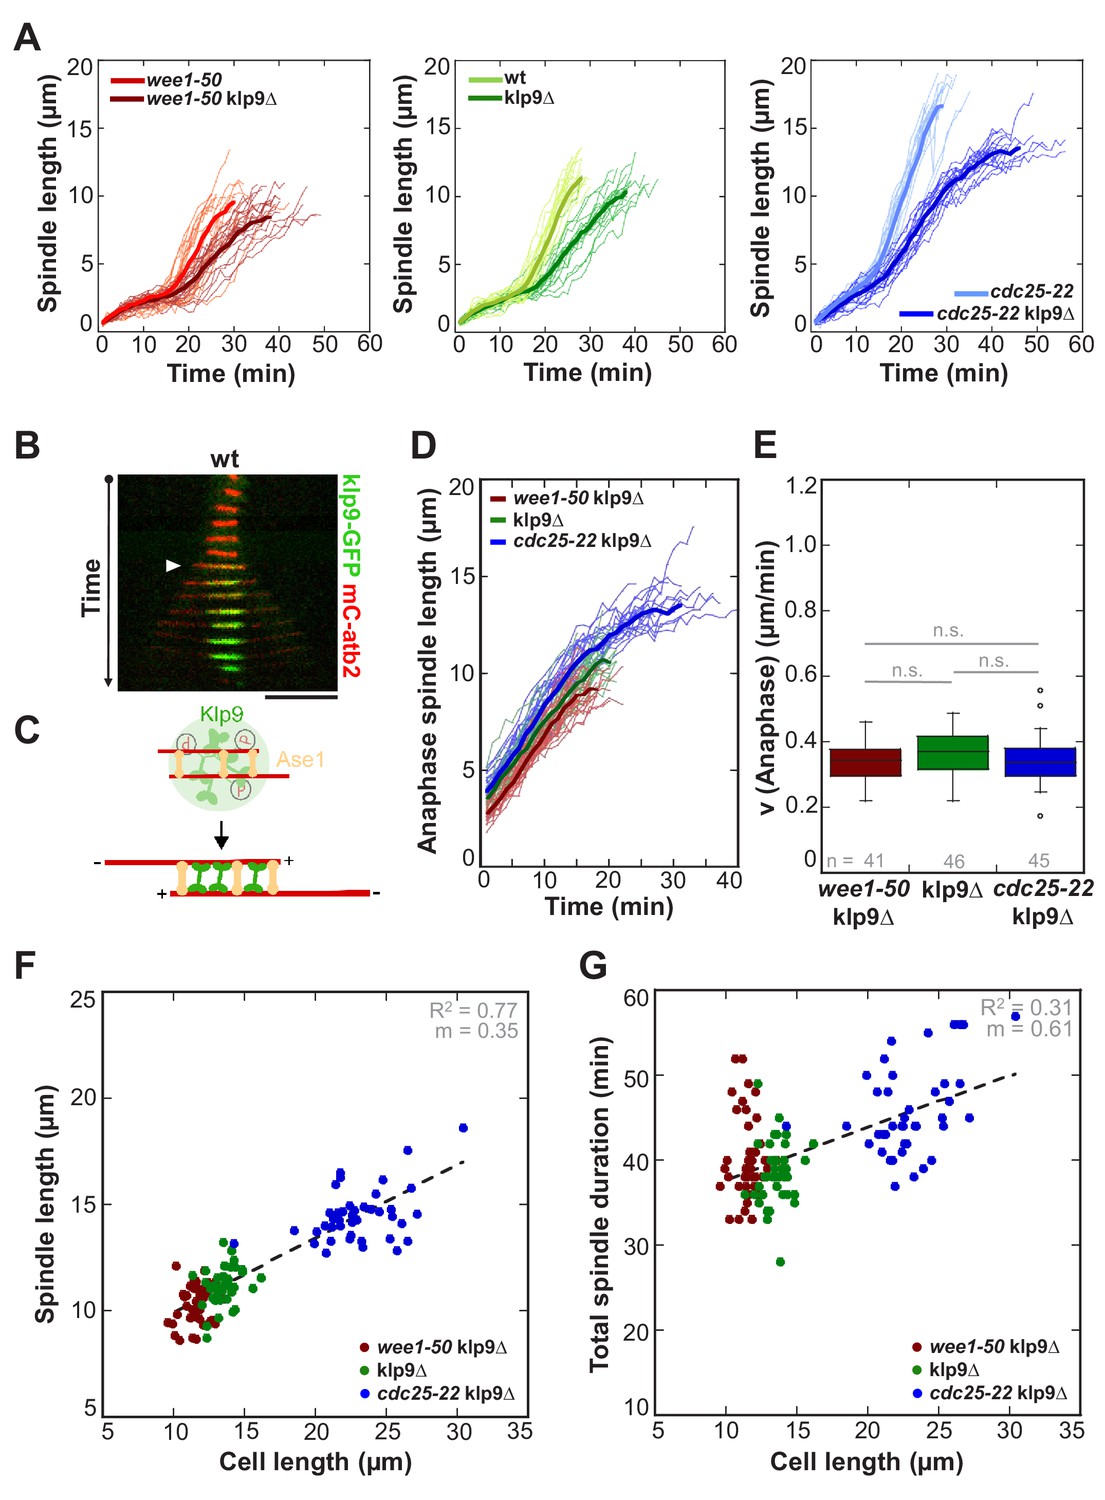
Kinesin-6 Klp9 deletion abolishes cell-size-dependent spindle elongation velocity and constant mitosis duration.
(A) Comparative plots of spindle length dynamics of wee1-50 (light-red, n = 20) and wee1-50klp9Δ (dark-red, n = 20) [left panel], wild-type (light-green, n = 20) and klp9Δ (dark-green, n = 20) [central panel], cdc25-22 (light-blue n = 20) and cdc25-22klp9Δ (dark-blue, n = 20) [right panel]. Bold curves correspond to mean spindle dynamics of each cell type. (B) Time-lapse image from mitosis onset until spindle breakdown of a wild-type (wt) cell expressing mCherry-Atb2 (tubulin) and Klp9-GFP. Each frame corresponds to 2 min interval. Arrowhead marks the start of anaphase B. Scale bar, 5 µm. (C) Model for anaphase spindle elongation by Klp9, based on Fu et al., 2009. Microtubules are shown in red, Klp9 in green and Ase1 in orange. (D) Comparative plot of anaphase spindle dynamics of wee1-50klp9Δ (dark-red, n = 20), klp9Δ (dark-green, n = 20) and cdc25-22klp9Δ (dark-blue, n = 20). Bold curves correspond to mean spindle dynamics. (E) Box plot comparison of anaphase B spindle elongation velocities (v) in wee1-50klp9Δ, klp9Δ and cdc25-22klp9Δ. P values were calculated by Mann-Whitney U test; data sets are defined as not significantly different (n.s.) if p>0.05. (F) Final spindle length in the klp9Δ background plotted against maximum cell length (wee1-50klp9Δ: n = 41, klp9Δ: n = 46, cdc25-22klp9Δ: n = 45). (G) Total spindle duration in the klp9Δ background plotted against cell length (wee1-50klp9Δ: n = 41, klp9Δ: n = 46, cdc25-22klp9Δ: n = 45). Data in (F–G) was fitted by linear regression (dashed lines), showing the regression coefficient R2 and the slope m. Data obtained from n cells was collected from three independent experiments.
Figure 3—figure supplement 1

Anaphase spindle elongation velocity plotted against cell length of cdc2-asM17klp9Δ and cdc2-asM17klp9Δ + NM-PP1.
Data was fitted by linear regression (dashed lines), showing the regression coefficient R2 and the slope m. Data obtained from n analyzed cells (cdc2-asM17klp9Δ: n = 42, cdc2-asM17klp9Δ + NM-PP1: n = 78) was collected from three independent experiments.
Figure 3—figure supplement 2
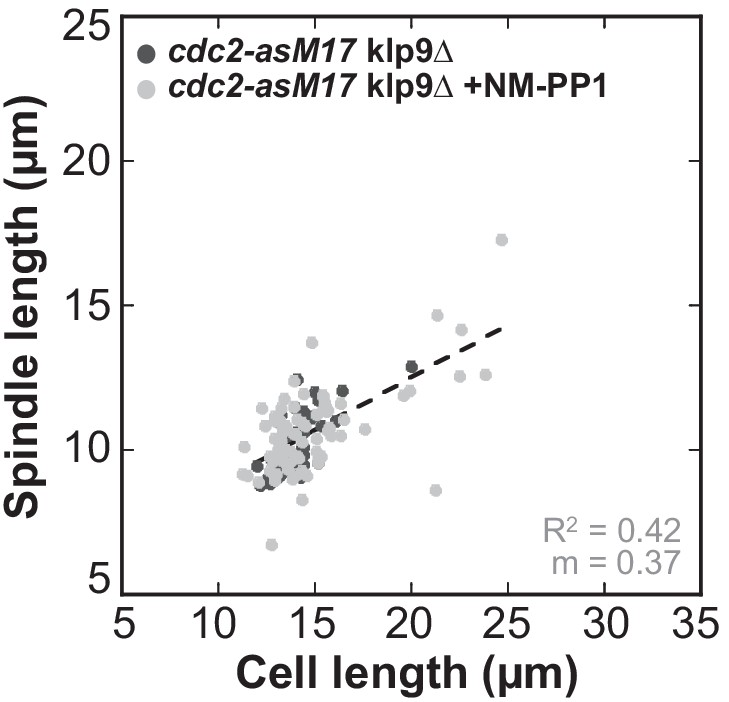
Final spindle length plotted against cell length of cdc2-asM17klp9Δ and cdc2-asM17klp9Δ + NM-PP1.
Data was fitted by linear regression (dashed lines), showing the regression coefficient R2 and the slope m. Data obtained from n analyzed cells (cdc2-asM17klp9Δ: n = 42, cdc2-asM17klp9Δ + NM-PP1: n = 78) was collected from three independent experiments.
Figure 3—figure supplement 3
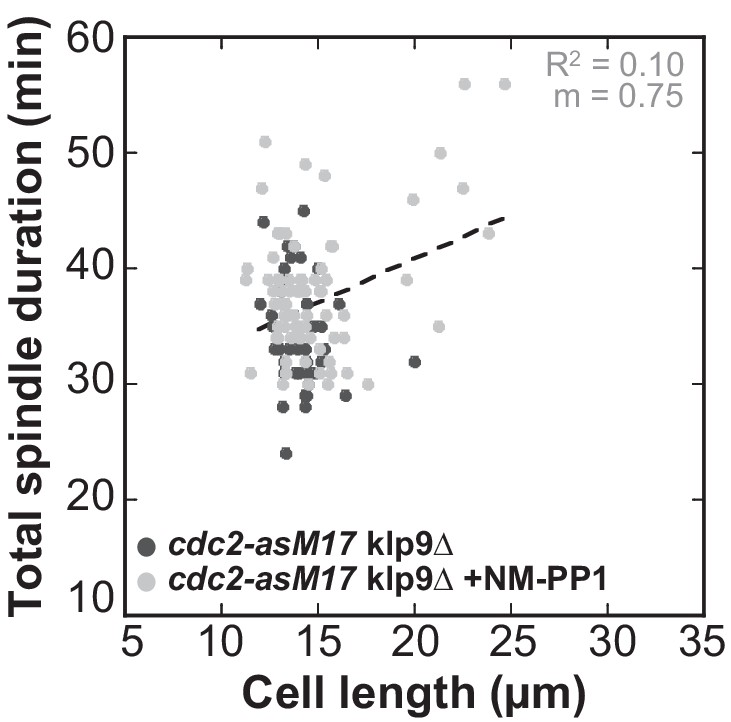
Total spindle duration plotted against cell length of cdc2-asM17klp9Δ and cdc2-asM17klp9Δ + NM-PP1.
Data was fitted by linear regression (dashed lines), showing the regression coefficient R2 and the slope m. Data obtained from n analyzed cells (cdc2-asM17klp9Δ: n = 42, cdc2-asM17klp9Δ + NM-PP1: n = 78) was collected from three independent experiment.
Figure 4 with 5 supplements

The total number of Klp9 molecules and the number of motors on anaphase spindles increase with cell size.
(A) Time-lapse images of wee1-50, wild-type (wt) and cdc25-22 cells expressing mCherry-Atb2 (tubulin) and Klp9-GFP from anaphase onset (arrowhead) to spindle breakdown (asterisk). Each frame corresponds to 1 min interval. Scale bar, 5 µm. (B) Comparative plot of Klp9-GFP intensity over spindle length. Each line corresponds to the Klp9-GFP intensity values of one cell throughout progressing spindle elongation in anaphase. Bold curves correspond to a representative cell of each cell type. (C) Total Klp9-GFP intensity (●, filled dots) and Klp9-GFP intensity at anaphase spindles (○, unfilled dots) plotted against cell length (wee1-50: n = 48, wt: n = 46, cdc25-22: n = 30). Shown values of Klp9-GFP intensity of anaphase spindles correspond to the mean intensity values of late anaphase. (D) Ratio between Klp9-GFP intensity at the anaphase spindle and the total Klp9-GFP intensity, referred to as Klp9 spindle fraction, plotted against cell length (wee1-50: n = 48, wt: n = 46, cdc25-22: n = 30). (E) Ratio of total Klp9-GFP intensity and cell volume plotted against cell length (wee1-50: n = 30, wt: n = 29, cdc25-22: n = 17). Data in (C–E) was fitted by linear regression (dashed lines), showing the regression coefficient R2 and the slope m. Data obtained from n cells was collected from three independent experiments.
-
Figure 4—source data 1
Mean values of Klp9-GFP intensity and concentration.
Mean values and corresponding standard deviations of total Klp9-GFP intensity, Klp9-GFP intensity in anaphase spindles and the ratio of total intensity and nuclear volume, referred to as Klp9 concentration. Data obtained from n analyzed cells (wee1-50: n = 48, wt: n = 46, cdc25-22: n = 30) was collected from three independent experiments.
- https://doi.org/10.7554/eLife.42182.017
Figure 4—figure supplement 1
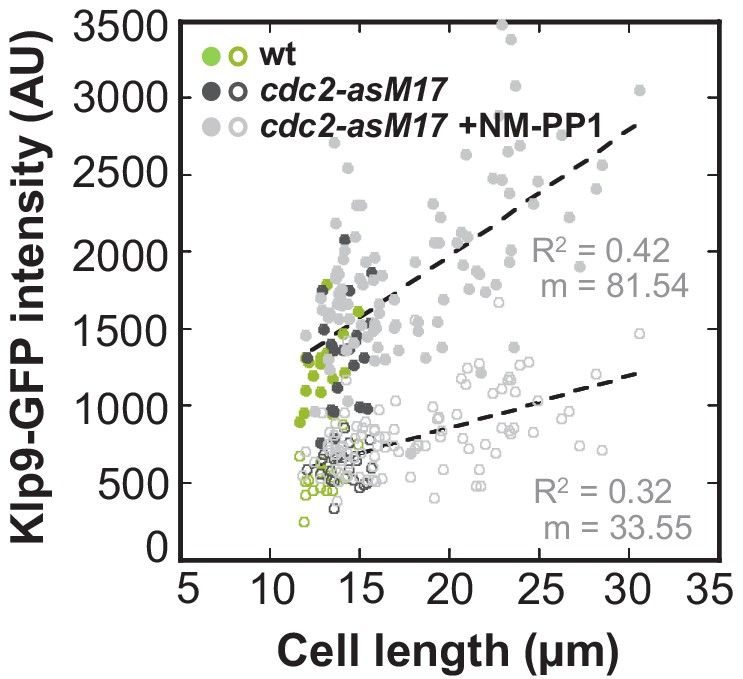
Total Klp9-GFP intensity and Klp9-GFP intensity at anaphase spindles plotted against cell length of cdc2-asM17 and cdc2-asM17 + NM-PP1.
Data was fitted by linear regression (dashed lines), showing the regression coefficient R2 and the slope m. Data obtained from n analyzed cells (wt: n = 17, cdc2-asM17Klp9-GFP: n = 22, cdc2-asM17Klp9-GFP + NM-PP1: n = 101) was collected from three independent experiments.
Figure 4—figure supplement 2
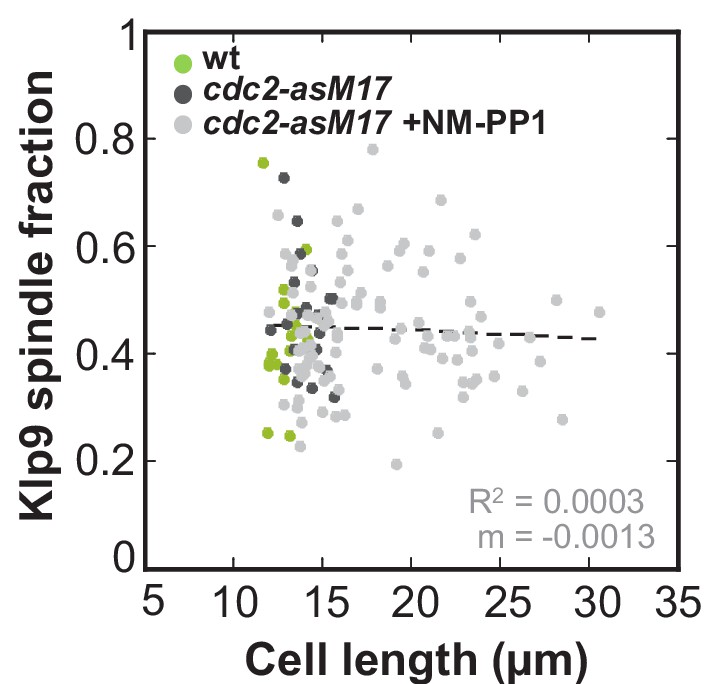
Ratio between Klp9-GFP intensity at anaphase spindles and in the nucleus plotted against cell length of cdc2-asM17 and cdc2-asM17 + NM-PP1.
Data was fitted by linear regression (dashed lines), showing the regression coefficient R2 and the slope m. Data obtained from n analyzed cells (wt: n = 17, cdc2-asM17Klp9-GFP: n = 22, cdc2-asM17Klp9-GFP + NM-PP1: n = 95) was collected from three independent experiments.
Figure 4—figure supplement 3
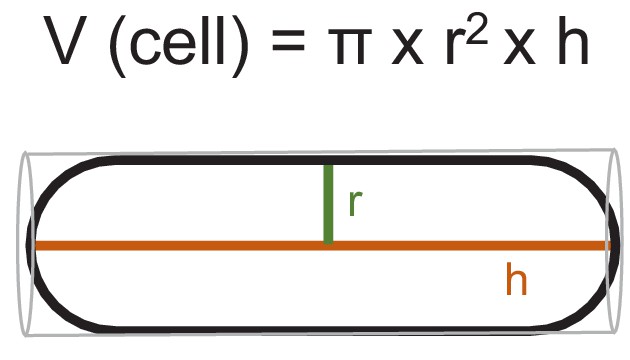
Estimation of cell volume of S. pombe cells.
Scheme, illustrating the calculation of cell volume by treating the fission yeast cell as a cylinder: cell length corresponds to hight (h) and half of the cell diameter to the radius (r).
Figure 4—figure supplement 4
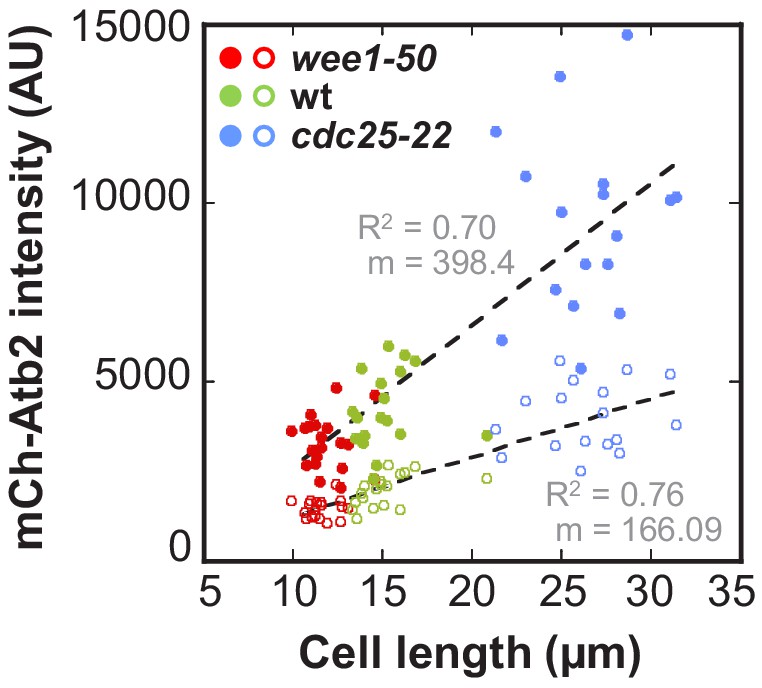
Total mCherry-Atb2 intensity and mCherry-Atb2 intensity of anaphase spindles in wee1-50, wild-type and cdc25-22 cells.
Total mCherry-Atb2 intensity (●, filled dots) or mCherry-Atb2 intensity of anaphase spindles (○, unfilled dots) plotted against cell length. Total mCherry-Atb2 intensity was measured shortly before mitosis onset, by measuring the intensity of the whole cell. Intensity of anaphase spindles corresponds to the mCherry-Atb2 intensity of the anaphase spindle just before spindle disassembly. Data was fitted by linear regression (dashed lines), showing the regression coefficient R2 and the slope m. Data obtained from n analyzed cells (wee1-50: n = 20, wt: n = 18, cdc25-22: n = 17) was collected from three independent experiments.
Figure 4—figure supplement 5
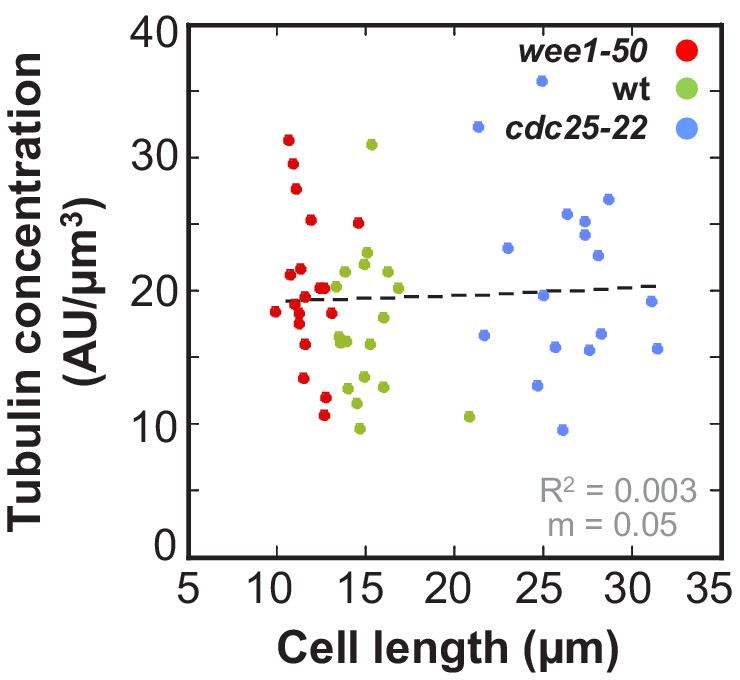
Ratio of total mCherry-Atb2 intensity and cell volume plotted against cell length.
Data was fitted by linear regression (dashed lines), showing the regression coefficient R2 and the slope m. Data obtained from n analyzed cells (wee1-50: n = 20, wt: n = 18, cdc25-22: n = 17) was collected from three independent experiments.
Figure 5 with 1 supplement
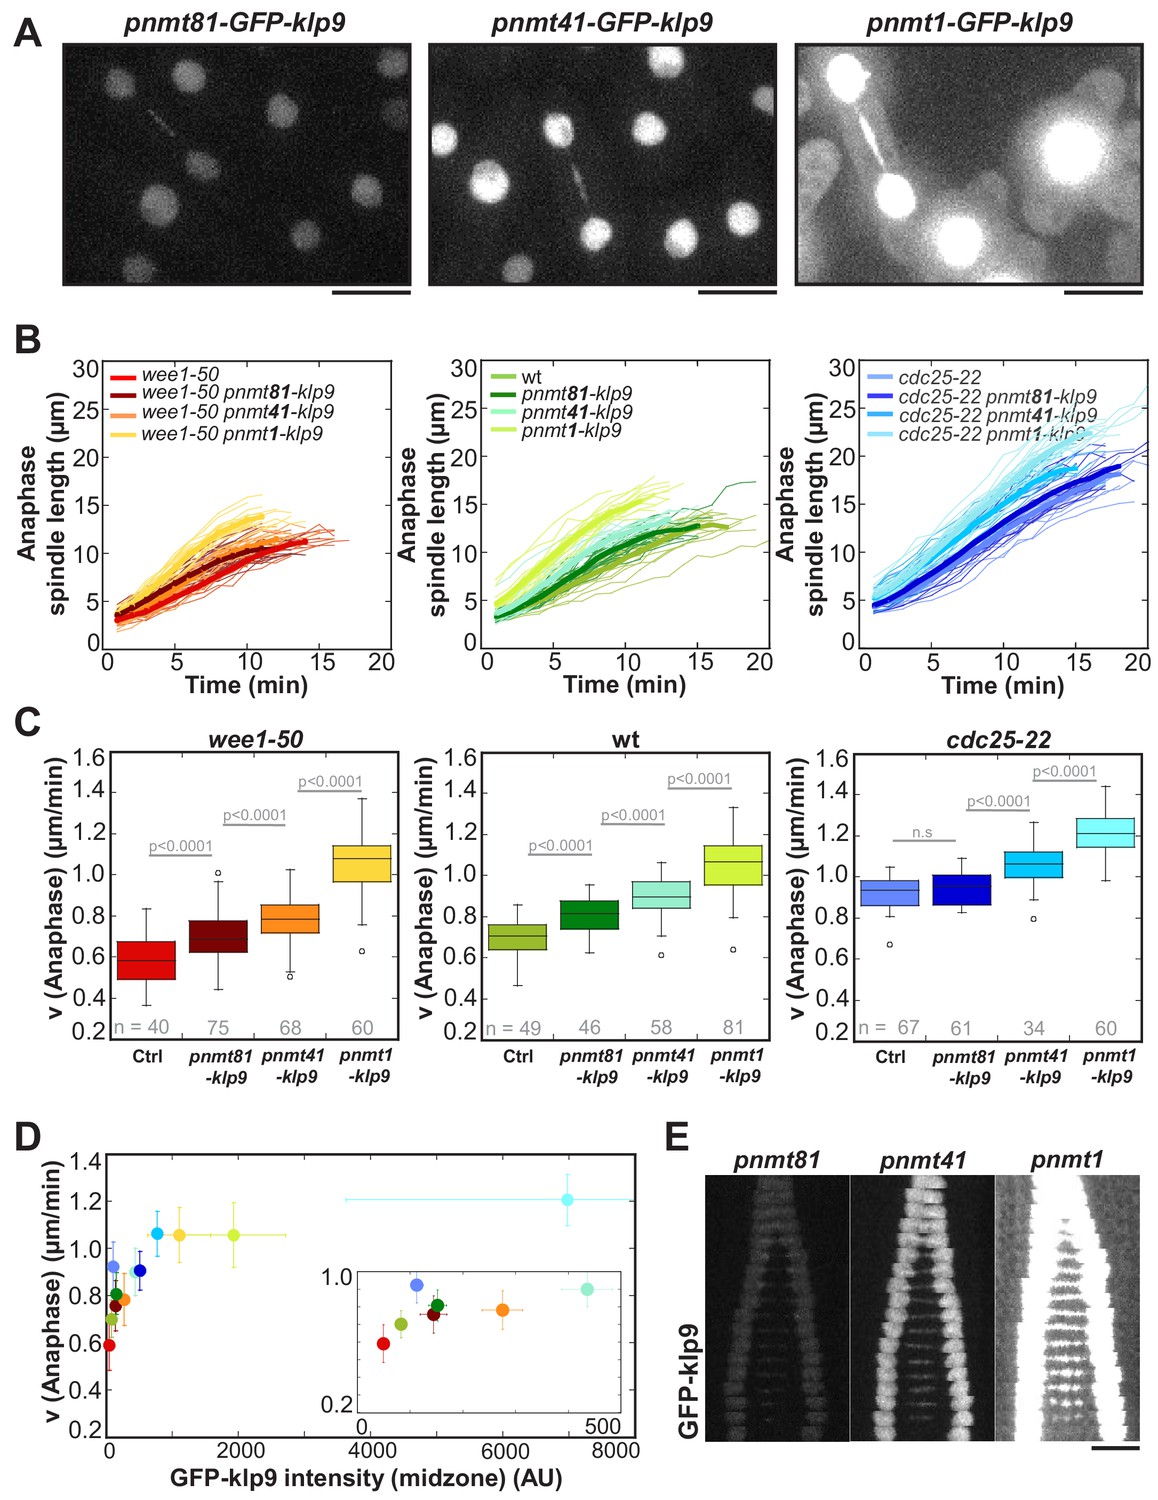
Overexpression of Klp9 accelerates anaphase B spindle elongation in a dose-dependent manner.
(A) Images of cells expressing GFP-klp9 under the control of thiamine repressible nmt promoters. Scale bar, 5 µm. (B) Comparative plot of spindle length dynamics of wee1-50 (left panel), wild-type (middle panel) and cdc25-22 cells (right panel) with endogenous klp9 expression, pnmt81-klp9, pnmt41-klp9 and pnmt1-klp9 (each strain: n = 20). (C) Box plot comparison of anaphase B spindle elongation velocities (v) in cells with endogenous klp9 expression (Ctrl), pnmt81-klp9, pnmt41-klp9 and pnmt1-klp9. P values were calculated by Mann-Whitney U test. (D) Mean values and corresponding standard deviations of anaphase B velocity plotted against mean values of GFP-klp9 intensity at anaphase spindles. The inset shows the same data on a 0 to 500 AU x-axis and a 0.2 to 1.0 µm/min y-axis. The color code is equal to the one used in (B) and (C). (E) Time-lapse images from metaphase to spindle breakdown in cells expressing GFP-klp9 under the control of nmt promoters. Each frame corresponds to 1 min interval. Scale bar, 5 µm. Data obtained from n cells was collected from three independent experiments.
-
Figure 5—source data 1
Mean values of spindle elongation velocity and the Klp9-GFP intensity at anaphase spindles in pnmt-klp9 strains.
Mean values and corresponding standard deviations of anaphase B spindle elongation velocity and GFP-klp9 intensity at the midzone of anaphase spindles in wee1-50, wild-type and cdc25-22 cells expressing klp9 under the control of nmt promoters with different strength. Data was collected from three independent experiments.
- https://doi.org/10.7554/eLife.42182.020
Figure 5—figure supplement 1
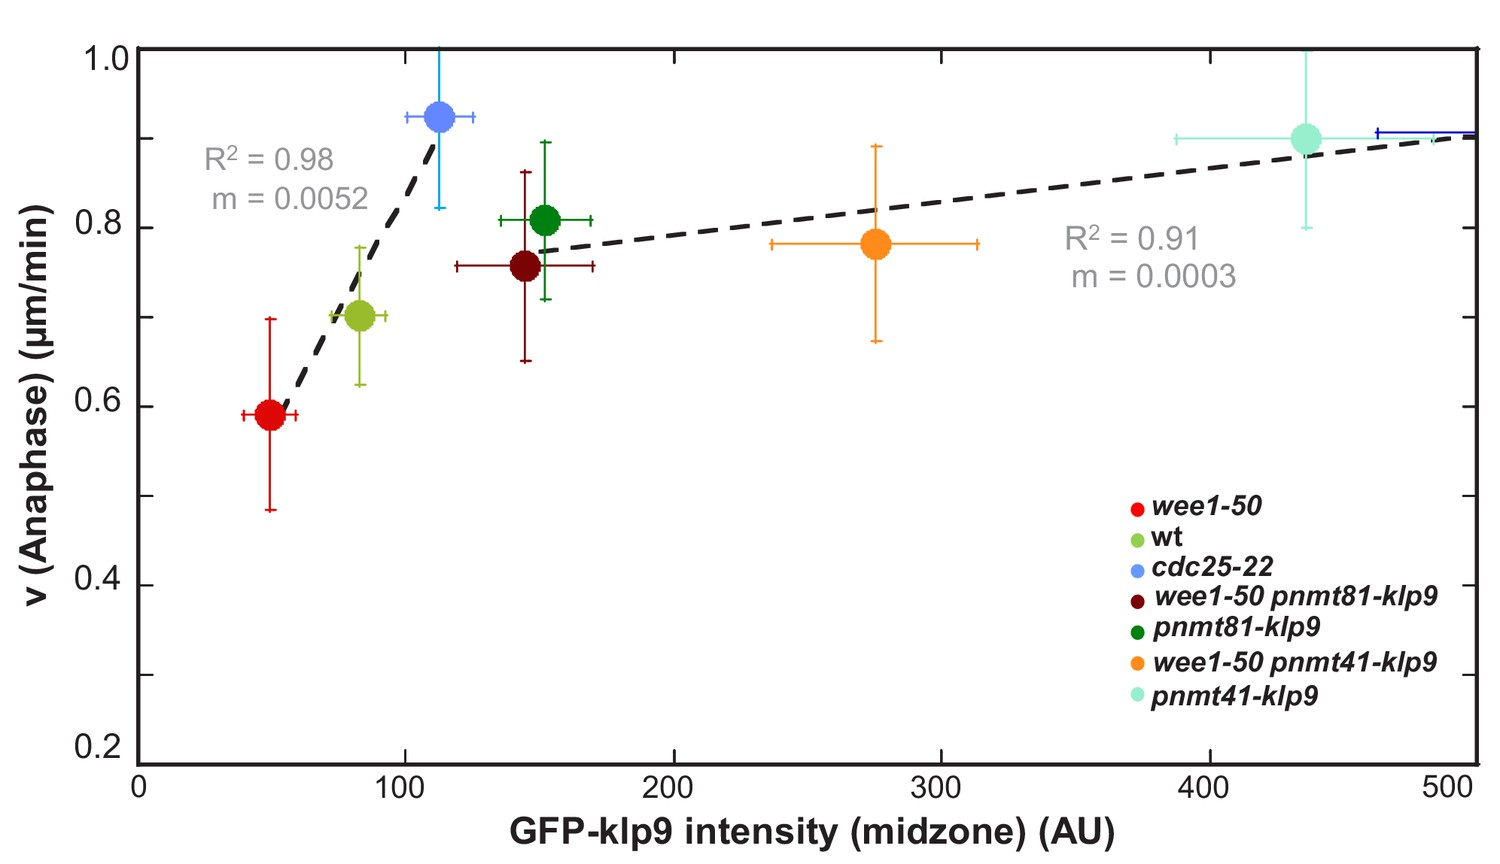
Linear regression of the function of spindle elongation velocity and Klp9-GFP intensity.
Mean values of anaphase spindle elongation velocity plotted against mean values of GFP-klp9 intensity below intensity values of 500 AU. Data of either control cells (wee1-50, wild-type and cdc25-22) or cells in which klp9 was overexpressed (pnmt-klp9) was plotted by linear regression (dashed lines), showing the regression coefficient R2 and the slope m. Data was collected from three independent experiments.
Figure 6 with 4 supplements
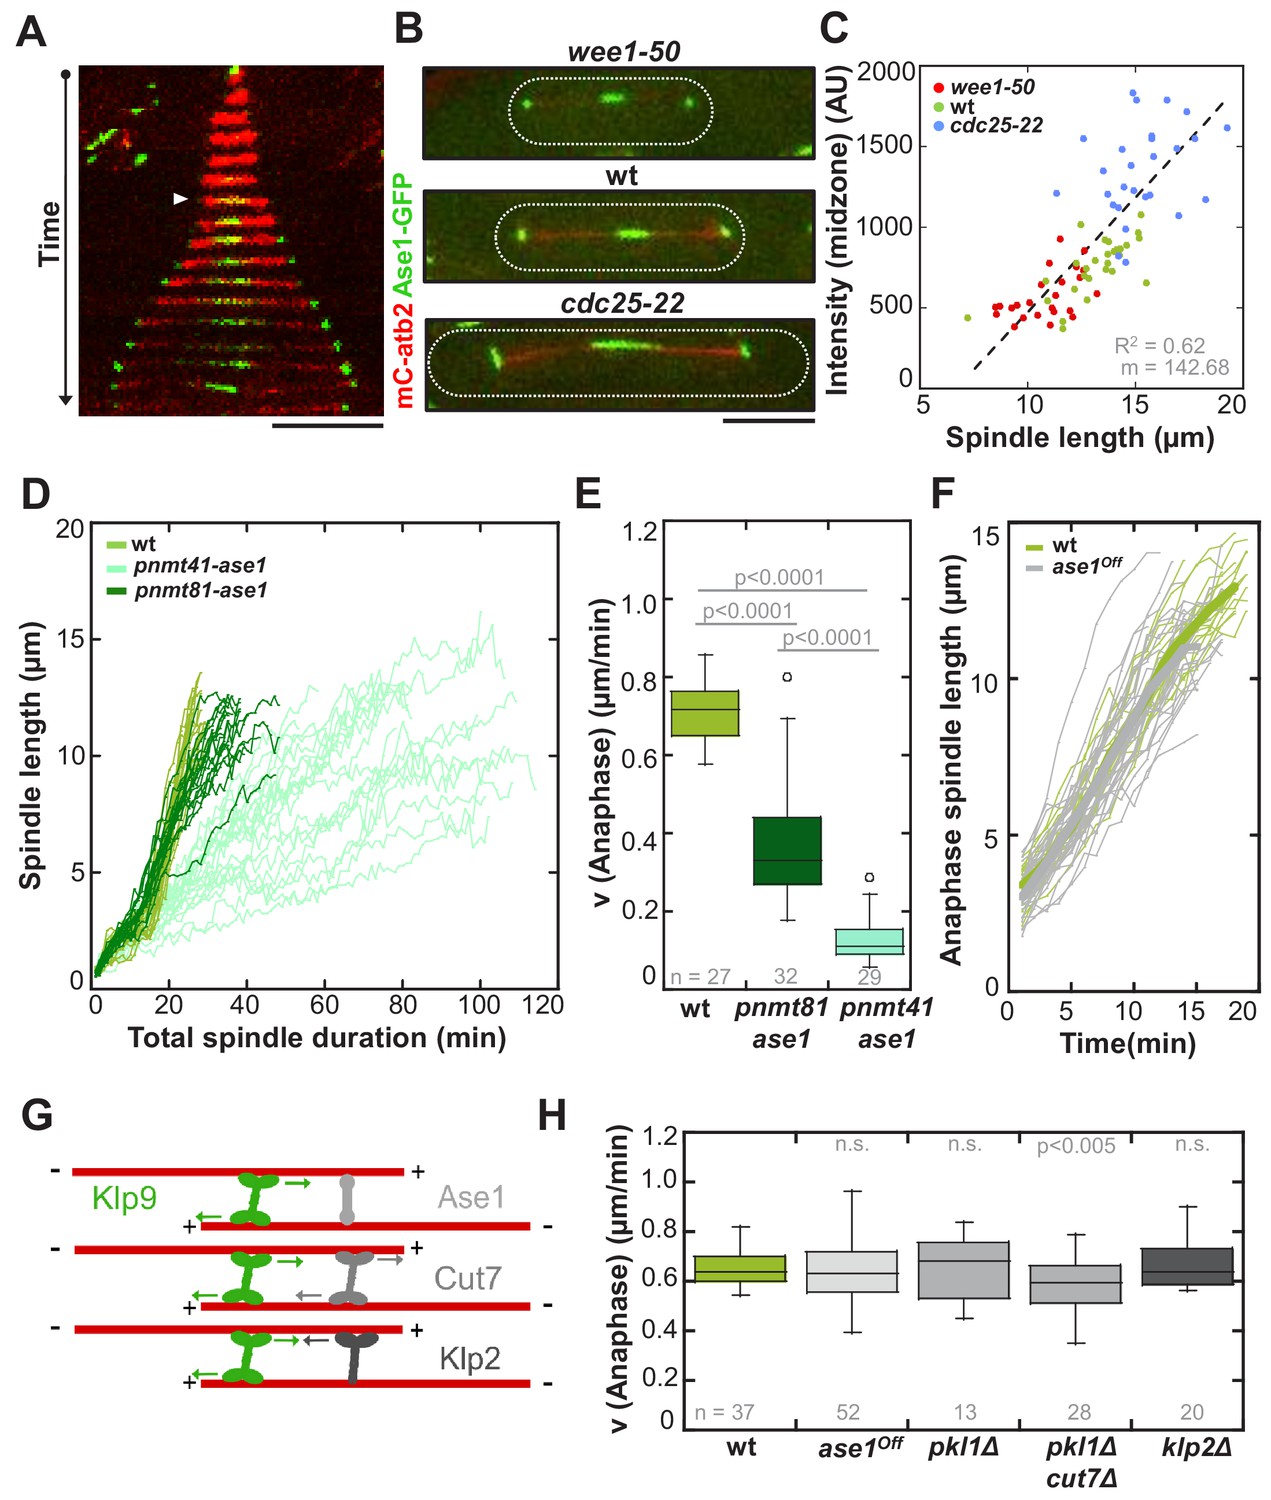
Ase1, Cut7 and Klp2 do not contribute to the regulation of cell-size-dependent spindle elongation velocity.
(A) Time-lapse image from mitosis onset until spindle breakdown of a wild-type cell expressing mCherry-Atb2 (tubulin) and Ase1-GFP. Arrowhead corresponds to anaphase B onset. Each frame corresponds to 2 min interval. (B) Images of wee1-50, wild-type (wt) and cdc25-22 cells expressing mCherry-Atb2 (tubulin) and Ase1-GFP in late anaphase. Scale bar, 5 µm. (C) Ase1-GFP intensity at anaphase spindles plotted against final spindle length (wee1-50: n = 24, wt: n = 28, cdc25-22: n = 30). Data was fitted by linear regression (dashed lines), showing the regression coefficient R2 and the slope m. (D) Comparative plot of spindle length dynamics of wild-type (n = 27) cells, pnmt81-ase1 (n = 32) and pnmt41-ase1 (n = 29). (E) Box plot comparison of anaphase B spindle elongation velocities (v) in wild-type, pnmt81-ase1 and pnmt41-ase1 cells. (F) Comparative plot of anaphase spindle dynamics of wild-type (n = 28) and ase1Off cells (n = 52). Bold curves correspond to mean spindle dynamics. (G) Model of the role of tested midzone components. (H) Box plot comparison of anaphase B spindle elongation velocities (v) in wild-type cells, ase1-Shut-Off (ase1Off), pkl1Δ, the double-deletion pkl1Δcut7Δ and klp2Δ cells. P values were calculated by Mann-Whitney U test; data sets are defined as not significantly different (n.s.) if p>0.05. Data obtained from n cells was collected from three independent experiments.
-
Figure 6—source data 1
Mean values of Ase1-GFP intensity and signal length.
Mean values and corresponding standard deviations of Ase1-GFP intensity and Ase1-GFP signal length in wee1-50, wild-type and cdc25-22 cells. Data obtained from n analyzed cells (wee1-50: n = 24, wt: n = 28, cdc25-22: n = 30) was collected from three independent experiments.
- https://doi.org/10.7554/eLife.42182.026
Figure 6—figure supplement 1

Upon reduction of the Ase1 level spindles remain stable until late anaphase.
Time-lapse images of cells, in which ase1 was deleted (ase1Δ) or ase1 expression reduced (ase1Off) expressing mCherry-Atb2 (tubulin) and Mis12-GFP from the onset of anaphase until spindles broke or disassembled. Each frame corresponds to 2 min interval. Scale bars, 5 µm.
Figure 6—figure supplement 2
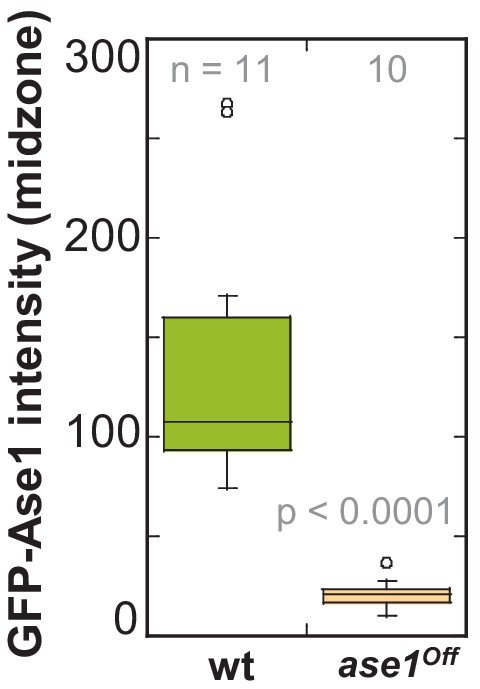
GFP-Ase1 intensity at anapahse spindles in ase1Off and wild-type cells.
Boxplot comparison of GFP-Ase1 intensity in wild-type and Ase1 Shut-Off cells. P values were calculated by Mann-Whitney U test. Data obtained from n analyzed cells was collected from one experiment.
Figure 6—figure supplement 3
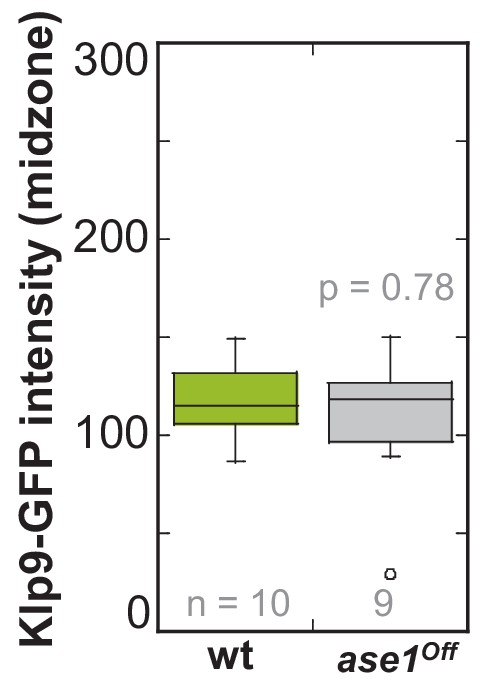
Klp9-GFP intensity at anaphase spindles in ase1Off and wild-type cells.
Boxplot comparison of Klp9-GFP intensity in wild-type and Ase1 Shut-Off cells. P values were calculated by Mann-Whitney U test. Data sets are defined as not significantly different (n.s.) if p>0.5. Data obtained from n analyzed cells was collected from one experiment.
Figure 6—figure supplement 4
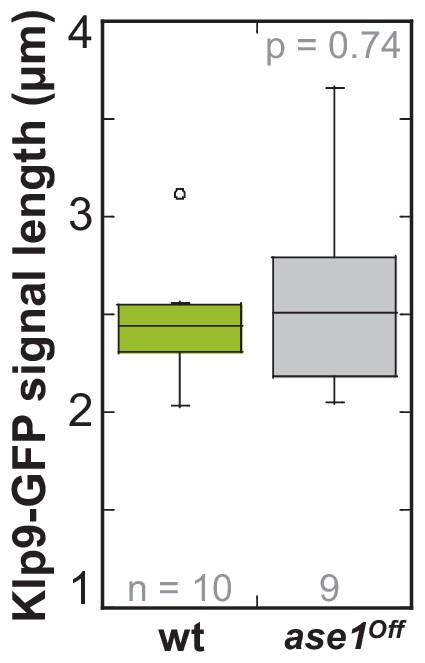
Klp9-GFP signal length at anaphase spindles in ase1Off and wild-type cells.
Boxplot comparison of Klp9-GFP signal length in wild-type and Ase1 Shut-Off cells. P values were calculated by Mann-Whitney U test. Data sets are defined as not significantly different (n.s.) if p>0.5. Data obtained from n analyzed cells was collected from one experiment.
Figure 7 with 4 supplements
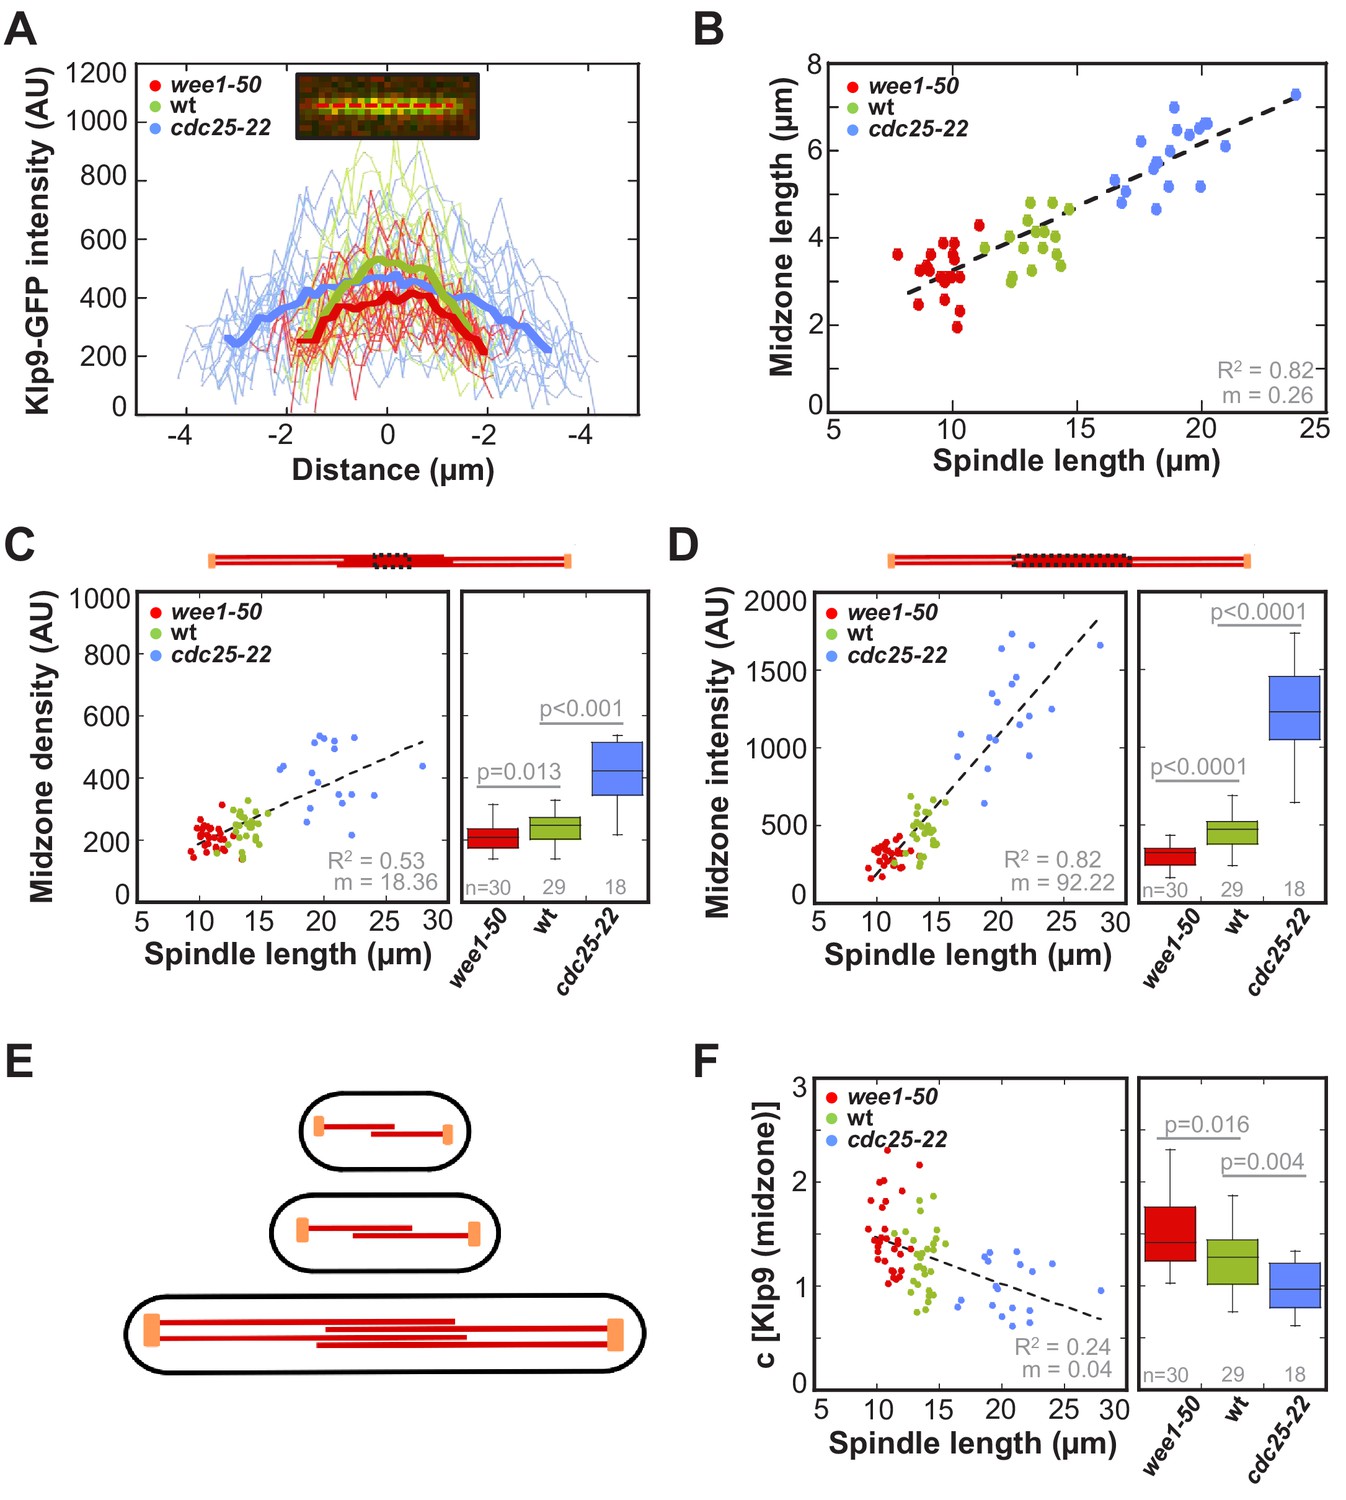
Longer spindles provide overproportionally more binding sites for Klp9.
(A) Intensities obtained by line scan analysis of Klp9-GFP signals at anaphase spindles of wee1-50 (n = 20), wild-type (n = 20) and cdc25-22 (n = 20) cells. A line was placed over the whole length of the Klp9-GFP signal (red dashed line, inset) and the resulting intensity spectrum is shown. Bold curves correspond to the mean intensity distribution for each cell type. (B) Mean midzone length plotted against spindle length (wee1-50: n = 19, wt: n = 16, cdc25-22: n = 19). (C) mCherry-Atb2 density of the midzone, measured as illustrated by the dashed box within the scheme illustrating the mitotic spindle, plotted against final spindle length (left panel) and box plot comparison of the mCherry-Atb2 density of the midzone (right panel). (D) Total mCherry-Atb2 intensity of the midzone, measured as illustrated by the dashed box within the scheme illustrating the mitotic spindle, plotted against final spindle length (left panel) and box plot comparison of the total mCherry-Atb2 intensity of the midzone (right panel). (E) Model for mitotic spindle structure in fission yeast cells of different sizes. MTs are shown in red and spindle poles in orange. (F) Effective concentration of Klp9 at the midzone plotted against spindle length (left panel) and box plot comparison of the effective concentration of Klp9 at the midzone (right panel). Data in (B–D) and (F) was fitted by linear regression (dashed lines), showing the regression coefficient R2 and the slope m. P values were calculated by Mann-Whitney U test. Data obtained from n analyzed cells was collected from three independent experiments.
Figure 7—figure supplement 1

Measurement of midzone length.
Kymograph of a wild-type cell expressing mCherry-Atb2 from early metaphase to the end of anaphase B. Orange lines mark the region of high mCherry-intensity used to measure the length of the region of antiparallel overlapping microtubules. Midzone length was calculated by the average of signal lengths measured throughout anaphase spindle elongation.
Figure 7—figure supplement 2
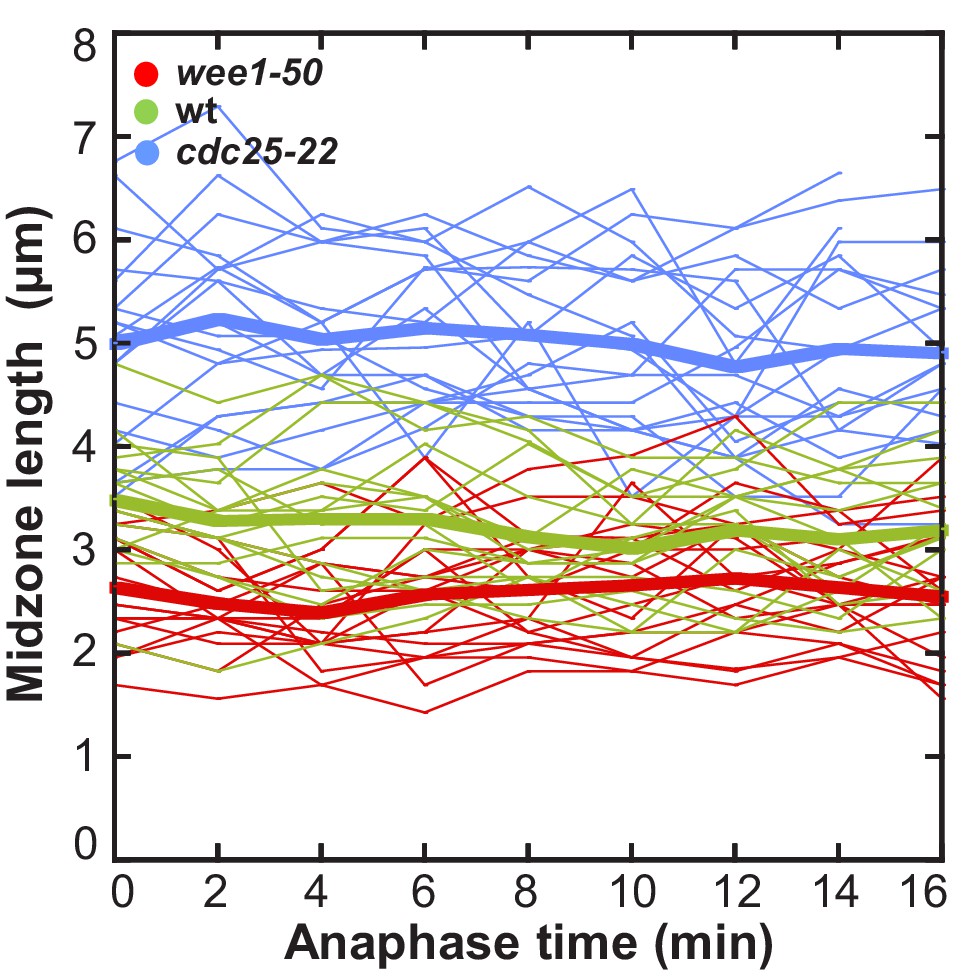
Midzone length throughout progressing spindle elongation in anaphase plotted against time.
Length of the region of high mCherry-Atb2 intensity, corresponding to midzone length, over time in anaphase B (wee1-50: n = 19, wt: n = 16, cdc25-22: n = 19). Bold curves correspond to mean midzone length over time. Data obtained from n analyzed cells was collected from one independent experiments.
Figure 7—figure supplement 3
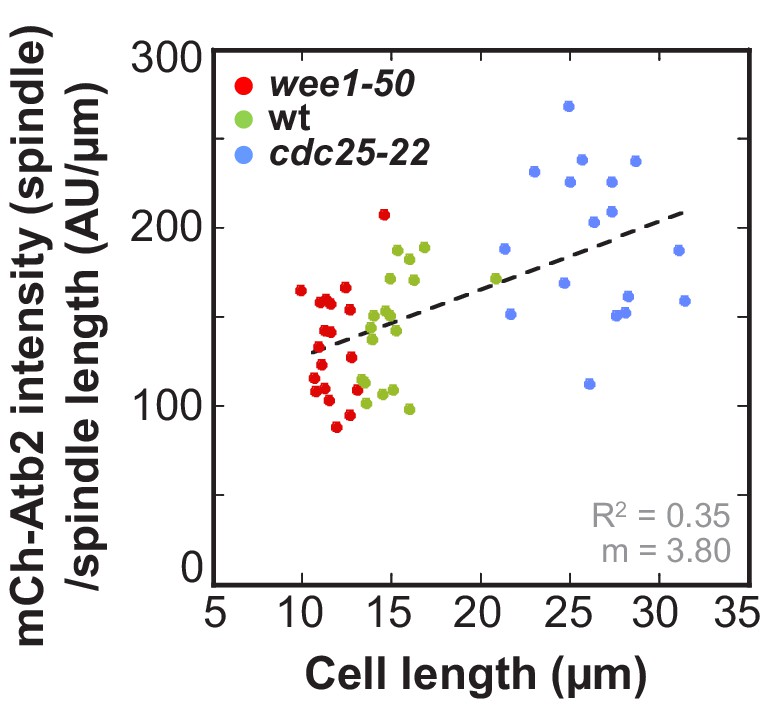
Ratio of mCherry-Atb2 intensity of the anaphase spindle and spindle length plotted against cell length.
Data was fitted by linear regression (dashed lines), showing the regression coefficient R2 and the slope m. Data obtained from n analyzed cells (wee1-50: n = 20, wt: n = 18, cdc25-22: n = 17) was collected from three independent experiments.
Figure 7—figure supplement 4
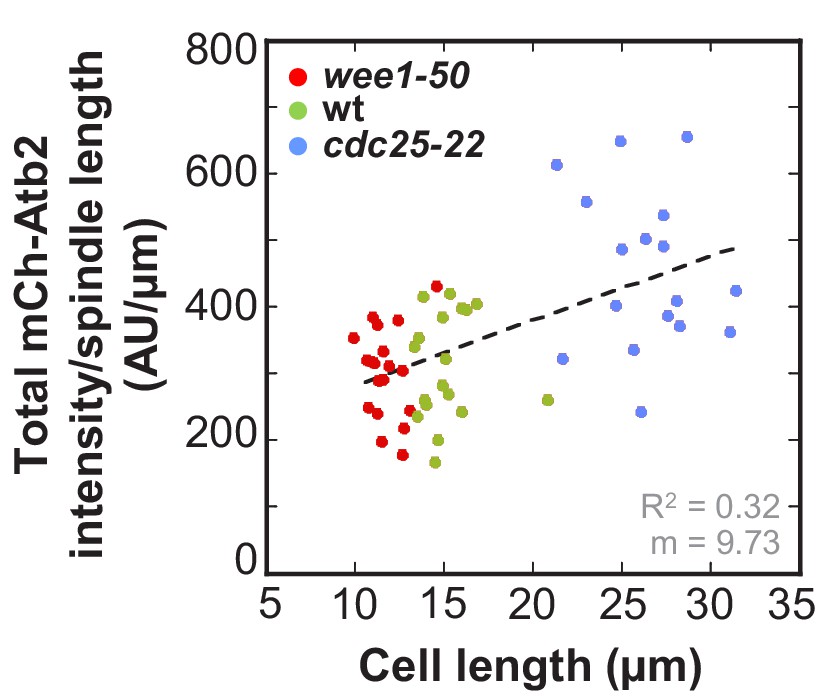
Ratio of total mCherry-Atb2 intensity and spindle length plotted against cell length.
Data was fitted by linear regression (dashed lines), showing the regression coefficient R2 and the slope m. Data obtained from n analyzed cells (wee1-50: n = 20, wt: n = 18, cdc25-22: n = 17) was collected from three independent experiments.
Figure 8
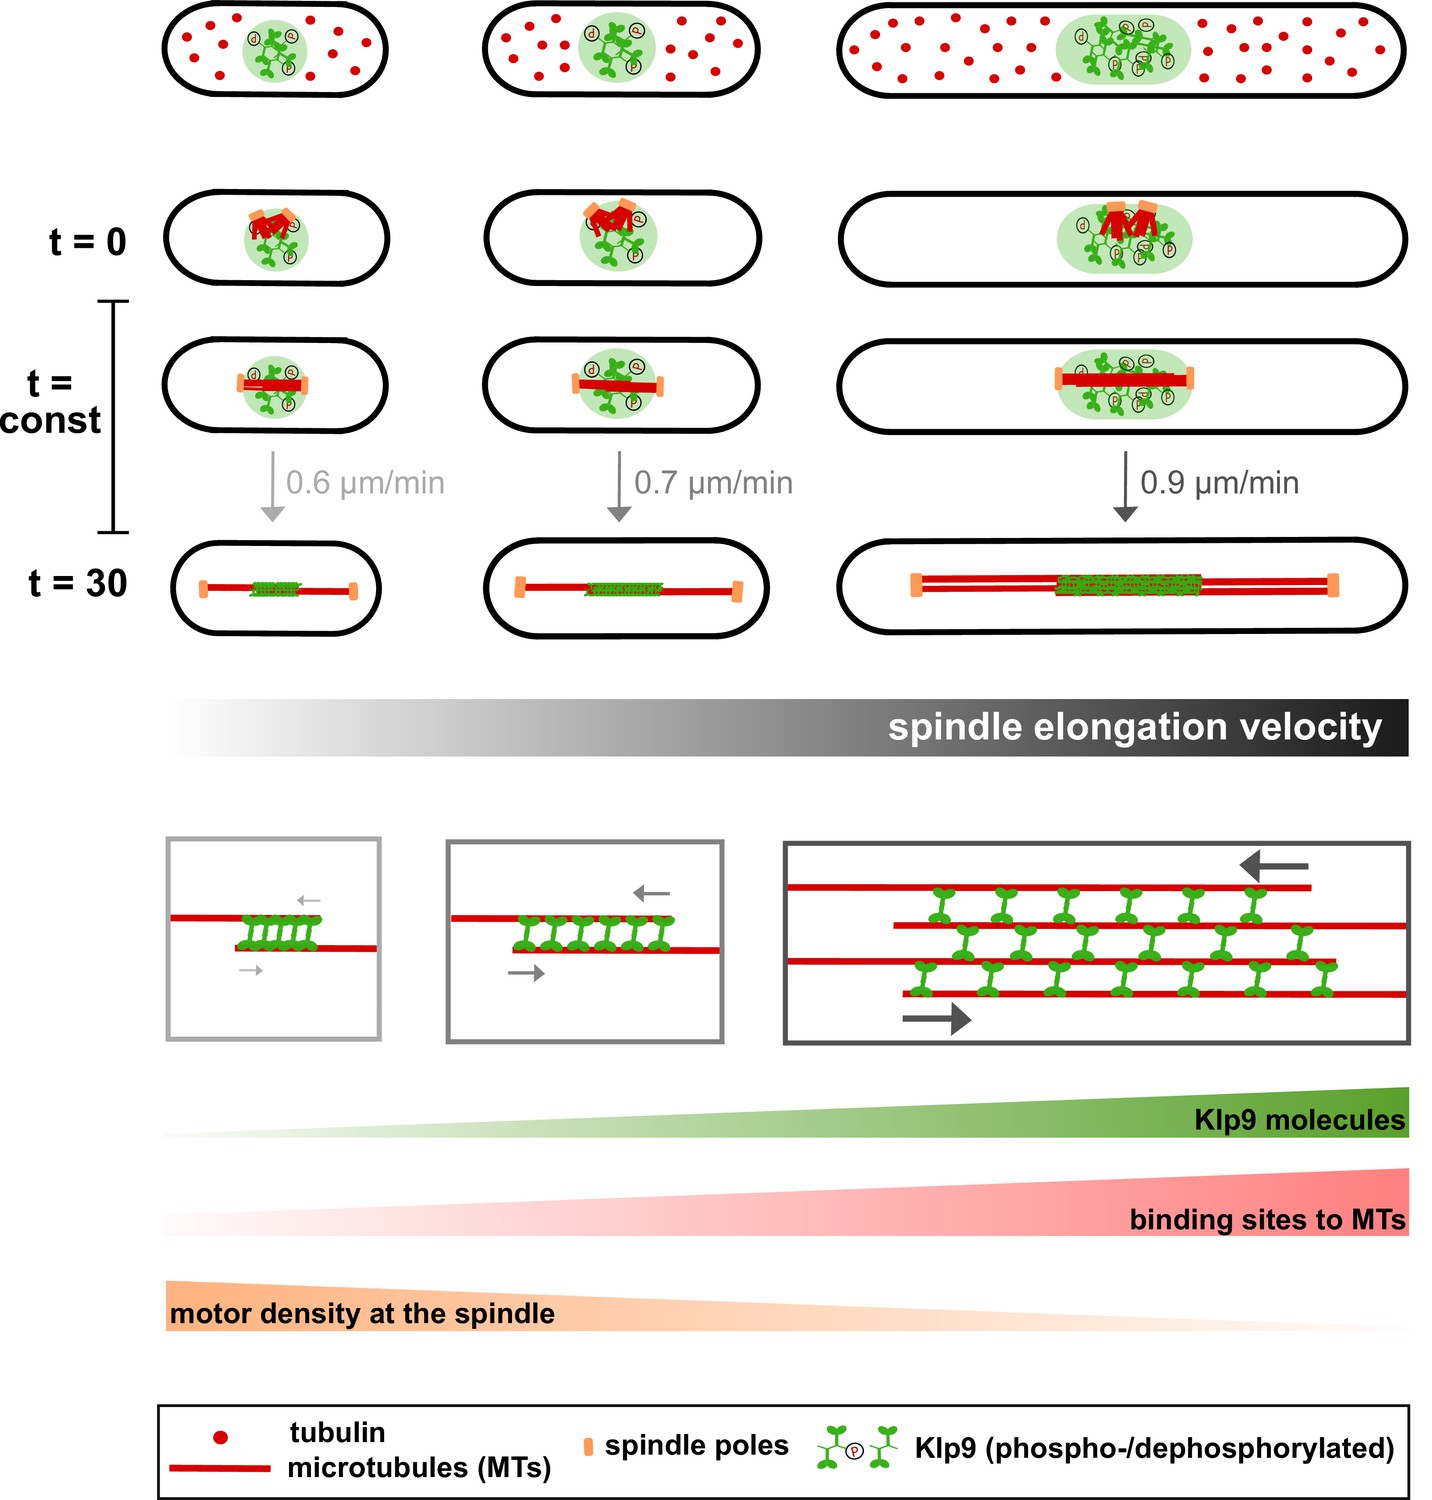
Limited components model for the regulation of cell-size-dependent spindle elongation and a constant mitosis duration.
Upper panel: The concentration of essential components such as tubulin (red) and Klp9 (green) is constant in cells of different sizes. Thus, total amounts increase proportional to cell size. Due to the presence of more tubulin molecules, longer and more dense spindles can be assembled in larger cells (from t = 0 to t = 30). Likewise, the presence of more Klp9 molecules allows the recruitment of more motors to the anaphase spindle (from t = 0 to t = 30). Lower panel: Since, both the length of antiparallel overlap and the number of microtubules within the midzone increase with cell size, the number of binding sites for Klp9 to the spindle scales overproportionally with spindle and cell length. Thereby, the motor density of Klp9 at the midzone is reduced. With more motors acting in a less crowded environment, spindle elongation can be accelerated and the overall duration of chromosome segregation is kept constant: with increasing cell size, longer spindles are elongated with increasing velocity.
Additional files
-
Supplementary file 1
S. pombe strain list.
- https://doi.org/10.7554/eLife.42182.033
-
Transparent reporting form
- https://doi.org/10.7554/eLife.42182.034
Download links
A two-part list of links to download the article, or parts of the article, in various formats.
Downloads (link to download the article as PDF)
Open citations (links to open the citations from this article in various online reference manager services)
Cite this article (links to download the citations from this article in formats compatible with various reference manager tools)
Kinesin-6 regulates cell-size-dependent spindle elongation velocity to keep mitosis duration constant in fission yeast
eLife 8:e42182.
https://doi.org/10.7554/eLife.42182


