Light-activated Frizzled7 reveals a permissive role of non-canonical wnt signaling in mesendoderm cell migration
- Institute of Science and Technology Austria, Austria
- University of Warwick, United Kingdom
- Monash University, Australia
Figures
Figure 1 with 1 supplement
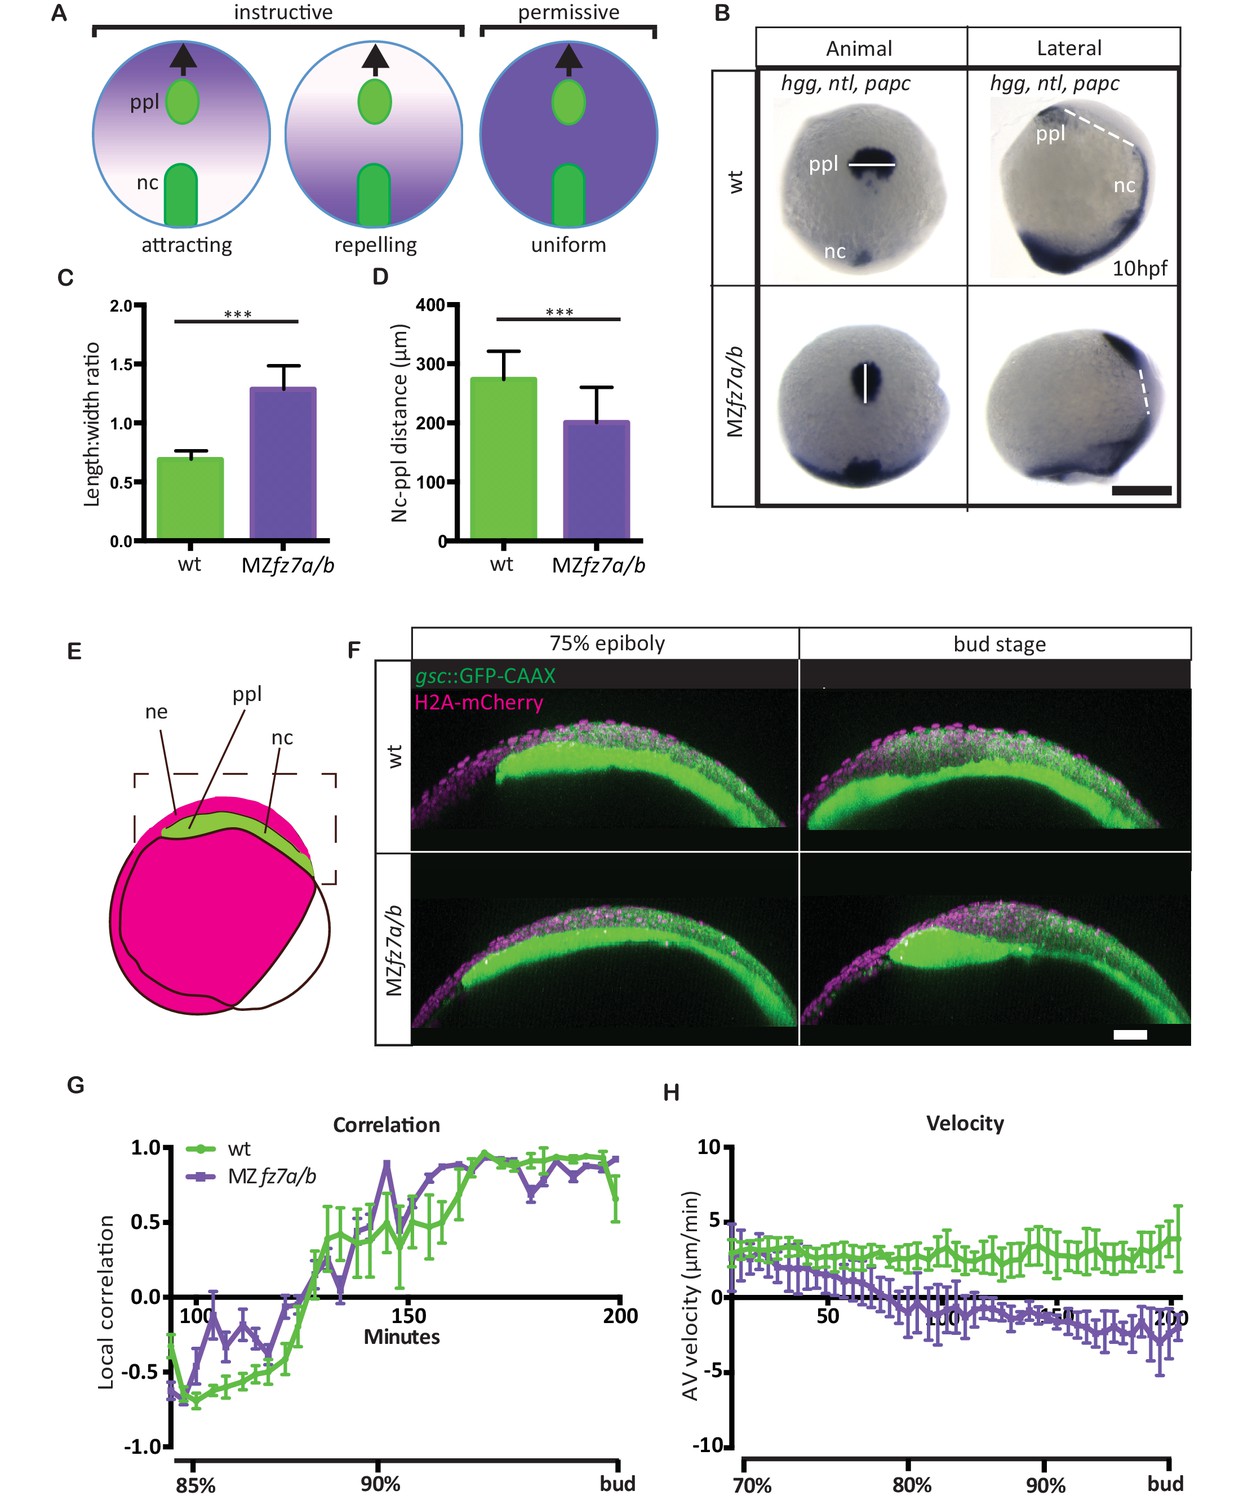
MZfz7a/b prechordal plate phenotype.
(A) Possible modes of Wnt-Fz/PCP function in ppl migration. The direction of ppl (green) migration (black arrows) could be influenced by an attracting or repellent gradient of Wnt-Fz/PCP signaling (purple), which polarizes ppl cells, and thus directs their migration instructively. Alternatively, uniform Wnt-Fz/PCP signaling could operate in a permissive mode, allowing ppl cells to undergo directed migration by for example controlling general cell motility. (B) Animal (left column) and lateral (right column) views of the notochord (nc) and prechordal plate (ppl) in wt (upper row) and MZfz7a/b mutant (lower row) embryos at the end of gastrulation (bud stage, 10hpf) labeled by in situ hybridization for hgg (ppl), ntl (nc), and papc (paraxial mesoderm). Scale bar, 250 μm. (C,D) Length-to-width ratio of the ppl (C) and distance between the anterior end of the nc and the posterior end of the ppl (D) in wt (green) and MZfz7a/b mutant (purple) embryos. Error bars are standard deviations; N = 23 (wt), 17 (MZfz7a/b), ***p<0.001 (Student’s t-test). (E) Schematic of embryo orientation used for imaging ppl and overlying neurectoderm (ne) movements in (F). Neurectoderm, magenta; ppl and nc, green; boxed area corresponds to the imaged area in (F). (F) Confocal microscopy images of wt (upper row) and MZfz7a/b mutant (lower row) embryos at mid (left, 75% epiboly) and late (right, bud stage) gastrulation. Nuclei are marked by H2A-mCherry expression, and ppl and nc are marked by gsc:GFP-CAAX expression. Scale bar, 50 μm. (G) Local correlation between leading edge ppl cells and overlying ectodermal cells in wt (green) and MZfz7a/b mutant (purple) embryos. X-axis, time (min, stage); y-axis, order parameter of local correlation; error bars are standard error of mean; N = 3 per genotype. (H) Velocities of ppl leading edge cells in wt (green) and MZfz7a/b mutant (purple) embryos. X-axis, time (min, stage); y-axis, velocity in vegetal to animal pole direction; error bars are standard error of mean; N = 3 per genotype.
-
Figure 1—source data 1
Characterization of MZfz7a/b mutants at the embryo and tissue level.
- https://doi.org/10.7554/eLife.42093.004
Figure 1—figure supplement 1
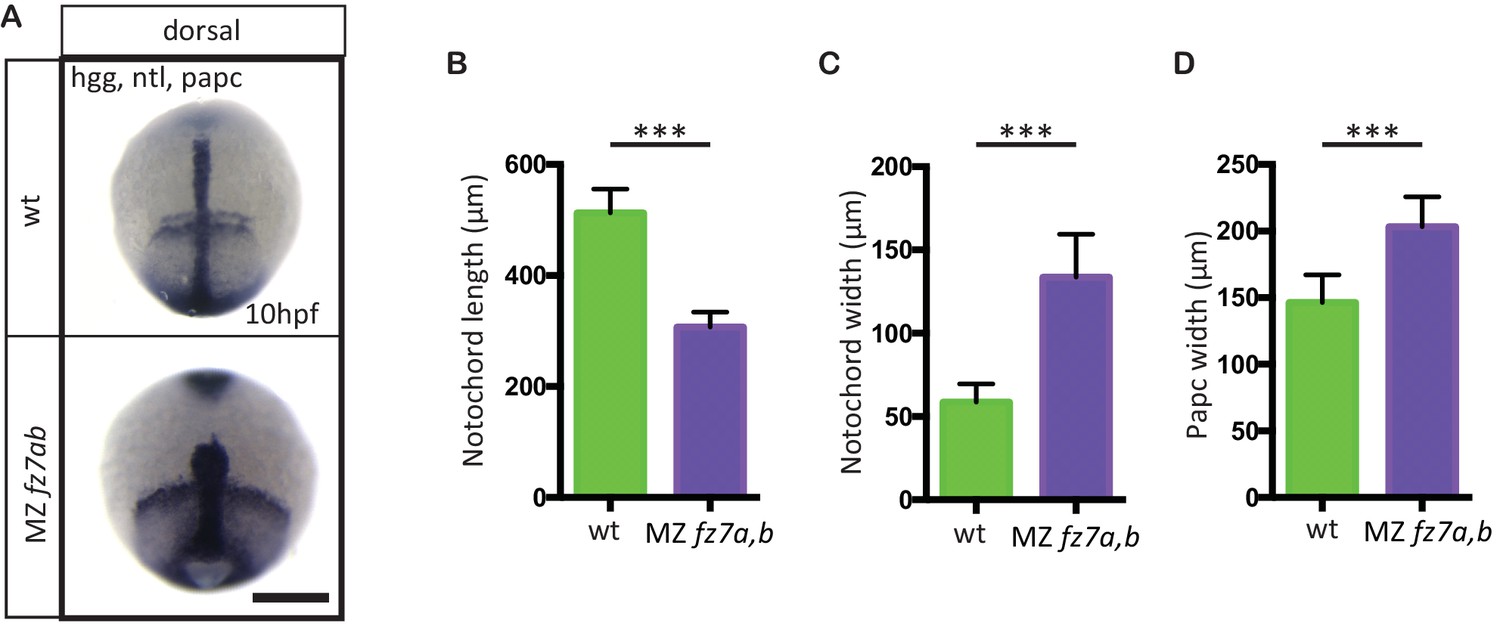
MZfz7a/b convergence and extension phenotypes.
(A) Dorsal view of wt(upper panel) and MZfz7a/b mutant (lower panel) embryos at the end of gastrulation (bud stage, 10 hpf) labeled by in situ hybridization for hgg (ppl), ntl (notochord), and papc (paraxial mesoderm). Scale bar, 250 μm. (B–D) Quantitation of the dorsal convergence and extension phenotypes of the notochord (B and C) and the paraxial mesoderm (D), error bars are standard deviations; N = 78 (wt), 63 (MZfz7a/b), ***p<0.001 (Student’s t-test).
Figure 2
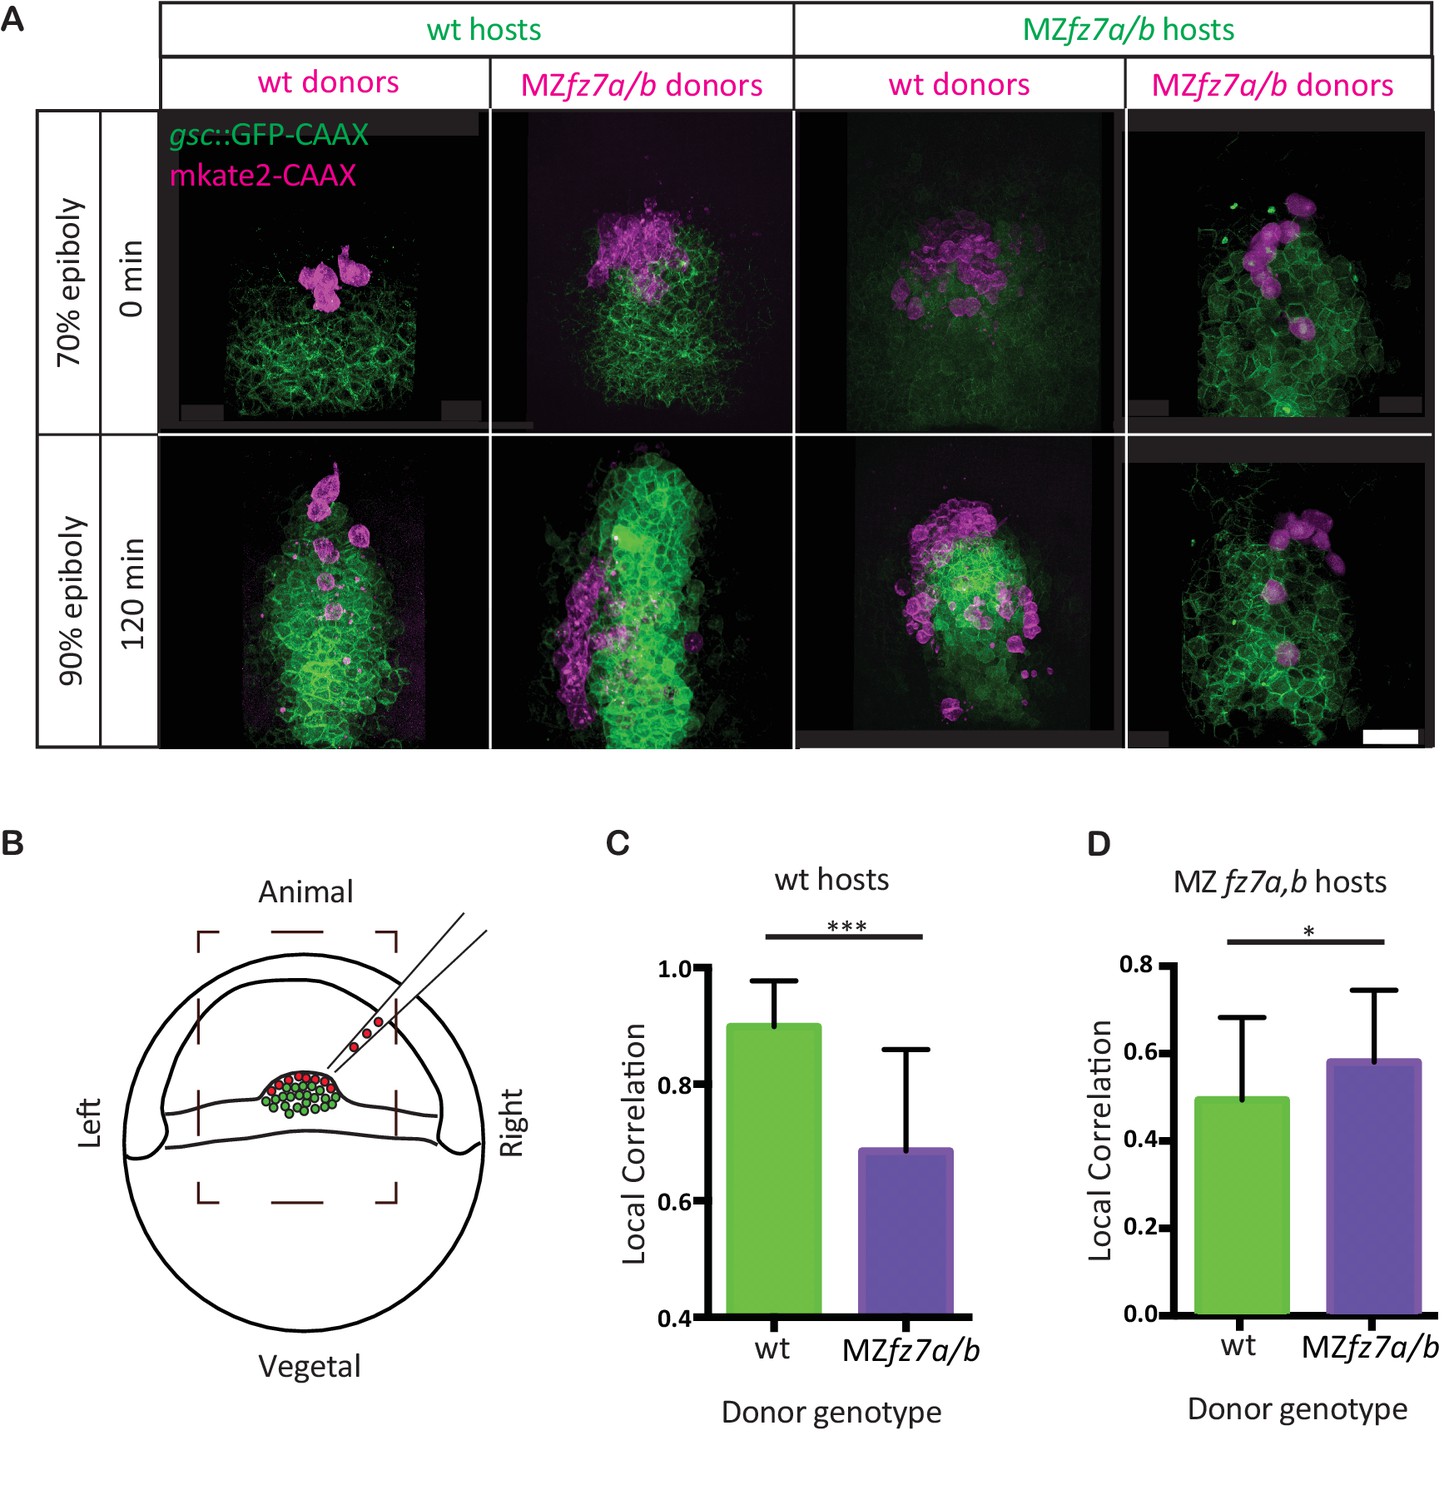
MZfz7a/b prechordal plate progenitor migration.
(A) 2-photon microscopy images of the transplanted ppl at early (70% epiboly; upper row) and late (90% epiboly, lower row) gastrulation. Dorsal views with animal to the top. Donor cells are marked by mkate2-CAAX expression (magenta) and host cells are marked by gsc:GFP-CAAX expression (green). Scale bar, 50 μm. (B) Schematic of the experimental setup of the transplantation experiments in (A). Cells from donor embryos consisting of ppl progenitors cells (magenta) were transplanted to the leading edge of the ppl (green) of a Tg(gsc:GFP-CAAX) or MZfz7a/b; Tg(gsc:GFP-CAAX) host embryo. Boxed area outlines the field of view in (A). (C,D) Local correlation between host and donor cells within the transplanted ppl for wt (C) and MZfz7a/b mutant (D) hosts. Error bars are standard deviations; N = 3 embryos for wt and MZfz7a/b hosts each, ***p<0.001 and *p<0.05 (Student’s t-test).
-
Figure 2—source data 1
Characterization of MZfz7a/b mutants cells in homotypic and heterotypic transplantation experiments.
- https://doi.org/10.7554/eLife.42093.007
Figure 3
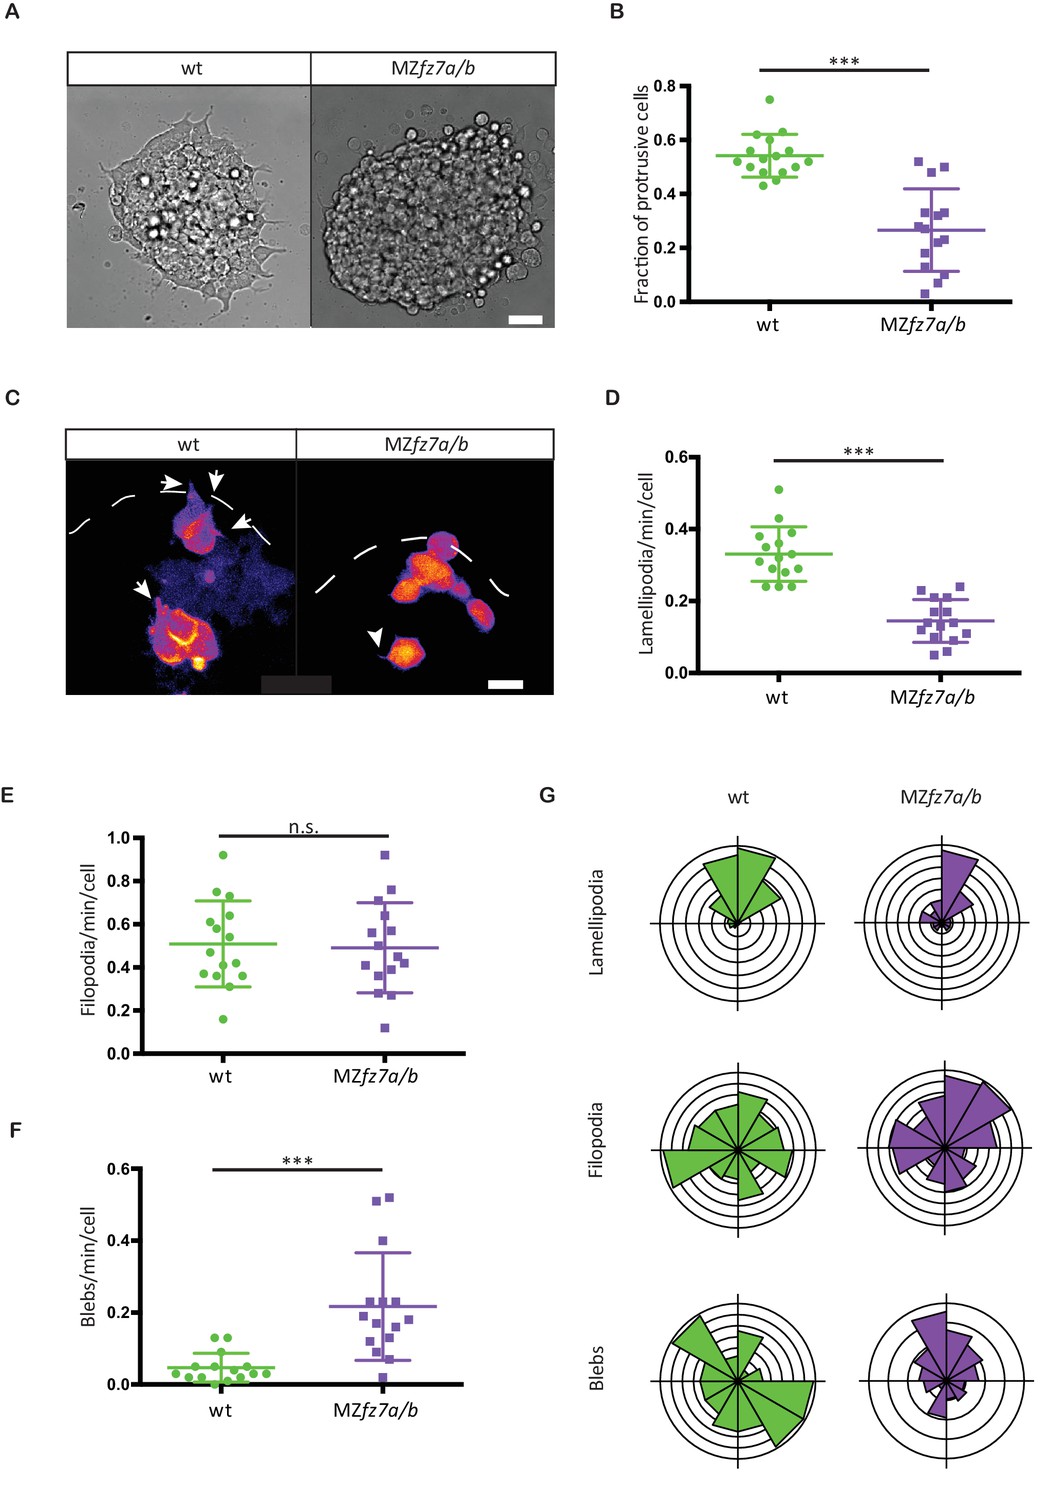
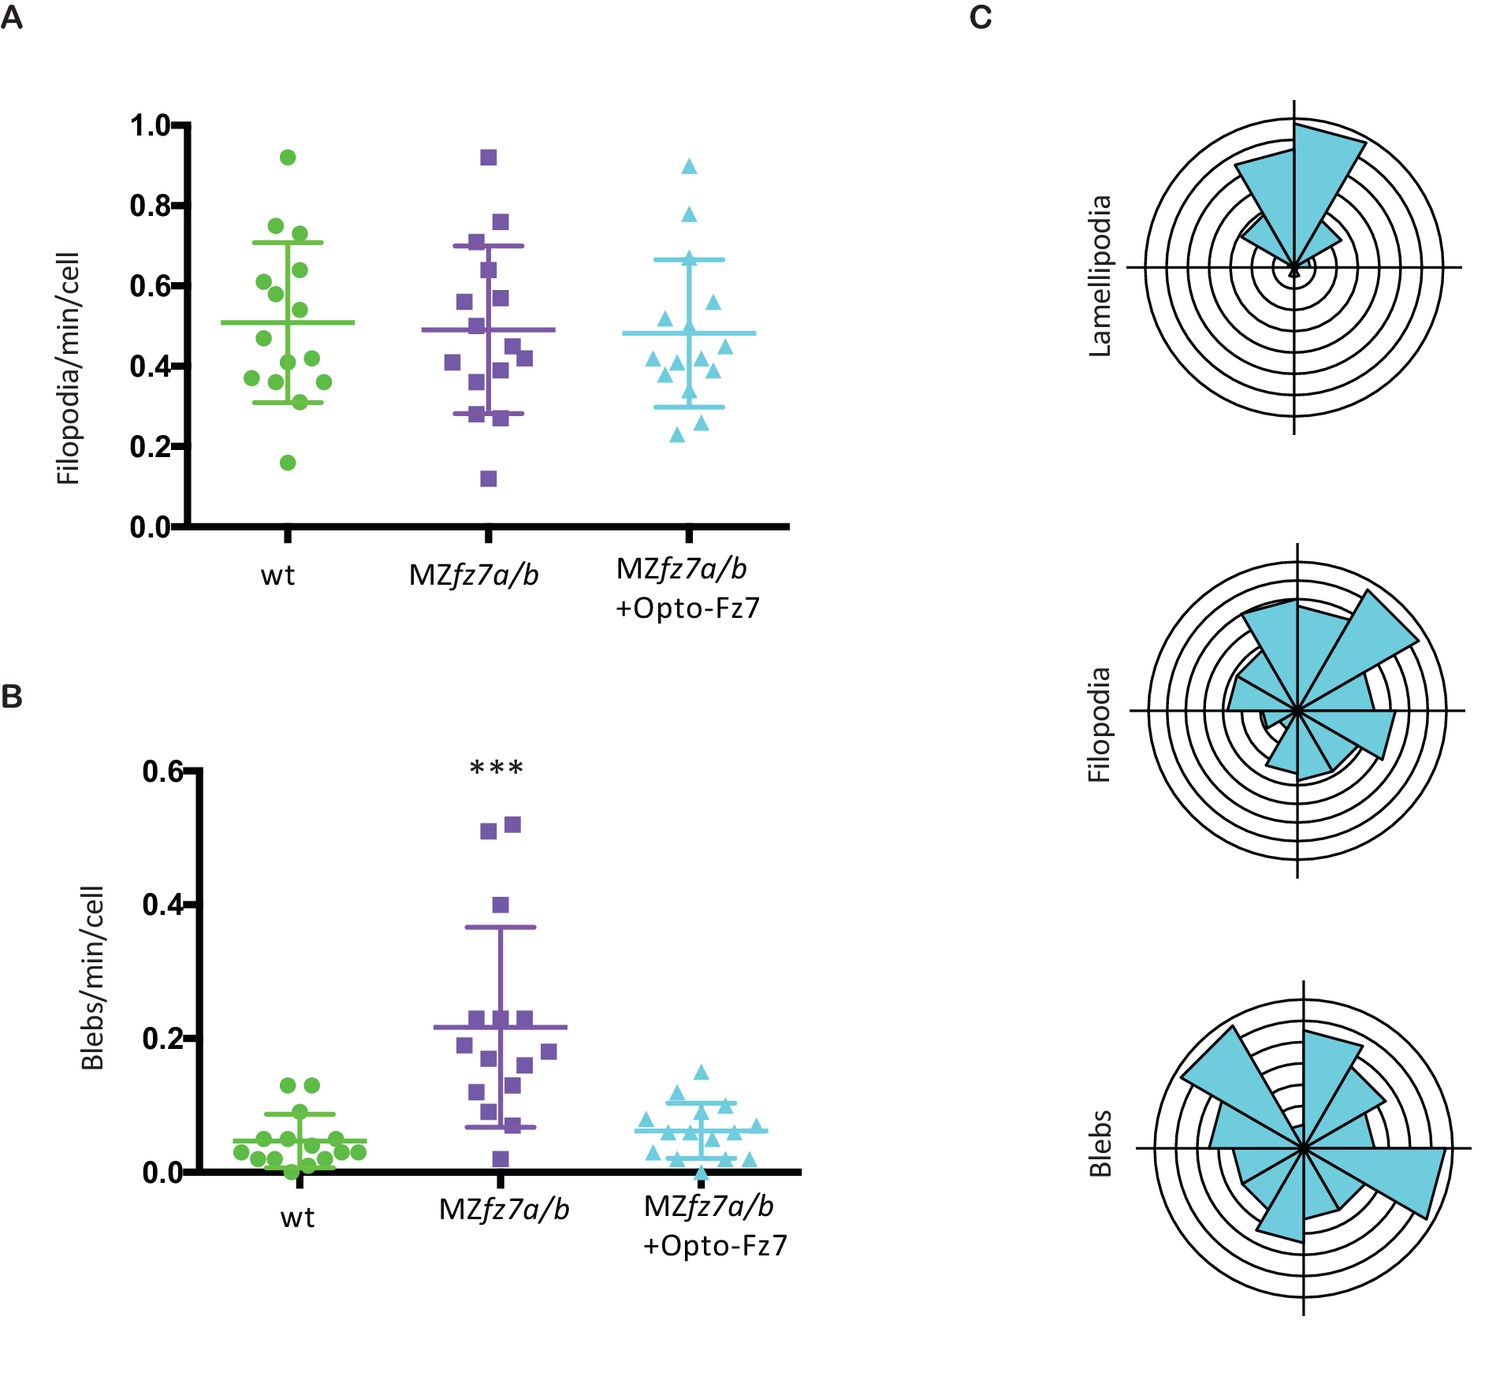
MZfz7a/b prechordal plate progenitor protrusion formation.
(A) Bright-field images of explants of wt (left) and MZfz7a/b mutant (right) ppl tissue. Scale bar, 40 μm. (B) Fraction of cells at the explant margin displaying lamellipodia-like protrusions after 4 hrs in culture. Scatter plot with mean and standard deviation. N = 12 explants per genotype; ***p<0.001 (Mann-Whitney test). (C) Confocal images of transplanted wt donor ppl cells in wt host embryos (left) and MZfz7a/b donor cells in MZfz7a/b mutant host embryos (right). Transplanted cells are marked by mkate2-CAAX expression. Dashed white line marks the anterior edge of the ppl. Arrows point at lamellipodia-like protrusions, arrowheads at filopodia. Scale bar, 20 μm. (D–F) Number (calculated per cell and minute) of different types of protrusions in the transplanted cells shown in (C). Scatter plot with mean and standard deviation. N = 15 cells from five embryos per genotype. ***p<0.001, n.s., non significant (Student’s t-test). (G) Orientation of different protrusion types in the transplanted cells shown in (C) (rose plots with animal top and vegetal bottom).
-
Figure 3—source data 1
Protrusion formation in wt and MZfz7a/b mutant embryos.
- https://doi.org/10.7554/eLife.42093.010
Figure 4 with 5 supplements

Photo-activation of Fz7 signaling in prechordal plate tissues in vitro and in vivo using Opto-Fz7.
(A) Schematic of the Opto-Fz7 receptor. Light blue bar symbolizes the plasma membrane with extracellular space above and intracellular space below the bar. Rhodopsin parts are shown in purple and Fz7 parts in green. TM1-7, transmembrane domains 1–7; ECL 1–3, extracellular loops 1–3, ICL 1–3, intracellular loops 1–3. Fz7 domains contain two Dshbinding sites in ICL3 (D1, D2), a PDZ domain-binding site (PDZ) near the C-terminus, and the last four amino acids (ETTV), which also have Dsh-binding function. (B) Confocal image of Opto-Fz7 subcellular localization in embryos injected with opto-Fz7-mcherry mRNA and 9-cis-retinal at 70% epiboly kept in dark. Scale bar, 20 μm. (C) Cytosol to membrane fluorescence intensity ratios of Opto-Fz7 shown in (B). Error bars are standard deviations; N = 67 cells from 10 embryos in the dark group, and 108 cells from 12 embryos in the light group, ***p<0.001 (Student’s t-test). (D) Explants of ppl tissue from MZfz7a/b;Tg(gsc:GFP-CAAX) mutant embryos expressing membrane-RFP, Opto-Fz7 and injected with 9-cis-retinal. Opto-Fz7 is photoactivated using a 488 nm laser in the left half of the explant (shown by GFP signal). Left panel, directly before activation; right panel, 130 min after activation. Note that the explant has moved into the activated region. Scale bar, 50 μm. (E) Movement of the explant along the x-axis. The x-position at the start of the experiment is used as x = 0 position. Blue box marks the time-interval of Opto-Fz7 photoactivation in (D). Arrows mark the time points when the images in (D) were taken. Eerror bars are standard error of mean; N = 15 explants from 2 experiments. (F) Confocal images of the ppl in MZfz7a/b;Tg(gsc:TurboRFP) embryos at 80% epiboly stage with animal to the top. Only one half of the ppl is exposed to 488 nm light to activate Opto-Fz7 signaling. Embryos were injected with 9-cis-retinal, and all nuclei in the right half of the ppl embryo are marked by H2B-GFP expression (to outline the initial photoactivation domain). Experimental embryos express Opto-Fz7 (left column) and control embryos Rhodopsin (right column). Upper panels are at the start of photoactivation (30 min after the experiment started), lower panels after 45 min of photoactivation (75 min after the experiment started). Dashed lines mark the ppl midline at the start of photactivation. Scale bar, 50 μm. (G) Ppl movement along the x-axis of the ppl. The x-position atthe time of photoactivation is used as x = 0 position. Error bars are standard deviations. Blue boxes outline time intervals of photoactivation in (F). Arrows mark the time points when the images in (F) were taken. N = 6 embryos per condition.
-
Figure 4—source data 1
Opto-Fz7 characterization and its effect on cell migration upon spatially restricted activation.
- https://doi.org/10.7554/eLife.42093.018
Figure 4—figure supplement 1
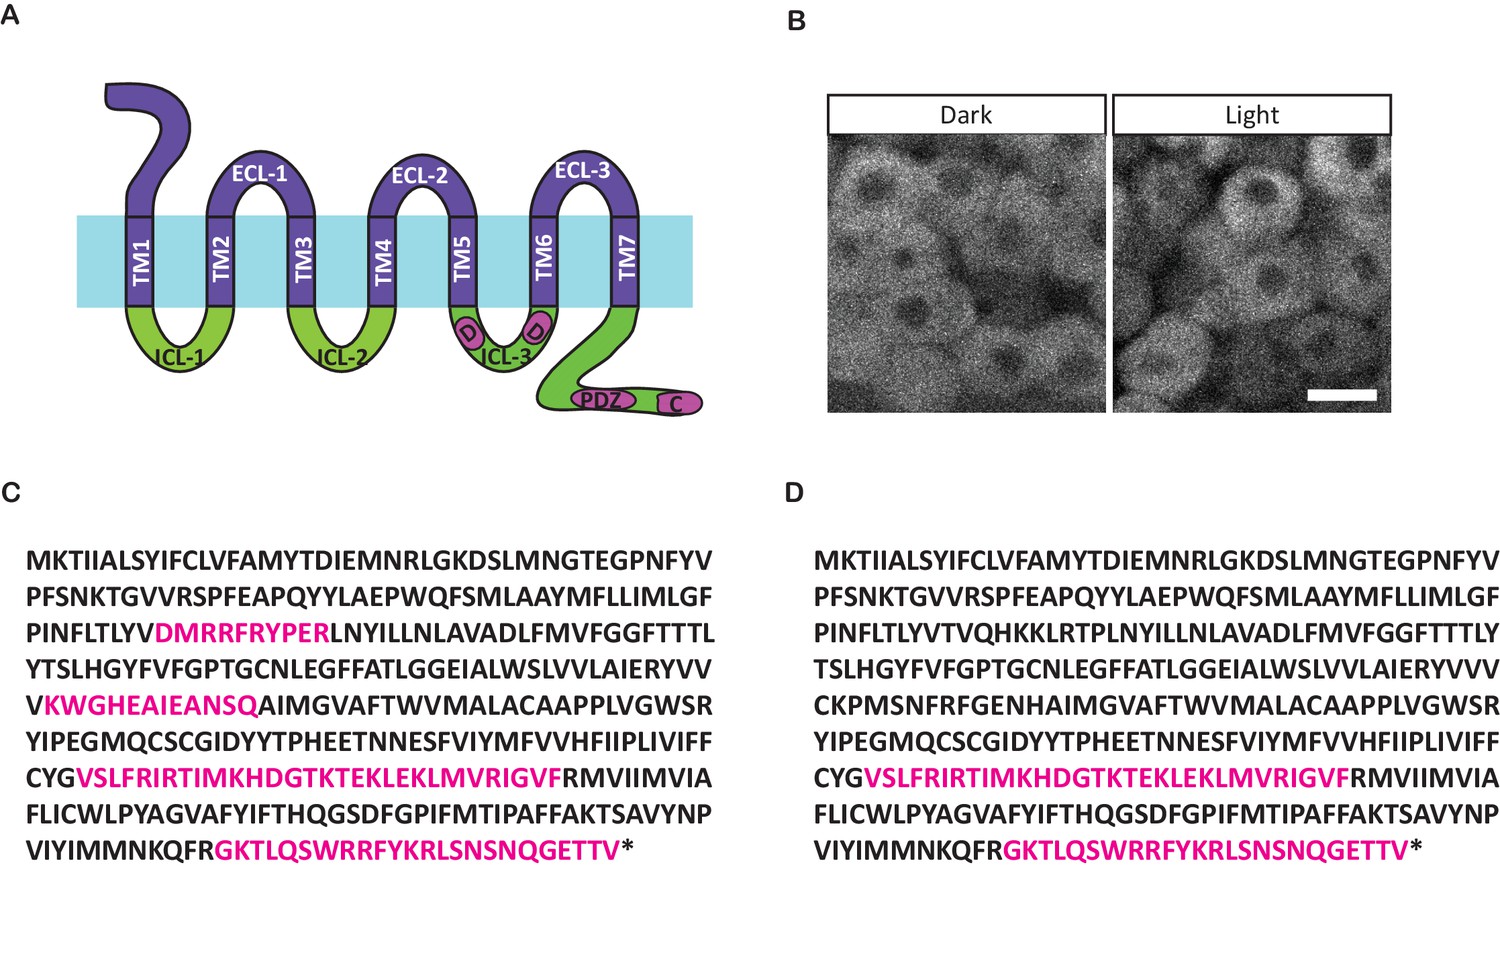
Opto-Fz7 architecture.
(A) Schematic of the Opto-Fz7 receptor with all intracellular structures from Fz7. Light blue bar symbolizes the plasma membrane with extracellular space above and intracellular space below the bar. Rhodopsin parts are shown in purple and Fz7 parts in green. TM1-7, transmembrane domains 1–7; ECL 1–3, extracellular loops 1–3; ICL 1–3, intracellular loops 1–3. Fz7 domains contain two Dsh binding sites in ICL3 (D1, D2), a PDZ domain-binding site (PDZ) near the C-terminus, and the last four amino acids (ETTV), which also have Dsh binding function. (B) Localization of the Opto-Fz7 version with all intracellular domains from Fz7, tagged with mCherry (200 pg mRNA injected). The construct fails to localize to the membrane in light and dark conditions. Scale bar, 20 μm. (C, D) Amino acid sequence of Rhodopsin-Fz7 chimeric receptors, with all intracellular domains (C) or the 3rd ICL and the C-terminus (D) replaced by Fz7. Magenta letters highlight Fz7 domains. Asterisk marks the stop codon.
Figure 4—figure supplement 2
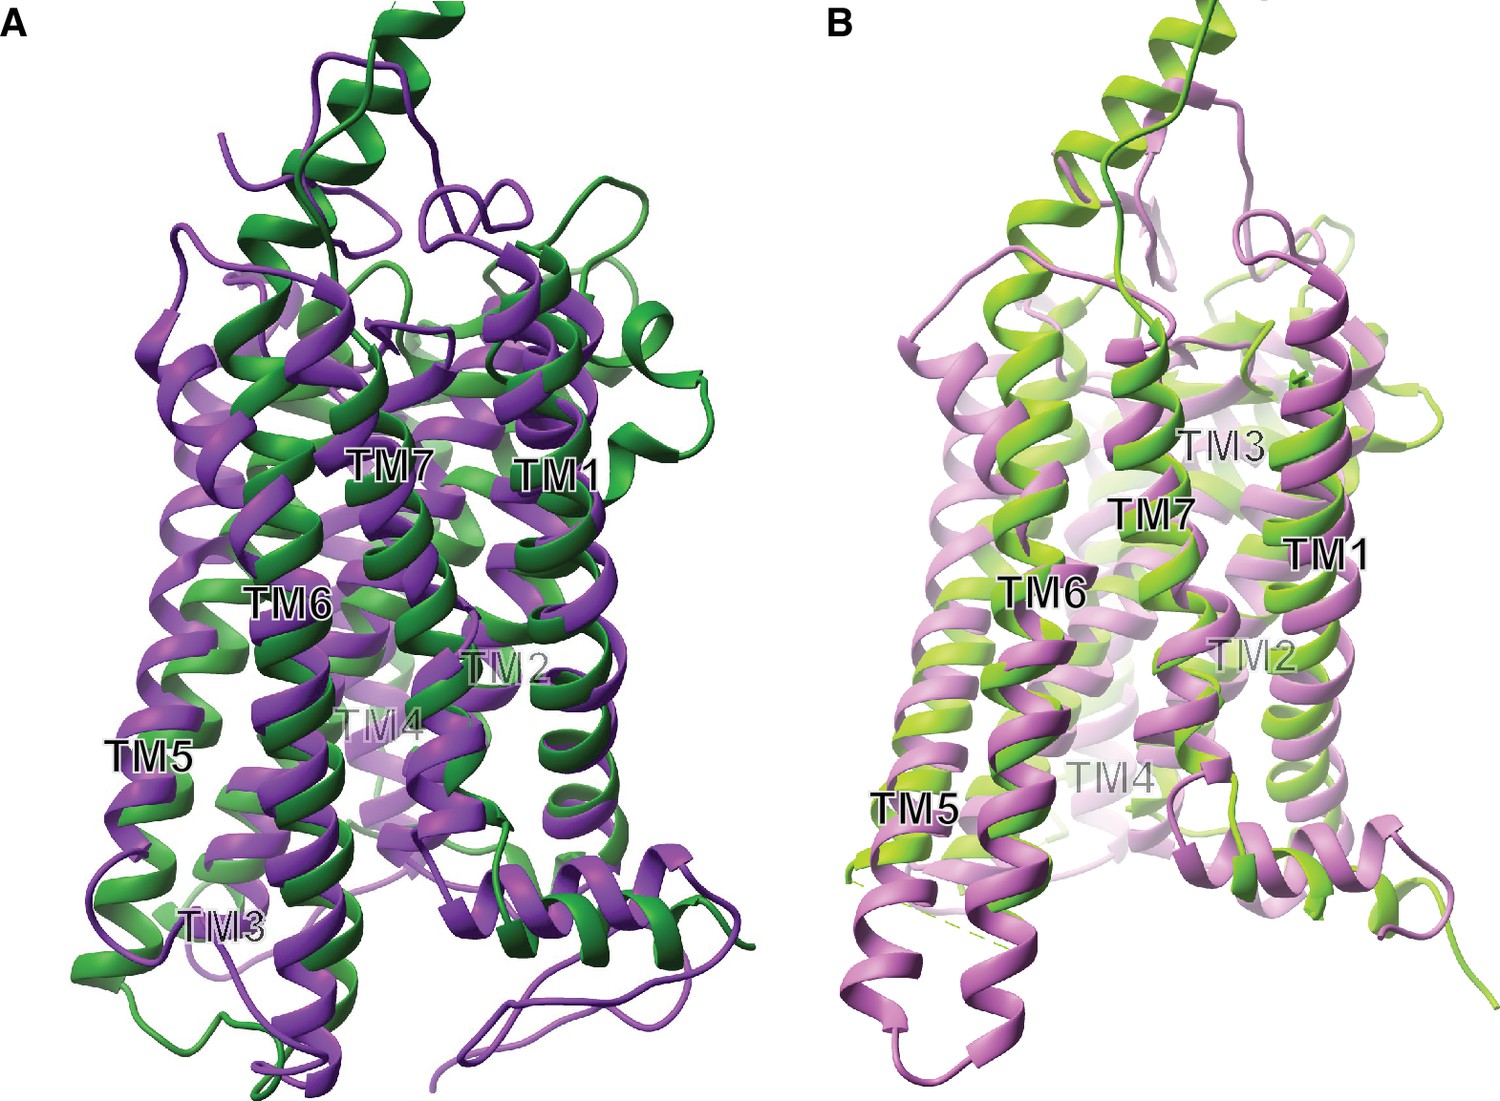
Receptor structural analysis.
(A) Ribbon model of superimposed inactive state structures of Rhodopsin (purple, PDB ID: 1U19) and Smo (dark green, PDB ID: 4JKV) showing the TM bundle. (B) Ribbon model of superimposed active state structures of Rhodopsin (pink, PDB ID: 3PQR) and Smo (light green, PDB ID: 6D32) showing the TM bundle.
Figure 4—figure supplement 3

Opto-Fz7 subcellular localization.
(A) Examples of ppl cells expressing Opto-Fz7-mcherry (200 pg mRNA) and 9-cis-Retinal (140 pg) in the presence or absence of light. Scale bar, 20 μm. (B) Localization of Opto-Fz7-mCherry in different cell types of the gastrulating embryo. 200 pg mRNA together with 140 pg of 9-cis-Retinal were injected into MZfz7a/b;Tg(gsc:GFP-CAAX) mutant embryos. Scale bars, 50 μm (overview panel) and 30 μm (epiblast, notochord, and paraxial mesoderm panels). (C) Quantitation of the subcellular distribution of Opto-Fz7-mCherry signal in the cells shown in (B) normalized to the fluorescence intensity at the animal side of the cells. Scatter plot with means and standard deviations. N = 12 cells from 3 (epiblast, notochord, and paraxial mesoderm) or 4 embryos (ppl), n.s., non significant (ANOVA or Kruskal-Wallis (notochord) tests).
Figure 4—figure supplement 4
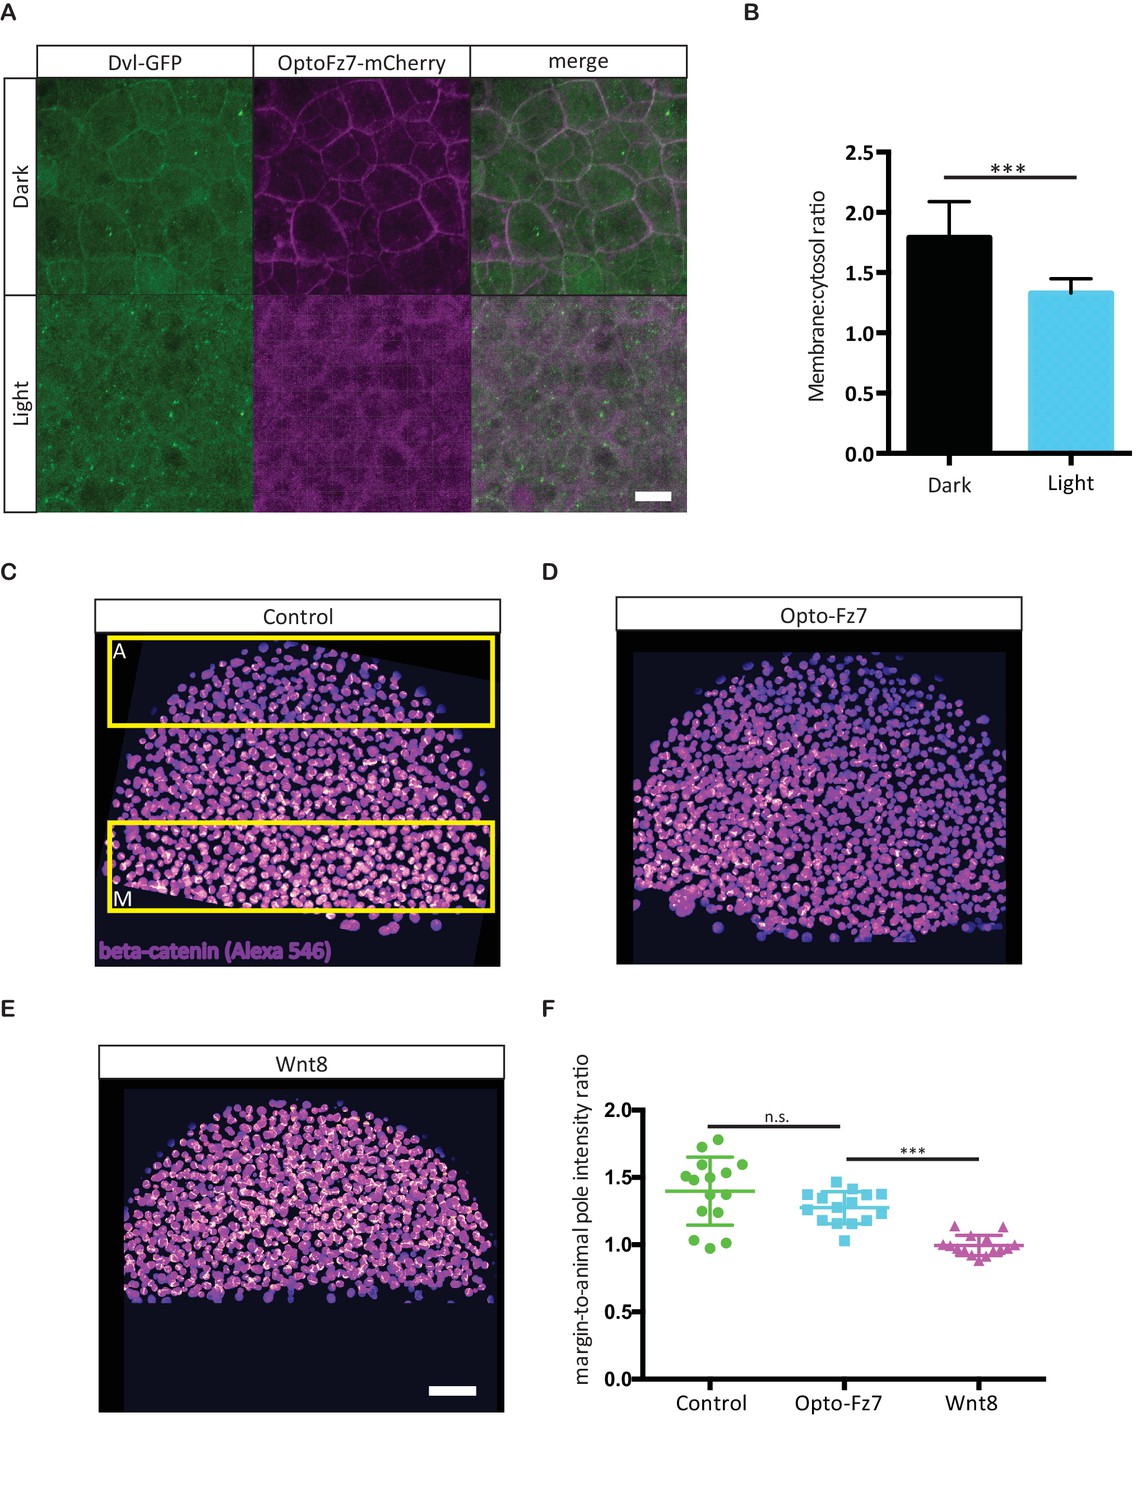
Effect of Opto-Fz7 activation on non-canonical Wnt/PCP and canonical Wnt signaling.
(A) Confocal images of zebrafish Dvl2-GFP and Opto-Fz7-mCherry subcellular localization at the animal pole of MZfz7a/b mutant embryos injected with dvl2-GFP and opto-Fz7-mcherry mRNA (100 pg each) and 9-cis-retinal at 30% epiboly in the presence or absence of light. Scale bar, 20 μm. (B) Cytosol to membrane fluorescence intensity ratios of Dvl2-GFP shown in (A). Error bars, standard deviations. N = 31 cells from five embryos in the dark group, and 36 cells from seven embryos in the light group, ***p<0.001 (Student’s t-test). (C–E) Confocal images of 50% epiboly embryos stained with an antibody directed against β-catenin. The nuclear signal was segmented based on nuclear staining with DAPI, and the intensity at the margin and animal pole (yellow boxes in C) was independently measured. Embryos were injected with either 50 pg of opto-fz7 mRNA together with 9-cis-retinal (D) or 100 pg wnt8 mRNA (E). Uninjected embryos were used as controls (C). Scale bar, 50 μm. (F) Quantitation of nuclear β-catenin fluorescence intensity at the animal pole, normalized to the signal at the blastoderm margin in control, Opto-Fz7, or Wnt8 overexpressing embryos. Scatter plot with means and standard deviations. N = 15 embryos from two experiments per condition, n.s., non significant and ***p<0.001 (ANOVA followed by Tukey’s multiple comparison test).
Figure 4—figure supplement 5
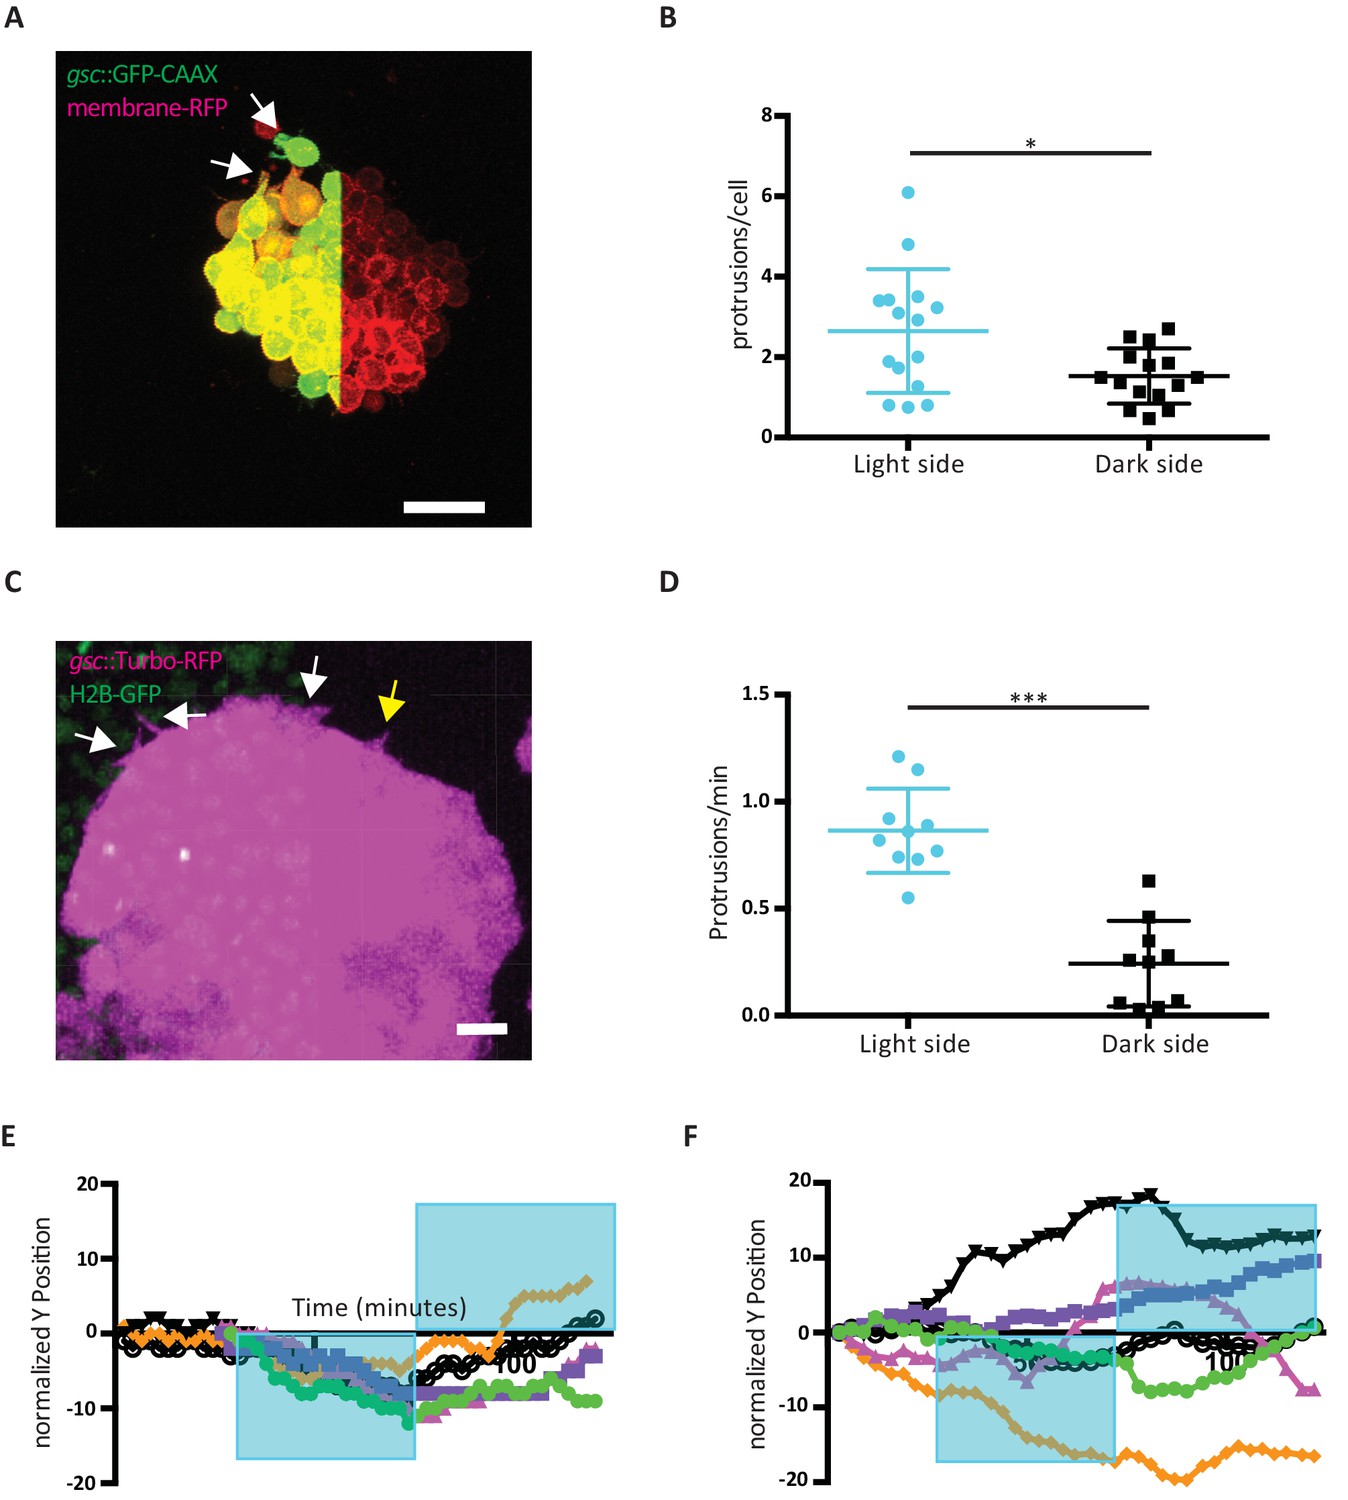
Effect of Opto-Fz7 activation on ppl progenitor protrusive activity.
(A) Explants of ppl tissue from MZfz7a/b;Tg(gsc:GFP-CAAX) mutant embryos expressing membrane-RFP (100 pg mRNA), Opto-Fz7 (25 pg mRNA) and injected with 9-cis-retinal. Opto-Fz7 was photoactivated using a 488 nm laser in the left half of the explant (shown by GFP signal). The light-exposed side displayed more lamellipodia-like protrusions (white arrows). (B) Number of protrusions on the light-exposed and non-exposed/dark side of Opto-Fz7-expressing ppl tissue explants over the duration of light exposure (100 min) normalized to the number of cells on the outside of the cluster. Scatter plot with means and standard deviations. N = 15 explants from two experiments, *p<0.05 (Student’s t-test). (C) Confocal image of the leading edge of an MZfz7a/b;Tg(gsc:TurboRFP) embryo expressing Opto-Fz7, 9-cis-retinal, and H2B-GFP. Light-exposed cells (H2B-GFP signal) showed a higher probability of forming protrusions (white arrows) than cells on the dark side (yellow arrow). (D) Number of cell protrusions in ppl leading edge cells at the photoactivated versus non-activated side of the ppl for Opto-Fz7 expressing embryos shown in Figure 4F. Scatter plot with means and standard deviations. N = 10 activations from 6 embryos, ***p<0.001 (Student’s t-test). (E and F) Single tracks of ppl movements in MZfz7a/b;Tg(gsc:TurboRFP) embryos expressing either Opto-Fz7 (E) or Rhodopsin (F) as shown in Figure 4F&G.
Figure 5 with 4 supplements

Uniform activation of Opto-Fz7 signaling in MZfz7a/b mutants.
(A) Bright-field images of ppl explants from wt and MZfz7a/b mutant embryos both expressing Opto-Fz7 and injected with 9-cis-retinal. Scale bar, 40 μm. (B) Fraction of ppl cells at the edge of the explants shown in (A) displaying lamellipodia-like protrusions after 4 hrs in culture. Opto-Fz7 expressing explants were compared to MZfz7a/b and wt explants shown in Figure 3B. N = 12 explants per genotype, ***p<0.001, *p<0.05, and n.s., non significant (ANOVA followed by Tukey’s multiple comparison test). (C) Animal (left column) and lateral (right column) views of the notochord (nc) and prechordal plate (ppl) in MZfz7a/b mutant embryos expressing Opto-Fz7 and injected with 9-cis-retinal at the end of gastrulation (bud stage, 10hpf) labeled by in situ hybridization for hgg (ppl), ntl (nc), and papc (paraxial mesoderm). Embryos were either exposed to light (upper row) or kept in the dark (lower row). Scale bar, 250 μm. (D,E) Length-to-width ratio of the ppl (D) and distance between the anterior end of the nc and the posterior end of the ppl (E) in MZfz7a/b mutant embryos expressing Opto-Fz7 and injected with 9-cis-retinal either exposed to light (blue) or kept in the dark (black). Wt (green) and untreated MZfz7a/b mutant (purple) embryos were included as controls. Error bars are standard deviations. N = 25 (wt), 24 (MZfz7a/b), 36 (Opto-Fz7, light), 36 (Opto-Fz7, dark), ***p<0.001, and n.s., non significant (Kruskal-Wallis test followed by Dunn’s multiple comparison test). (F) Confocal images of the ppl in wt host embryos containing transplanted MZfz7a/b mutant donor cells (magenta) expressing Opto-Fz7 and mkate2-CAAX and injected with 9-cis-retinal. Dorsal views with animal pole to the top. Host cells are marked by gsc:GFP-CAAX expression (green). Scale bar, 40 μm. (G) Local correlation between host and donor ppl cell movements shown in (F), compared to MZfz7a/b and wt ppl donor cells shown in Figure 2C. Error bars are standard deviations. N = 22 (wt), 36 (mutants), and 35 (mutants expressing Opto-Fz7) binned sectors from 3 embryos each, ***p<0.001, and n.s., non significant (Kruskal-Wallis test followed by Dunn’s multiple comparison test). (H) Number of lamellipodia-like protrusions per cell and minute in the transplanted donor cells shown in (I), compared to MZfz7a/b and wt ppl donor cells shown in Figure 3D. N = 15 cells per genotype, ***p<0.001, and n.s., non significant (ANOVA followed by Tukey’s multiple comparison test). (I) Confocal images of transplanted MZfz7a/b mutant donor ppl cells expressing OptoFz7 and mkate2-CAAX and injected with 9-cis-retinal within the ppl of a wt host embryo (anterior edge outlined by dashed white line). Scale bar, 20 μm.
-
Figure 5—source data 1
Rescue of MZfz7a/b embryos by Opto-Fz7 activation.
- https://doi.org/10.7554/eLife.42093.026
Figure 5—figure supplement 1
Protrusion formation in MZfz7a/b cells after Opto-Fz7 activation.
(A,B) Number (calculated per cell and minute) and (C) orientation (rose plots with animal top and vegetal bottom) of different types of protrusions in the transplanted cells shown in Figure 5H&I compared to MZfz7a/b and wt ppl donor cells shown in Figure 3D. N = 15 cells from five embryos per genotype, ***p<0.001 (ANOVA followed by Tukey’s multiple comparison test).
Figure 5—figure supplement 2
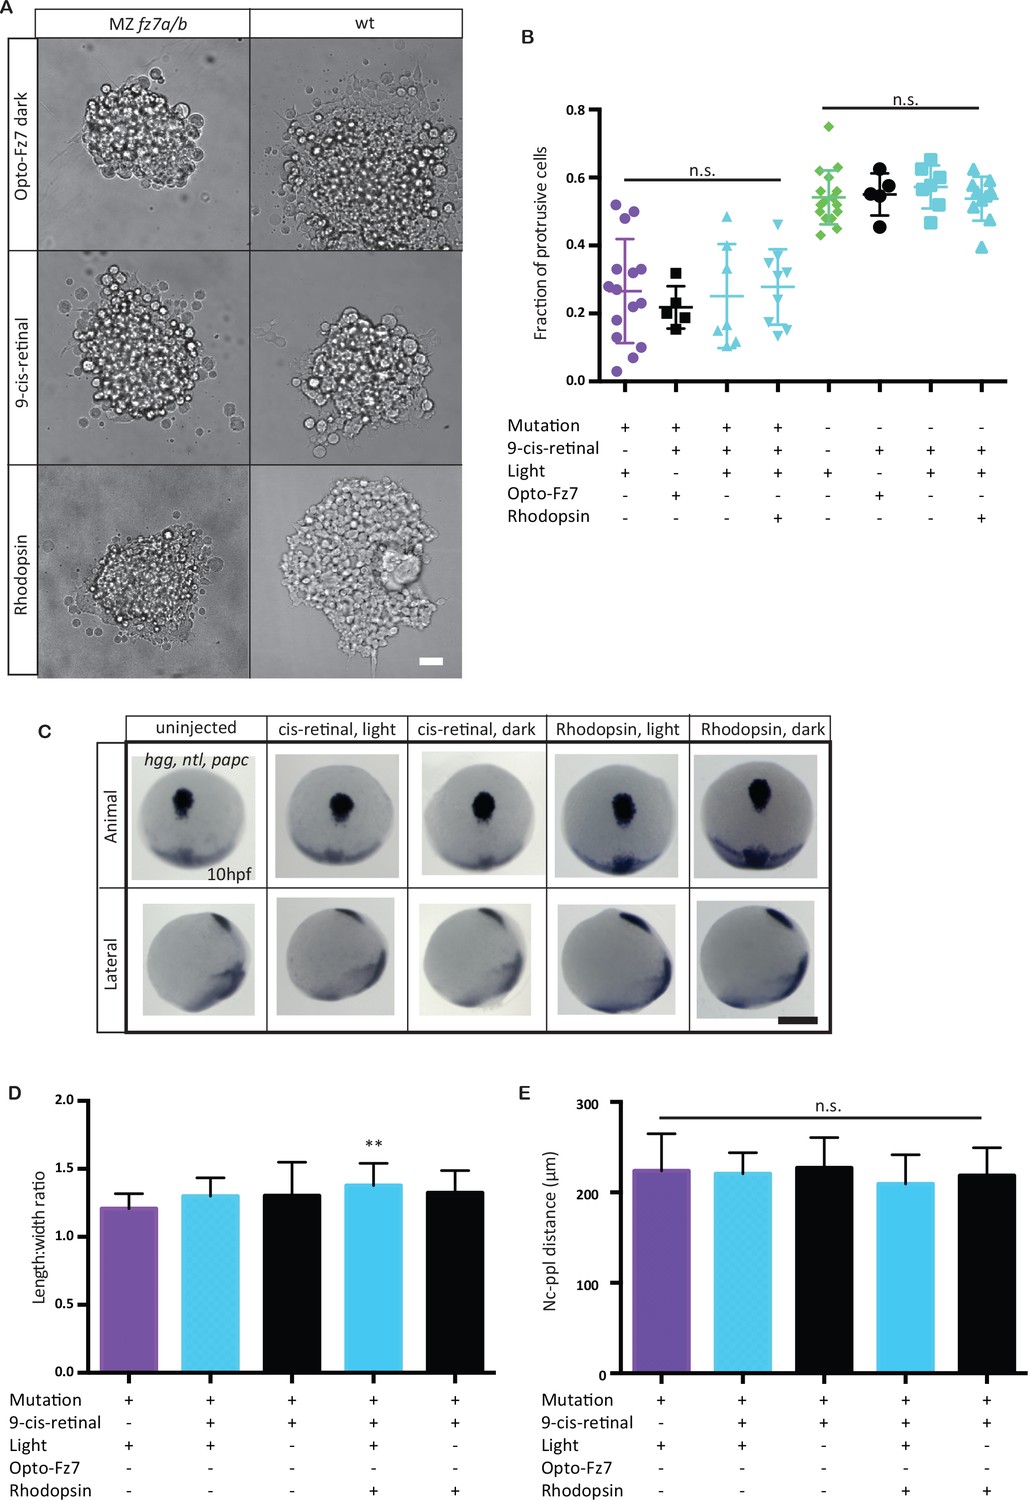
Opto-Fz7 control experiments.
(A) Bright-field images of ppl explants from wt and MZfz7a/b mutant embryos either injected with Opto-Fz7 and 9-cis-retinal and kept in dark (red light for imaging, control 1), or injected with Rhodopsin and 9-cis-retinal and exposed to light (control 2), or injected with 9-cis-retinal and kept in light (control 3). Scale bar, 40 μm. (B) Fraction of ppl cells at the edge of the explants shown in (A) displaying lamellipodia-like protrusions after 4 hrs in culture, compared to MZfz7a/b and wt explants without Opto-Fz7 as shown in Figure 3B. N = 5 (Opto-Fz7, dark), 9 (Rhodopsin), 7 (9-cis-retinal), n.s., non significant (Mann-Whitney test). (C) Animal (upper panels) and lateral (lower panels) views of the notochord (nc) and prechordal plate (ppl) in MZfz7a/b mutant embryos injected either with rhodopsin mRNA together with 9-cis-retinal or with 9-cis-retinal only at the end of gastrulation (bud stage, 10 hpf) labeled by in situ hybridization for hgg (ppl), ntl (nc), and papc (paraxial mesoderm). Embryos were either exposed to light or kept in the dark. Scale bar, 250 μm. (D,E) Length-to-width ratio of the ppl (D) and distance between the anterior end of the nc and the posterior end of the ppl (E) in MZfz7a/b mutant embryos injected either with rhodopsin mRNA together with 9-cis-retinal or with 9-cis-retinal only, either exposed to light (sky blue) or kept in the dark (black). Untreated MZfz7a/b mutant (purple) embryos were included as controls. Error bars, standard deviations. N = 15 (MZfz7a/b), 15 (cis-retinal, light), 17 (cis-retinal, dark), 30 (Rhodopsin, light), 31 (Rhodopsin, dark), **p<0.01, and n.s., non significant (ANOVA followed by Tukey’s multiple comparison test).
Figure 5—figure supplement 3

Convergence and extension movements in MZfz7a/b mutants after Opto-Fz7 activation.
(A) Dorsal views of wt and MZfz7a/b mutant embryos, as well as MZfz7a/b mutant embryos expressing Opto-Fz7 and injected with 9-cis-retinal at the end of gastrulation (bud stage, 10 hpf) labeled by in situ hybridization for hgg (ppl), ntl (nc), and papc (paraxial mesoderm). Embryos were exposed to light. Scale bar, 250 μm. (B–D) Notochord length (B) and width (C), and width of the paraxial mesoderm (D) in wt MZfz7a/b mutant embryos, as well as MZfz7a/b mutant embryos expressing Opto-Fz7 and injected with 9-cis-retinal, compared to uninjected mutant and wt embryos from Figure 1—figure supplement 1B-D. N = 78 (wt), 63 (MZfz7a/b), 21 (MZfz7a/b plus Opto-Fz7), *p<0.05, ***p<0.001 (ANOVA followed by Tukey’s multiple comparison test for B and D, Kruskal-Wallis test followed by Dunn’s multiple comparison test for C).
Figure 5—figure supplement 4
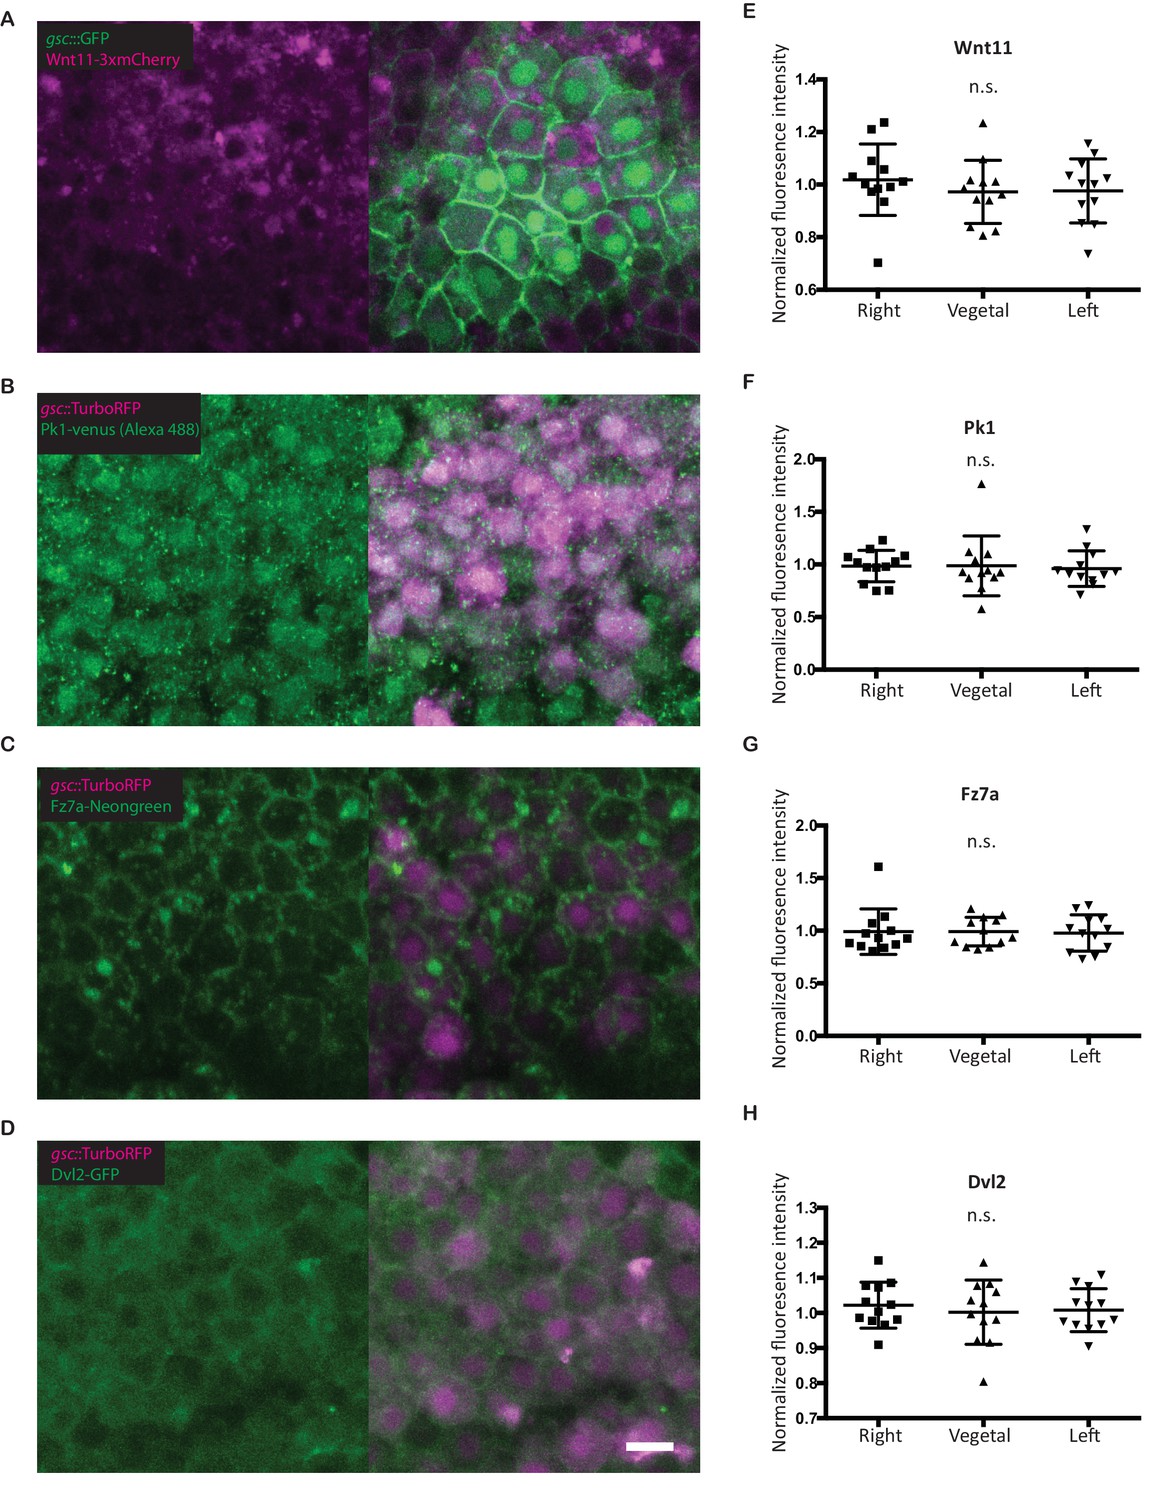
Subcellular localization of PCP components in the ppl.
(A–D) Confocal images of fixed Tg(gsc:GFP-CAAX) (A) or Tg(gsc:Turbo-RFP) (B–D) embryos at 90% epiboly (9hpf) stage. Embryos were injected with 60 pg wnt11-3x-mCherry (A), 25 pg pk1-venus (B), 100 pg fz7a-mNeongreen (C), or 100 pg dvl2-GFP (D) mRNA. Pk1 was detected by anti-GFP antibody staining. Scale bar, 10 μm. (E–H) Quantitation of the subcellular distribution (fluorescence intensity) of Wnt/PCP proteins in ppl cells normalized to their localization at the animal side of those cells. Scatter plot with means and standard deviations. N = 12 cells from three embryos, n.s., non significant (ANOVA (Wnt11 and Dvl2) or Kruskal-Wallis test (Pk1 and Fz7a)).
Videos
Video 1
Ppl and overlying neurectoderm cell movements in MZfz7a/b mutant and wt Tg(gsc:GFP-CAAX) embryos from 7 to 10 hpf.
Ppl cells are marked by gsc:GFP-CAAX expression (green) and all nuclei are stained by H2A-mCherry (magenta). Lateral view with animal pole to the left. Arrows point at ppl leading edge at the time the mutant ppl stops moving forward. Scale bar, 50 μm.
Video 2
Movement of MZfz7a/b mutant and wt donor ppl cells (magenta) transplanted into the ppl of wt Tg(gsc:GFP-CAAX) host embryos.
Transplanted cells are marked by mkate2-CAAX expression (magenta) and donor cells express gsc:GFP-CAAX (green). Scale bar, 50 μm.
Video 3
MZfz7a/b mutant and wt donor ppl cells (magenta) transplanted into the ppl of a Tg(gsc:GFP-CAAX) host embryo with the same genotype (homotypic transplantations).
Donor cells are marked by mkate2-CAAX expression. Only donor cells are shown. Yellow arrowheads point to filopodia, white arrowheads to larger lamellipodia/pseudopodia-like protrusions. Scale bar, 30 μm.
Video 4
Cultured ppl explant from MZfz7a/b;Tg(gsc:GFP-CAAX) mutant embryos expressing membrane-RFP and Opto-Fz7 and injected with 9-cis-retinal.
Upon photoactivation of Opto-Fz7 in half of the explant (shown by GFP excitation), the explant begins to move into the light-exposed area. Scale bar, 30 μm.
Video 5
Ppl movement in a MZfz7a/b; Tg(gsc:Turbo-RFP) embryo expressing H2B-GFP (marking all nuclei, green) and Opto-Fz7 and injected with 9-cis-retinal.
Ppl cells are marked by expression of gsc:Turbo-RFP (magenta). Upon photoactivation of Opto-Fz7 in half of the ppl, the explant begins to move into the light-exposed area. Nuclei are only shown in the light-activated side of the ppl to outline the activation domain. Scale bar, 70 μm.
Video 6
MZfz7a/b donor cells expressing Opto-Fz7 and injected with 9-cis-retinal transplanted into the ppl of a wt Tg(gsc:GFP-CAAX) host ppl.
Transplanted cells are marked by mkate2-CAAX expression (magenta) and donor cells express gsc:GFP-CAAX (green). Scale bar, 50 μm.
Video 7
Movement of MZfz7a/b mutant donor ppl cells expressing Opto-Fz7, injected with 9-cis-retinal and transplanted into the ppl of a wt Tg(gsc:GFP-CAAX) host.
Transplanted cells are marked by mkate2-CAAX expression (magenta) and donor cells express gsc:GFP-CAAX (green). Yellow arrowheads point to filopodia, white arrowheads to larger lamelipodia/pseudopodia-like protrusions. Scale bar, 30 μm.
Tables
Key resources table
| Reagent type (species) or resource | Designation | Source or reference | Identifiers | Additional information |
|---|---|---|---|---|
| Experimental model | Zebrafish: Tg(gsc::EGFP-CAAX) | Smutny et al., 2017 | NA | |
| Experimental model | Zebrafish: Tg(gsc::Turbo-RFP) | Sako et al. (2016) | ZDB-ALT- 161005–1 | |
| Experimental model | Zebrafish: MZfz7a/b | Quesada-Hernández et al. (2010) | ZDB-FISH- 150901–19586 | |
| Experimental model | Zebrafish: MZfz7a/b;Tg (gsc::EGFP-CAAX) | this paper | NA | |
| Experimental model | Zebrafish: MZfz7a/b;Tg (gsc::Turbo-RFP) | this paper | NA | |
| Oligonucleotides | casanova morpholino GCATCCGGTCGAGATACATGCTGTT | Gene Tools | ZDB-MRPHLNO -050818–2 | |
| Recombinant DNA reagent | pcDNA 3.1-Opto-Fz7 plasmid for mRNA synthesis | this paper | NA | |
| Recombinant DNA reagent | pcDNA 3.1-Opto-Fz7-mCherry plasmid for mRNA synthesis | This paper | NA | |
| Recombinant DNA reagent | pCS2-Ndr2 plasmid for mRNA synthesis | Rebagliati et al., 1998 | NM_139133.1 | |
| Recombinant DNA reagent | pCS2-Wnt11-3xmCherry | this paper | NM_001144804.1 | |
| Recombinant DNA reagent | pCS2-Fz7a-mNeongreen | this paper | NM_131139.2 | |
| Recombinant DNA reagent | pCS2-Pk1-venus | Carreira-Barbosa et al., 2003 | NM_183342.2 | |
| Recombinant DNA reagent | pCS2-Dvl2-eGFP | other | NM_212648.1 | courtesy of Masazumi Tada |
| Antibody | ß-catenin clone 15B6 | Sigma | C7207, RRID:AB_476865 | |
| Antibody | Alexa Fluor 568 Goat Anti-Mouse IgG (H + L) Antibody | Molecular Probes | A11004, RRID: AB_141371 | |
| Antibody | GFP mAb3E6 | Molecular Probes | A11120, RRID:AB_221568 | |
| Antibody | Alexa Fluor 488 Goat Anti-Mouse IgG (H + L) Antibody | Molecular Probes | A11001 | |
| chemical compound | 9-cis-retinal | Sigma | R5754 | |
| Cell culture reagent | DMEM/F12 | Sigma | DF-041-B |
Additional files
-
Transparent reporting form
- https://doi.org/10.7554/eLife.42093.029
Download links
A two-part list of links to download the article, or parts of the article, in various formats.
Downloads (link to download the article as PDF)
Open citations (links to open the citations from this article in various online reference manager services)
Cite this article (links to download the citations from this article in formats compatible with various reference manager tools)
Light-activated Frizzled7 reveals a permissive role of non-canonical wnt signaling in mesendoderm cell migration
eLife 8:e42093.
https://doi.org/10.7554/eLife.42093


