Quorum sensing controls Vibrio cholerae multicellular aggregate formation
- Princeton University, United States
- Howard Hughes Medical Institute, United States
Figures
Figure 1
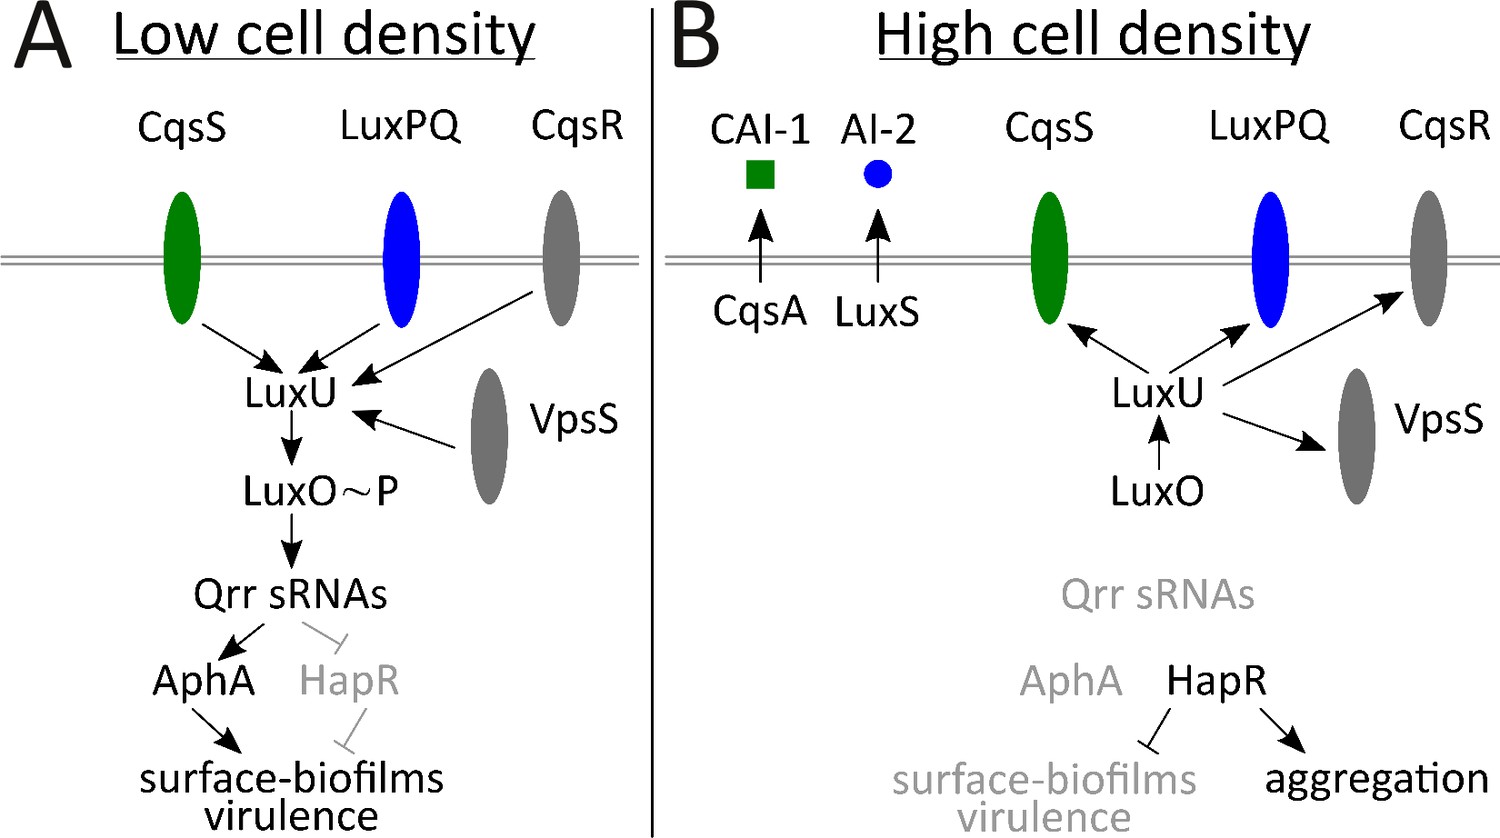
Simplified V. cholerae quorum-sensing circuit.
(A) At low cell density (LCD), when autoinducer concentration is low, the transmembrane receptors CqsS (green) and LuxPQ (blue) act as kinases and funnel phosphate to LuxO through the intermediary protein LuxU. Phospho-LuxO activates transcription of genes encoding regulatory RNAs called the Qrr sRNAs. The Qrr sRNAs activate translation of AphA and repress translation of HapR. This condition promotes the LCD QS program, which includes expression of genes encoding virulence factors and surface-biofilm formation. (B) At high cell density (HCD), when autoinducers have accumulated, CAI-1 (green squares) and AI-2 (blue circles) bind to their respective cognate receptors, CqsS and LuxPQ. Autoinducer binding converts the receptors into phosphatases that dephosphorylate and inactivate LuxO. Therefore, the Qrr sRNAs are not produced. In the absence of the Qrr sRNAs, AphA translation is not activated and HapR translation is not repressed. HapR represses the surface-biofilm and virulence programs. HapR activates the aggregation process that occurs in liquid. Two other QS receptors, VpsS and CqsR (both depicted in gray), with unknown ligands, also transduce QS information through LuxU.
Figure 2 with 7 supplements

Quorum sensing controls rapid, VpsL-independent aggregation of V. cholerae in liquid.
Aggregate formation of the LCD QS-locked (LCD-locked) (A), HCD QS-locked (HCD-locked) (B), and wild-type (WT) (C) V. cholerae strains after 22 h of growth. Shown are representative cross-sections through samples (A–C). The approximate extents of individual aggregates are indicated with white outlines. Magnification: 63X; scale bar: 50 μM. (D) Quantitation of total volume fraction, the total volume of the imaged region that is occupied by aggregates (Materials and methods) within the imaged region for ΔvpsL LCD-locked, ΔvpsL HCD-locked, and ΔvpsL WT strains after 22 h of growth. Representative cross-sections through the ΔvpsL LCD-locked (E–H), ΔvpsL HCD-locked (I–L), and ΔvpsL WT (M–P) V. cholerae strains at 16, 19, 22, and 25 h. (E–P) Magnification: 10X; scale bar: 250 μm. (Q) Quantitation of aggregate volume fraction. The data for T = 22 h are the same as those shown in Figure 2D. Triangle: ΔvpsL LCD-locked, circle: ΔvpsL HCD-locked, and diamond: ΔvpsL WT. (R) Average cluster volume over time for the ΔvpsL HCD-locked (circle) and ΔvpsL WT (diamond) strains. (D,Q,R) Quantitation of mean ± standard deviation (SD; N=3 biological replicates). Mean and SD were calculated using the untransformed data, not the log-transformed data, which results in asymmetric error bars. All strains in all panels harbor the fluorescent mKO reporter constitutively expressed from the chromosome.
-
Figure 2—source data 1
Figure source data.
- https://doi.org/10.7554/eLife.42057.014
Figure 2—figure supplement 1
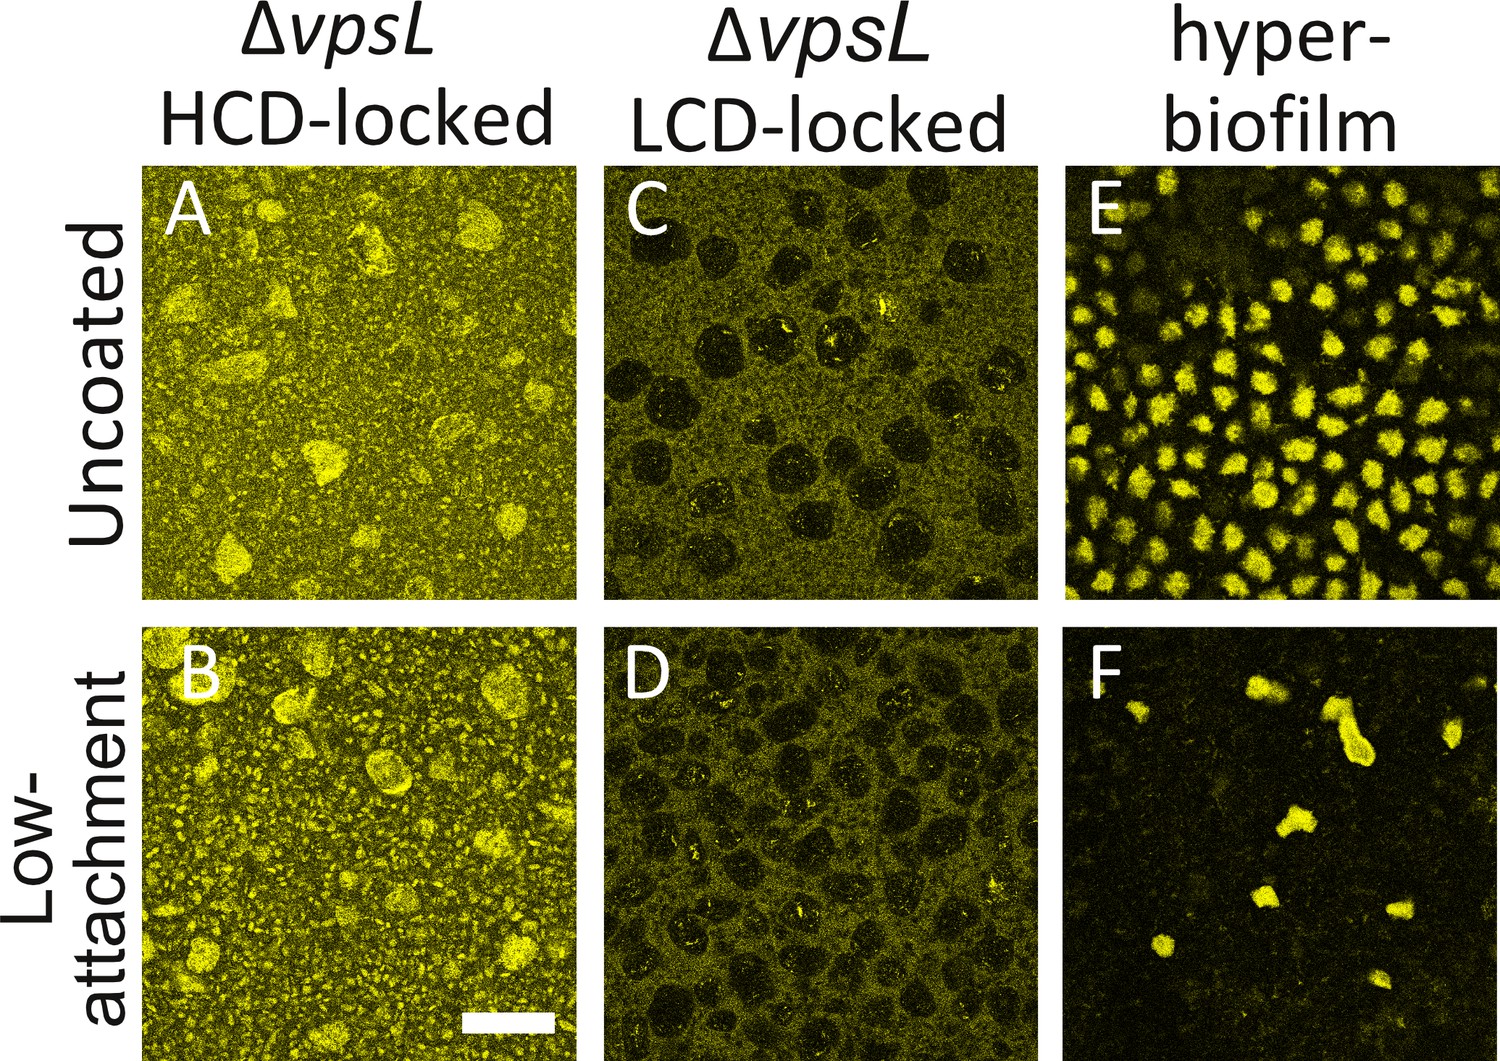
V. cholerae aggregates form in liquid.
Aggregate formation in 24-well uncoated plates (Uncoated) or in plates coated with a hydrogel layer that reduces cell attachment (Low-attachment). (A,B) ΔvpsL HCD QS-locked (HCD-locked), (C,D) ΔvpsL LCD QS-locked (LCD-locked), and (E,F) the vpvcW240R hyper biofilm former. (C,D) We note that ΔvpsL LCD-locked strains produce ‘voids’, which are regions containing few cells; we do not understand the underlying mechanism giving rise to these features. (A–D) Images taken of cells in liquid medium. (E,F) Images taken at the surface of the plate. (A–F) All strains harbor mKO constitutively expressed from the chromosome and are representative of 3 biological replicates. Magnification: 10X; scale bar: 250 μM.
Figure 2—figure supplement 2
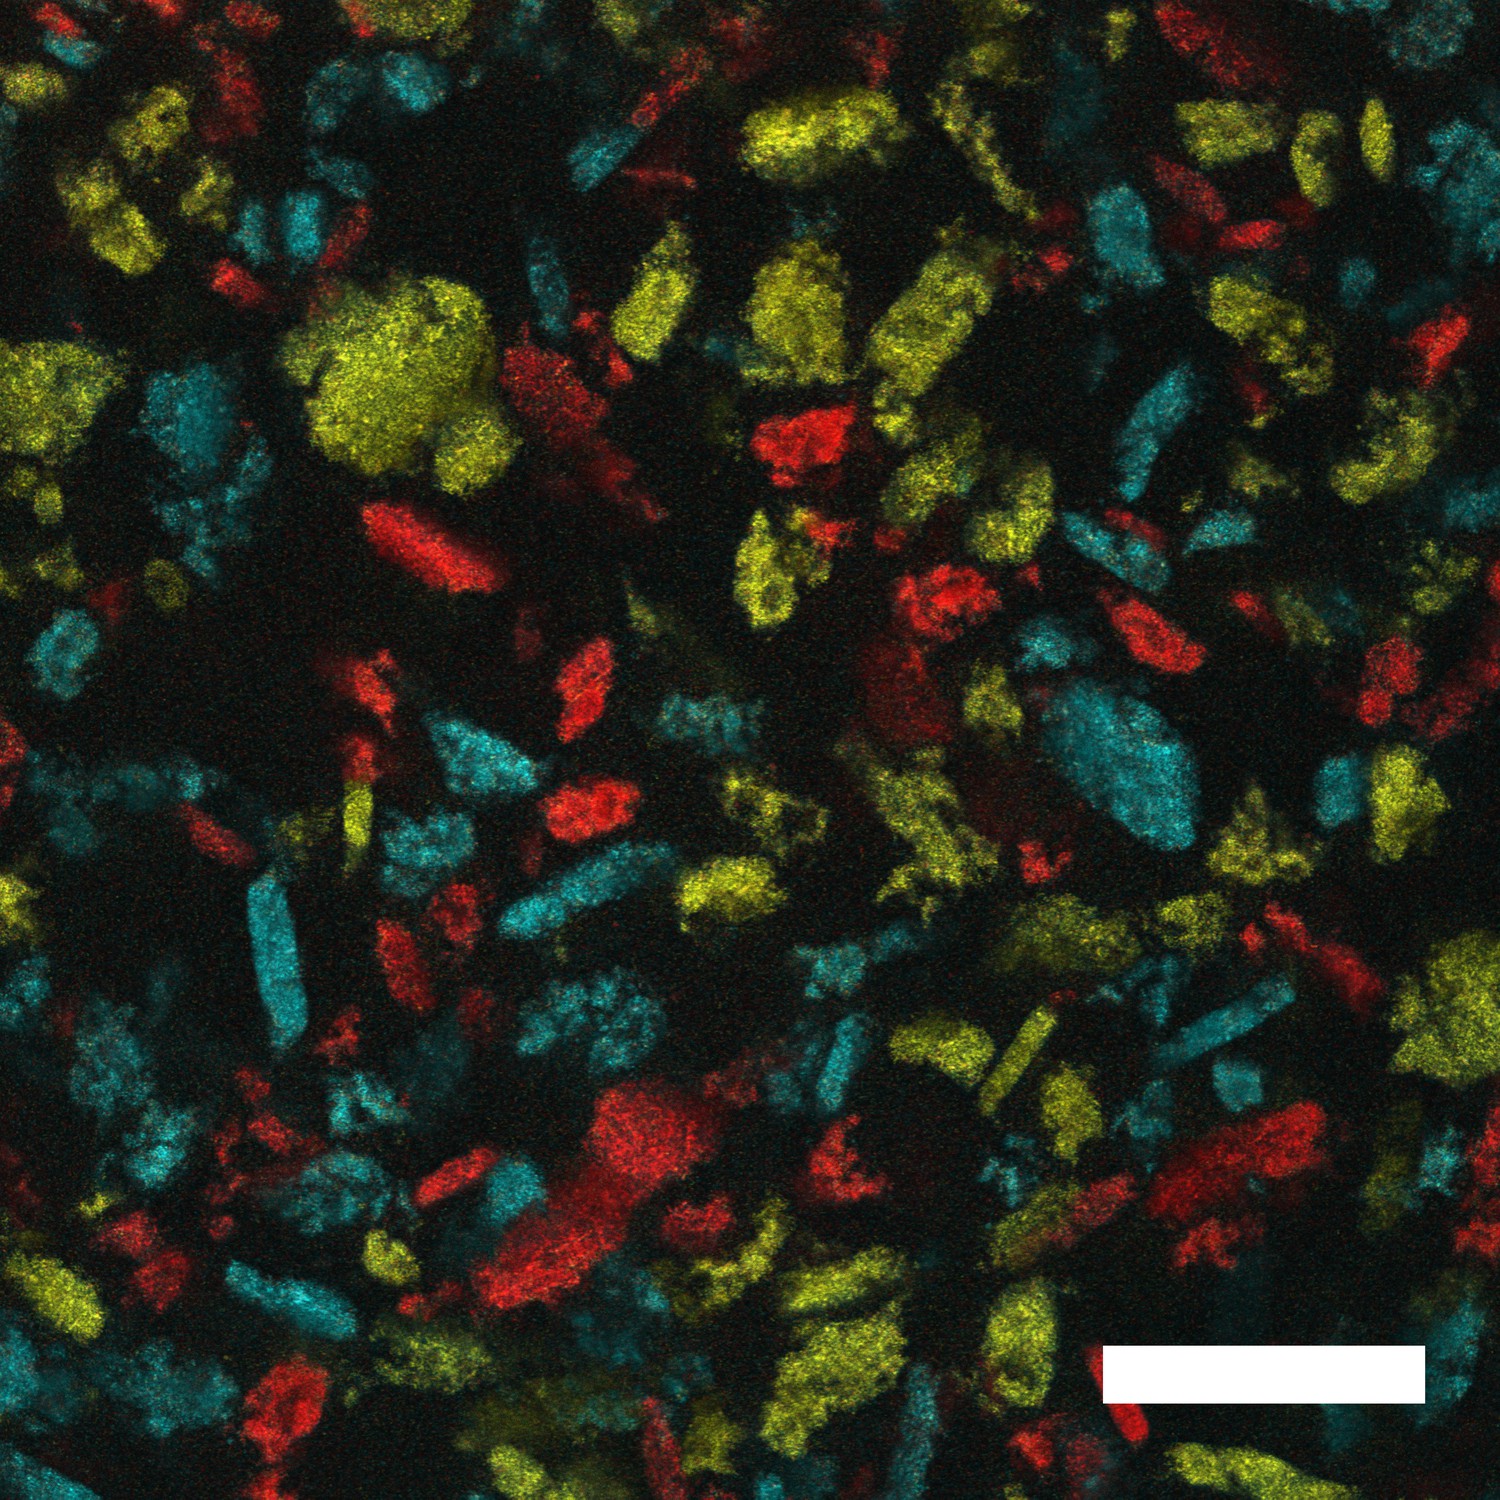
V. cholerae forms distinct aggregates.
Representative cross-section following 22 h of growth of aggregates formed in liquid by the ΔvpsL HCD-locked V. cholerae strain that constitutively expresses fluorescent mKO, mKate2, or mTFP1. Strains were independently grown for 22 h until aggregates formed. Aggregates from each culture were mixed for 60 s and then imaged. The cells carrying the different fluorescent reporters do not mix, but rather, form distinct aggregates. Magnification: 10X; scale bar: 250 μM.
Figure 2—figure supplement 3
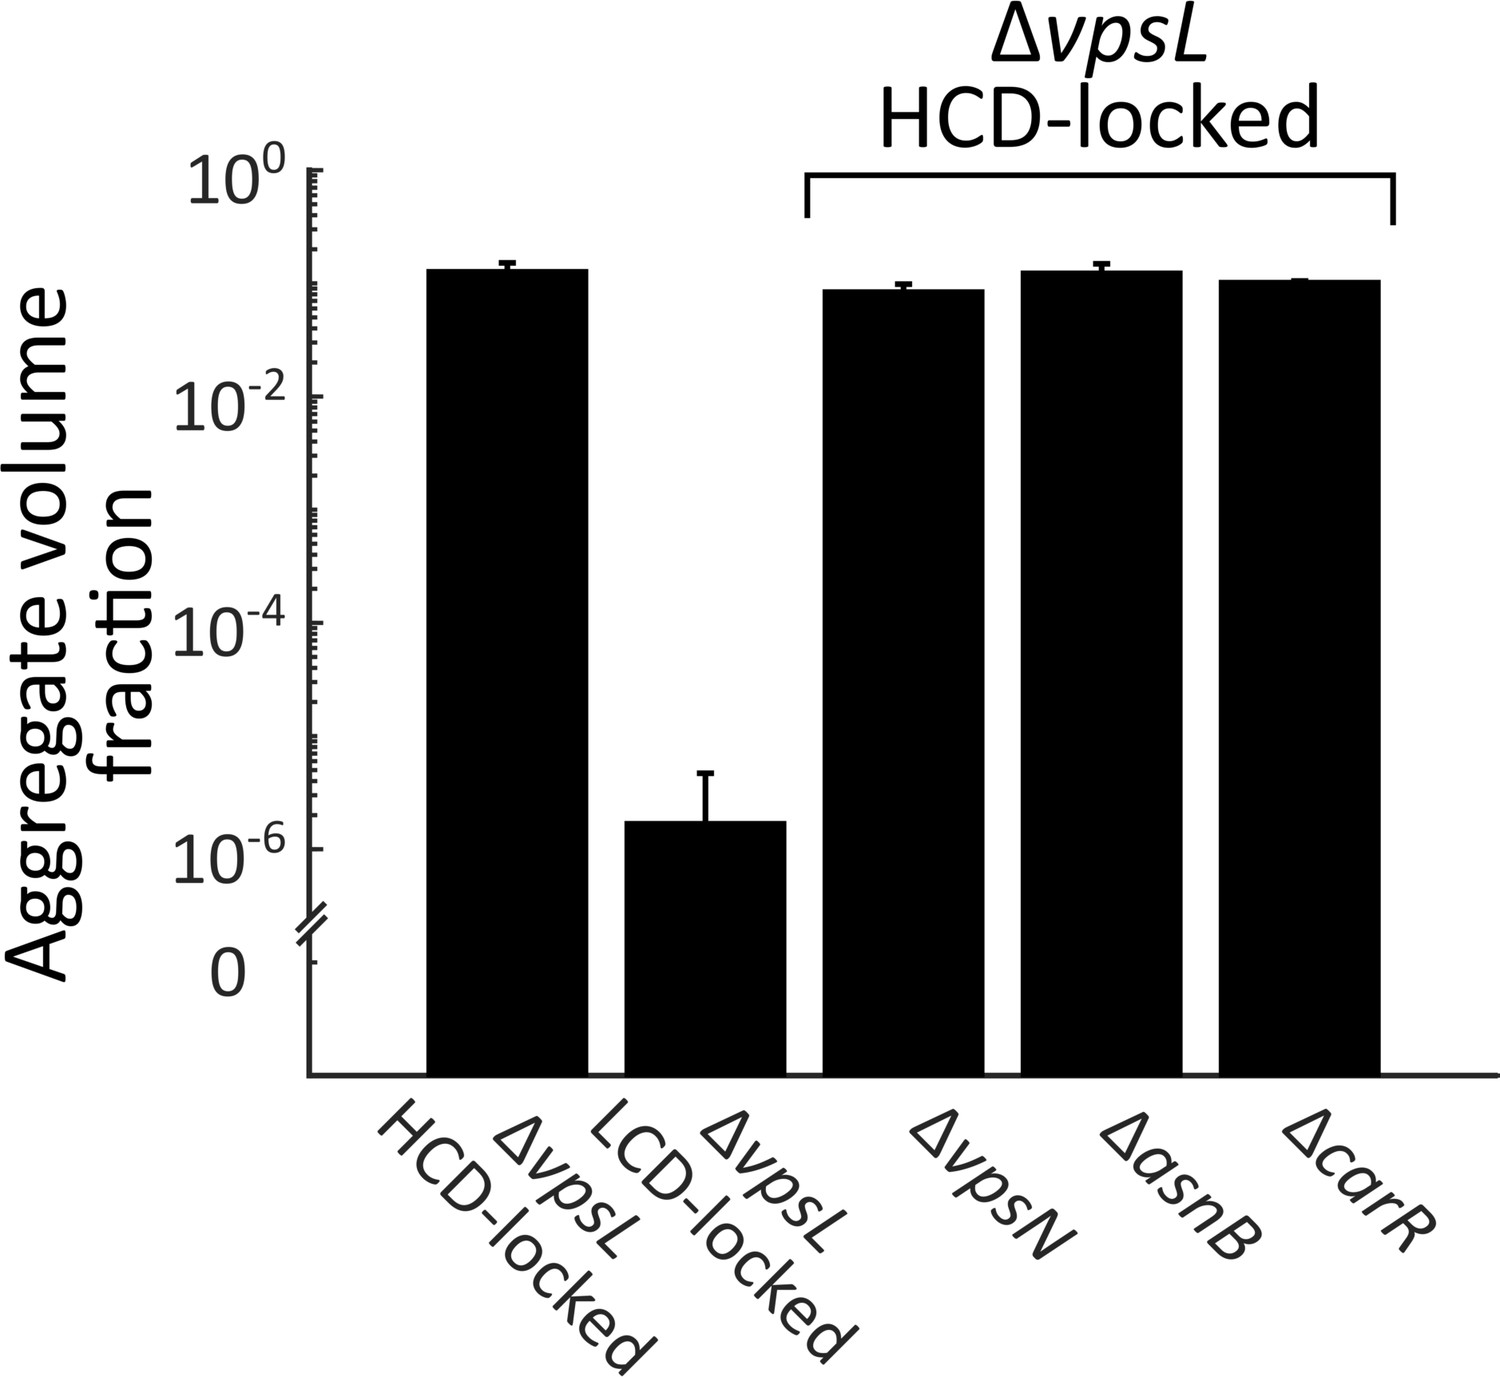
Known Ca2+-related genes do not contribute to V. cholerae aggregation.
Quantitation of aggregate formation following 22 h of growth of the ΔvpsL HCD QS-locked (HCD-locked), ΔvpsL LCD QS-locked (LCD-locked), ΔvpsL ΔvpsN HCD-locked, ΔvpsL ΔasnB HCD-locked, and ΔvpsL ΔcarR HCD-locked strains. Homologs of VpsN and AsnB (WbfF and WbfR, respectively) contribute to O-antigen and capsule synthesis, respectively, and therefore, respectively, promote and repress Ca2+-dependent biofilm formation in V. cholerae O139 strain MO10 (Kierek and Watnick, 2003a). CarR is the response regulator of the V. cholerae CarRS two-component system that responds to extracellular Ca2+ (Bilecen and Yildiz, 2009). Error bars are mean ± standard deviation, (N=3 biological replicates). All strains harbor mKO constitutively expressed from the chromosome.
-
Figure 2—figure supplement 3—source data 1
Figure source data.
- https://doi.org/10.7554/eLife.42057.007
Figure 2—figure supplement 4
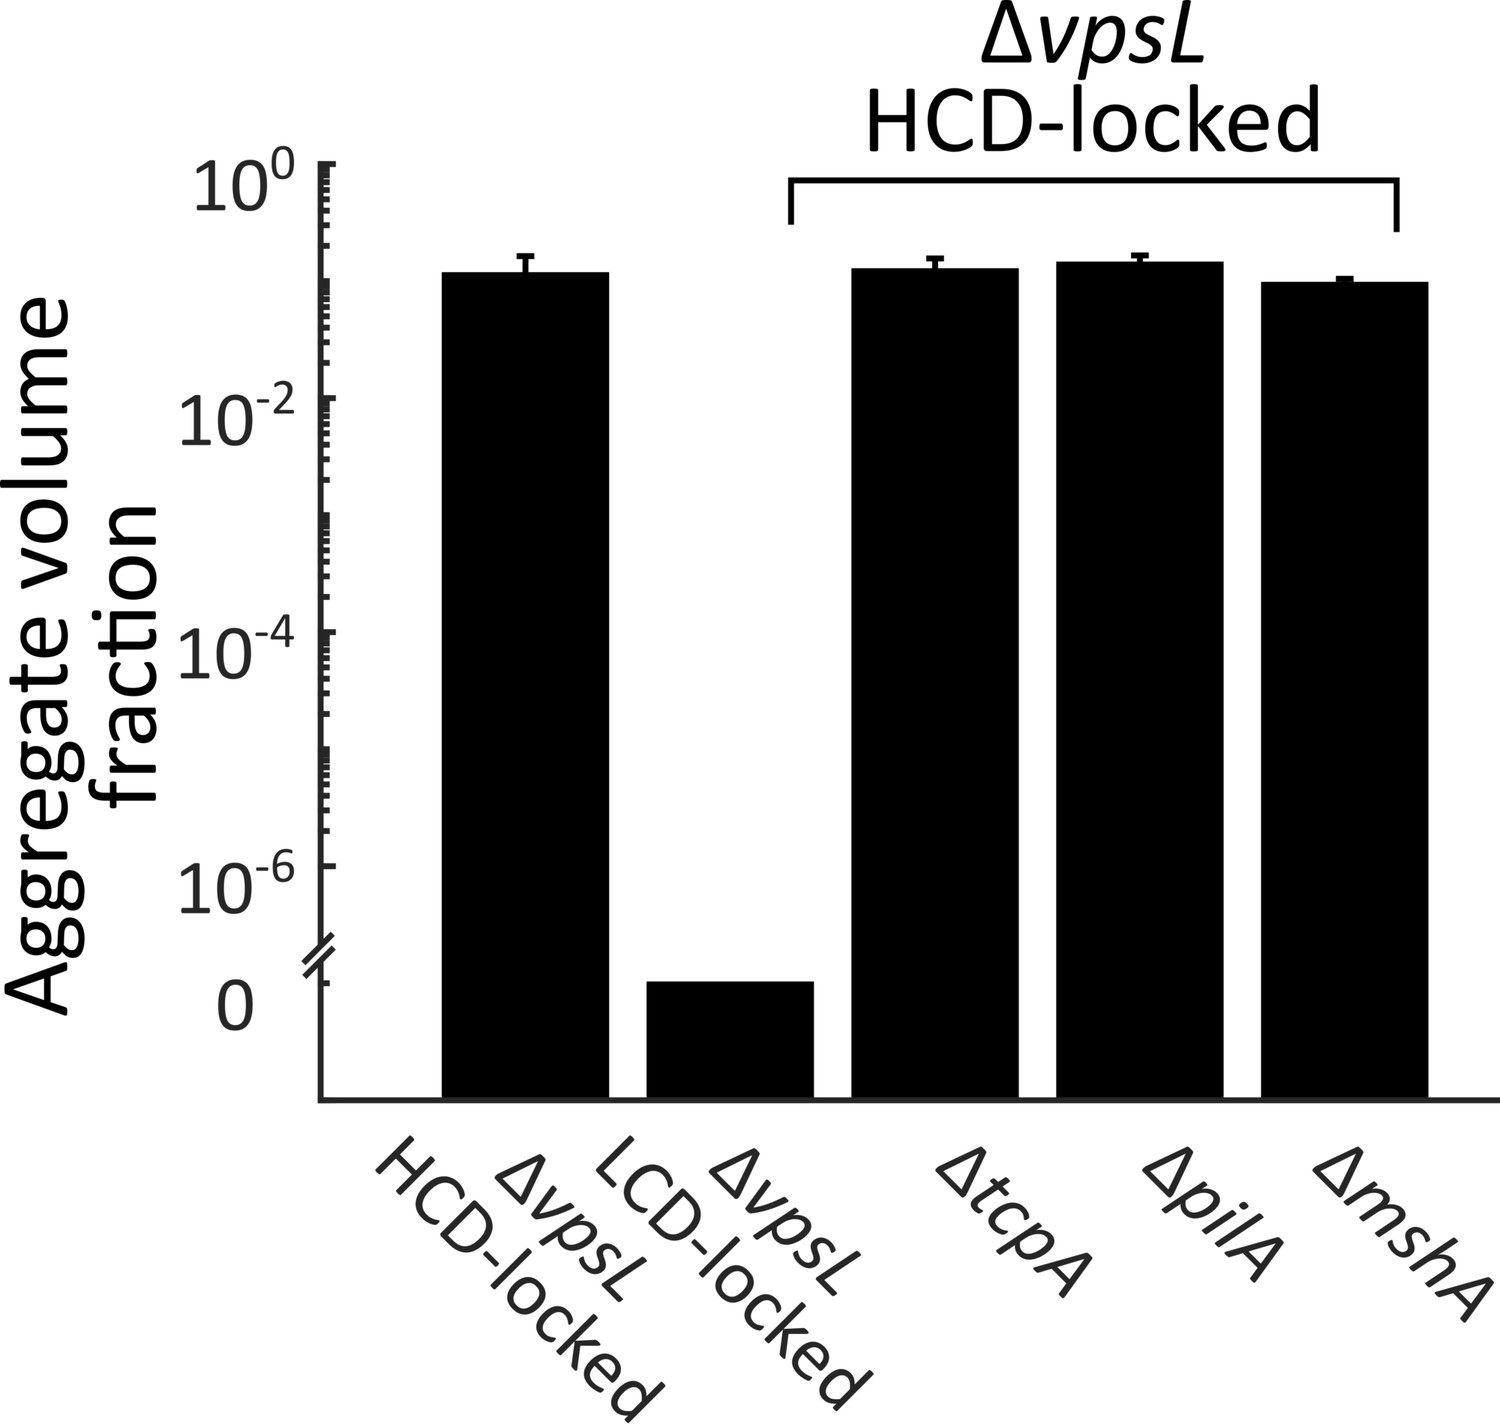
Known pili genes do not contribute to V. cholerae aggregation.
Quantitation of total aggregate volume fraction following 22 h of growth of the ΔvpsL HCD QS-locked (HCD-locked), ΔvpsL LCD QS-locked (LCD-locked), ΔvpsL ΔtcpA HCD-locked, ΔvpsL ΔpilA HCD-locked, and ΔvpsL ΔmshA HCD-locked V. cholerae strains. tcpA, pilA, and mshA, respectively, encode structural components of the toxin co-regulated pilus (TCP), the chitin-regulated pilus (ChiRP), and the mannose-sensitive haemagglutinin pilus (MSHA) . Error bars are mean ± standard deviation (N=3 biological replicates). All strains harbor mKO constitutively expressed from the chromosome.
-
Figure 2—figure supplement 4—source data 1
Figure source data.
- https://doi.org/10.7554/eLife.42057.009
Figure 2—figure supplement 5
WT and ΔvpsL strains display similar aggregation kinetics.
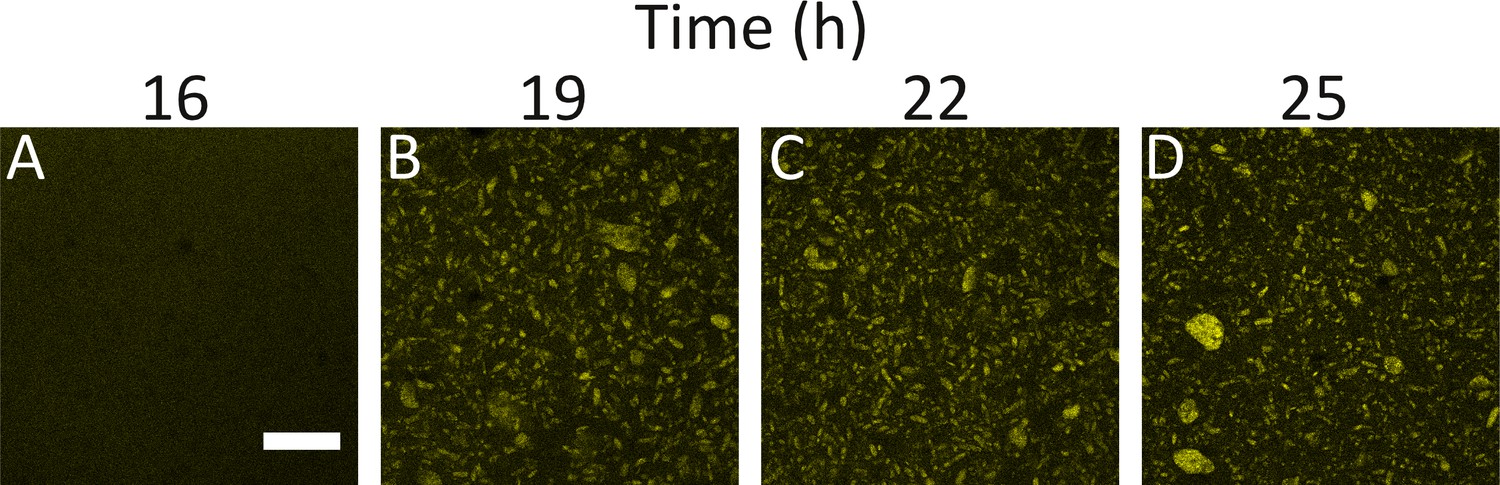
Aggregate formation in WT V. cholerae at 16, 19, 22, and 25 h (A-D). Images are representative cross-sections of 3 biological replicates. Magnification: 10X; scale bar: 250 μm. Strain harbors mKO constitutively expressed from the chromosome.
Figure 2—figure supplement 6
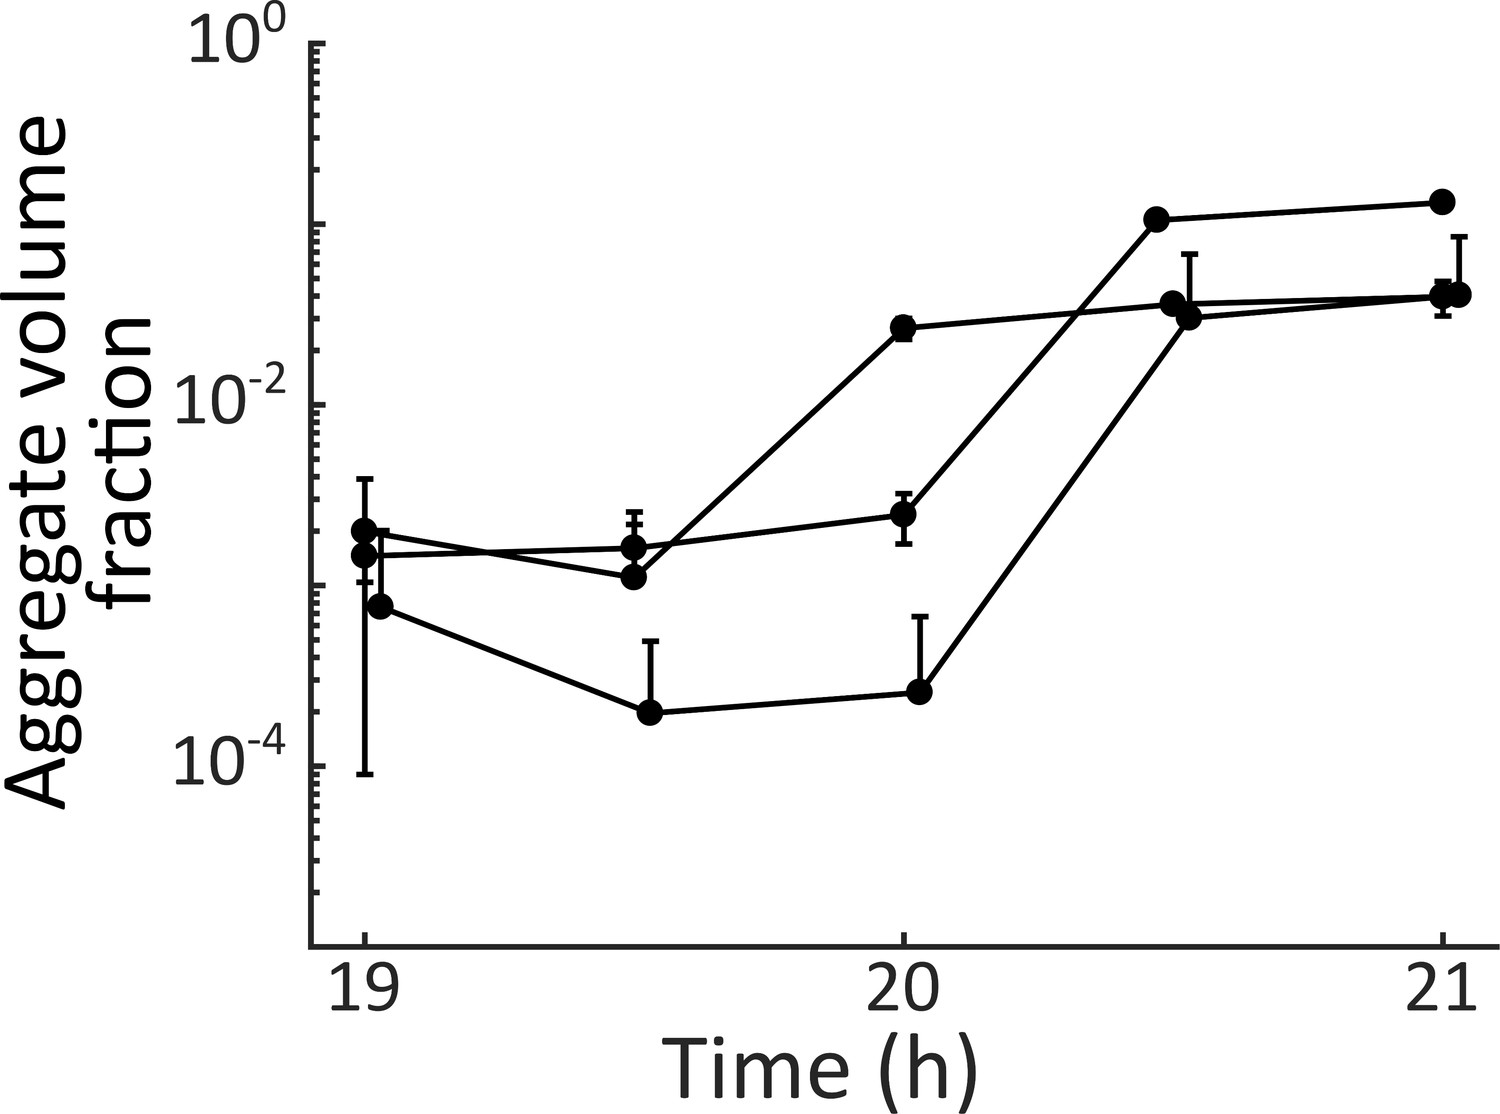
V. cholerae aggregate formation is rapid.
Quantitation of total aggregate volume fraction in a ΔvpsL HCD-locked V. cholerae strain harboring mKO constitutively expressed from the chromosome. Three biological replicates were sampled every 30 min from 19 h to 21 h. Error bars are mean ± standard deviation (N=2–3 technical replicates).
-
Figure 2—figure supplement 6—source data 1
Figure source data.
- https://doi.org/10.7554/eLife.42057.012
Figure 2—figure supplement 7
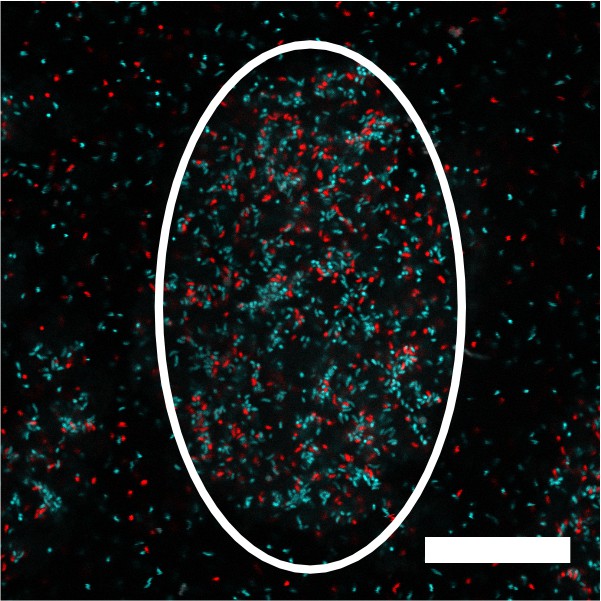
V. cholerae aggregate formation is non-clonal.
Image of a representative cross-section through a V. cholerae aggregate following 22 h of growth. The white outline shows the approximate extent of the aggregate. The culture was inoculated at T = 0 h with a roughly equal mixture of the ΔvpsL HCD-locked strain constitutively expressing either mTFP1 or mKate2 from the chromosome. Magnification: 63X,; scale bar: 25 μM.
Figure 3 with 4 supplements
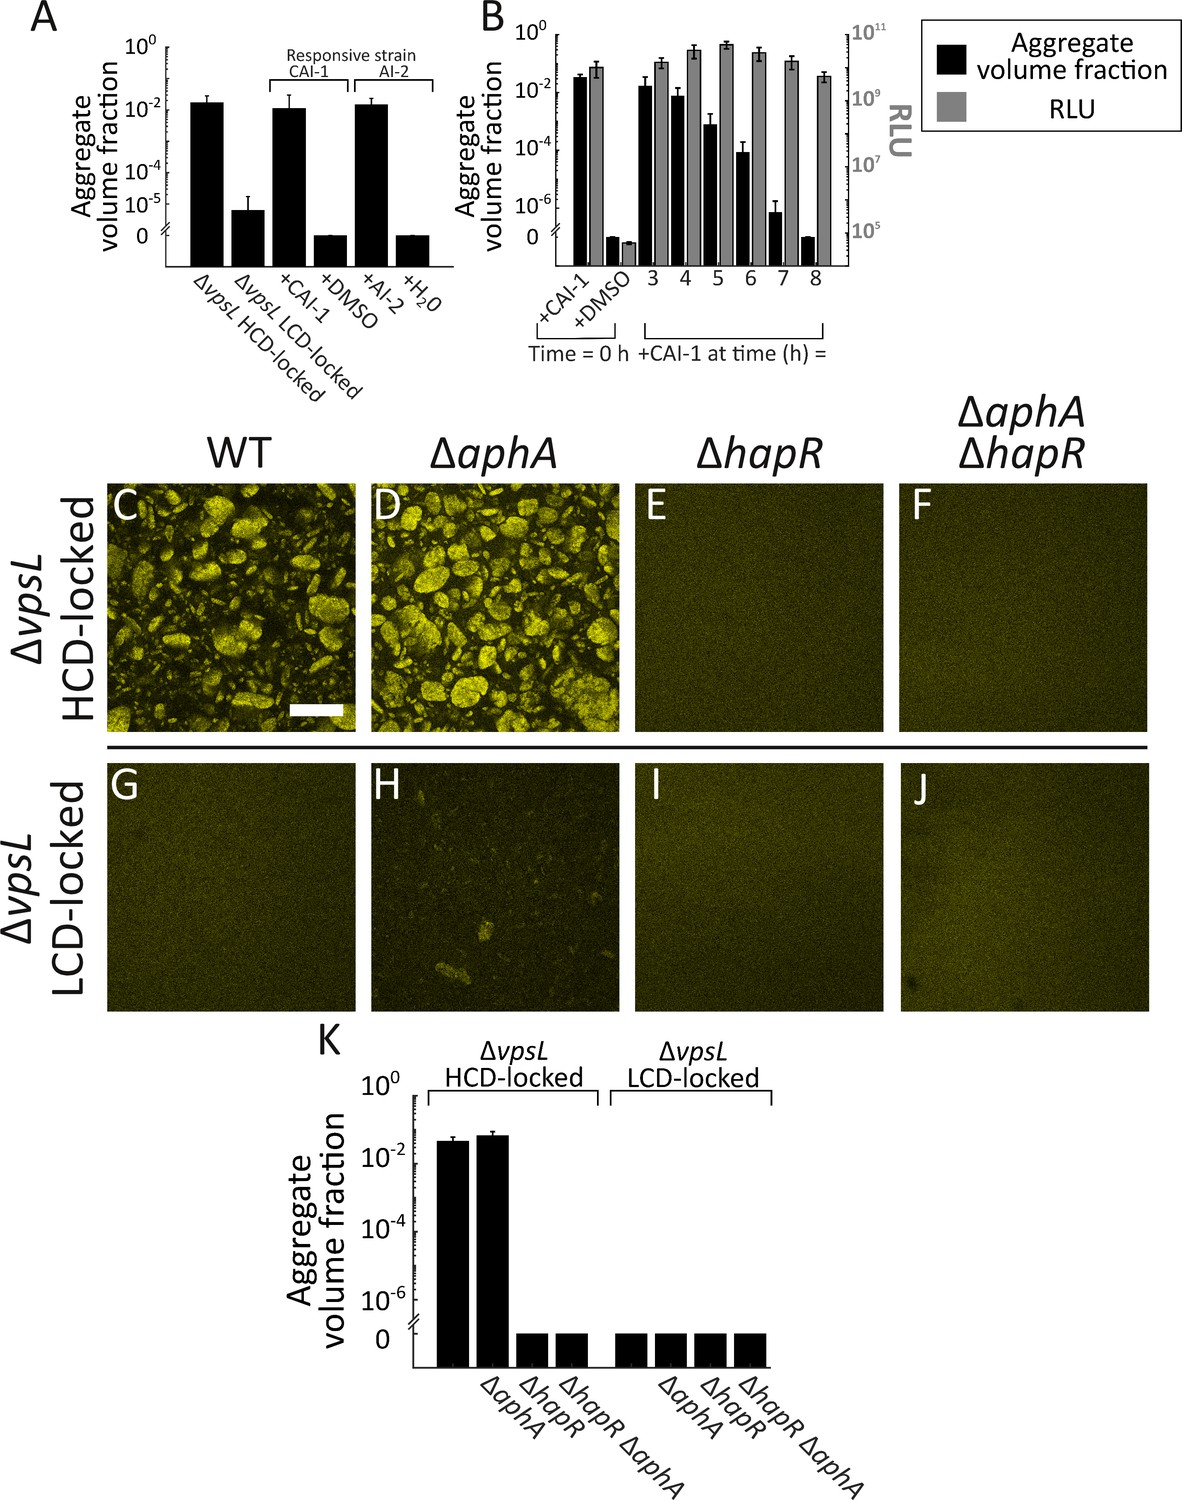
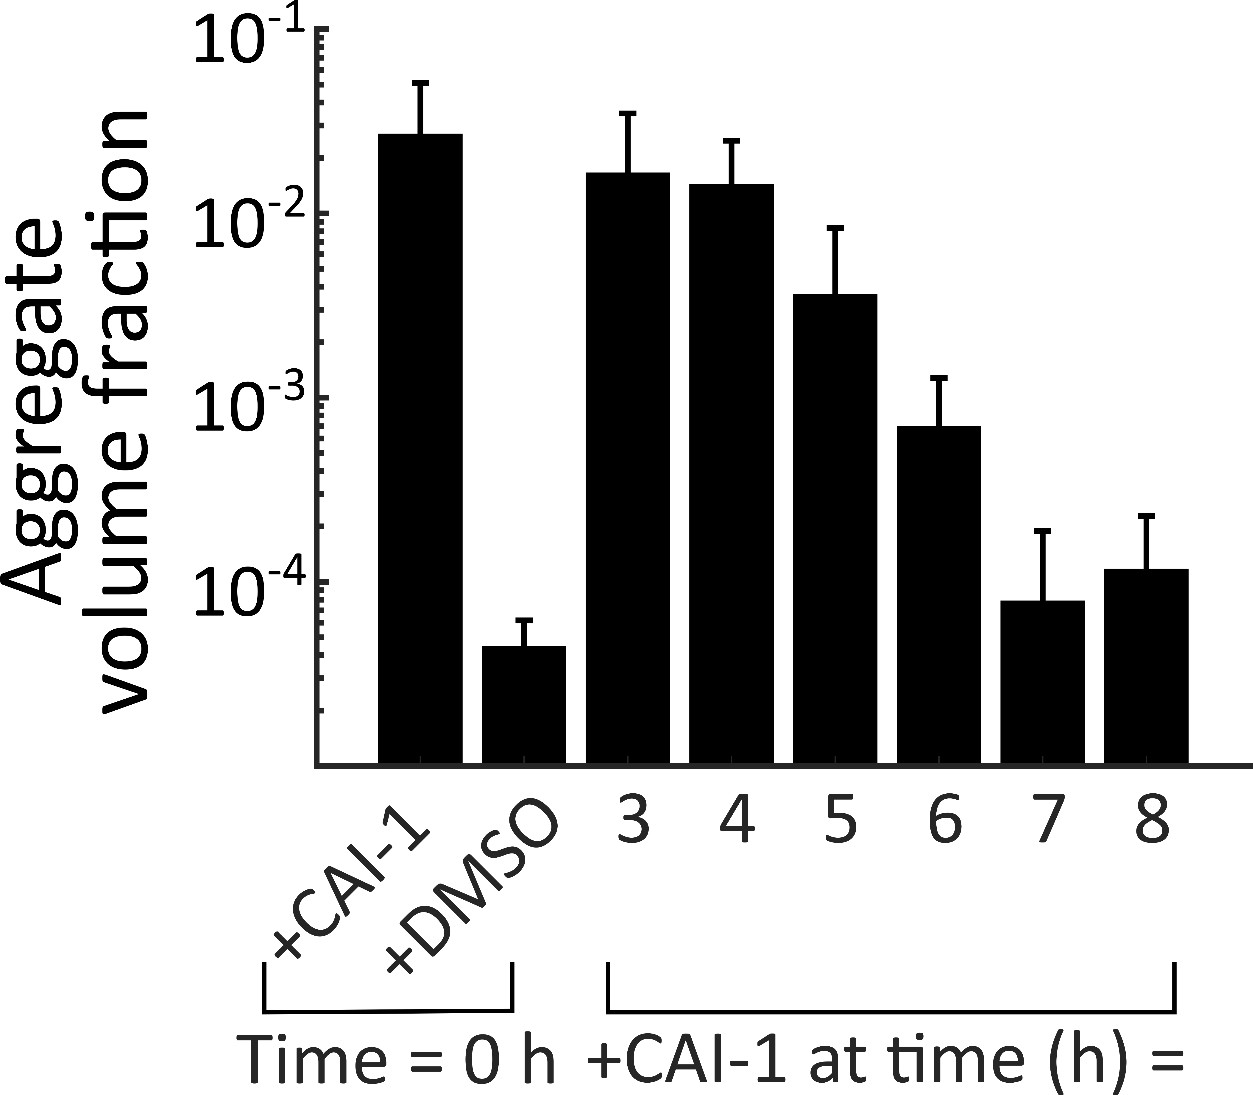
Exogenous autoinducers drive V. cholerae aggregation and HapR is required.
Quantitation of aggregate volume fraction at 22 h for the ΔvpsL HCD QS-locked (HCD-locked), ΔvpsL LCD QS-locked (LCD-locked), CAI-1-responsive (± CAI-1), and AI-2-responsive (± AI-2 and boric acid) V. cholerae strains (A). Autoinducers or solvent controls were added at the time of inoculation. Concentrations used: CAI-1: 5 μM, AI-2: 1 μM, and boric acid: 100 μM. (B) Quantitation of aggregate volume fraction (black bars) and bioluminescence (gray bars) at 22 h for the CAI-1-responsive strain to which CAI-1 was added at T = 0 h and from 3 to 8 h at 1 h intervals. Also shown is bioluminescence quantified in a CAI-1-responsive strain harboring the cosmid pBB1 which carries the luxCDABE genes. RLU denotes relative lights units, defined as counts/min mL−1 per OD600. In A and B aggregate volume fraction was quantified in a strain harboring mKO constitutively expressed from the chromosome; quantitation of mean ± standard deviation (SD) (N=3 biological replicates). Representative cross-sections of the ΔvpsL HCD-locked (C), ΔvpsL ΔaphA HCD-locked (D), ΔvpsL ΔhapR HCD-locked (E), ΔvpsL ΔaphA ΔhapR HCD-locked (F), ΔvpsL LCD-locked (G), ΔvpsL ΔaphA LCD-locked (H), ΔvpsL ΔhapR LCD-locked (I), and ΔvpsL ΔaphA ΔhapR LCD-locked (J) V. cholerae strains following 22 h of growth. (C–J) Magnification: 10X; scale bar: 250 μm. All strains harbor mKO constitutively expressed from the chromosome. (K) Quantitation of aggregate volume fraction for samples in C–J. Shown are mean ± SD (N=3 biological replicates). The ΔvpsL ΔaphA LCD-locked strain appears to exhibit modest aggregation (H), possibly due to AphA repression of hapR transcription (Rutherford et al., 2011), but the level of aggregation is below the detection threshold employed in the segmenting analysis (K).
-
Figure 3—source data 1
Figure source data.
- https://doi.org/10.7554/eLife.42057.025
Figure 3—figure supplement 1
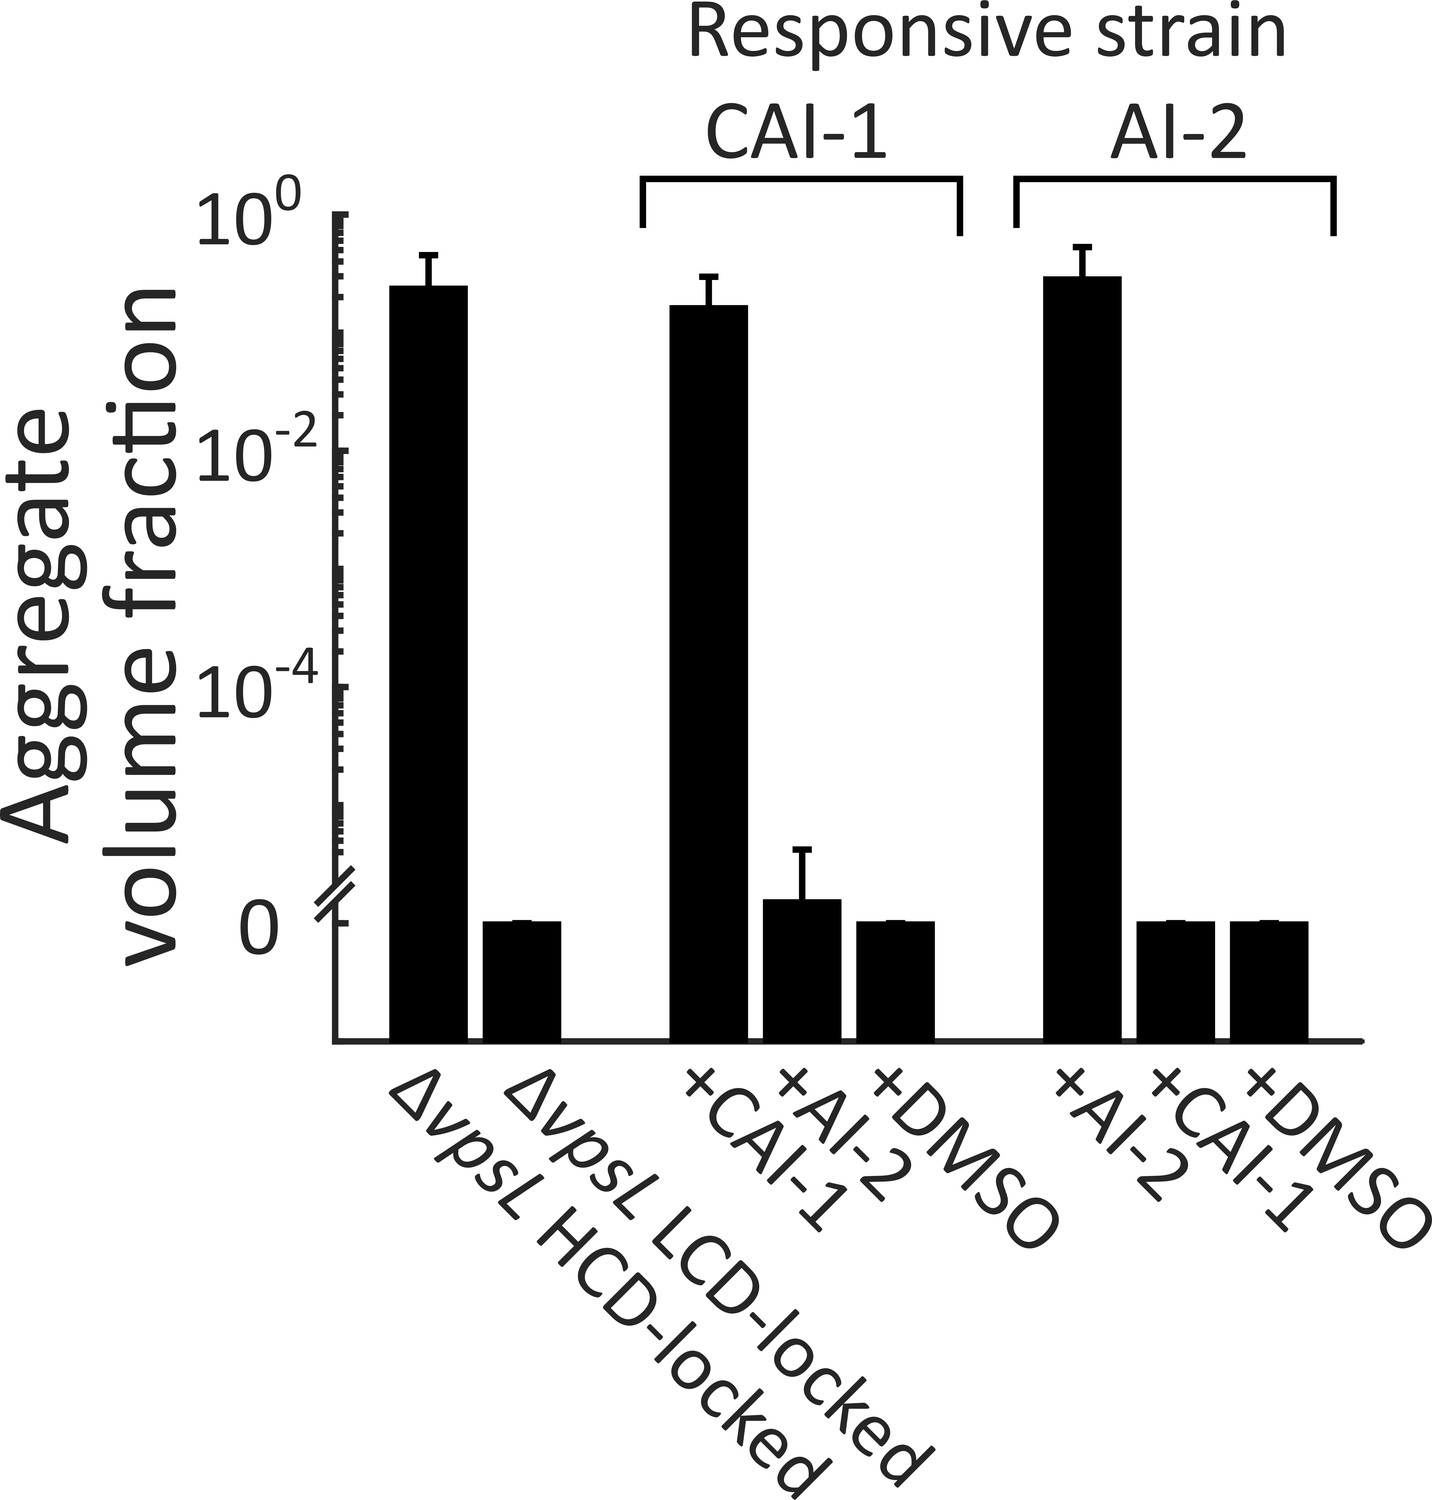
Autoinducer supplementation drives V. cholerae aggregation via the cognate QS receptor.
Quantitation of aggregate volume fraction at 22 h following inoculation of ΔvpsL HCD QS-locked (HCD-locked), ΔvpsL LCD QS-locked (LCD-locked), CAI-1-responsive, and AI-2-responsive strains. Nothing was added to the parent control strains and CAI-1 (5 μM), AI-2 (1 μM, and 100 μM boric acid), or DMSO solvent was added at T = 0 h to both the CAI-1-responsive and AI-2-responsive strains. All strains harbor mKO constitutively expressed from the chromosome. All error bars are mean ± standard deviation (N=3 biological replicates).
-
Figure 3—figure supplement 1—source data 1
Figure source data.
- https://doi.org/10.7554/eLife.42057.018
Figure 3—figure supplement 2
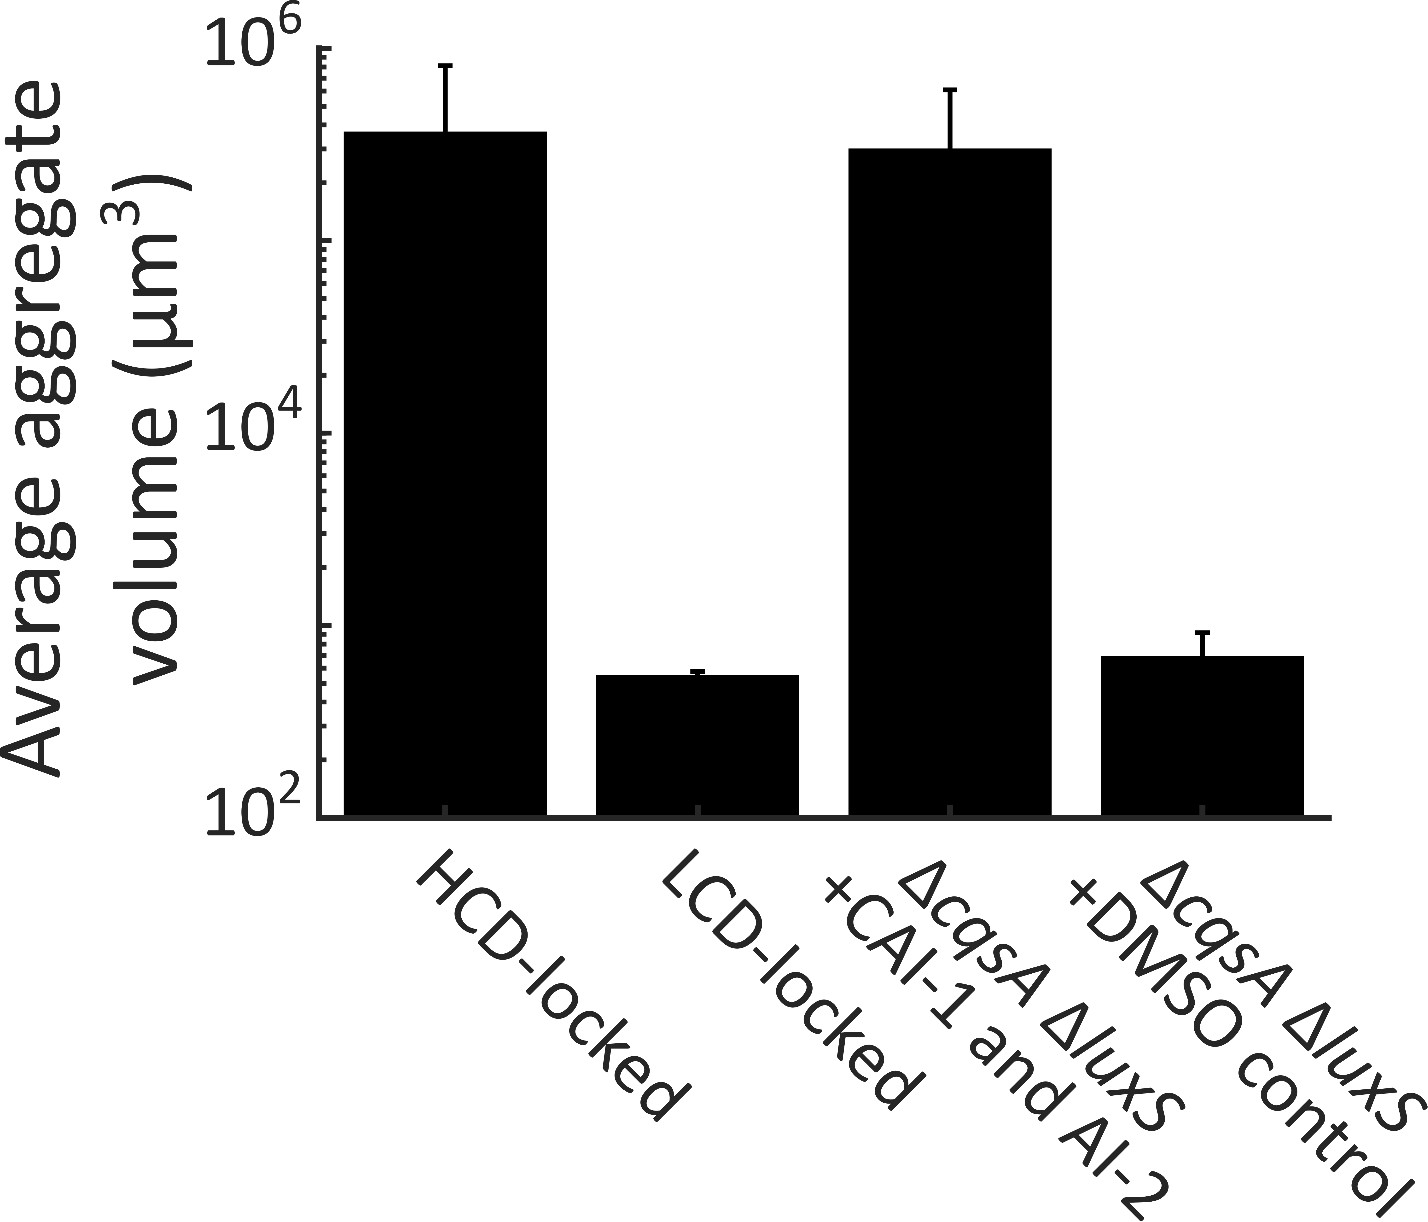
Autoinducer supplementation drives V. cholerae aggregation in the presence of vpsL, cqsR, and vpsS.
Quantitation of aggregate size distribution for HCD QS-locked (HCD-locked), LCD QS-locked (LCD-locked), and ΔcqsA ΔluxS V. cholerae strains supplemented with both CAI-1 (5 μM) and AI-2 (1 μM and 100 μM boric acid), or DMSO, as designated. All strains have the vpsL, vpsS, and cqsR genes present. LCD-locked and ΔcqsA ΔluxS (without autoinducers) strains were quantified with a 63X water immersion objective, while HCD-locked and ΔcqsA ΔluxS (with autoinducers) strains were quantified with a 10X air objective. All strains harbor mKO constitutively expressed from the chromosome. All error bars are mean ± standard deviation (N=3 biological replicates).
-
Figure 3—figure supplement 2—source data 1
Figure source data.
- https://doi.org/10.7554/eLife.42057.020
Figure 3—figure supplement 3
Late-time autoinducer supplementation does not delay the onset of aggregation.
Quantitation of aggregate volume fraction at 46 h (samples are the same as in main text Figure 3B, grown for an additional 24 h) of the CAI-1-responsive strain to which CAI-1 was added at T = 0 h and from 3 to 8 h at 1 h intervals. The strain harbors mKO constitutively expressed from the chromosome. All error bars are mean ± standard deviation (N=3 biological replicates).
-
Figure 3—figure supplement 3—source data 1
Figure source data.
- https://doi.org/10.7554/eLife.42057.022
Figure 3—figure supplement 4
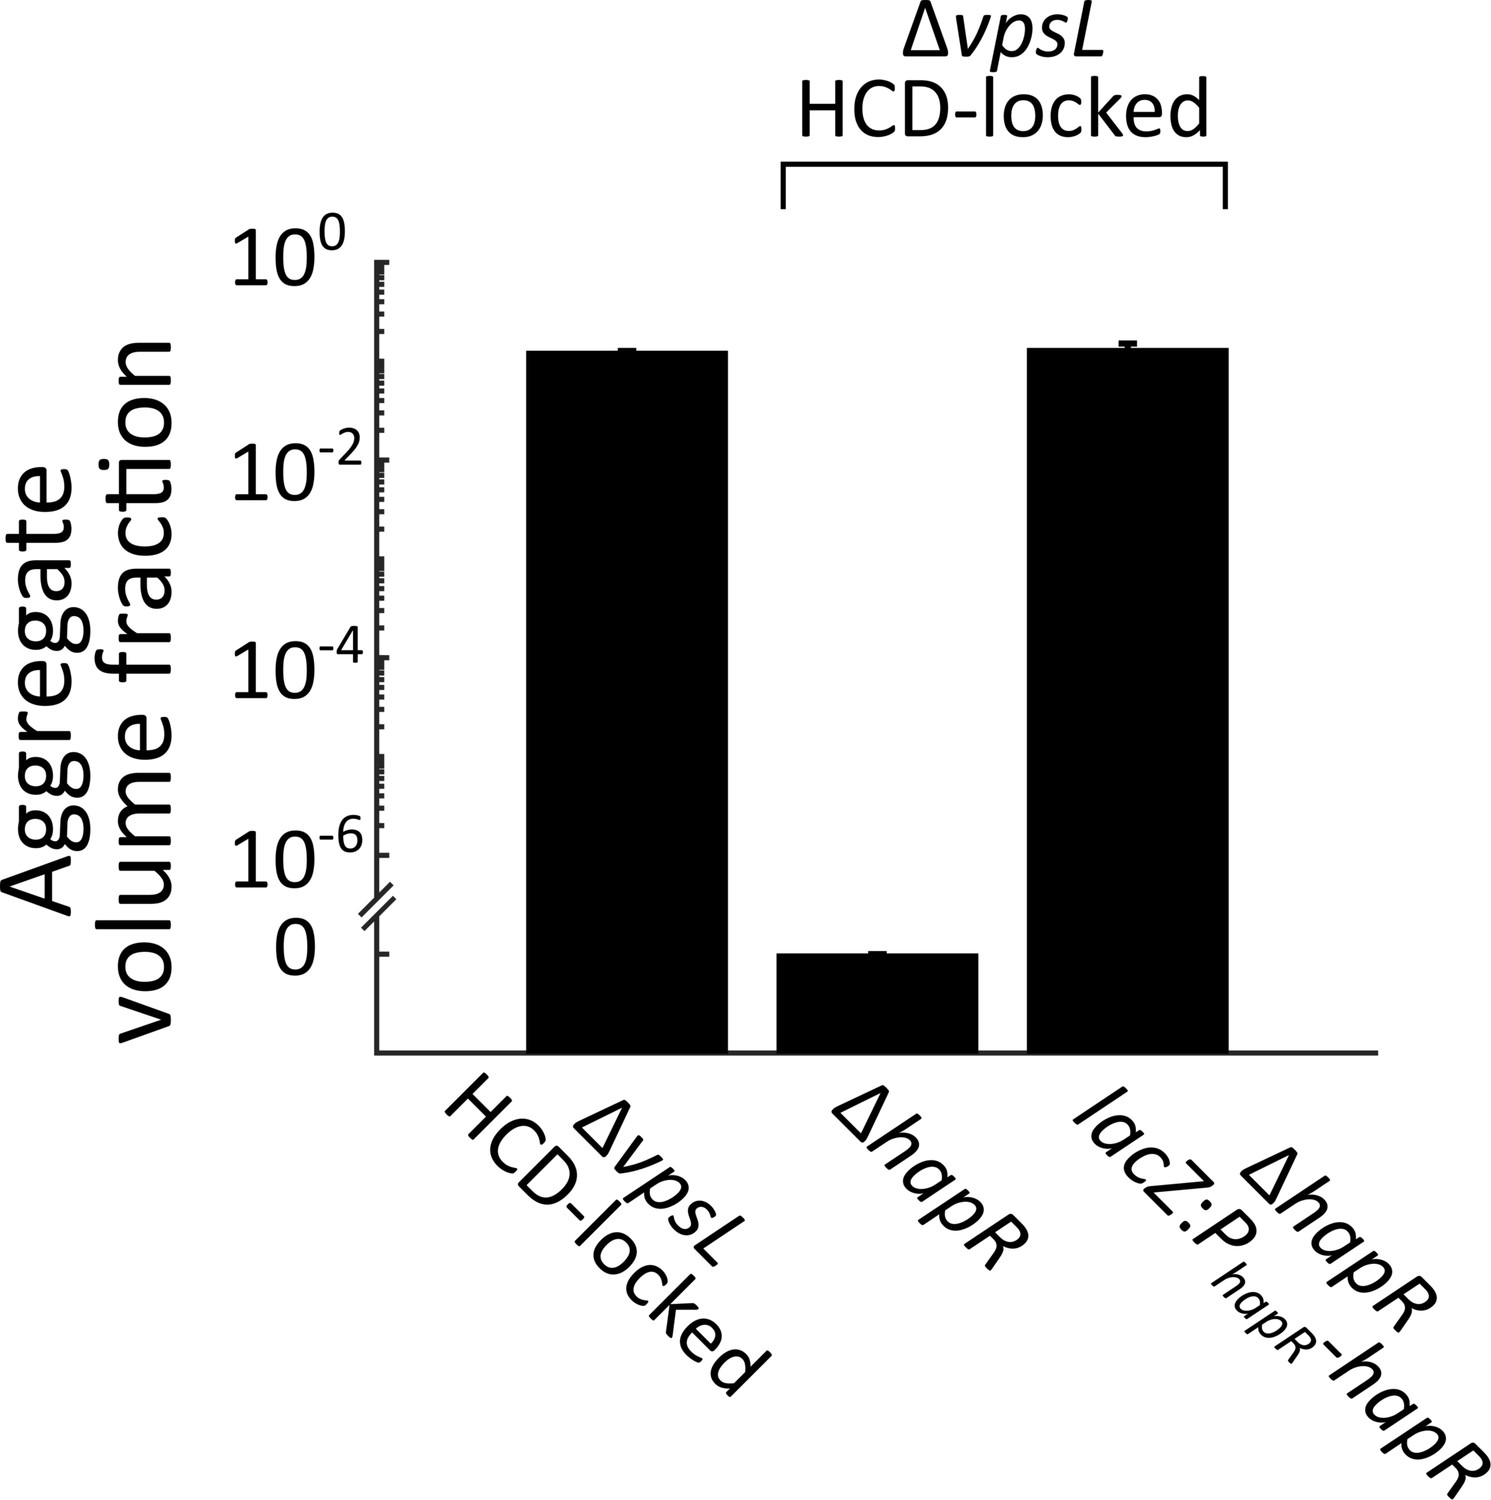
Complementation of hapR in aggregate formation.
Quantitation of aggregate volume fraction at 22 h for ΔvpsL HCD-locked, ΔvpsL ΔhapR HCD-locked, ΔvpsL ΔhapR lacZ:PhapR-hapR HCD-locked strains. All error bars are mean ± standard deviation (N=3 biological replicates).
-
Figure 3—figure supplement 4—source data 1
Figure source data.
- https://doi.org/10.7554/eLife.42057.024
Figure 4 with 3 supplements
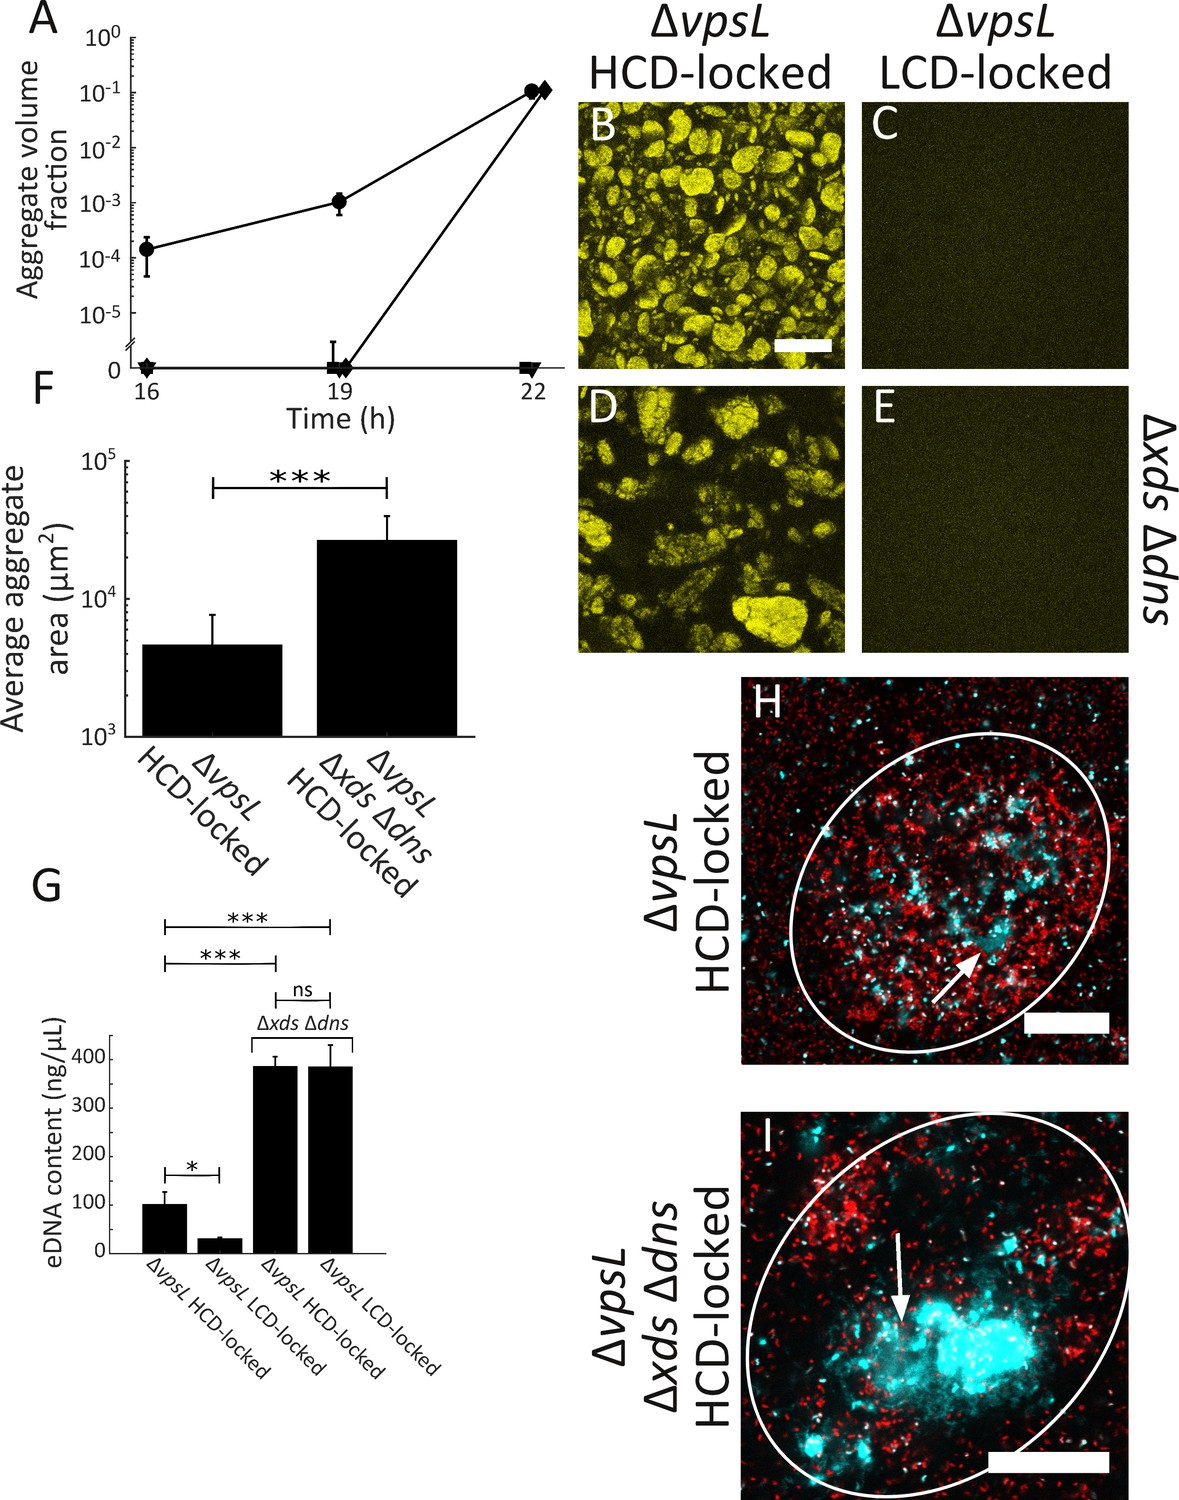
Extracellular DNA contributes to V. cholerae aggregation.
(A) Quantitation of aggregate volume fraction over time. Circle: ΔvpsL HCD QS-locked (HCD-locked), triangle: ΔvpsL LCD QS-locked (LCD-locked), diamond: ΔvpsL Δxds Δdns HCD-locked, and square: ΔvpsL Δxds Δdns LCD-locked. Representative cross-sections of the ΔvpsL HCD-locked (B), ΔvpsL LCD-locked (C), ΔvpsL Δxds Δdns HCD-locked (D), ΔvpsL Δxds Δdns LCD-locked (E) V. cholerae strains following 22 h of growth. Magnification: 10X; scale bar: 250 μm. (F) Average aggregate cross-sectional area at T = 22 h for the ΔvpsL HCD-locked and ΔvpsL Δxds Δdns HCD-locked strains. Statistical significance was determined with a two-sample Kolmogorov–Smirnov test on pooled data (***= p<0.0005). (A–F) All strains harbor mKO constitutively expressed from the chromosome. (G) Quantitation of total bulk eDNA content in ΔvpsL HCD-locked, ΔvpsL LCD-locked, ΔvpsL Δxds Δdns HCD-locked, and ΔvpsL Δxds Δdns LCD-locked strains following 22 h of growth. Statistical significance was determined with a two-sample t-test (*= p<0.05, ***= p<0.0005, ns = not significant). (H) Cross-section through a representative culture of the ΔvpsL HCD-locked strain (red) to which the eDNA stain TOTO-1 (cyan) was added following 22 h of growth. (I) Cross-section through a representative culture of the ΔvpsL Δxds Δdns HCD-locked strain (red) to which the eDNA stain TOTO-1 (cyan) was added following 22 h of growth. In (H,I), white arrows indicate regions of eDNA. Strains harbor mKate2 constitutively expressed from the chromosome. Magnification: 63X; scale bar: 25 μm. Samples are representative of 3 biological replicates. (A,F,G) Quantitation of mean ± standard deviation (N=3 biological replicates).
-
Figure 4—source data 1
Figure source data.
- https://doi.org/10.7554/eLife.42057.033
Figure 4—figure supplement 1

V. cholerae aggregate size is controlled by both Xds and Dns.
(A) Quantitation of aggregate volume fraction at 22 h following inoculation of ΔvpsL HCD QS-locked (HCD-locked), ΔvpsL LCD QS-locked (LCD-locked), ΔvpsL Δxds Δdns HCD-locked, ΔvpsL Δdns HCD-locked, ΔvpsL Δxds HCD-locked, ΔvpsL Δxds Δdns LCD-locked, ΔvpsL Δdns LCD-locked, and ΔvpsL Δxds LCD-locked strains. (B) Quantitation of average aggregate cross-sectional area in ΔvpsL HCD-locked, ΔvpsL Δxds Δdns HCD-locked, ΔvpsL Δdns HCD-locked, and ΔvpsL Δxds HCD-locked strains at 22 h. p<0.005 for comparison of pooled data from all conditions, as determined by a two-sample Kolmogorov–Smirnov test. In both panels, error bars are mean ± standard deviation (N=3 biological replicates). All strains harbor mKO constitutively expressed from the chromosome. Estimates of average aggregate size in the ΔvpsL Δxds Δdns HCD-locked strain are a lower bound that is the consequence of imaging a limited field of view.
-
Figure 4—figure supplement 1—source data 1
Figure source data.
- https://doi.org/10.7554/eLife.42057.028
Figure 4—figure supplement 2
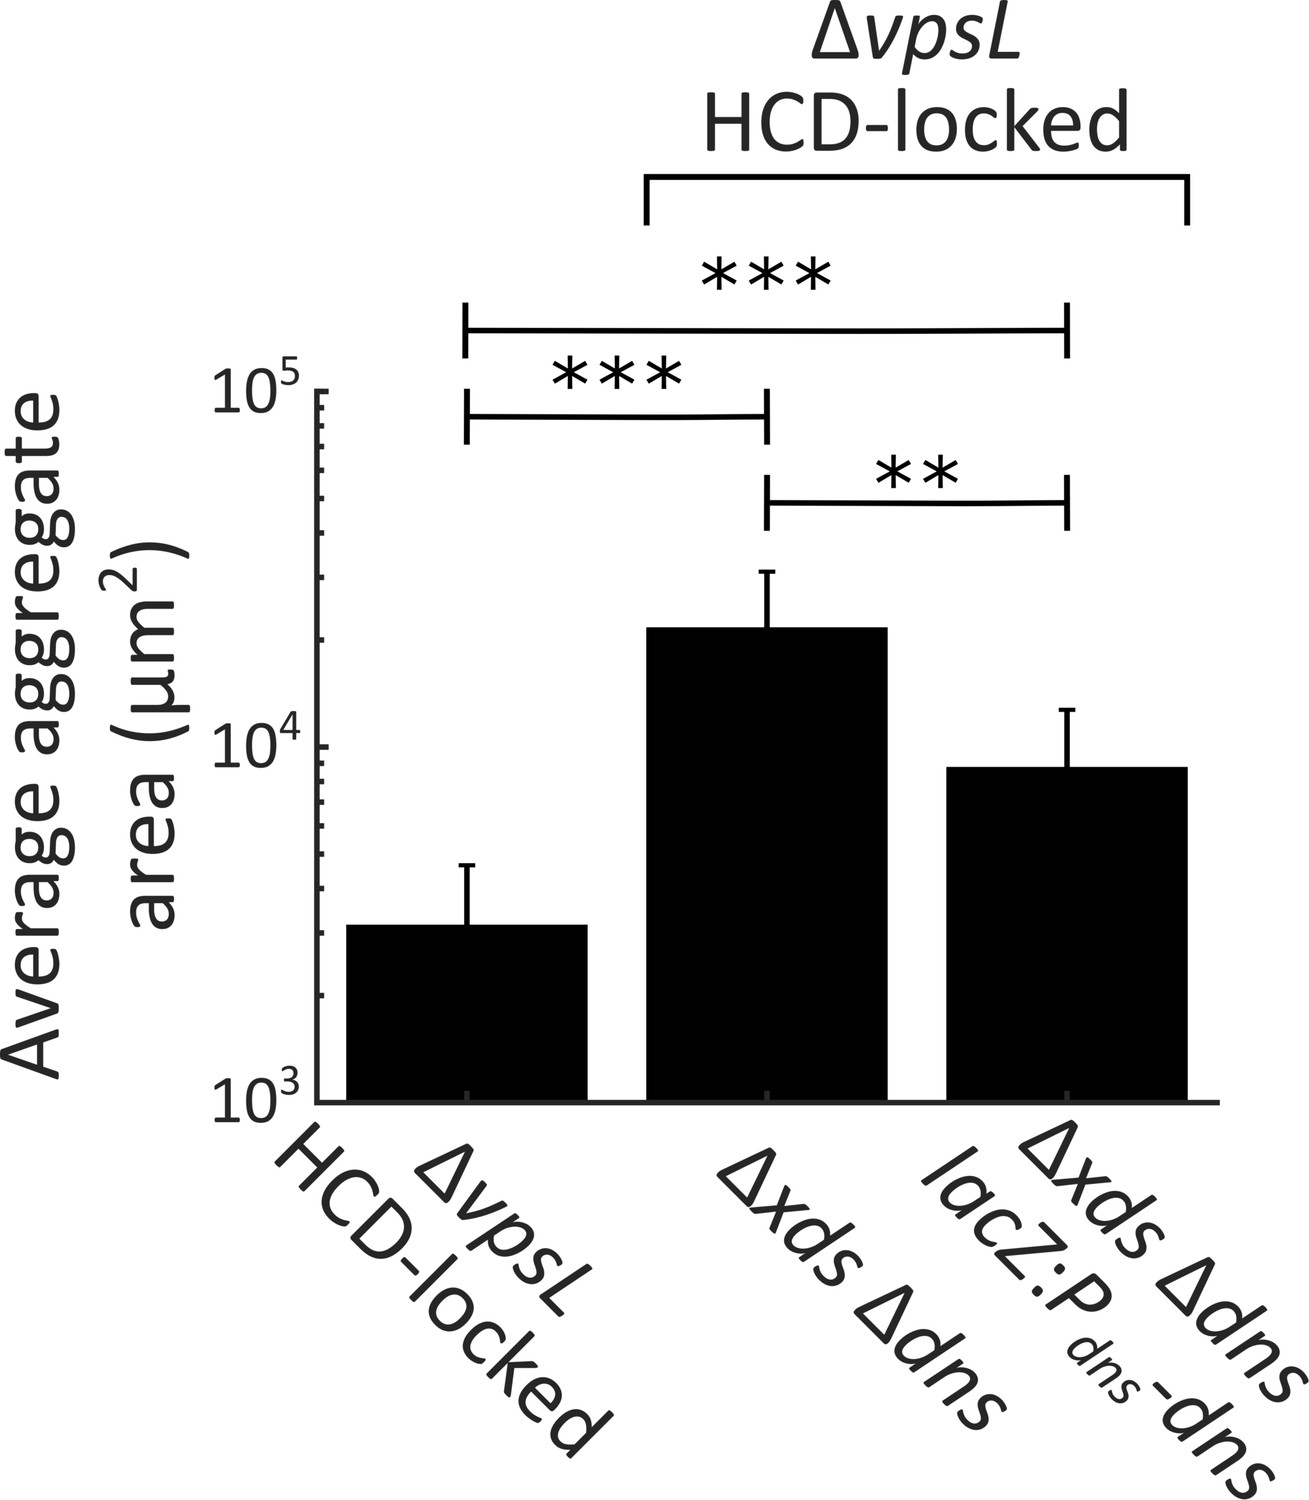
Complementation of dns in aggregate formation.
Quantification of average aggregate cross-sectional area at T = 22 h for ΔvpsL HCD-locked, ΔvpsL Δxds Δdns HCD-locked, and ΔvpsL Δxds Δdns lacZ:Pdns-dns HCD-locked strains. Strains additionally carry vc1807: KanR, which was used during strain construction. Samples were stained with the nucleic acid stain SYTO-9. Error bars are mean ± standard deviation (N=3 biological replicates). Statistical significance was determined with a two-sample Kolmogorov–Smirnov test on pooled data (**= p<0.005, ***= p<0.0005).
-
Figure 4—figure supplement 2—source data 1
Figure source data.
- https://doi.org/10.7554/eLife.42057.030
Figure 4—figure supplement 3
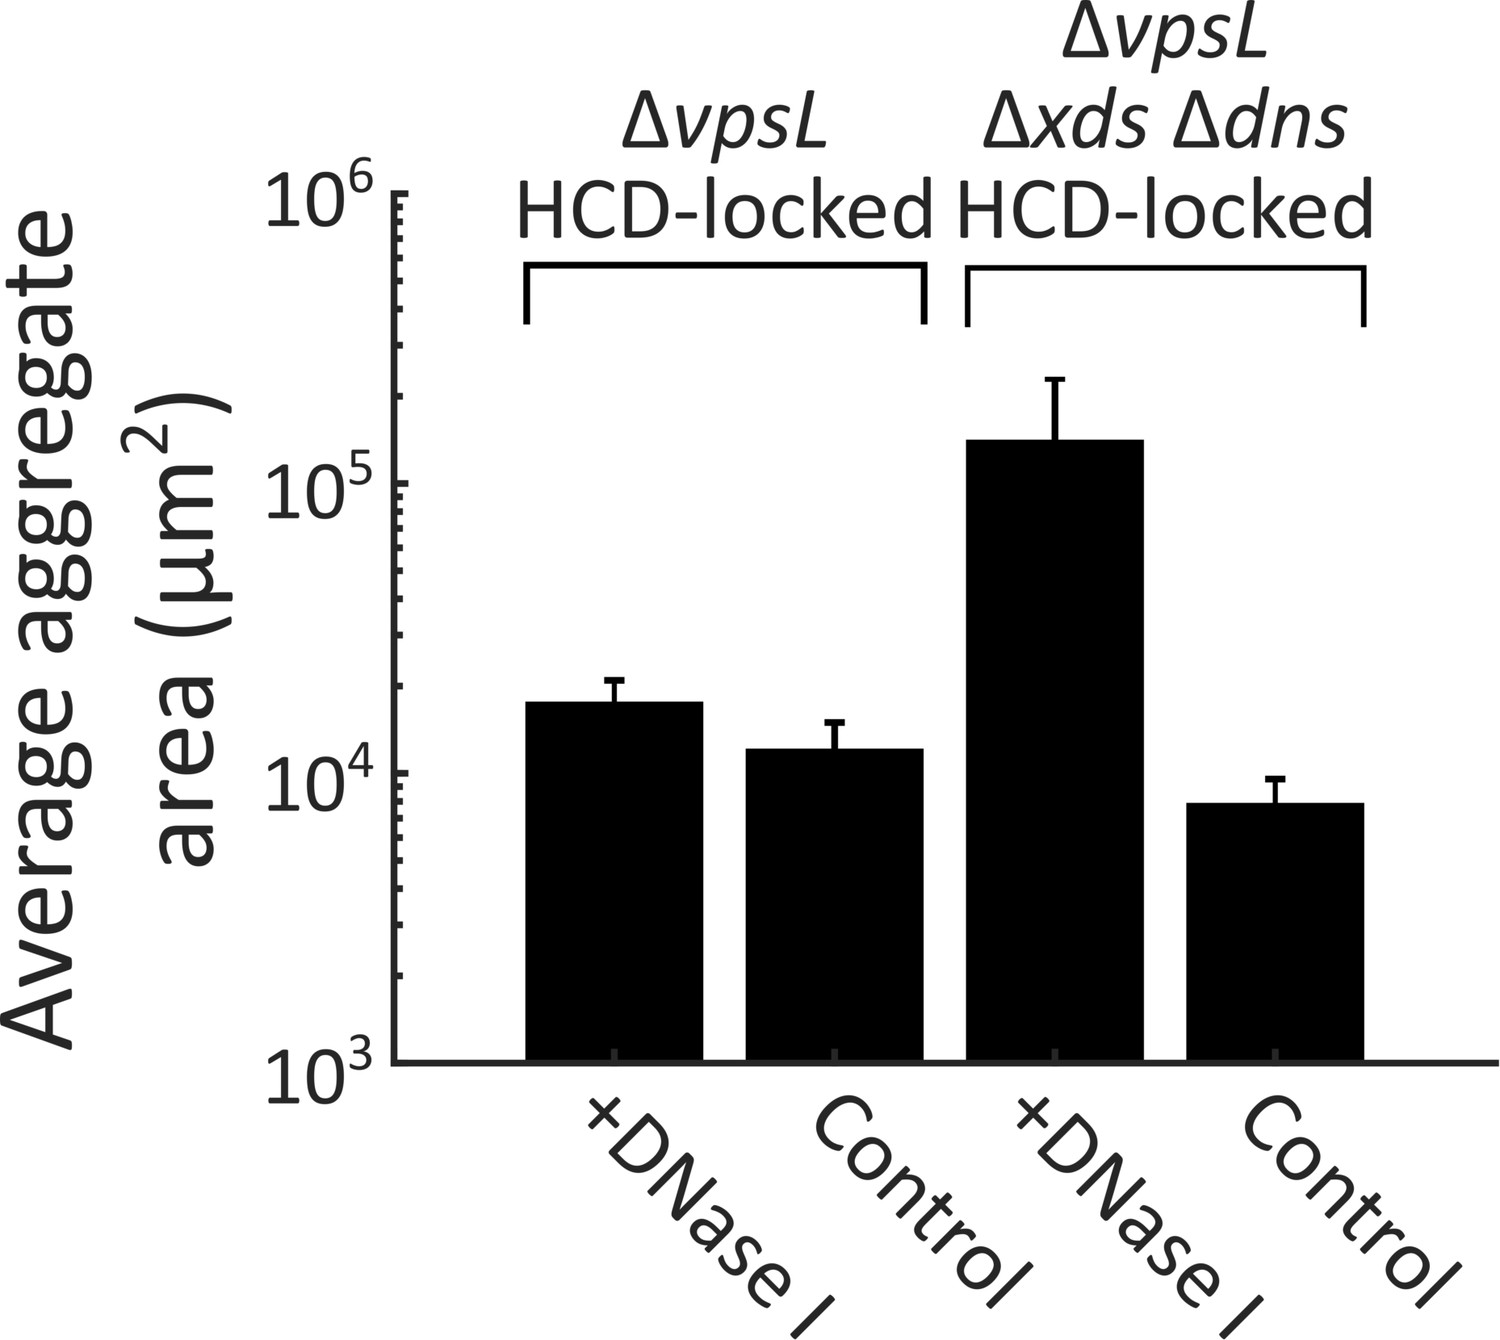
DNase I supplementation reduces aggregate size in the ΔvpsL Δxds Δdns HCD-locked strain.
Quantification of average aggregate cross-sectional area at T = 40 h for ΔvpsL HCD-locked and ΔvpsL Δxds Δdns HCD-locked strains grown in the presence or absence of DNase I (100 Kunitz units/ml). DNase I added at T = 0 h. All error bars are mean ± standard deviation (N=3 biological replicates). All strains harbor mKO constitutively expressed from the chromosome. p<0.0005 for comparison of pooled data from all conditions, as determined by a two-sample Kolmogorov–Smirnov test.
-
Figure 4—figure supplement 3—source data 1
Figure source data.
- https://doi.org/10.7554/eLife.42057.032
Figure 5
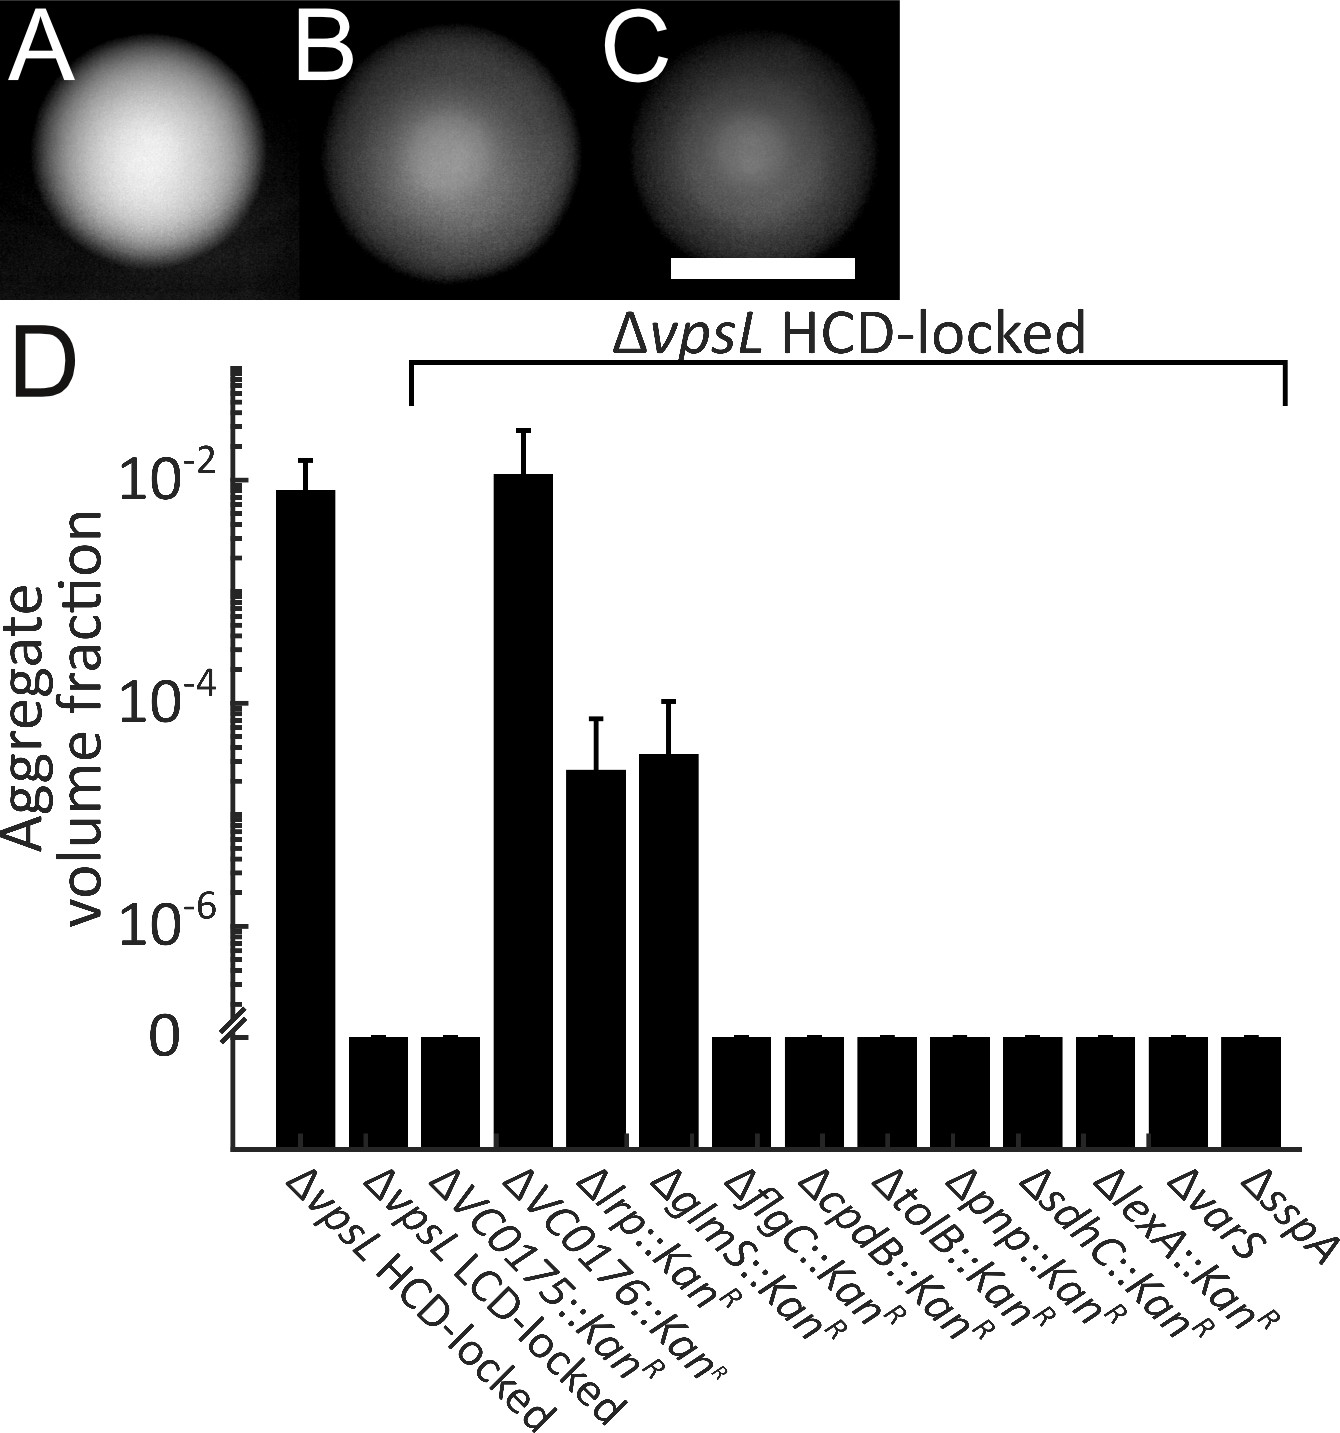
Genes required for V. cholerae aggregation.
Representative ΔvpsL HCD QS-locked (HCD-locked) (A, opaque), ΔvpsL LCD QS-locked (LCD-locked) (B, translucent), and ΔvpsL ΔhapR HCD-locked (C, translucent) colonies grown on LB agar plates at 37°C for 24 h. (A–C) Scale bar: 5 mm. (D) Quantitation of aggregate volume fraction for ΔvpsL HCD-locked, ΔvpsL LCD-locked, and ΔvpsL HCD-locked strains carrying deletions in each of the genes identified in the screen (Table 1). Samples were stained with the nucleic acid stain SYTO-9. Quantitation of mean ± standard deviation (N≥3 biological replicates) after 22 h of growth.
-
Figure 5—source data 1
Figure source data.
- https://doi.org/10.7554/eLife.42057.037
Videos
Video 1
ΔvpsL HCD-locked V. cholerae aggregates.
z-scan through a representative sample of aggregates formed by a ΔvpsL HCD-locked strain at T = 22 h. Data are the same as shown in Figure 2K. Magnification: 10X; scale bar: 250 μm. Strain harbors mKO constitutively expressed from the chromosome.
Video 2
eDNA in the ΔvpsL HCD-locked V. cholerae aggregate.
z-scan through a representative aggregate of the ΔvpsL HCD-locked strain (red) to which the eDNA stain TOTO-1 (cyan) was added following 22 h of growth. The strain harbors mKate2 constitutively expressed from the chromosome. Magnification: 63X; scale bar: 25 μm. Contrast independently adjusted in Videos 2 and 3 to highlight different eDNA features.
Video 3
eDNA in the ΔvpsL Δxds Δdns HCD-locked V. cholerae aggregate.
z-scan through a representative aggregate of the ΔvpsL Δxds Δdns HCD-locked strain (red) to which the eDNA stain TOTO-1 (cyan) was added following 22 h of growth. The strain harbors mKate2 constitutively expressed from the chromosome. Magnification: 63X; scale bar: 25 μm. Contrast independently adjusted in Videos 2 and 3 to highlight different eDNA features.
Tables
Table 1
Genes that contribute to aggregation in V. cholerae
https://doi.org/10.7554/eLife.42057.038| Gene locus | Annotation | hapR merodiploid/haploid |
|---|---|---|
| vc0092 | LexA transcriptional repressor (lexA) | Merodiploid |
| vc0175 | Deoxycytidylate deaminase-like protein, putative | Merodiploid |
| vc0487 | Glucosamine-fructose-6-phosphate aminotransferase (glmS) | Merodiploid |
| vc0576 | Stringent starvation protein A (sspA) | Merodiploid |
| vc0647 | Polyribonucleotide nucleotidyltransferase (pnp) | Both |
| vc1836 | Translocation protein (tolB) | Haploid |
| vc1904 | Leucine-responsive transcriptional regulator (lrpA) | Merodiploid |
| vc2091-vc2087 | Succinate and 2-oxoglutarate dehydrogenases (TCA cycle) (sdhC, sdhD, sdhA, sdhB, and sucA) | Both |
| vc2200-vc2198 | Flagellar basal-body rod proteins (flgBCD) | Both |
| vc2453 | Hybrid sensor histidine kinase VarS (varS) | Merodiploid |
| vc2562 | 2′3′cyclic phosphodiesterase (cpdB) | Haploid |
Additional files
-
Supplementary file 1
Strain list
- https://doi.org/10.7554/eLife.42057.039
-
Supplementary file 2
Plasmid list
- https://doi.org/10.7554/eLife.42057.040
-
Transparent reporting form
- https://doi.org/10.7554/eLife.42057.041
Download links
A two-part list of links to download the article, or parts of the article, in various formats.
Downloads (link to download the article as PDF)
Open citations (links to open the citations from this article in various online reference manager services)
Cite this article (links to download the citations from this article in formats compatible with various reference manager tools)
Quorum sensing controls Vibrio cholerae multicellular aggregate formation
eLife 7:e42057.
https://doi.org/10.7554/eLife.42057


