A new experimental platform facilitates assessment of the transcriptional and chromatin landscapes of aging yeast
- Calico Life Sciences LLC, United States
Figures
Figure 1 with 6 supplements
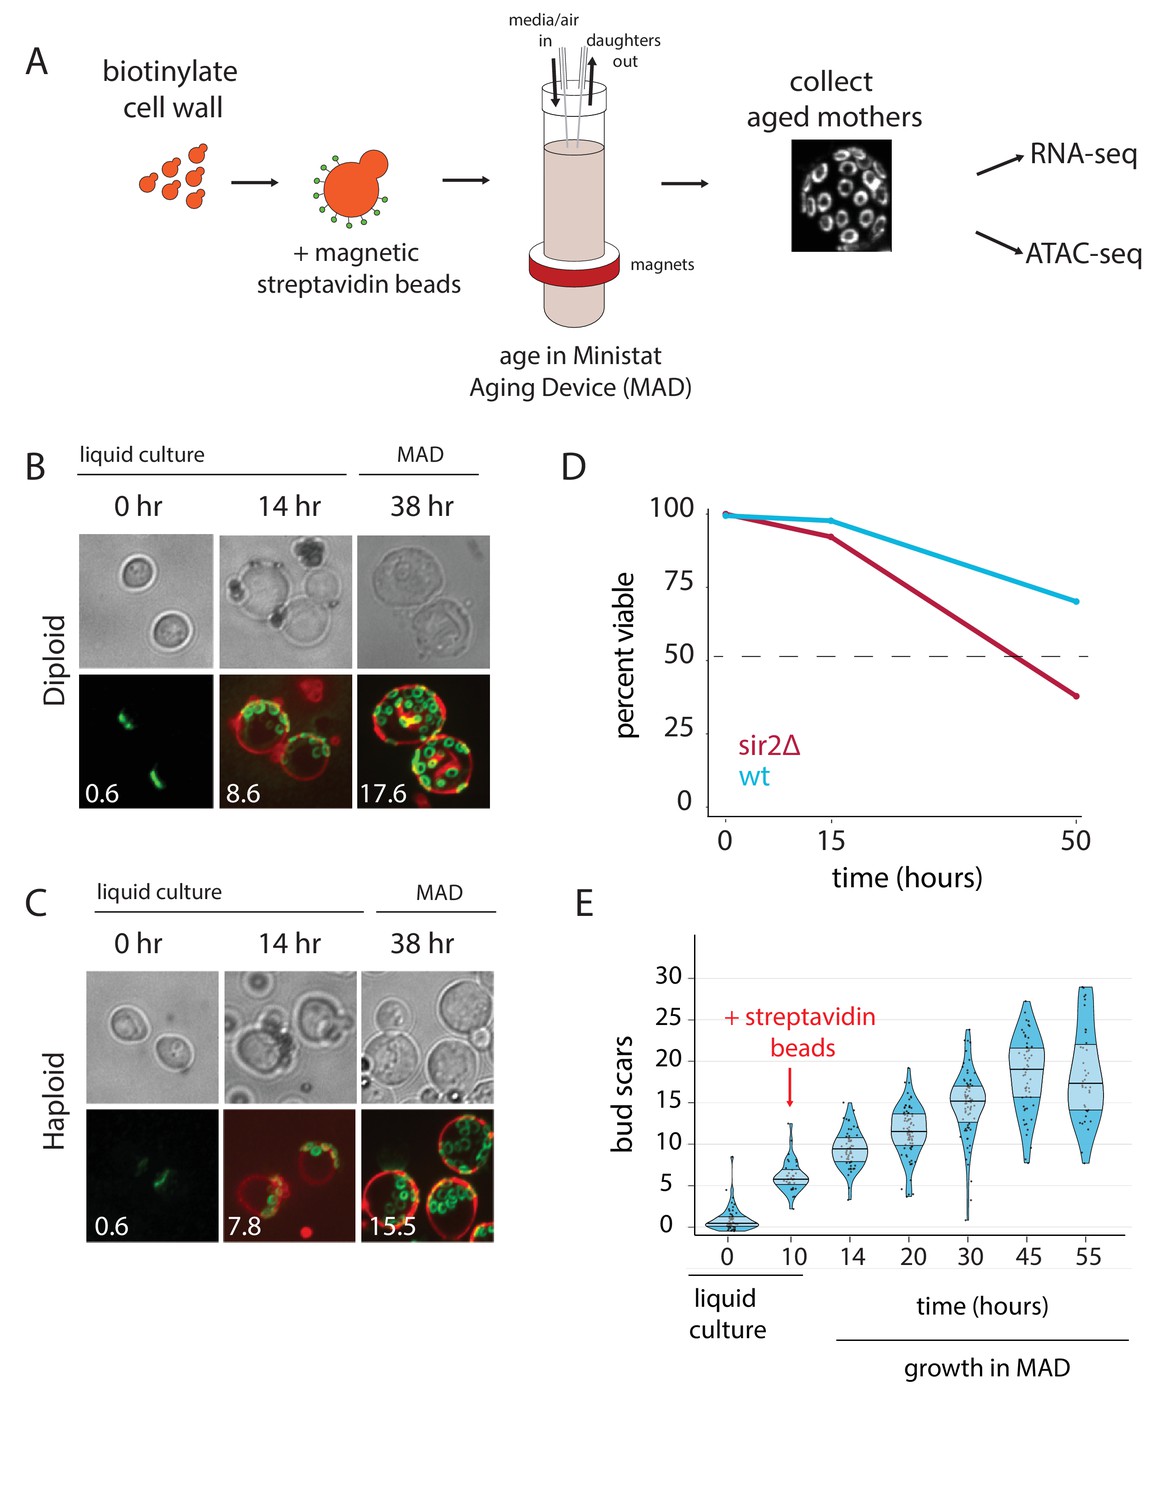
Overview of the MAD platform.
(A) Yeast cells are biotinylated, grown in flask culture, labeled with streptavidin beads, and loaded into MAD. Daughters do not inherit the magnetic beads and are perfused from the culture, leaving behind a pure replicatively aged population of cells. (B,C). Haploid (DBY12000) and diploid (DBY12007) cells purified using MAD. Bud scars are labeled in green with wheat germ agglutinin conjugated to Alexa Fluor 488. Cell walls are labeled in red with NeutrAvidin conjugated to DyLight 593. (D) Viability of WT and sir2∆ cells from a 50 hr aging time course. (E) Mother cell ages (bud scars) during a 55 hr MAD time course.
-
Figure 1—source data 1
List of MAD components with ordering information.
- https://doi.org/10.7554/eLife.39911.009
-
Figure 1—source data 2
Physiological parameters collected from dense aging time course.
- https://doi.org/10.7554/eLife.39911.010
-
Figure 1—source data 3
Yeast transcript types.
- https://doi.org/10.7554/eLife.39911.011
Figure 1—figure supplement 1
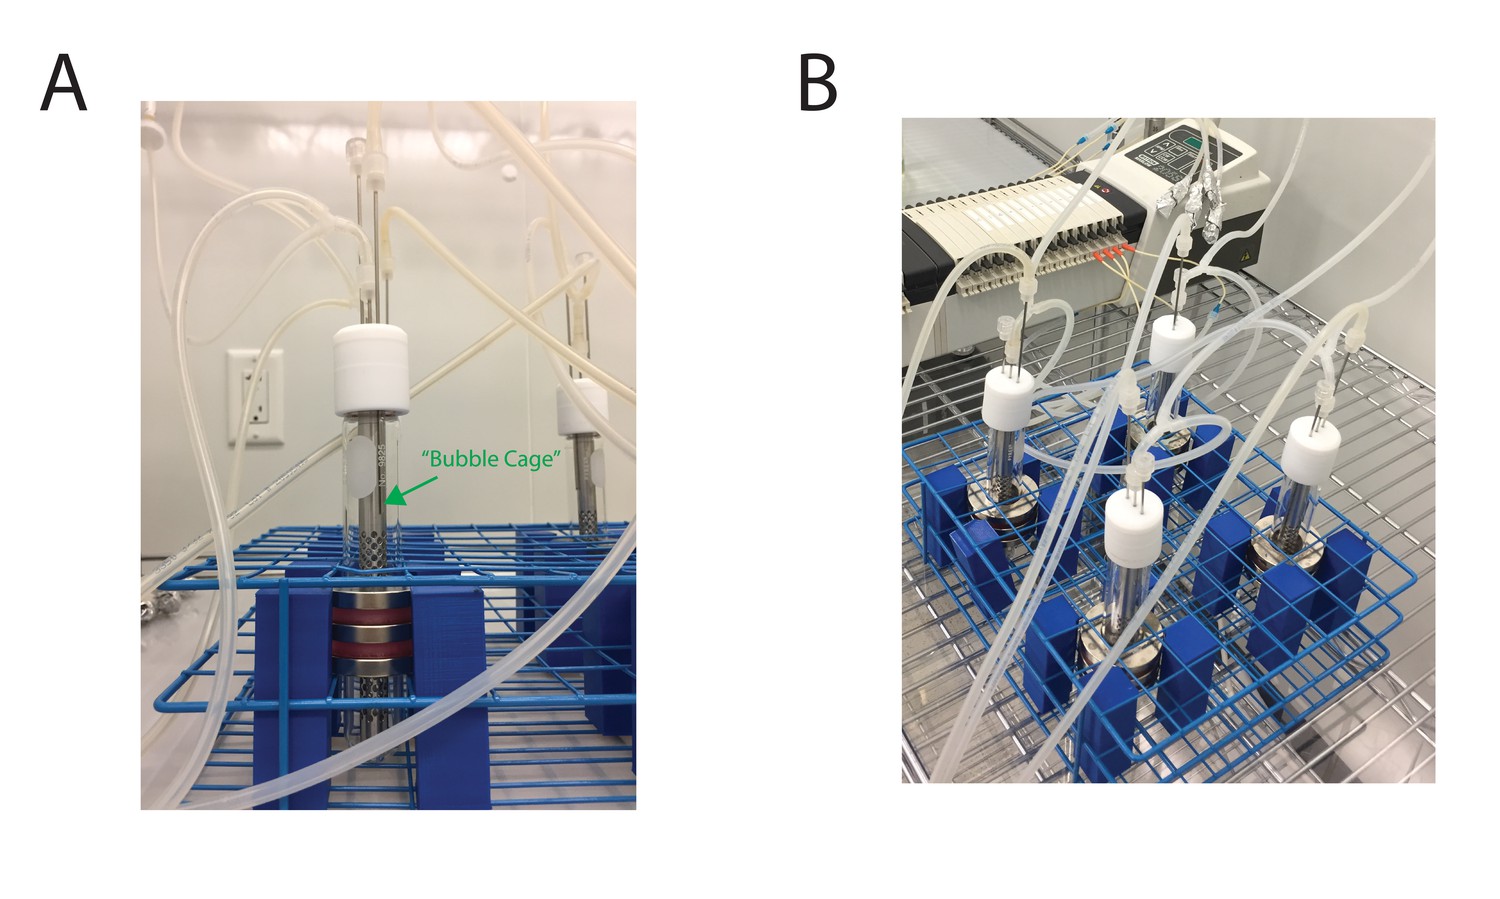
Images of the MAD platform.
(A) Side-view of a single MAD. The ‘bubble cage’ enables aeration of the culture, and prevents large bubbles from dislodging beaded mother cells from the sidewall of the MAD. (B) View of four MADs.
Figure 1—figure supplement 2
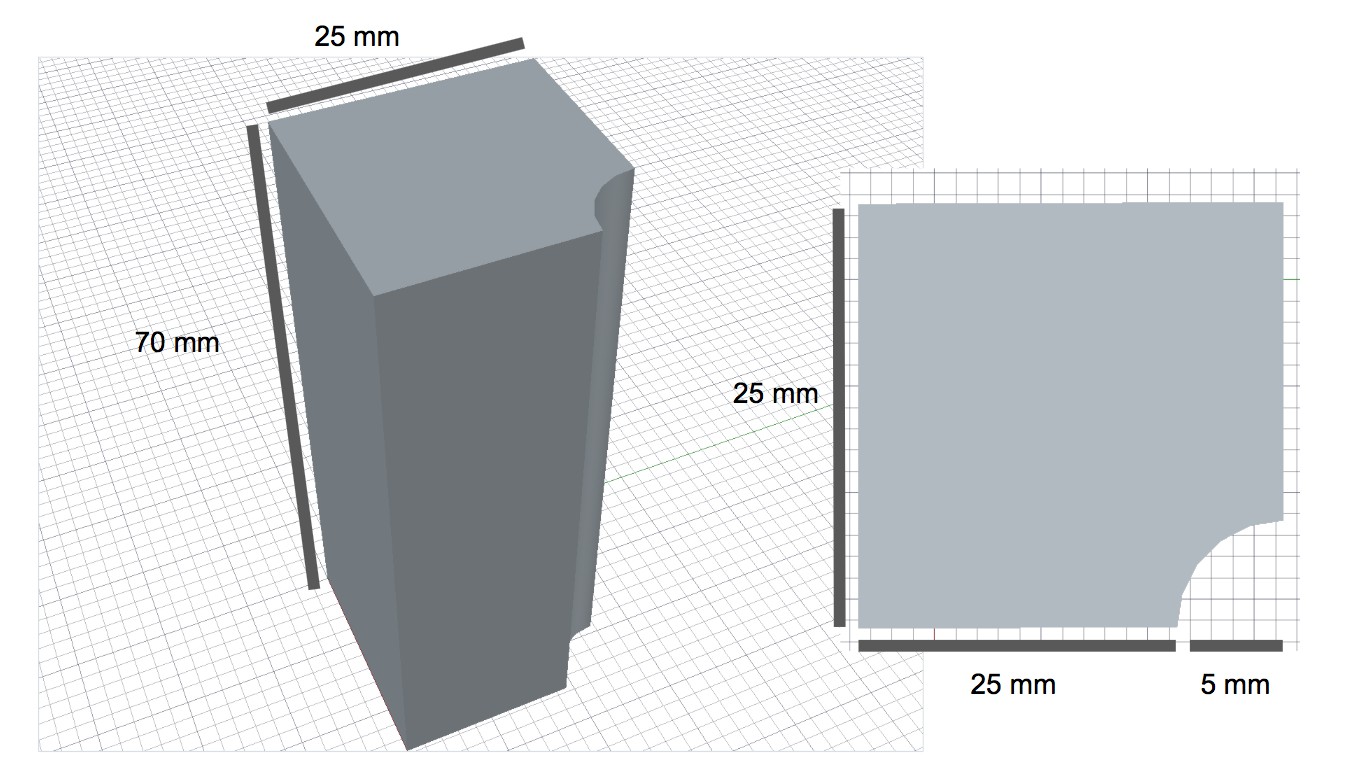
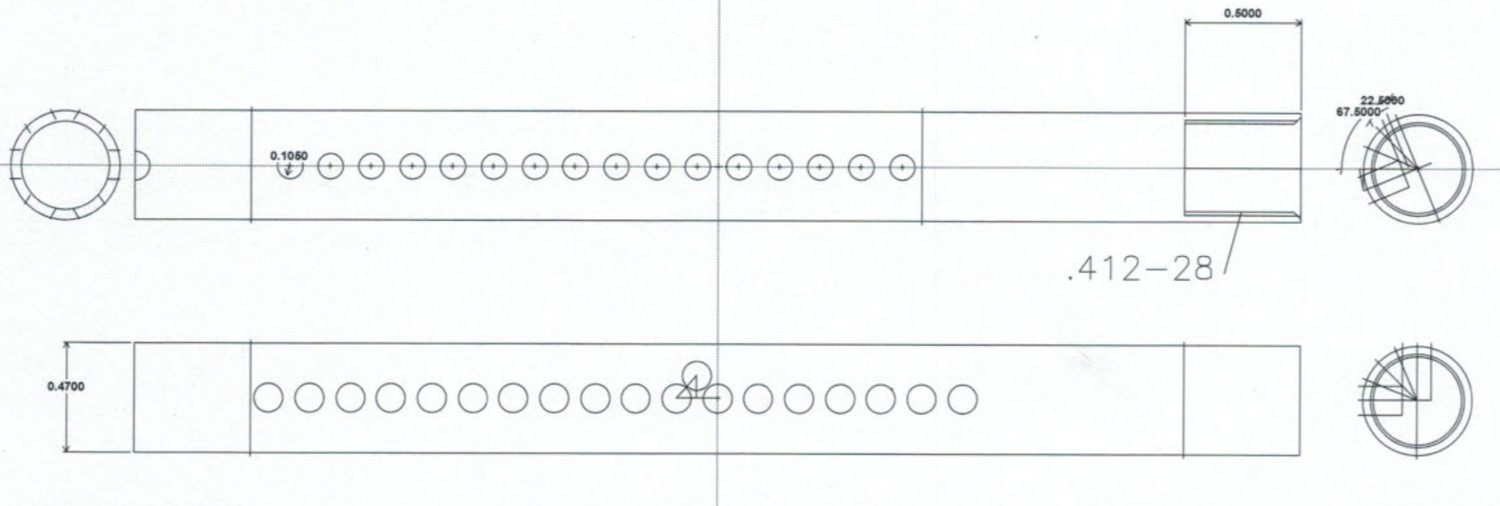
Diagram of 3D-printed magnet holders with dimensions.
https://doi.org/10.7554/eLife.39911.004
Figure 1—figure supplement 3
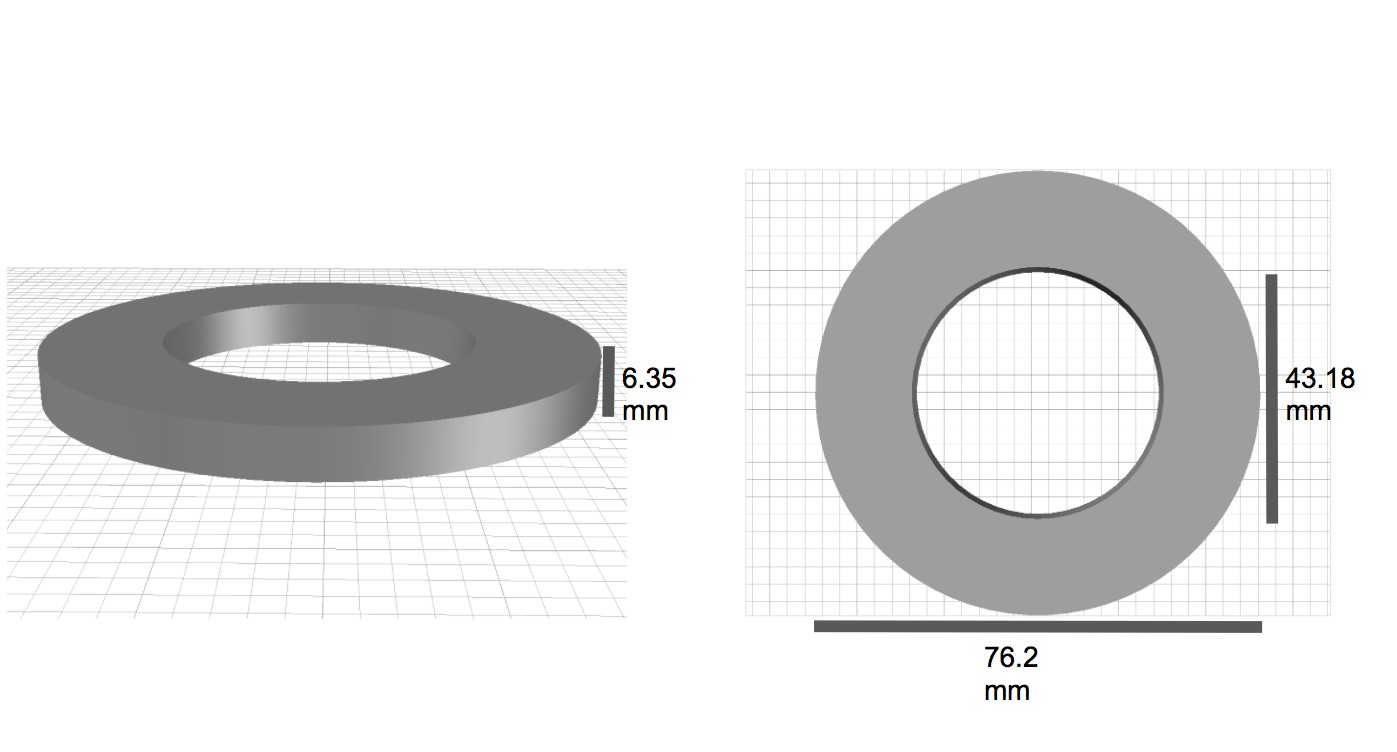
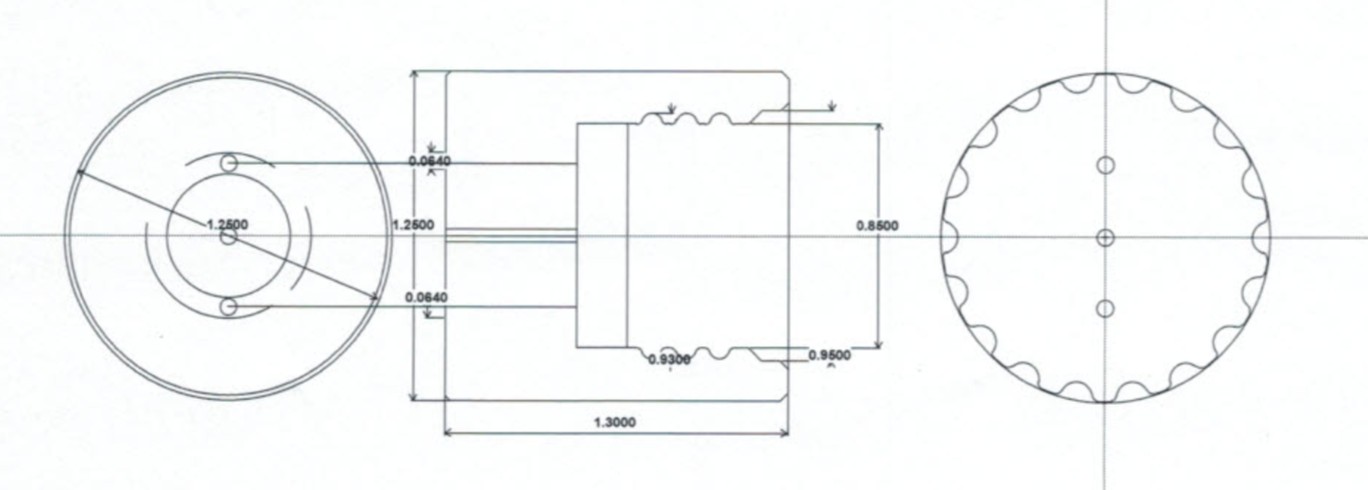
Diagram of spacer elements with dimensions.
https://doi.org/10.7554/eLife.39911.005
Figure 1—figure supplement 4
Schematic of cap used for a single MAD.
Units are in inches.
Figure 1—figure supplement 5
Schematic of the ‘bubble cage’ used for preventing air bubbles from dislodging mother cells from the glass wall.
Units are in inches.
Figure 1—figure supplement 6
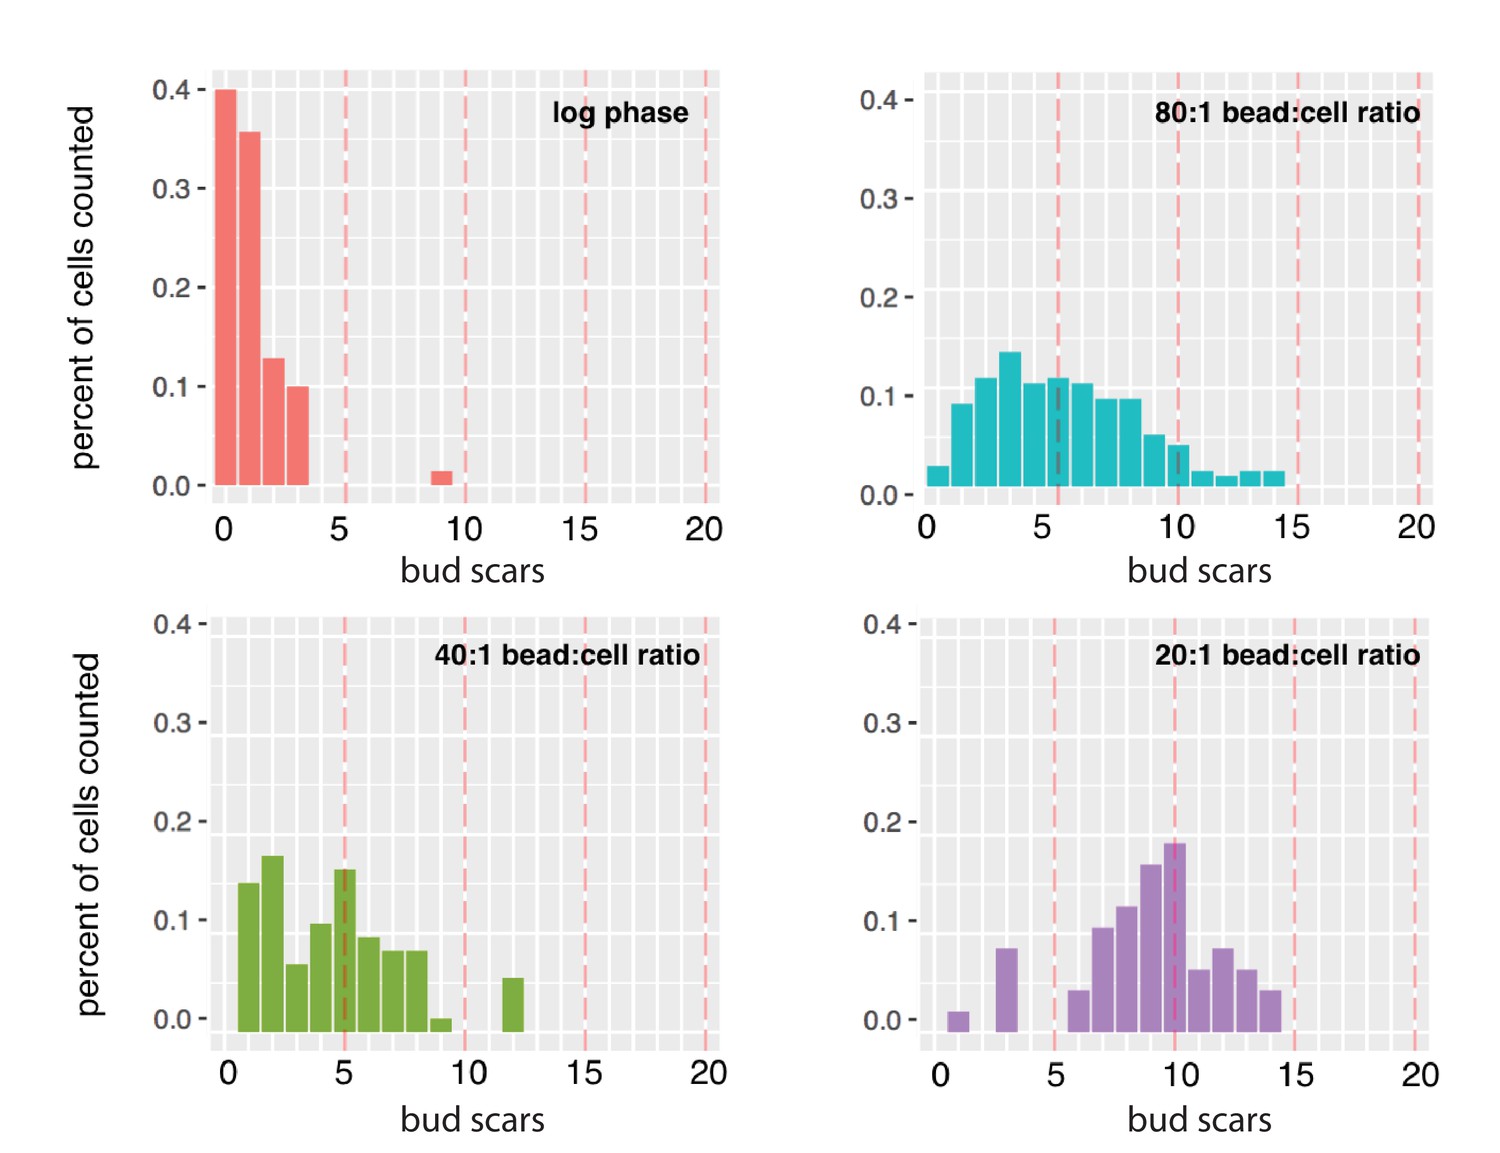
Average bud-scar counts of diploid cells harvested from MAD at different bead-to-cell ratios.
The mean number of bud scars in log-sample cells was 0.9. Populations of cells grown in MAD for 27 hr with 80:1, 40:1, and 20:1 bead-to-cell ratios had 5, 6, and 11 bud scars, respectively (compared to the expected number of ~13.5).
Figure 2 with 3 supplements
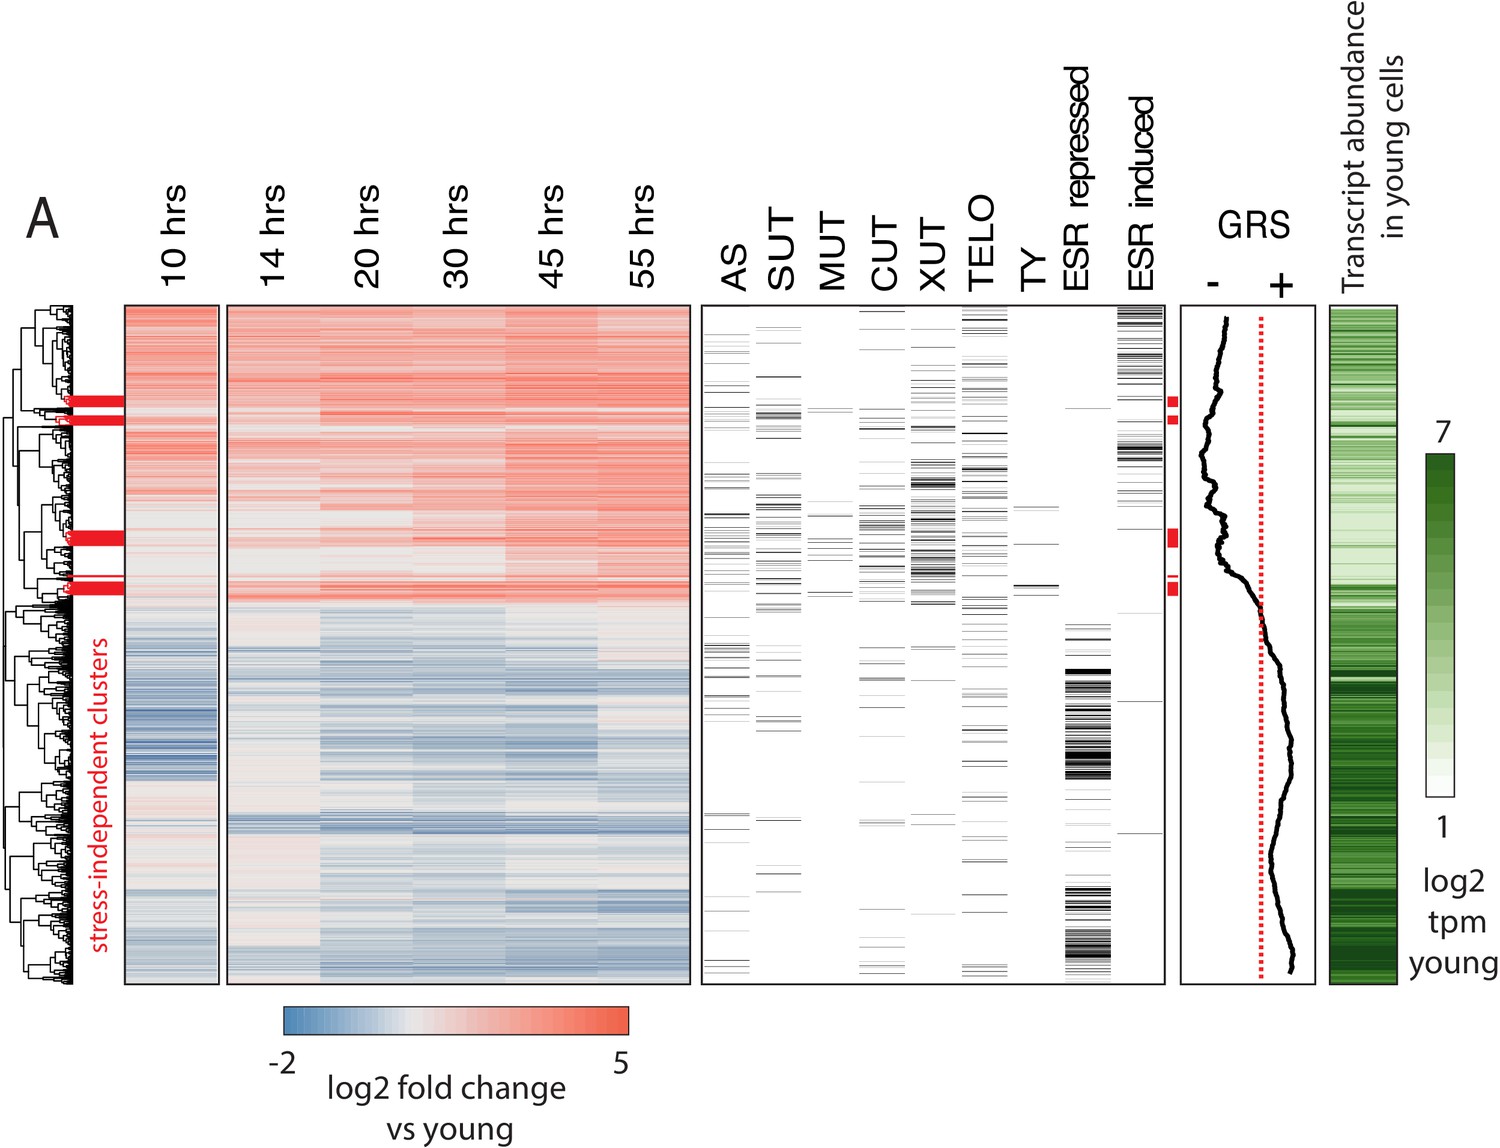
Age-dependent gene expression dynamics.
(left) Hierarchically clustered heatmap of transcriptome at increasing replicative ages of ~ 2900 genes (the transcriptome at 10 hr is conflated with cell beading). Different transcript types are labeled in black directly to the right of the transcriptional data. (AS = antisense, SUT = stable unannotated transcript, MUT = meiotic unannotated transcript, CUT = cryptic unstable transcript, XUT = Xrn1 sensitive unstable transcript, TELO = subtelomeric, TY = TY repeat element, ESR = environmental stress response). (right) Moving window average (of 100 gene bins) of Growth Rate Slopes from Brauer et al. and log2 transcript abundances in transcripts per million during initial log-phase growth (green). Red bars indicate clusters displaying early-age induction independent of the ESR.
-
Figure 2—source data 1
Physiological parameters collected from aging time courses.
- https://doi.org/10.7554/eLife.39911.016
-
Figure 2—source data 2
Strains.
- https://doi.org/10.7554/eLife.39911.017
Figure 2—figure supplement 1
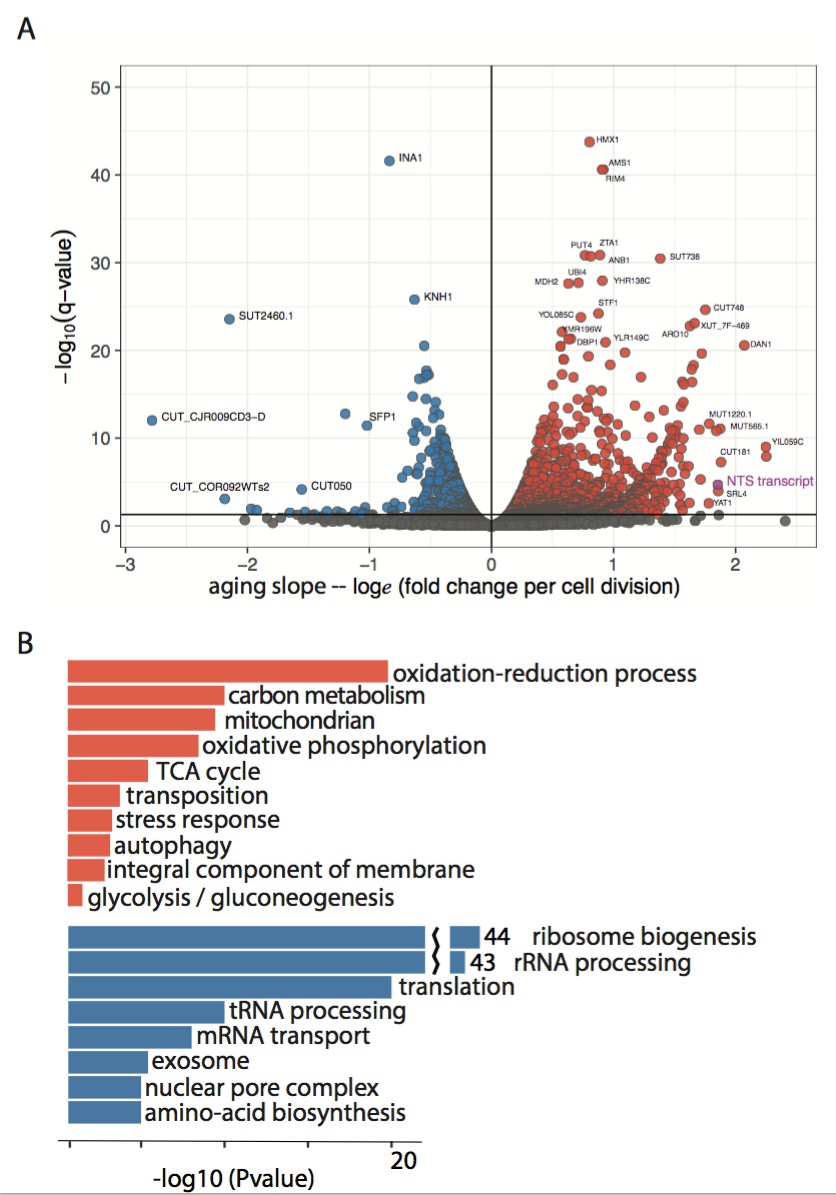
Enriched GO terms in the aging transcriptome.
(A) Volcano plot of ~2900 significantly changing transcripts (ORF +non canonical transcripts) with age as modeled using Sleuth. The non-transcribed sequence (NTS) of the rDNA locus is one of the largest measured increases (purple). (B) Subset of GO terms enriched in upregulated and downregulated genes from (A).
Figure 2—figure supplement 2
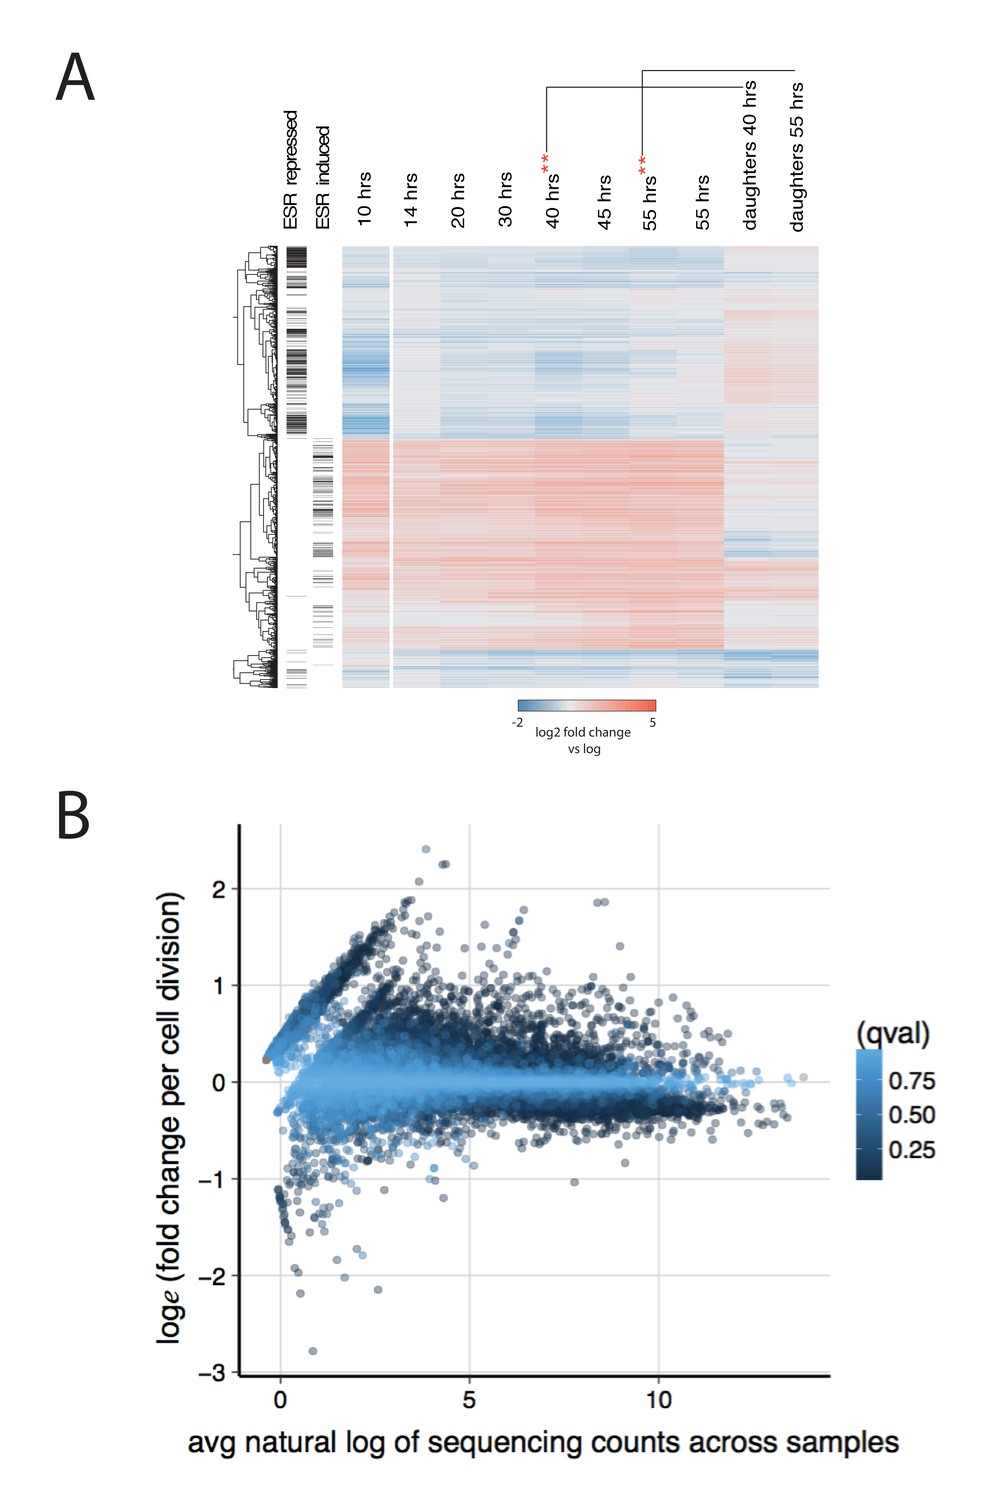
Further characterization of the aging transcriptome.
(A) Transcriptome from Figure 2, along with an additional 40 hr and 55 hr time point from a separate MAD (**) and a pure population of daughters from those time points. (B) The effect of transcript abundance on gene expression with age. The aging slope for all transcripts was plotted against the mean natural log of sequence read counts across all samples. Each transcript (dot) is colored by its q-value. In general, low abundance transcripts are more likely to increase expression than decrease expression with age.
Figure 2—figure supplement 3
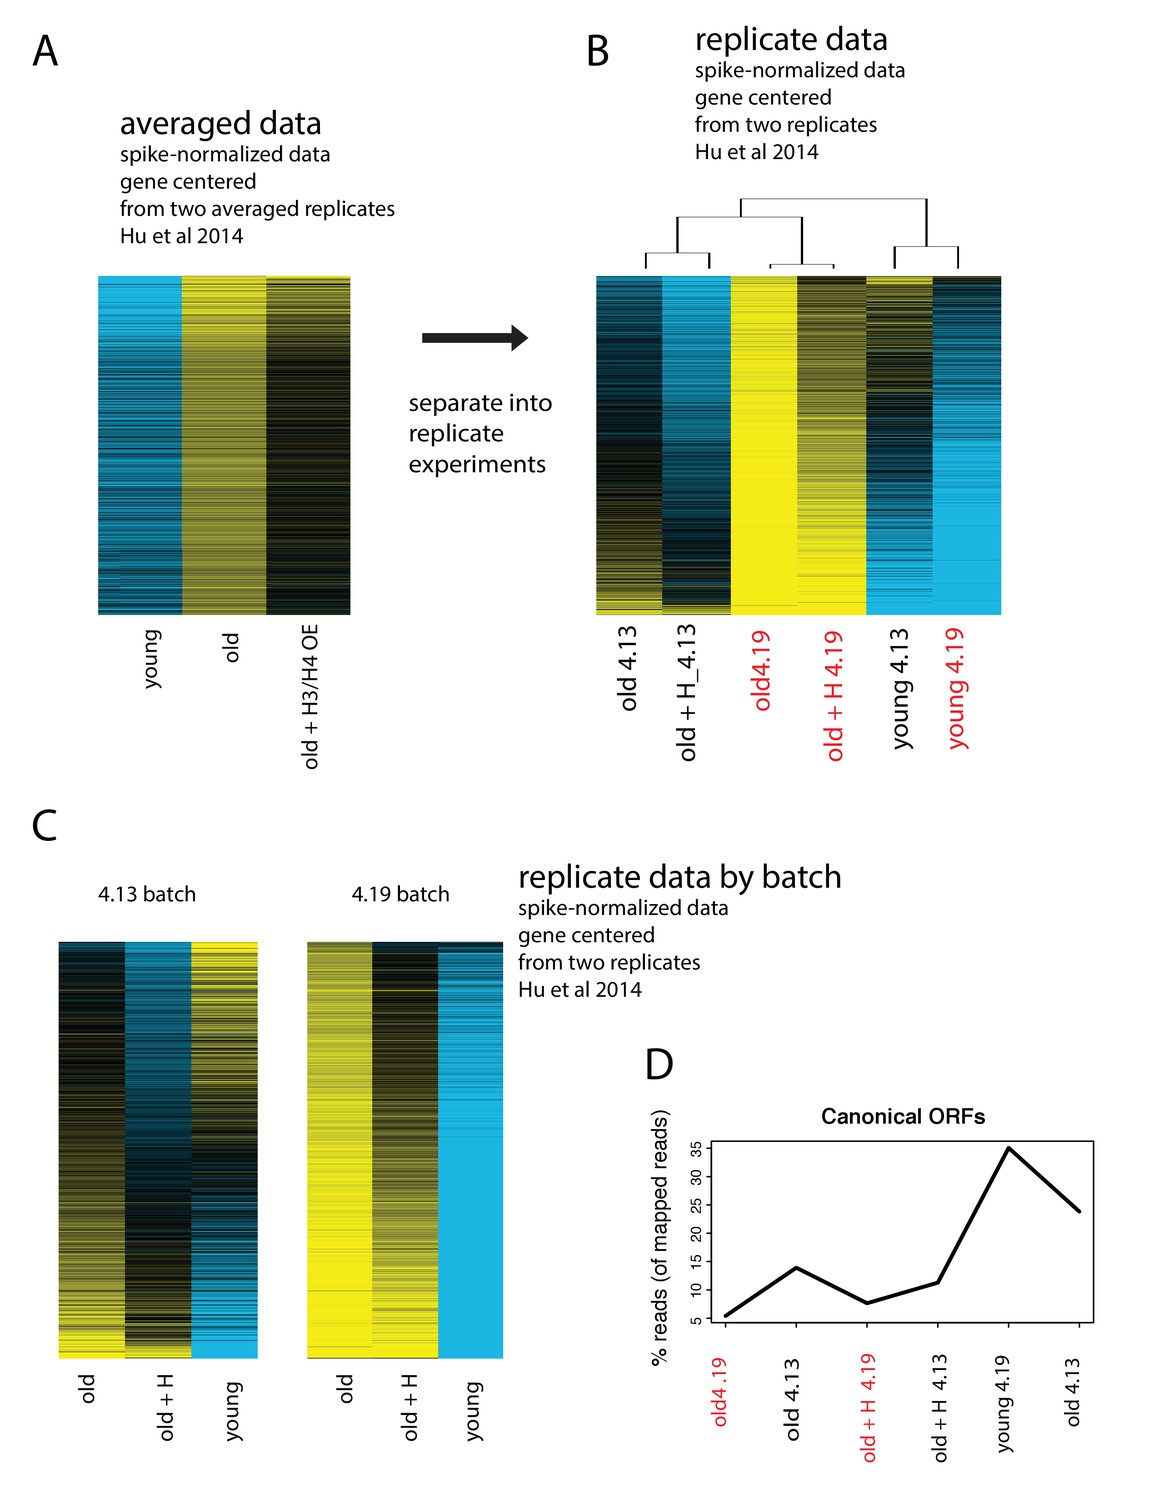
Batch effects drive the age-dependent global expression increase observed in Hu et al., 2014
(A) Data from Hu et al. of spike-normalized RNA-seq data showing that in absolute terms, transcripts increase with age. Replicate experiments were averaged. (B) Spike-normalized data split into replicate experiments, ‘4.13’ and ‘4.19’, and row-normalized. Data from old cells from batch ‘4.19’ are highlighted in red to point out that the majority of the global upregulation arises from this batch. (C) Re-analysis of the exact same spike-normalized data separated by batch reveals that universal upregulation of genes is only present in batch 4.19. (D) Re-analysis and realignment of raw data reveals extremely low mapping rates for batch 4.19.
Figure 3 with 7 supplements

Common features of the aging transcriptome across multiple genotypes.
(A) (left) Hierarchically clustered heatmap of ~1500 genes with significant age-dependent transcriptional responses across multiple genotypes. (right) Significance of GO terms in upregulated and downregulated genes, respectively (-log10(p)). Experiments were performed in triplicate. (B) Scatterplot of ‘aging slopes’ from (A) versus 'growth rate slopes' from Brauer et al. Canonical ESR-induced transcripts are labeled red and canonical ESR-repressed transcripts are labeled blue. (C) Subset of (B), filtered for genes with aging slopes q < 0.05 and growth rate slopes > 4 or < −4 removed. SRP-encoding genes are labeled red, UPR genes are labeled orange, and SRP clients are labeled green. Right panel: density of SRP clients (green) and other genes (grey) across significant aging slopes. (D) Gene expression levels of SCR1 at increasing ages.
Figure 3—figure supplement 1
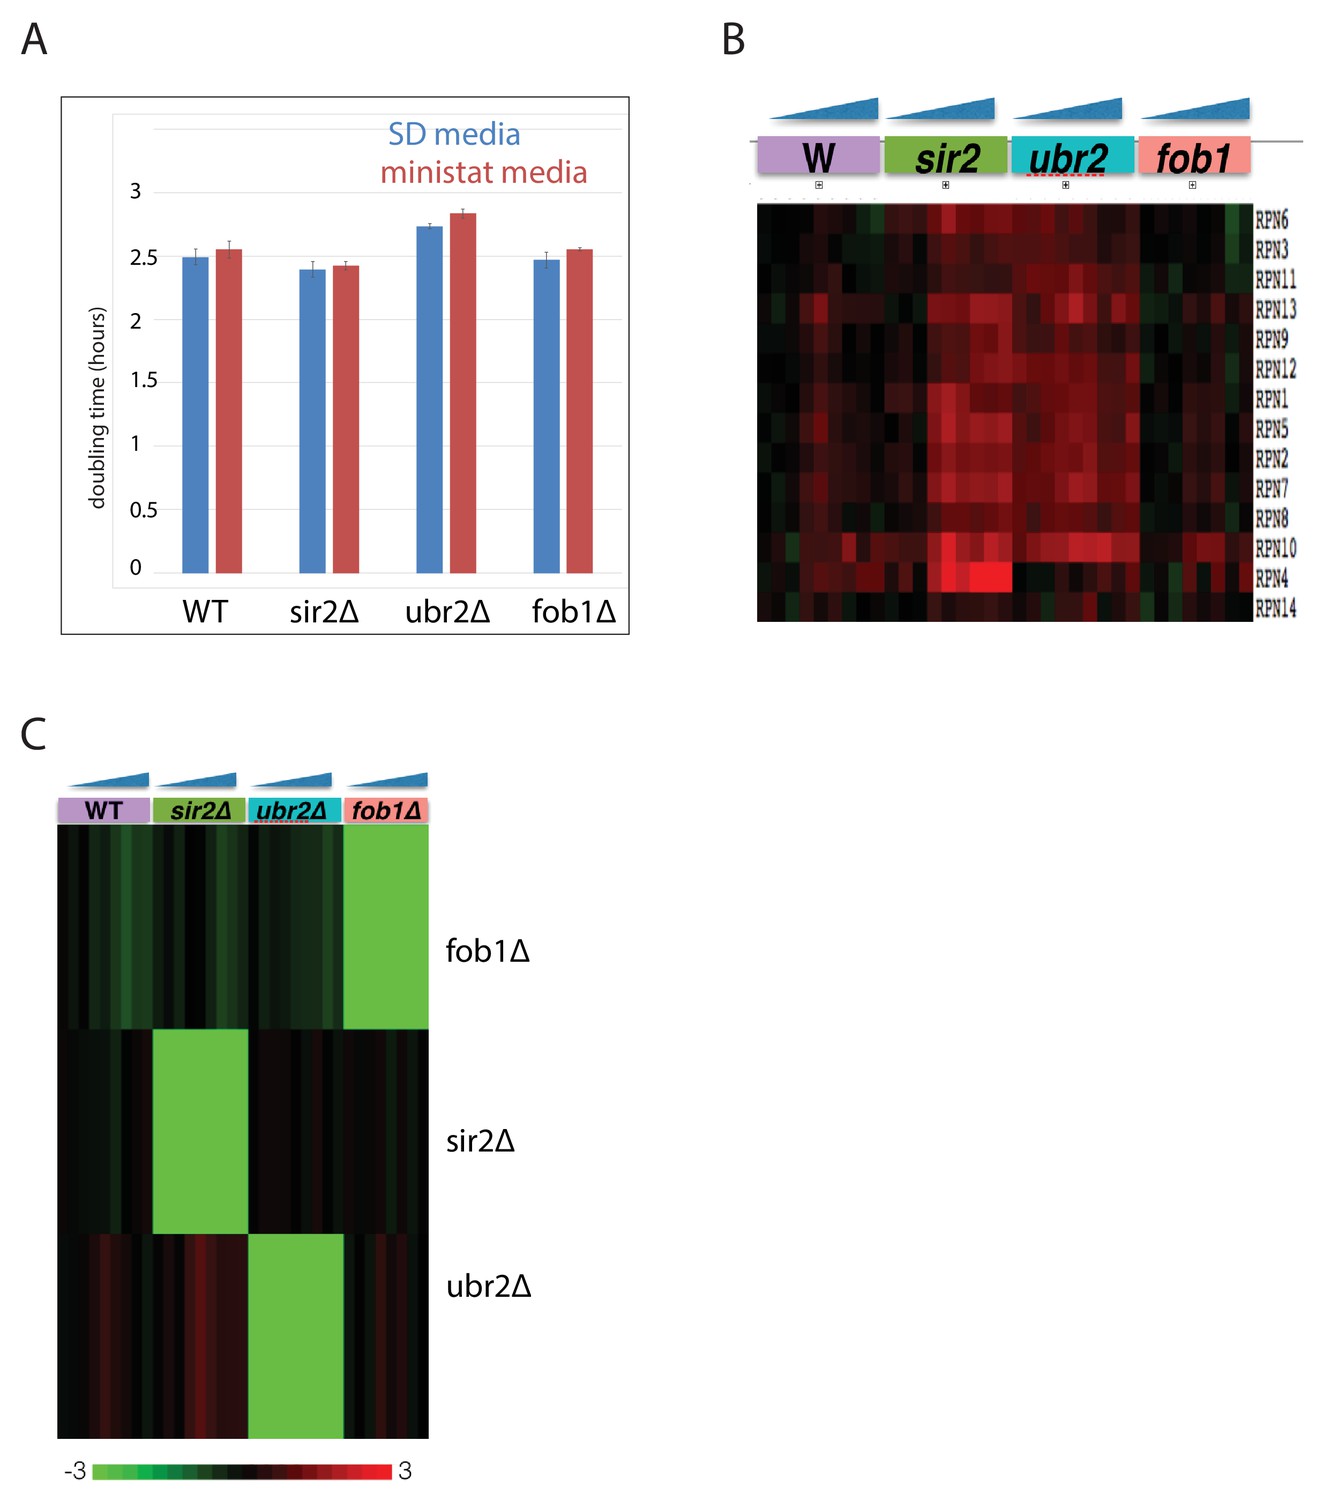
Characterization of mutant panel.
(A) Doubling times of each mutant and WT in standard minimal media and in MAD media (SD +2% mannose+DAPA [no biotin]). (B) Verification of proteasome upregulation in the ubr2∆ background. Gene expression changes for proteasome components in each mutant strain normalized to WT log phase. (C) Gene expression levels of FOB1, UBR2, and SIR2, across all aging time courses.
Figure 3—figure supplement 2
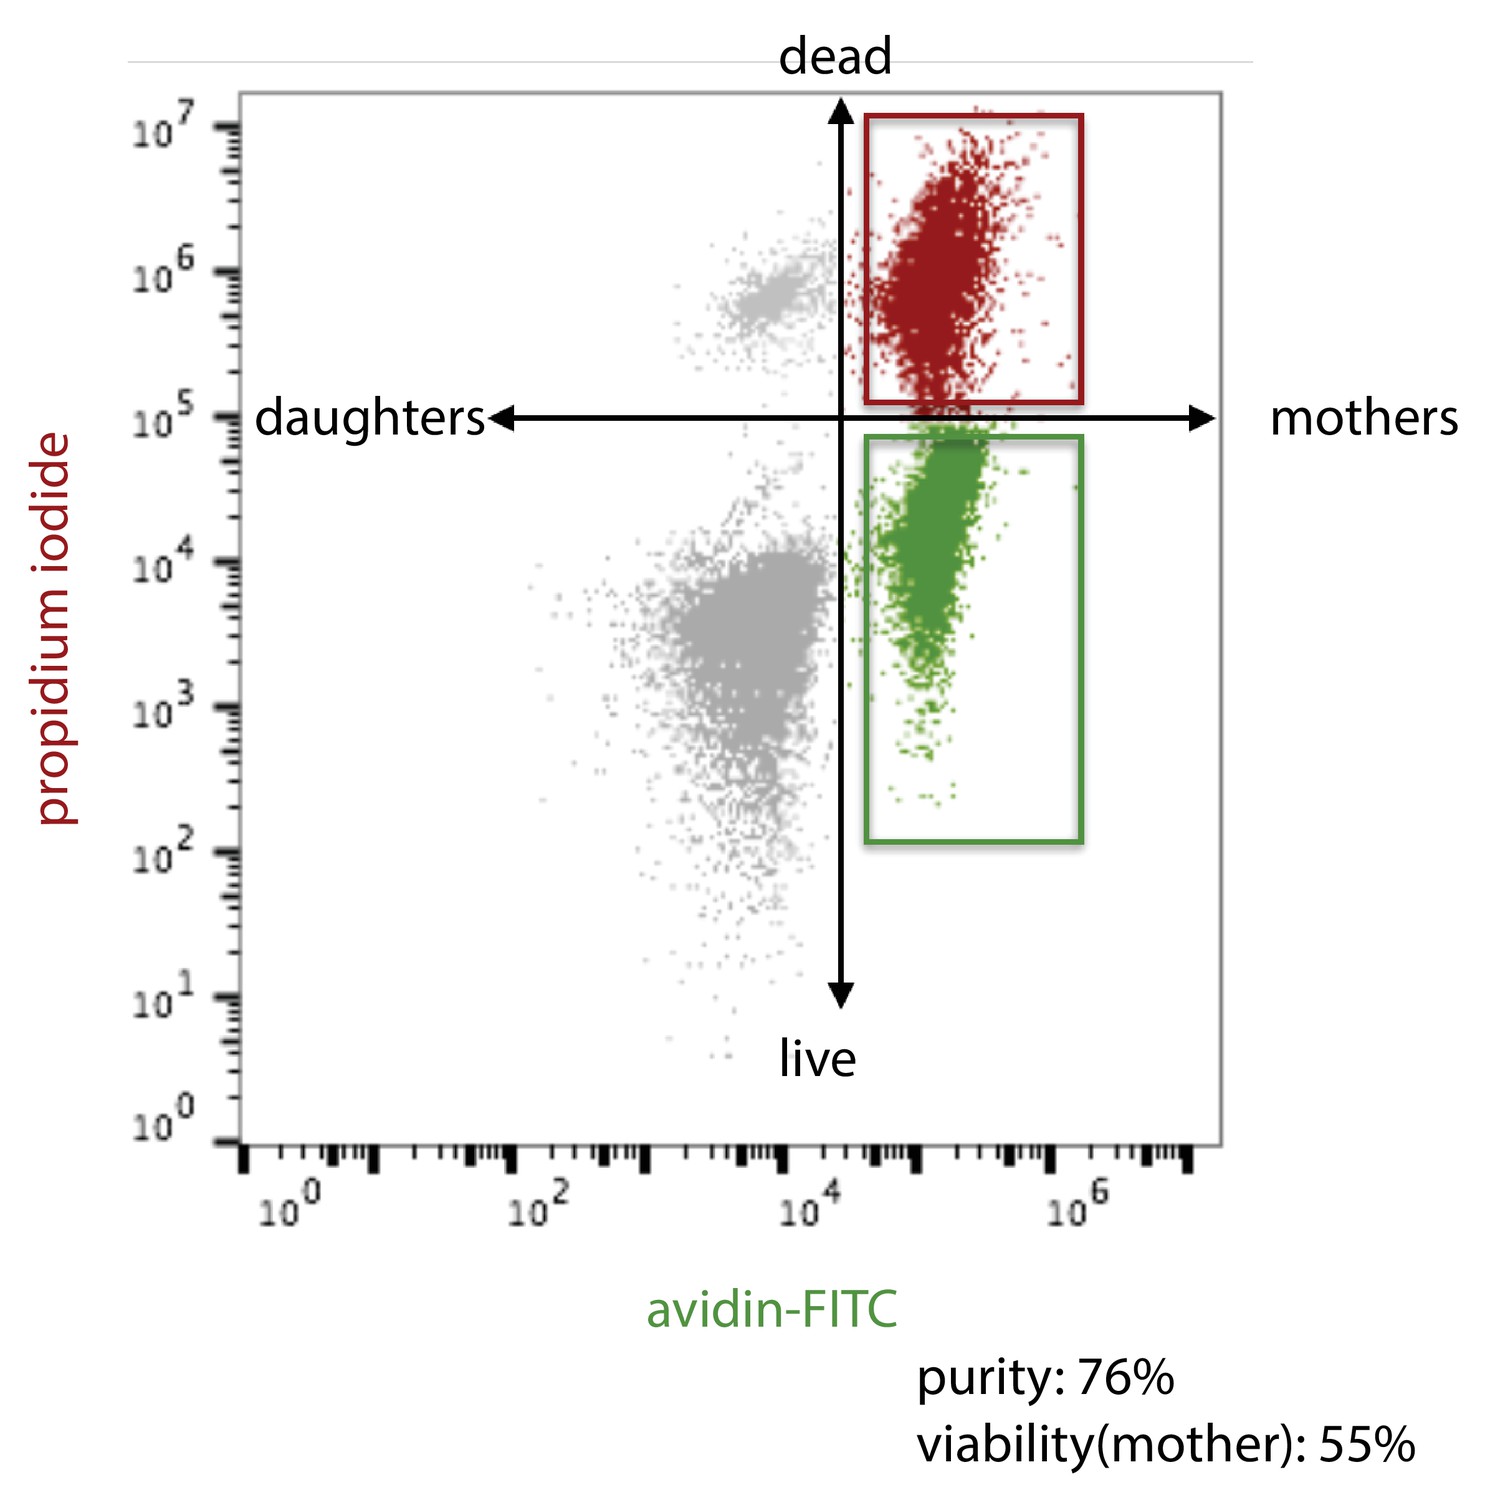
Schema for flow cytometric analysis of aged yeast cells.
https://doi.org/10.7554/eLife.39911.020
Figure 3—figure supplement 3
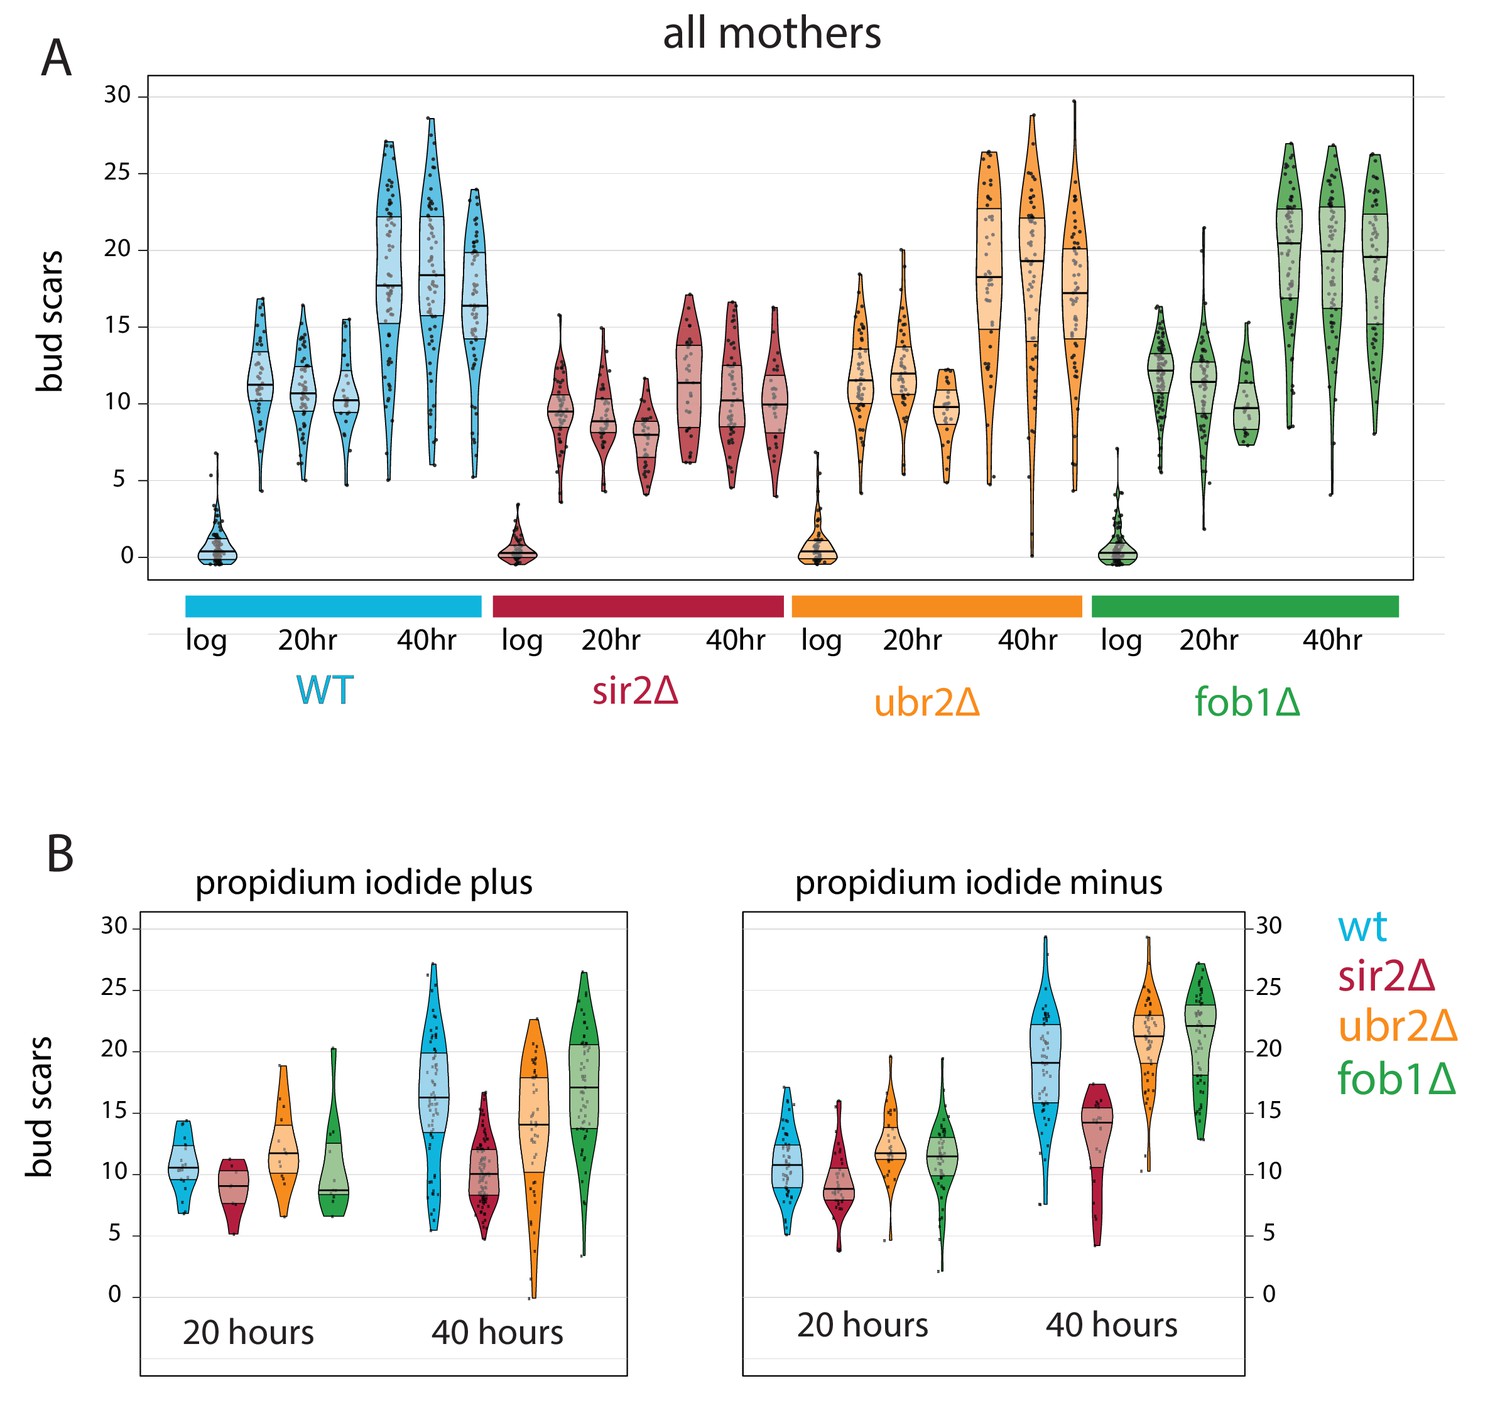
Bud scar counts for MAD collected aged mutants.
(A) Bud scar counts for all yeast mothers cells at each timepoint during triplicate time courses. (B) The same data for replicate number two subset by viability.
Figure 3—figure supplement 4
Strain specific changes in the aging transcriptome of mutant panel.
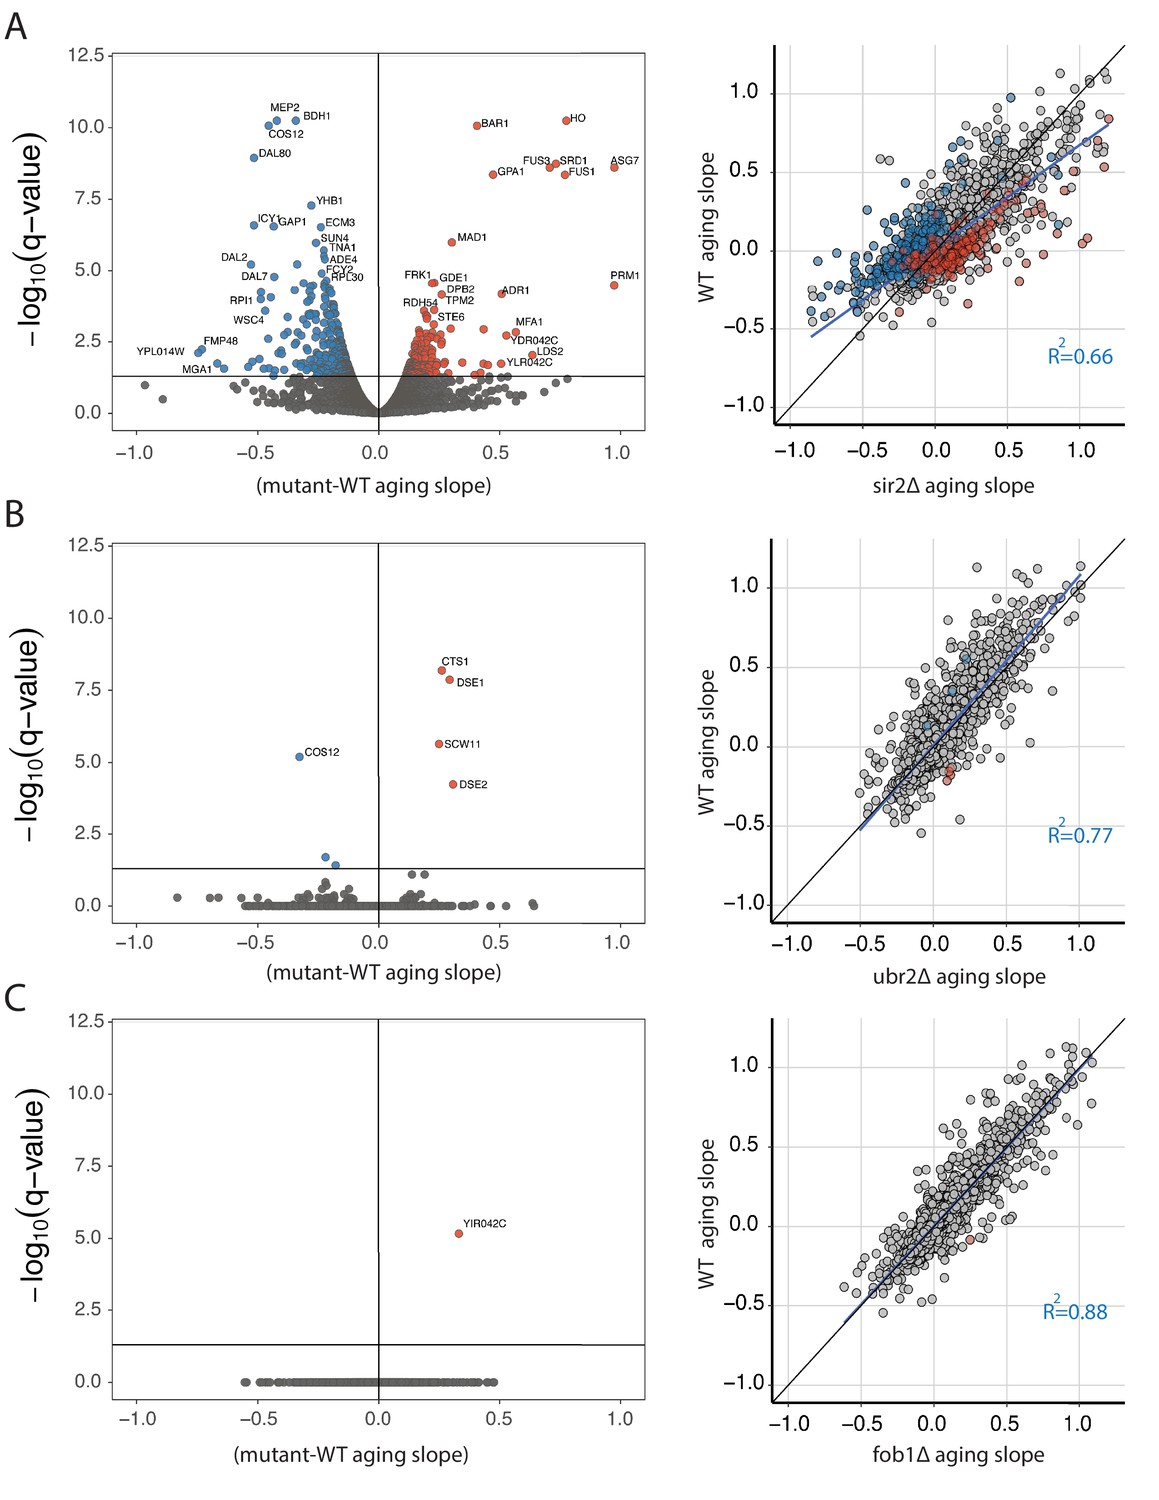
(A) Volcano plot displaying genes that change significantly with age in sir2∆ compared to WT. Color indicates directionality -- blue = decrease, red = increase (left panel). Scatter plot of aging slopes from WT (y -axis) versus sir2∆ (x -axis) with colored points from the volcano plot colored similarly here. Diagonal line in black, regression line in blue (right panel). (B) Same as in (A), but for ubr2∆. (C) Same as in (A), but for fob1∆..
Figure 3—figure supplement 5
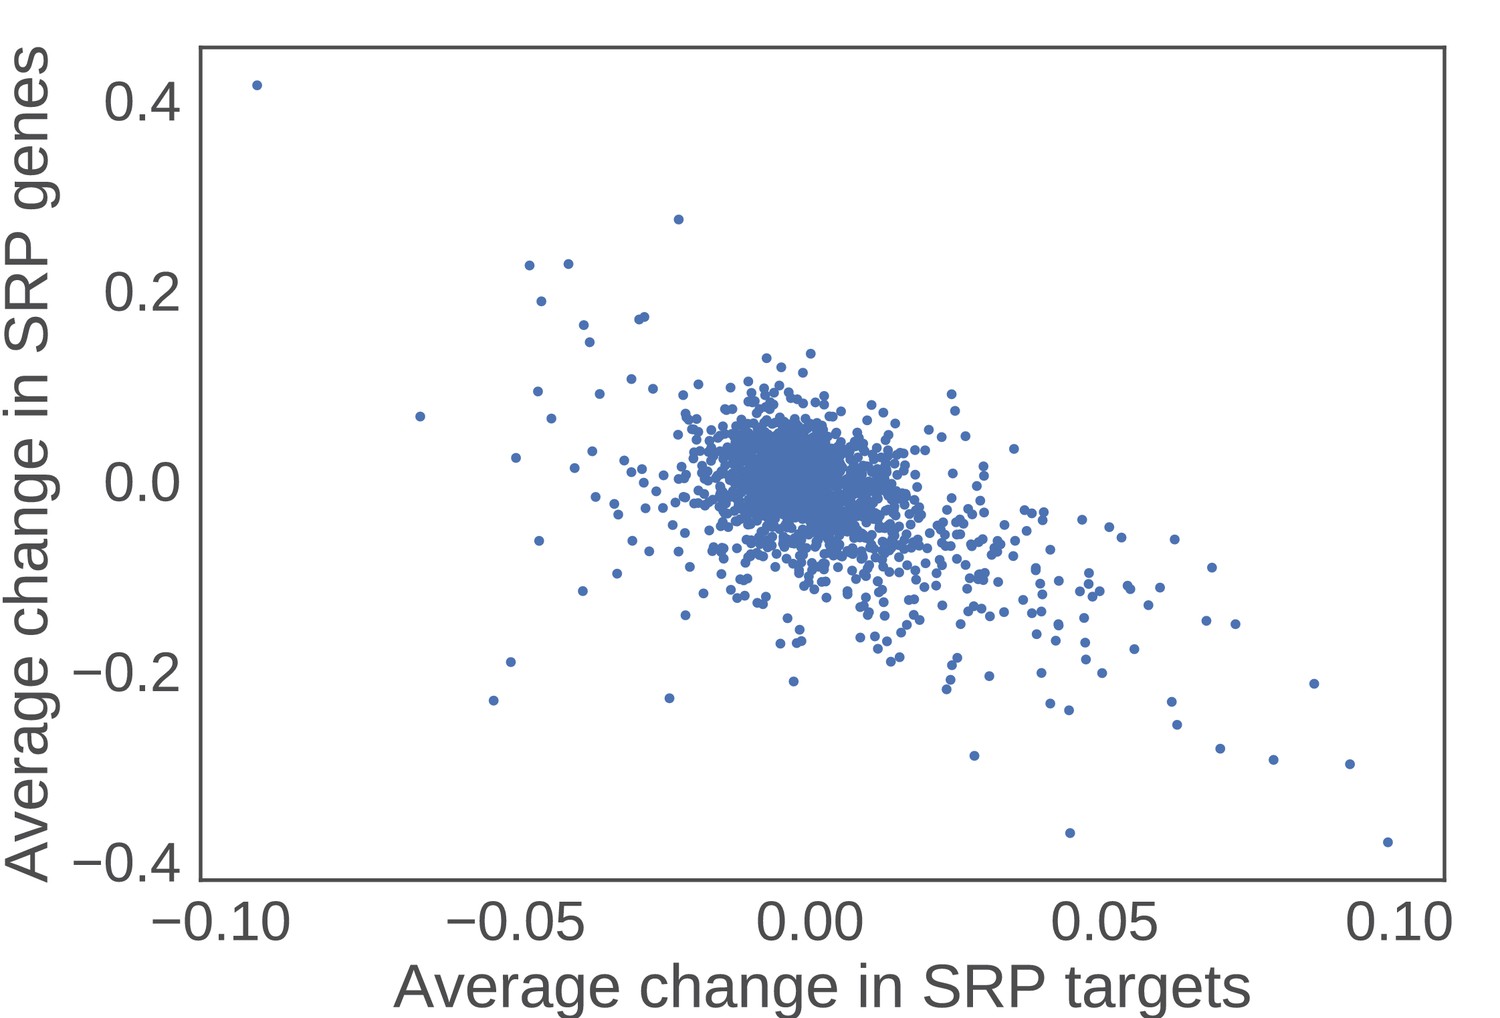
SRP clients increase in expression as a function of decreasing SRP components.
For each perturbation in the Holstege data set, the average change in SRP components was plotted against the average change for all SRP clients. The negative correlation reveals that as SRP components go down in expression, SRP targets go up in expression.
Figure 3—figure supplement 6
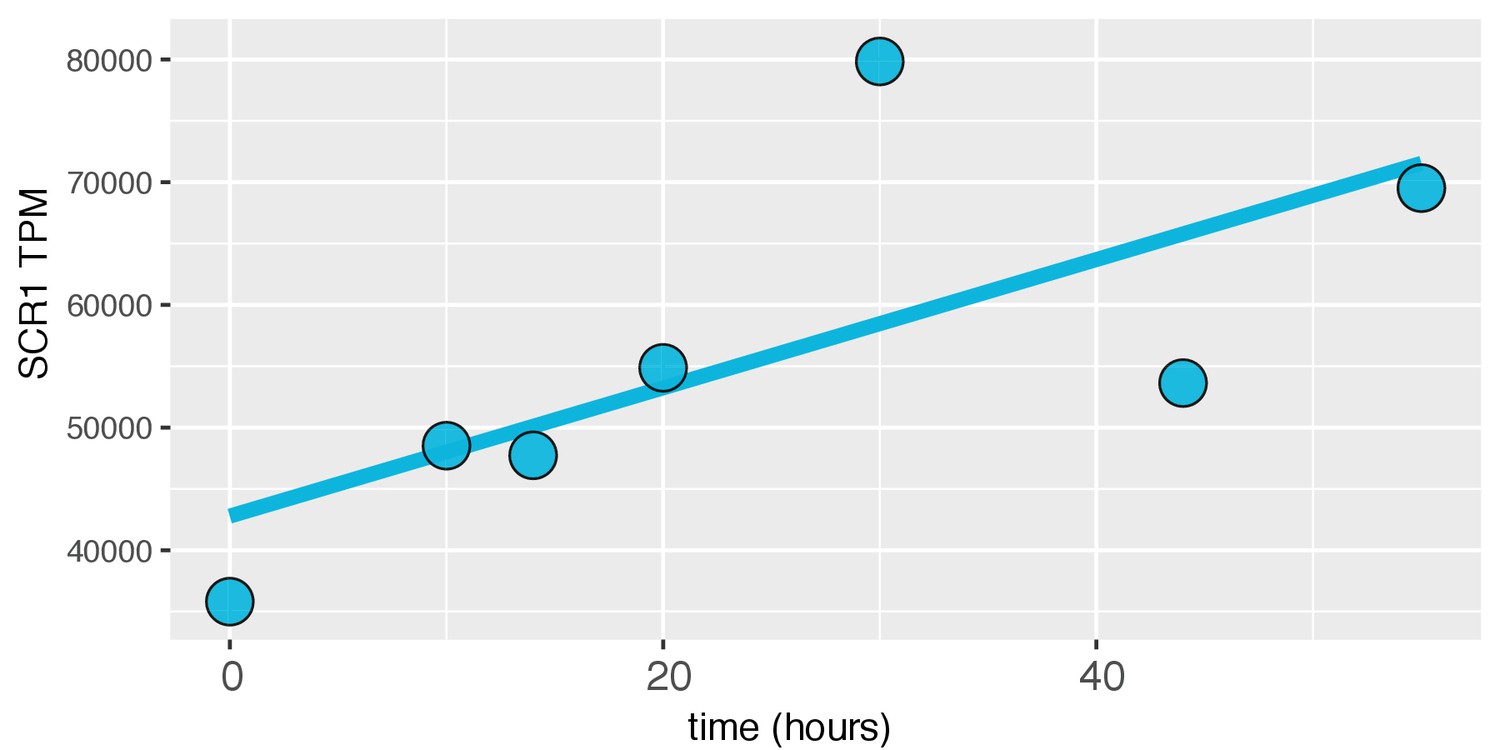
SCR1 expression increases with age in the dense WT time course.
For each timepoint, SCR1 expression in Transcripts per Million (TPM) was plotted.
Figure 3—figure supplement 7
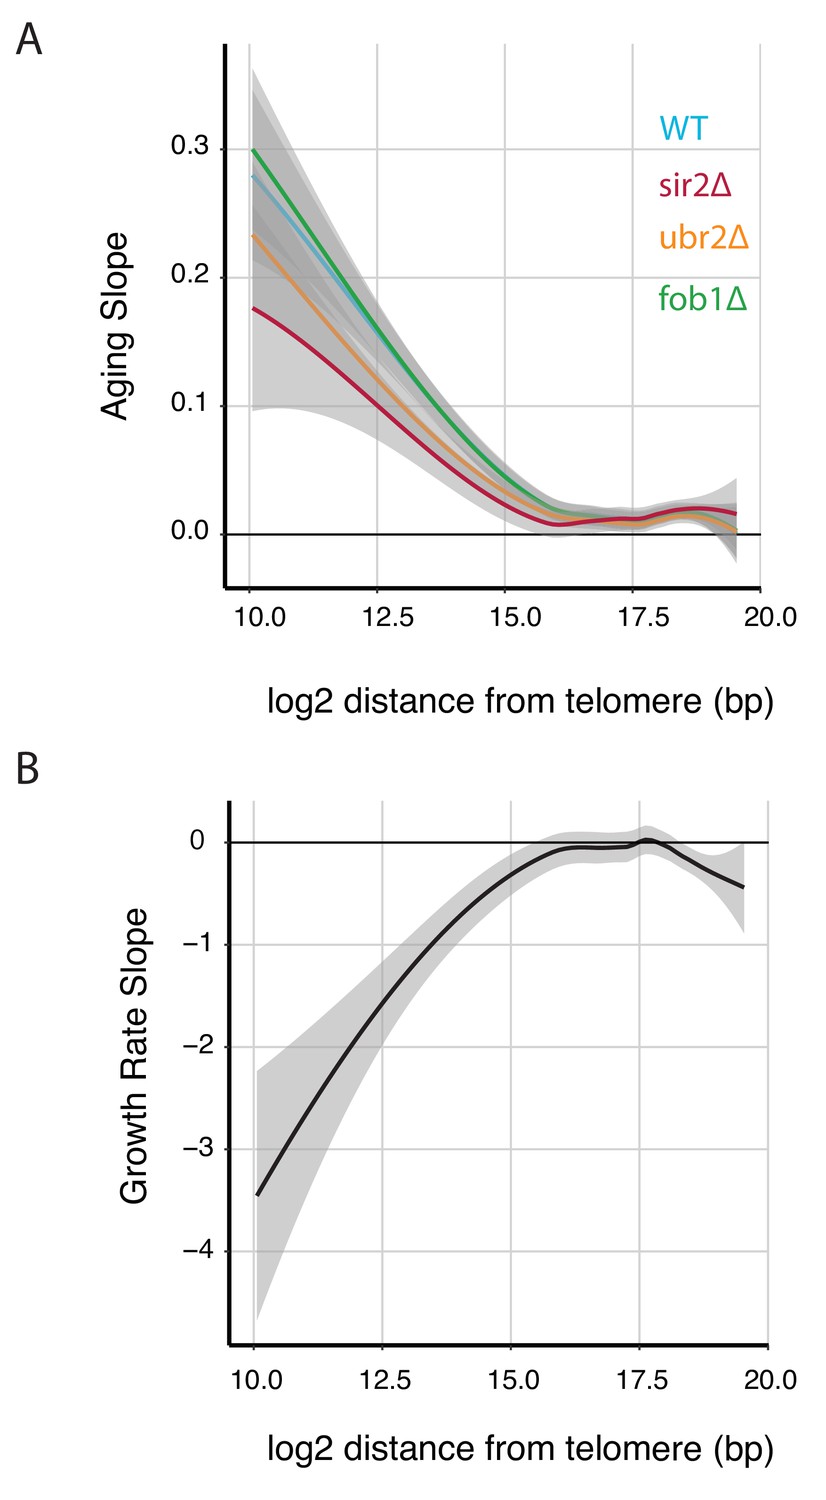
Expression of telomere proximal genes increases with both replicative age and stress.
(A) The Loess fit for aging slope plotted against gene position (relative to telomeres) for all genes from each longevity mutant. (B) The Loess fit for growth rate slope plotted against gene position (relative to telomeres) for all genes measured for each longevity mutant.
Figure 4 with 4 supplements
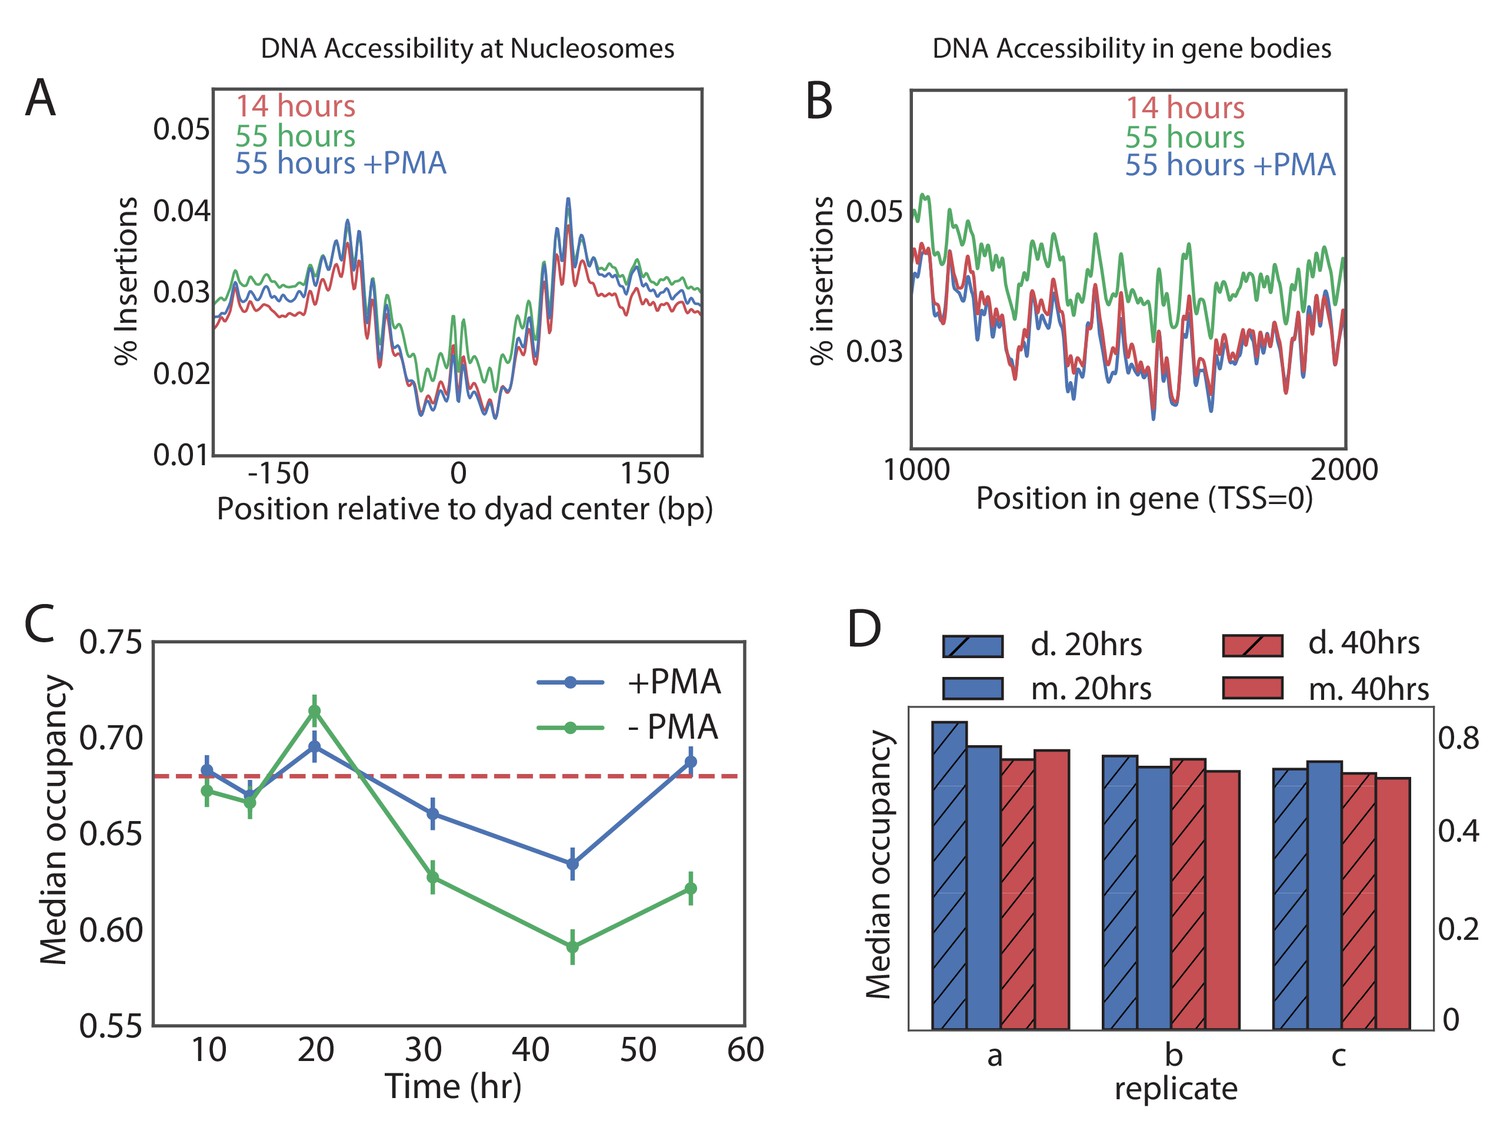
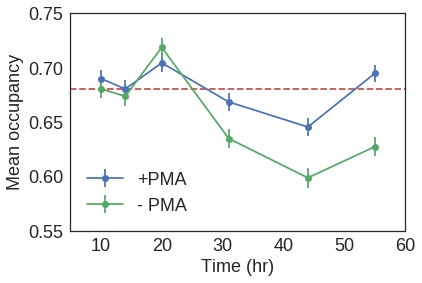
Global nucleosome occupancy remains nearly constant with aging.
(A,B) Tn5 insertion density around well-positioned nucleosomes (A) and 1000 bases downstream of TSS (B) at 14 hr, 55 hr and 55 hr after treatment with PMA. (C) Median nucleosomal occupancy estimated by NucleoATAC on well-positioned nucleosomes in open chromatin at different time points during time course. See Materials and methods for the method of estimation. Error bars represent five standard errors of occupancy. (D) Same as (C) but comparing mothers and daughters during aging time courses - three independent replicates are shown.
Figure 4—figure supplement 1
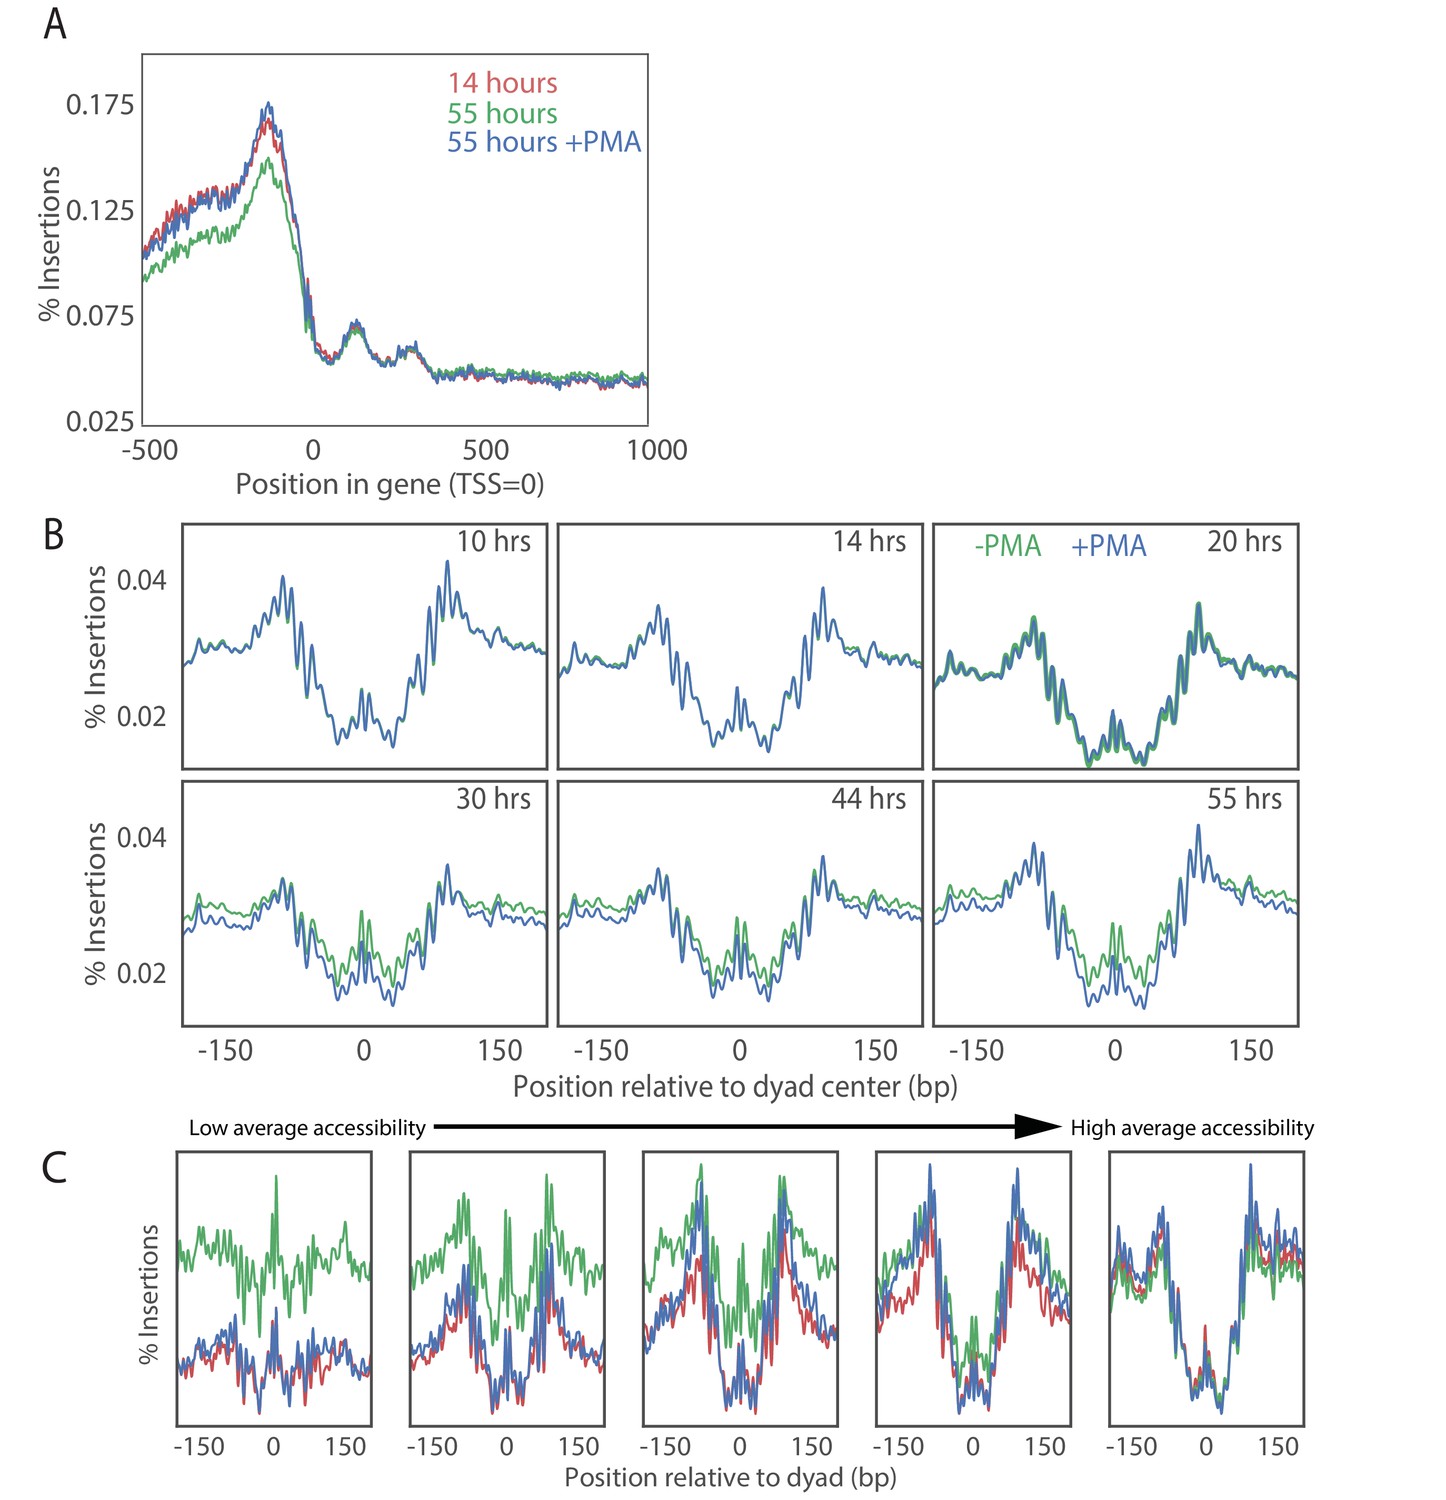
PMA treatment rescues young cell ATAC-seq profile at transcriptional start sites in old cell populations.
(A) Metagene plot of ATAC-seq insertion density for genes aligned at the transcription start sites for young cells (red), old cells (green) and old cells with PMA treated (blue). (B) Effect of PMA is strongest at nucleosomes with low accessibility. We binned nucleosomes into five bins according to their average occupancy and observed that the nucleosomes in the low-accessible regions are affected the most consistent with addition of a constant background to the accessibility signal. (C) Insertion density around well-positioned nucleosomes before and after treatment with PMA at various times along aging time courses.
Figure 4—figure supplement 2
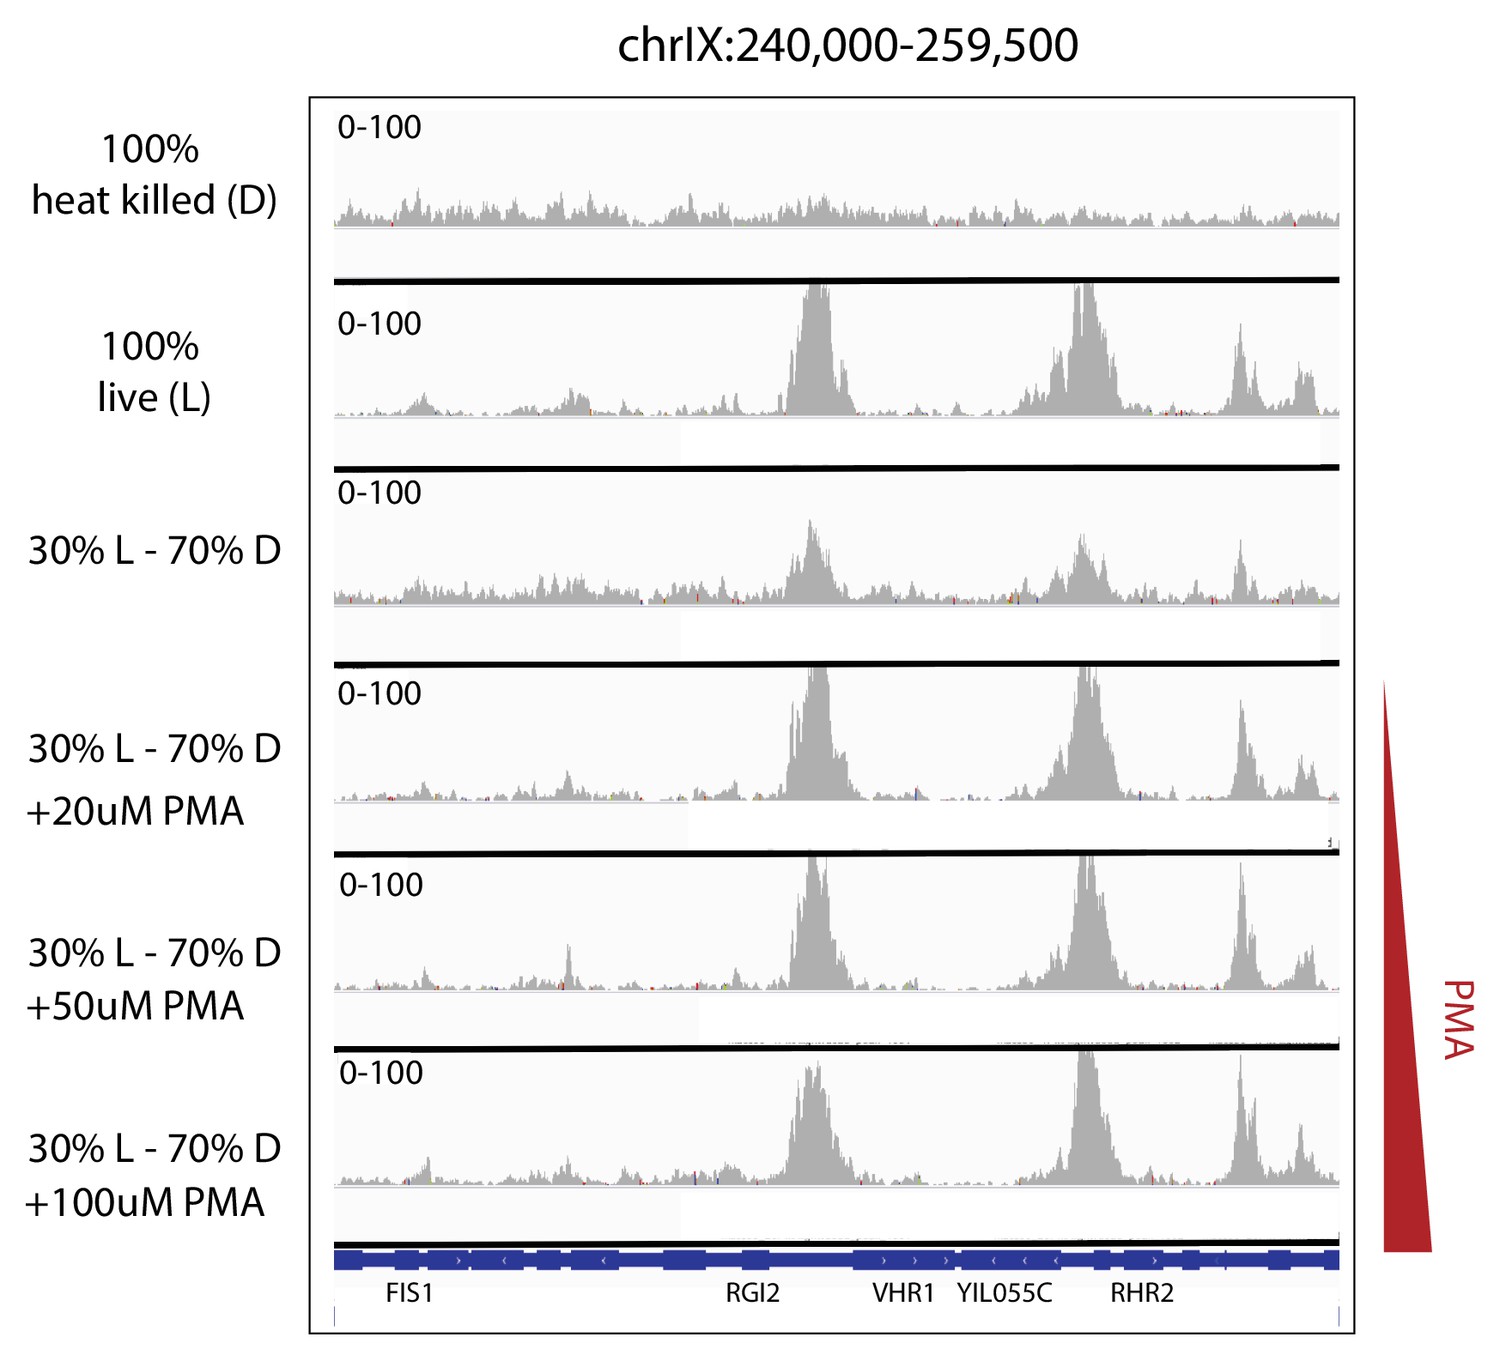
Efficacy of PMA in removing the ATAC-seq signature of heat-killed cells from mixed populations.
Depth-normalized ATAC-seq coverage was plotted at specific locus to illustrate the lack of structure in ATAC-seq data from heat-killed cells (top panel) and that treatment with PMA effectively rescues live cell signal from a mixed live/dead population over a range of concentrations (panels 2–6).
Figure 4—figure supplement 3
Mean nucleosomal occupancy estimated by NucleoATAC on well-positioned nucleosomes in open chromatin.
https://doi.org/10.7554/eLife.39911.029
Figure 4—figure supplement 4
ATAC-seq analysis.
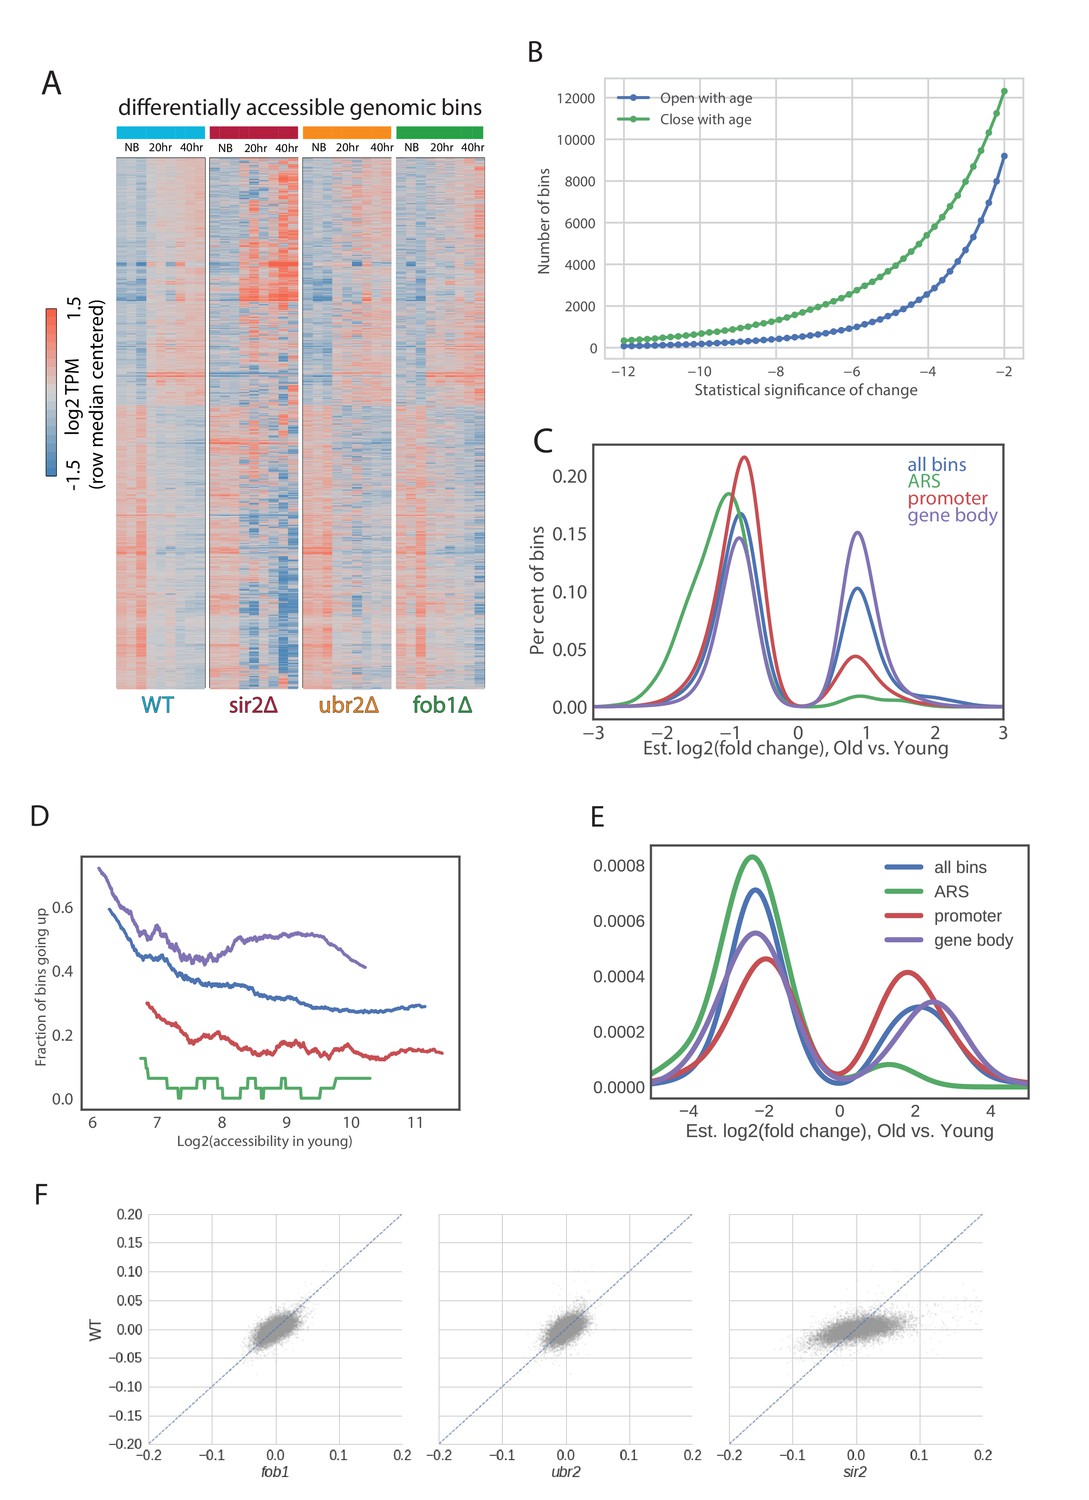
(A) Multiple local changes in chromatin during aging. We show a hierarchically clustered heatmap of bins that significantly change with age (newborn cells at 20 hr (NB), 20 hr of aging and 40 hr of aging) in all profiled strains (see Materials and methods). (B) Number of genomic bins significantly changing accessibility with age at each threshold of significance. (C) Distributions of fold changes of significantly changing bins that are in promoters, gene bodies, origins of replications and everywhere. Note that almost all significantly changing bins in ARSes (250) decrease in accessibility with age. (D) Differences in patterns of changes of accessibility between promoters, gene bodies and origins of replication can’t be explained by average initial accessibility of each genomic location type. We binned each type of genomic locations into bins according to accessibility in Log phase and asked what proportion of bins with this level of accessibility go up in each type of genomic location. Notably, at the same level of accessibility ARSes tend to close the strongest. (E) Closure of ARSes in metabolic cycle. Shown are changes in occupancy similar in transition from RB to OX phase of the metabolic cycle (data from [Gowans et al., 2018]). Similar to (C). (F) Comparisons of aging slopes of genomic bins between mutants.
Figure 5
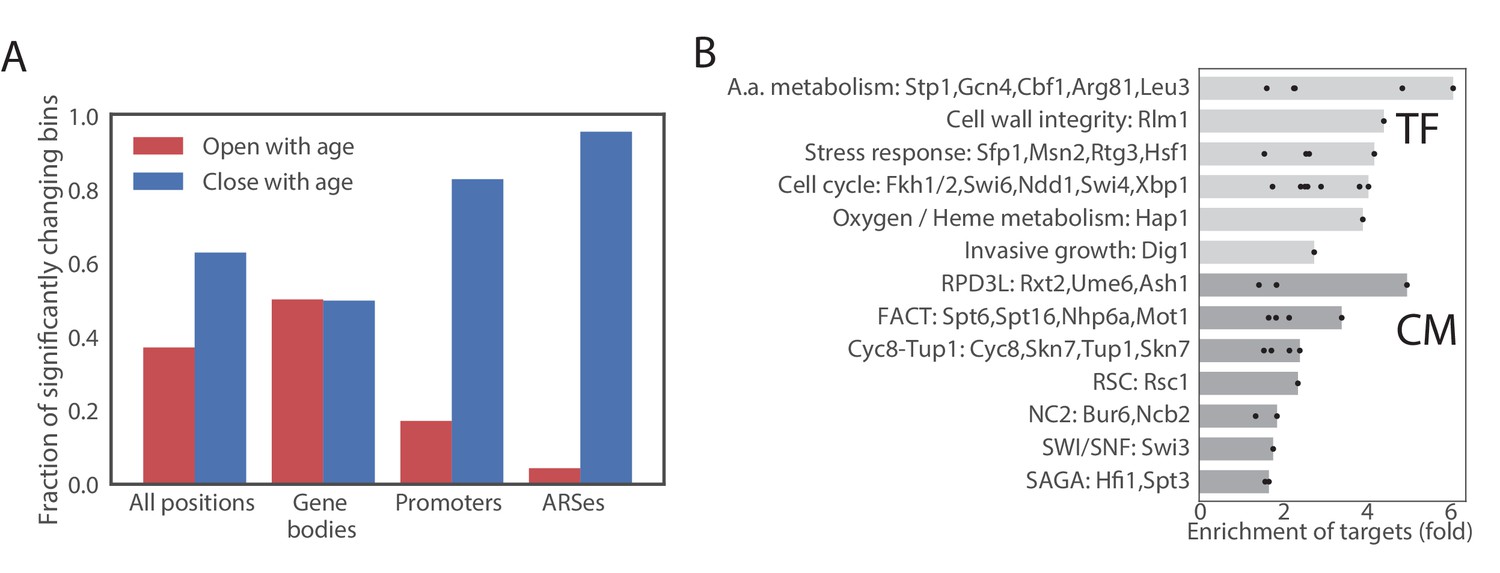
Age-dependent changes in chromatin accessibility.
(A) Fraction of significantly changing bins that are opening or closing with age in each part of a genome. (B) Enrichments of genes regulated by particular transcription factors (TF) and chromatin modifiers (CM) among genes that contain bins that open with age. TFs/CMs are ordered in the order of increasing fold-enrichment and the bar marks the maximal fold-enrichment of a factor in the group.
Figure 6
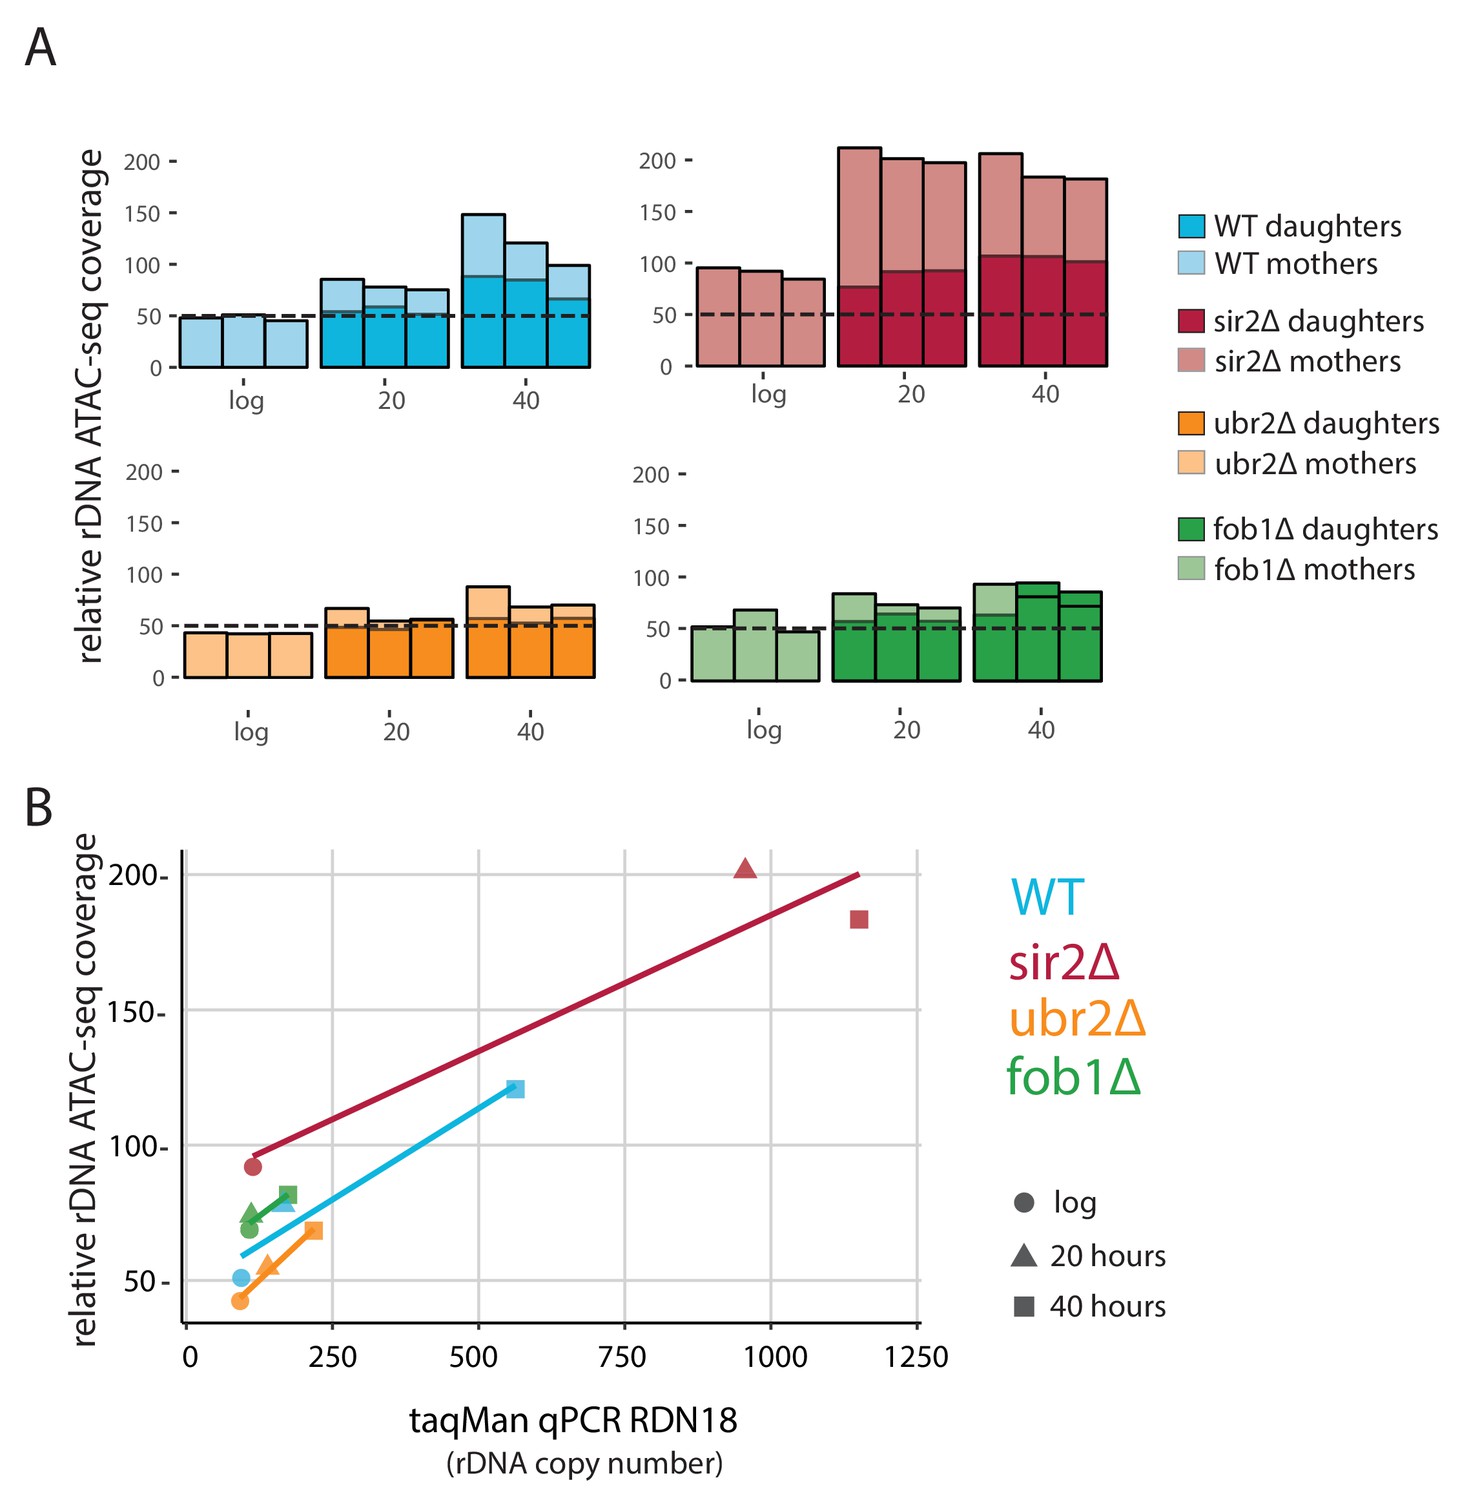
fob1∆ and ubr2∆ reduce age-dependent rDNA instability.
(A) Percent relative (to non-repetitive genome) ATAC-seq insertional density at the rDNA locus at increasing ages in both mother and daughter cells of WT and longevity mutants. Bars are ‘layered’ with data from daughter cells (opaque) displayed on top of data from mother cells (semi-transparent). Three independent replicates are shown. (B) Comparing relative rDNA ATAC-seq insertional density (y-axis) to relative rDNA copy number using TaqMan assay (x-axis) for multiple strains.
-
Figure 6—source data 1
TaqMan primers and amplicons.
- https://doi.org/10.7554/eLife.39911.033
Figure 7
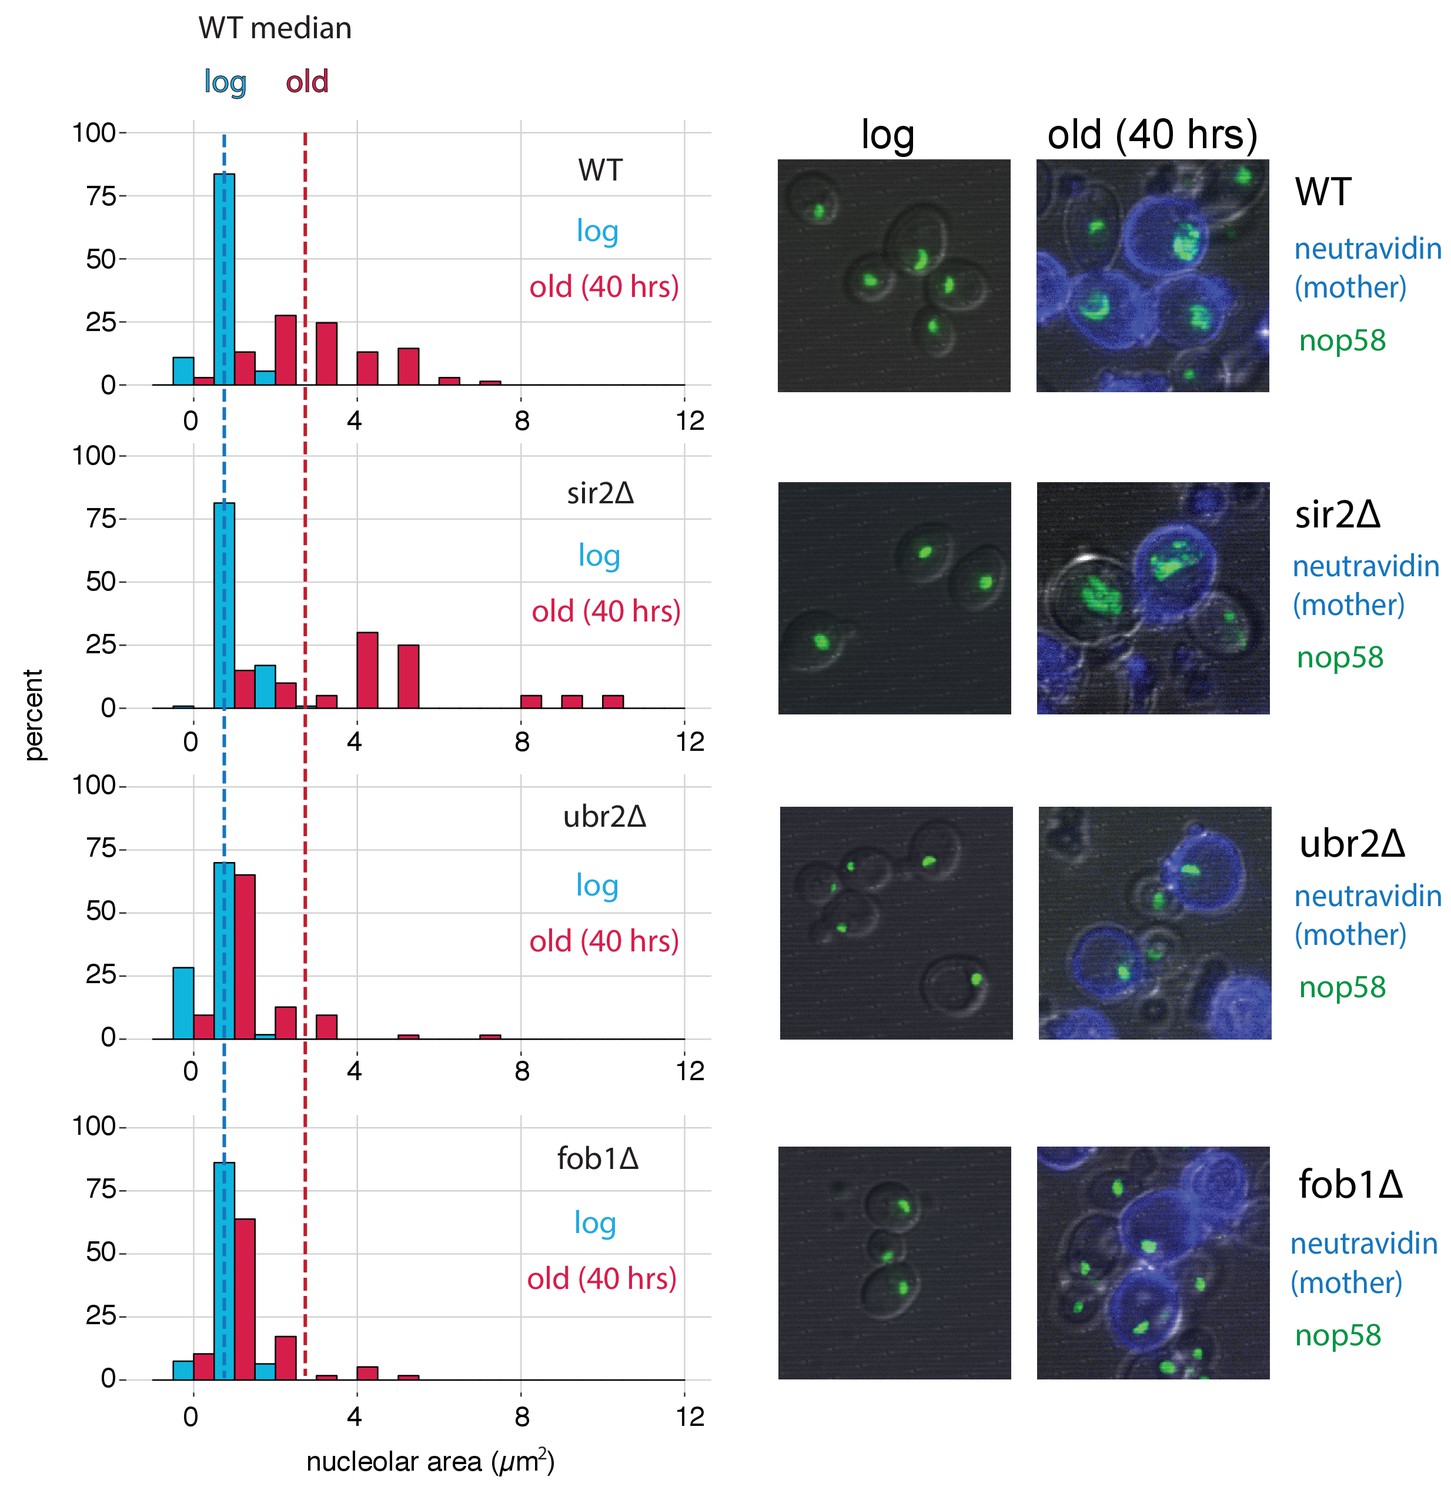
fob1∆ and ubr2∆ reduce age-dependent nucleolar fragmentation.
(left) Nucleolar sizes in young (log) and old (40 hr) mother cells (displayed in blue and red, respectively) across multiple genotypes. (right) Visualization of nucleoli from young and old cells across genotypes (fob1∆: nold = 59, nyoung = 94; ubr2∆: nold = 64, nyoung = 115; sir2∆: nold = 20, nyoung = 119; WT: nold = 70, nyoung = 55).
Appendix 1–figure 1

(A) ATAC-seq insertional density at the biotin gene locus of ministat-aged cultures. (B) RNA-seq analysis of biotin genes at increasing ages from this manuscript and Janssens et al. (C) Biotin synthesis from DAPA in yeast. (D) Growth curves of DBY12000 in different media. AS and BW are two separate media preparations lacking biotin.
Appendix 1–figure 2

(A) ATAC-seq insertional density increases with age at Ty1 loci in both biotin and DAPA (B) Ty1 expression increases with old age in both biotin and DAPA. (C) Age-related gene expression changes are similar in media containing biotin or DAPA.
Additional files
-
Source data 1
RNA-seq data from dense aging time course.
- https://doi.org/10.7554/eLife.39911.036
-
Source data 2
RNA-seq data from aging times shown in Figure 3.
- https://doi.org/10.7554/eLife.39911.037
-
Source data 3
ATAC-seq data.
- https://doi.org/10.7554/eLife.39911.038
-
Source data 4
Transcription factors associated with genomic regions that change accessibility with age.
- https://doi.org/10.7554/eLife.39911.039
-
Supplementary file 1
MAD system setup manual
- https://doi.org/10.7554/eLife.39911.035
-
Transparent reporting form
- https://doi.org/10.7554/eLife.39911.040
Download links
A two-part list of links to download the article, or parts of the article, in various formats.
Downloads (link to download the article as PDF)
Open citations (links to open the citations from this article in various online reference manager services)
Cite this article (links to download the citations from this article in formats compatible with various reference manager tools)
A new experimental platform facilitates assessment of the transcriptional and chromatin landscapes of aging yeast
eLife 7:e39911.
https://doi.org/10.7554/eLife.39911


