Plasmodium-specific atypical memory B cells are short-lived activated B cells
- The Francis Crick Institute, United Kingdom
- MRC National Institute for Medical Research, United Kingdom
- University of Alabama at Birmingham, United States
- The University of Edinburgh, United Kingdom
Figures
Figure 1 with 2 supplements
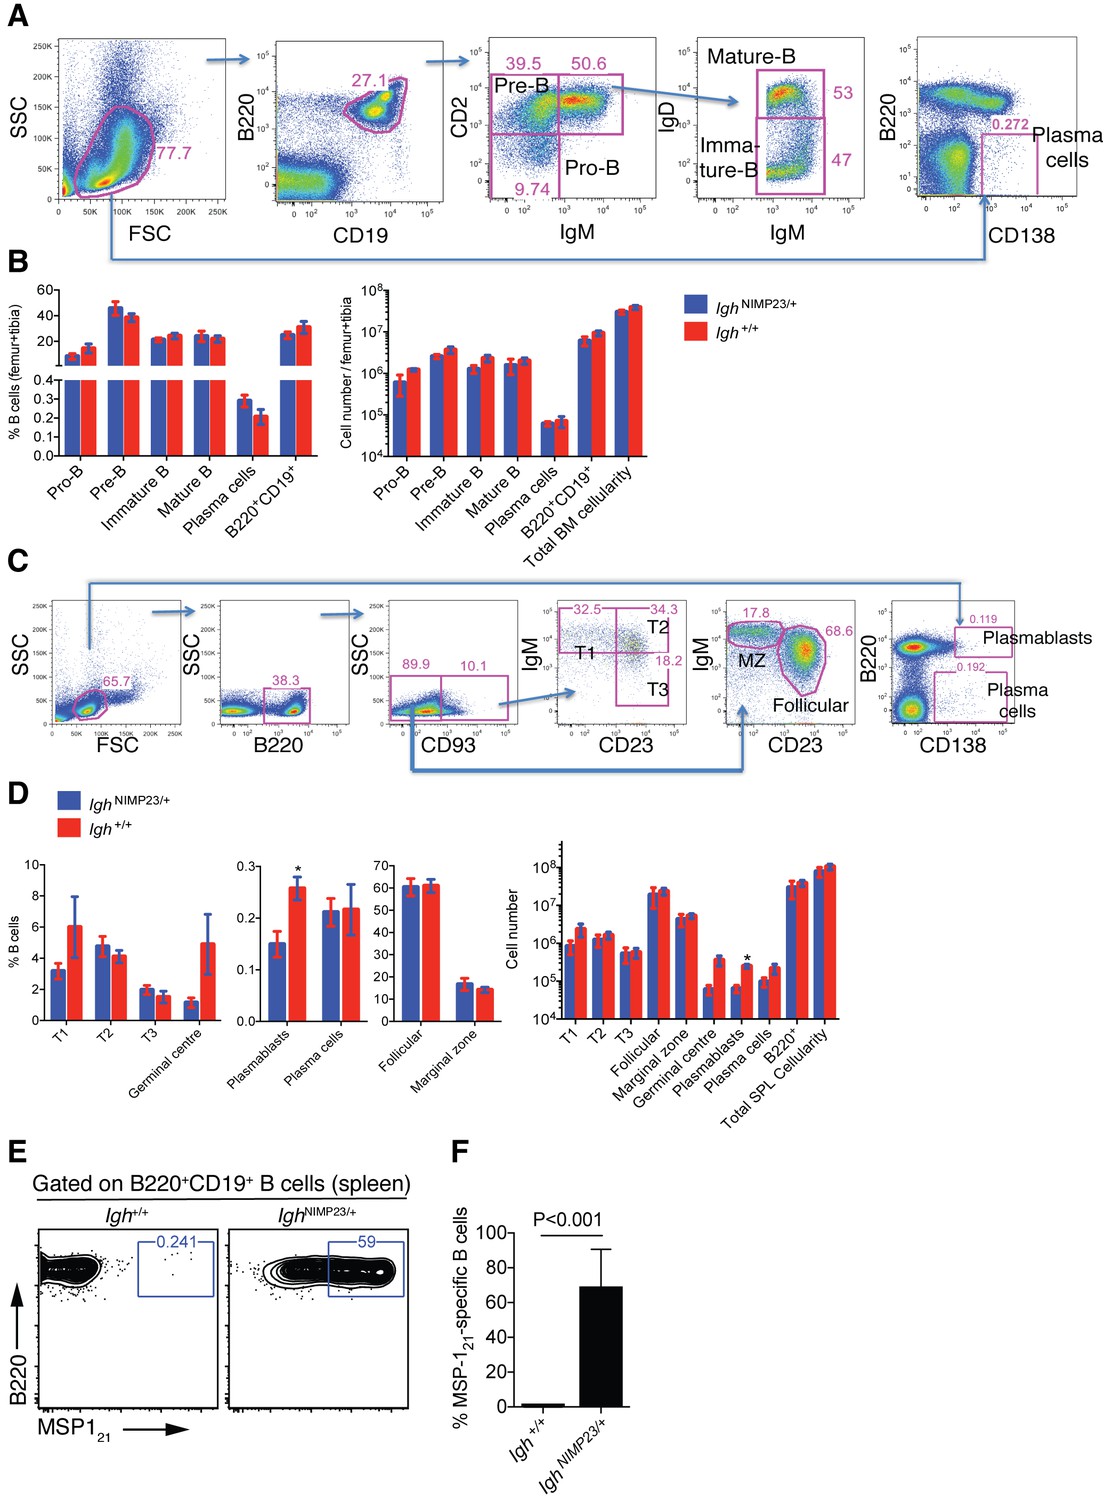
Analysis of total bone marrow and splenic B-cell populations in IghNIMP23/+ and Igh+/+littermates.
(A) Flow cytometry gating strategy to identify different B-cell populations in bone marrow of IghNIMP23/+ mice. Arrows indicate flow of analysis. The same strategy was used for Igh+/+ littermates. (B) Percentages and numbers of different B-cell populations in bone marrow of IghNIMP23/+ and Igh+/+ littermates as defined in (A). (C) Flow cytometry gating strategy to identify different B-cell populations in spleen of IghNIMP23/+ mice. (D) Percentages and numbers of different B-cell populations in spleen of IghNIMP23/+ and Igh+/+ littermates as defined in (C). Data are representative of two independent experiments with four mice per group. (E) Flow cytometry analysis of B cells obtained from spleen of Igh+/+ (left) and IghNIMP23/+ (right) mice stained with anti-B220 and CD19 antibodies in combination with an MSP121 fluorescent probe. The gates show the frequency of B cells specific to MSP121. (F) Frequencies of MSP121-specific splenic B cells in IghNIMP23/+ and wild-type Igh+/+ littermate controls (Mann Whitney U test). Data pooled from two independent experiments with 3–5 mice per group. Mann Whitney U test. *p<0.05. Error bars are SEM.
Figure 1—figure supplement 1
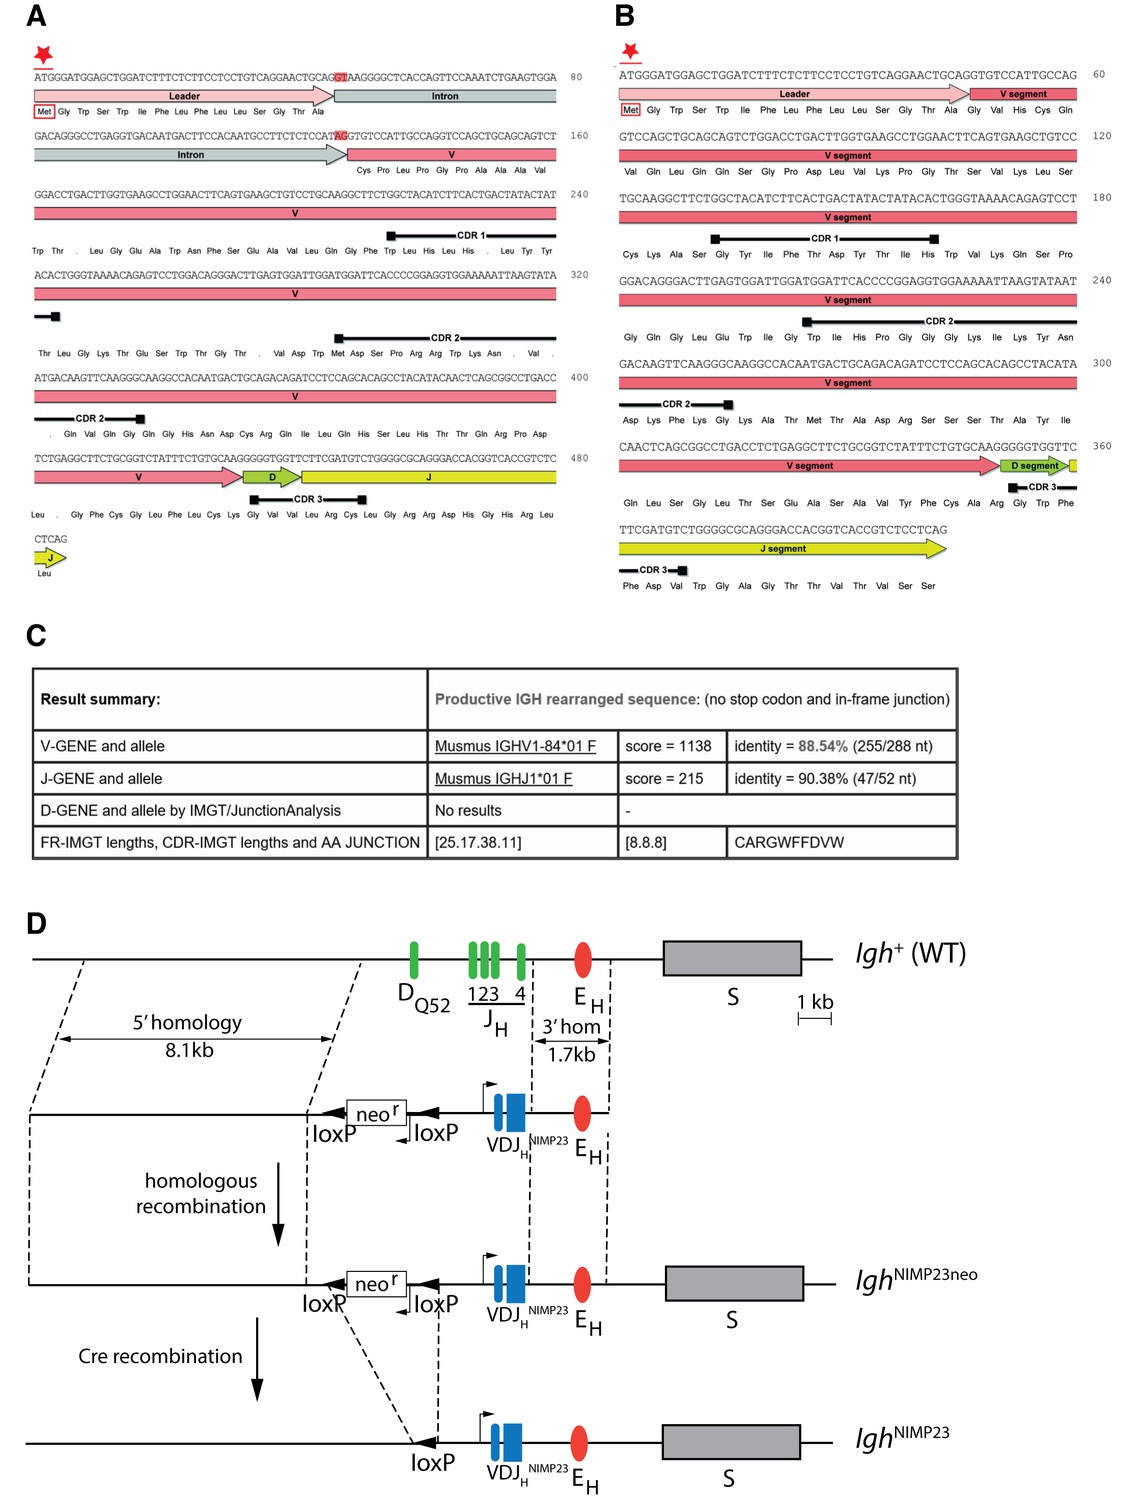
Generation of IghNIMP23/+knock in mice.
Annotated DNA and corresponding amino acid sequence of VDJHNIMP23 obtained from (A) gDNA including the Leader-V intron and (B) cDNA, of the NIMP23 hybridoma: start Methionine (Met) indicated by red star, intron splice donor and acceptor sites highlighted in red, dots indicate STOP codons, black bars indicate predicted complementarity determining regions according to the Kabat database (Johnson and Wu, 2001) (C) IMGT/V-Quest mouse Ig database (Lefranc et al., 1999) comparative analysis result summary of the gDNA derived VDJHNIMP23 sequence reveals the identity of the closest matching endogenous V and J genes (D) Schematic representation of (Igh+) Endogenous IgH locus showing the 4 JH segments, the DQ52 element, the Igh intronic enhancer (EH), the switch region for the constant µ gene (S), and (below) targeting construct indicating 5’ and 3’ homology arms and the inverted loxP-neor-loxP cassette and rearranged VDJHNIMP23 variable heavy chain region gene of the NIMP23 hybridoma, replacing DQ52 and all four JH segments of the endogenous IgH gene. IghNIMP23neo: Targeted Igh locus after homologous recombination. IghNIMP23: Final allele after Cre-mediated removal of neor.
Figure 1—figure supplement 2
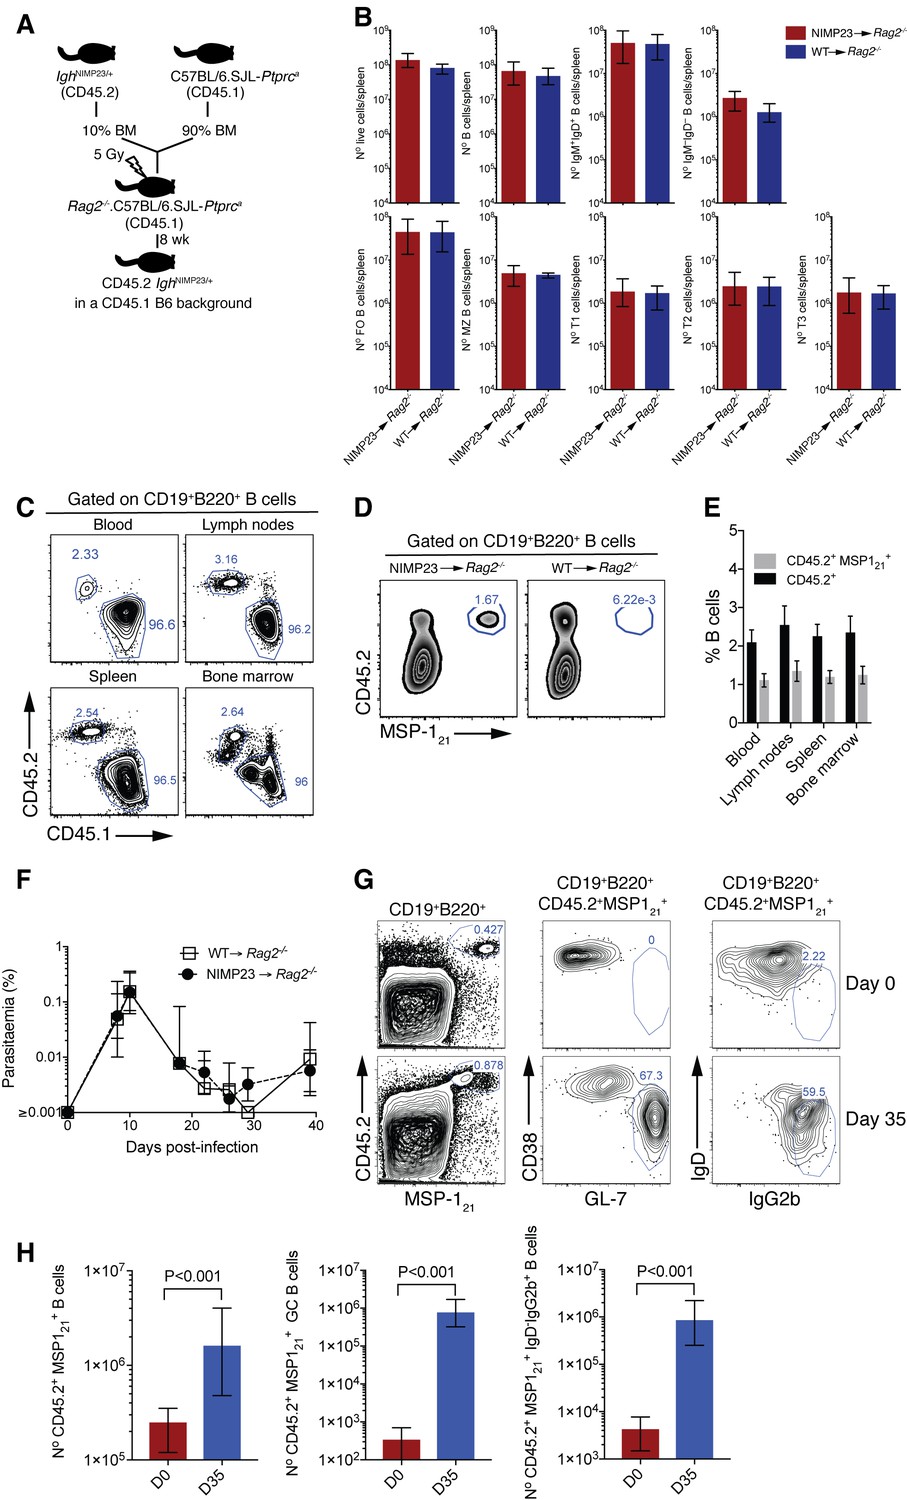
Generation of mixed bone marrow chimera model with reduced precursor frequency of IghNIMP23/+ B cells to study MSP121-specific B cell responses during P. chabaudi infection.
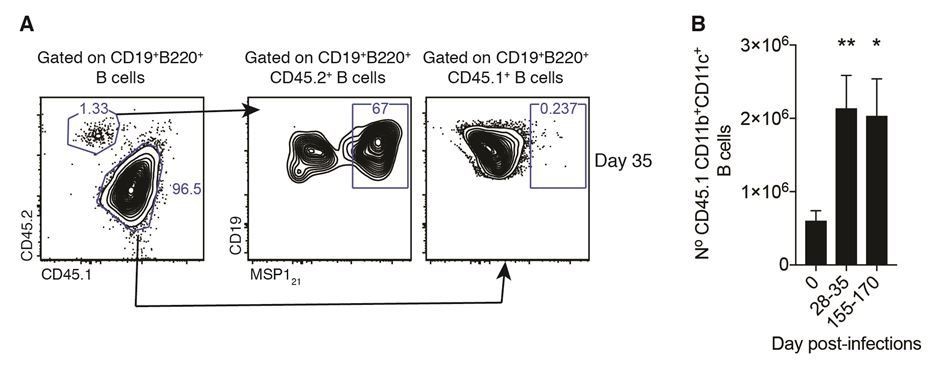
(A) Experimental strategy to generate mixed bone marrow chimeric mice. (B) Numbers of different splenic B-cell populations defined by flow cytometry in Rag2-/-.C57BL/6.SJL-Ptprca mice reconstituted with a mixture of IghNIMP23/+ and C57BL/6.SJL-Ptprca bone marrow in a 10:90 ratio (NIMP23→ Rag2-/-), and control mice reconstituted with C57BL/6.SJL-Ptprca bone marrow (WT→ Rag2-/-). Mann Whitney U test. Error bars are SEM. Data are representative of two independent experiments with five mice per group. (C) Flow cytometry of B cells obtained from different tissues of NIMP23→Rag2-/- chimeric mice. Gates show frequencies of CD45.1+CD45.2- and CD45.1-CD45.2+ (D) Flow cytometry of B cells obtained from spleen of NIMP23→Rag2-/- and WT→Rag2-/- control chimeric mice. Gates show frequencies of MSP121-specific B cells as determined by CD45.2 vs MSP121 staining. (E) Frequencies of CD45.1-CD45.2+ (black) and CD45.2+MSP121+ (grey) B cells as gated in C and D, obtained from different organs of NIMP23→Rag2-/- chimeric mice. (F) Blood-stage P. chabaudi parasitemia following mosquito transmission in NIMP23→Rag2-/- and WT→Rag2-/- control chimeric mice. (G) Flow cytometry data showing frequencies of MSP121-specific GC (CD38loGL-7hi) and class-switched (IgD—IgG2bhi) B cells in the spleen of NIMP23→Rag2-/- chimeric mice before infection (day 0) and at day 35 post-mosquito transmitted P. chabaudi infection. (H) Numbers of MSP121-specific B cells, GC and class-switched B cells in the spleen of NIMP23→Rag2-/- chimeric mice as gated in B and E. Mann Whitney U test. Error bars are SEM. Data representative of two independent experiments with 3–7 mice per group.
Figure 2
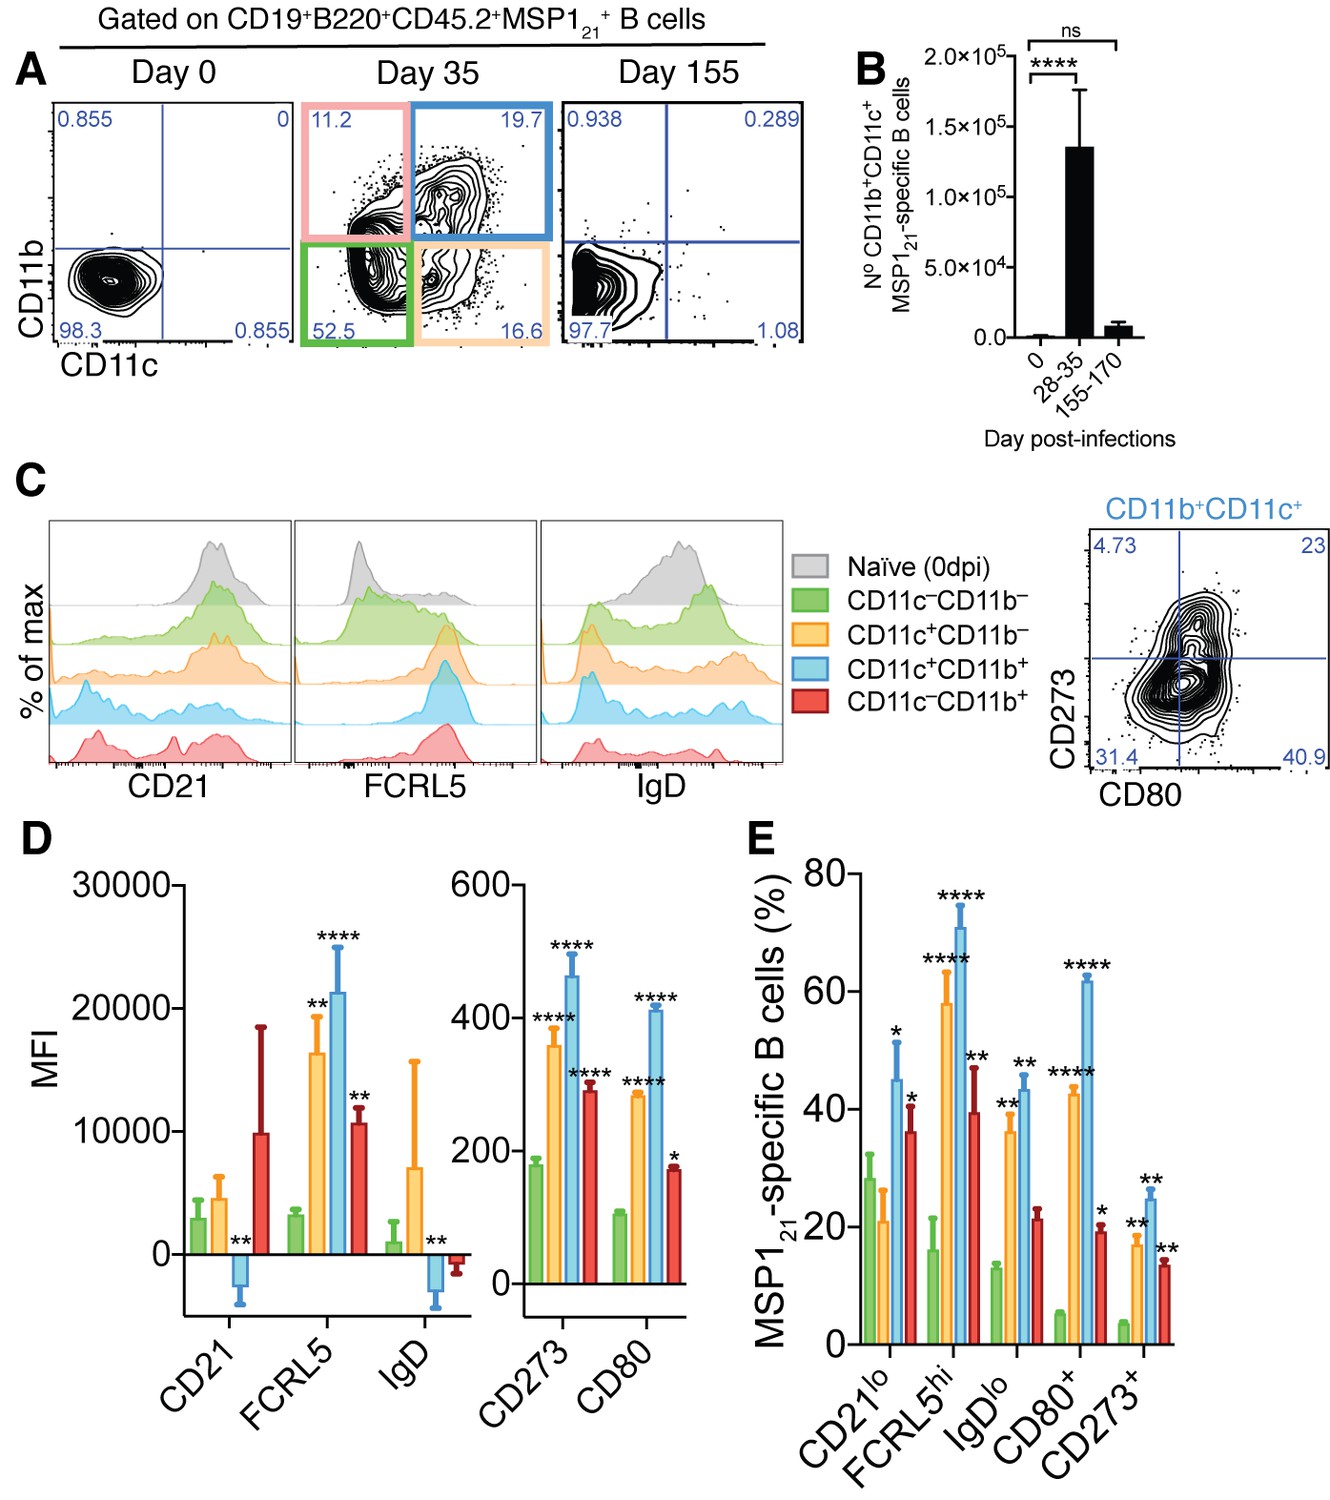
Generation of MSP121-specific AMB in response to mosquito transmitted P.chabaudi infection.
(A) Flow cytometry showing differential expression of CD11b and CD11c on splenic MSP121-specific B cells from NIMP23→Rag2-/- chimeric mice before infection (day 0) and at 35 and 155dpi. (B) Numbers of splenic MSP121-specific CD11b+CD11c+ AMB from NIMP23→Rag2-/- during the course of mosquito transmitted P. chabaudi infection. Kruskal-Wallis test vs day 0. ****, p<0.0001 (C) Flow cytometry showing expression of CD21/35, FCRL5, IgD, CD273 and CD80 on different subsets of splenic MSP121-specific B cells from NIMP23→Rag2-/- chimeric mice defined based on CD11b and CD11c expression at 35dpi. (D) Geometric mean fluorescence intensity (MFI) of CD21/35, FCRL5, IgD, CD273 and CD80 expression on different subsets of splenic MSP121-specific B cells from NIMP23→Rag2-/- chimeric mice defined based on CD11b and CD11c expression at 35dpi. (E) Frequencies of CD21/35, FCRL5, IgD, CD273 and CD80 positive cells among different subsets of splenic MSP121-specific B cells from NIMP23→Rag2-/- chimeric mice defined based on CD11b and CD11c expression at 35dpi. Two-way ANOVA vs CD11b-CD11c- subset. *p<0.05; **p<0.01, ***p<0.001; ****p<0.0001. Error bars are SEM. Data pooled from three independent experiments with 3–5 mice per group.
Figure 3 with 2 supplements
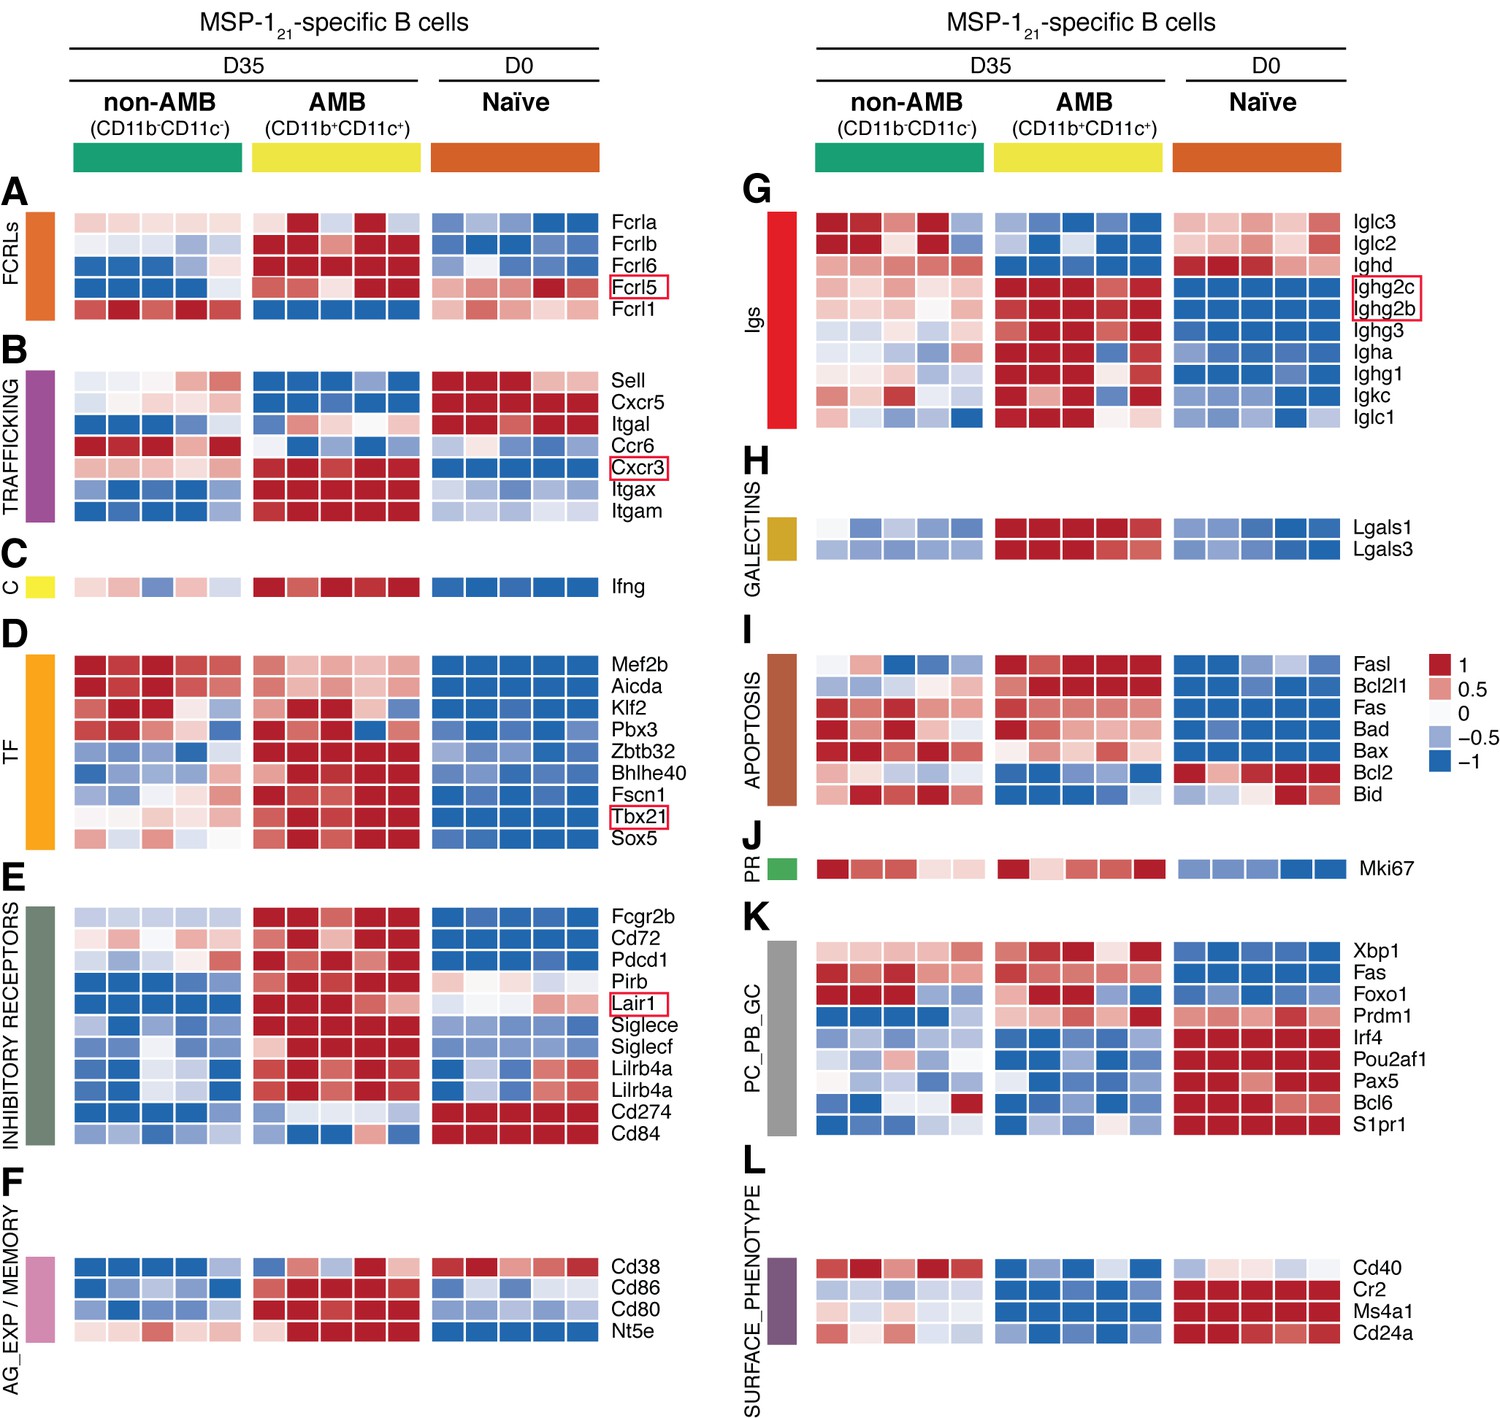
Transcriptome analysis of sorted splenic MSP121-specific CD11b+CD11c+AMB.
MSP121-specific CD11b+CD11c+ (AMB) and CD11b—CD11c— B cells were flow cytometry sorted from the spleen of NIMP23→Rag2-/- chimeric mice at 35dpi; MSP121-specific B cells were flow cytometry sorted from the spleen of naïve NIMP23→Rag2-/-, and these three B cell populations were submitted to mRNAseq analysis. The heat maps display level of expression of selected individual genes, organized in functional clusters related to (A) Fc receptor like molecules, (B) cell trafficking, (C) cytokines, (D) transcription factors, (E) inhibitory receptors, (F) antigen experience/memory, (G) immunoglobulins, (H) galectins, (I) apoptosis, (J) proliferation, (K) plasma cells/plasmablasts/germinal centers, (L) surface markers. Each column corresponds to data from an individual mouse (n = 5 35 dpi, n = 5 0 dpi).
Figure 3—figure supplement 1
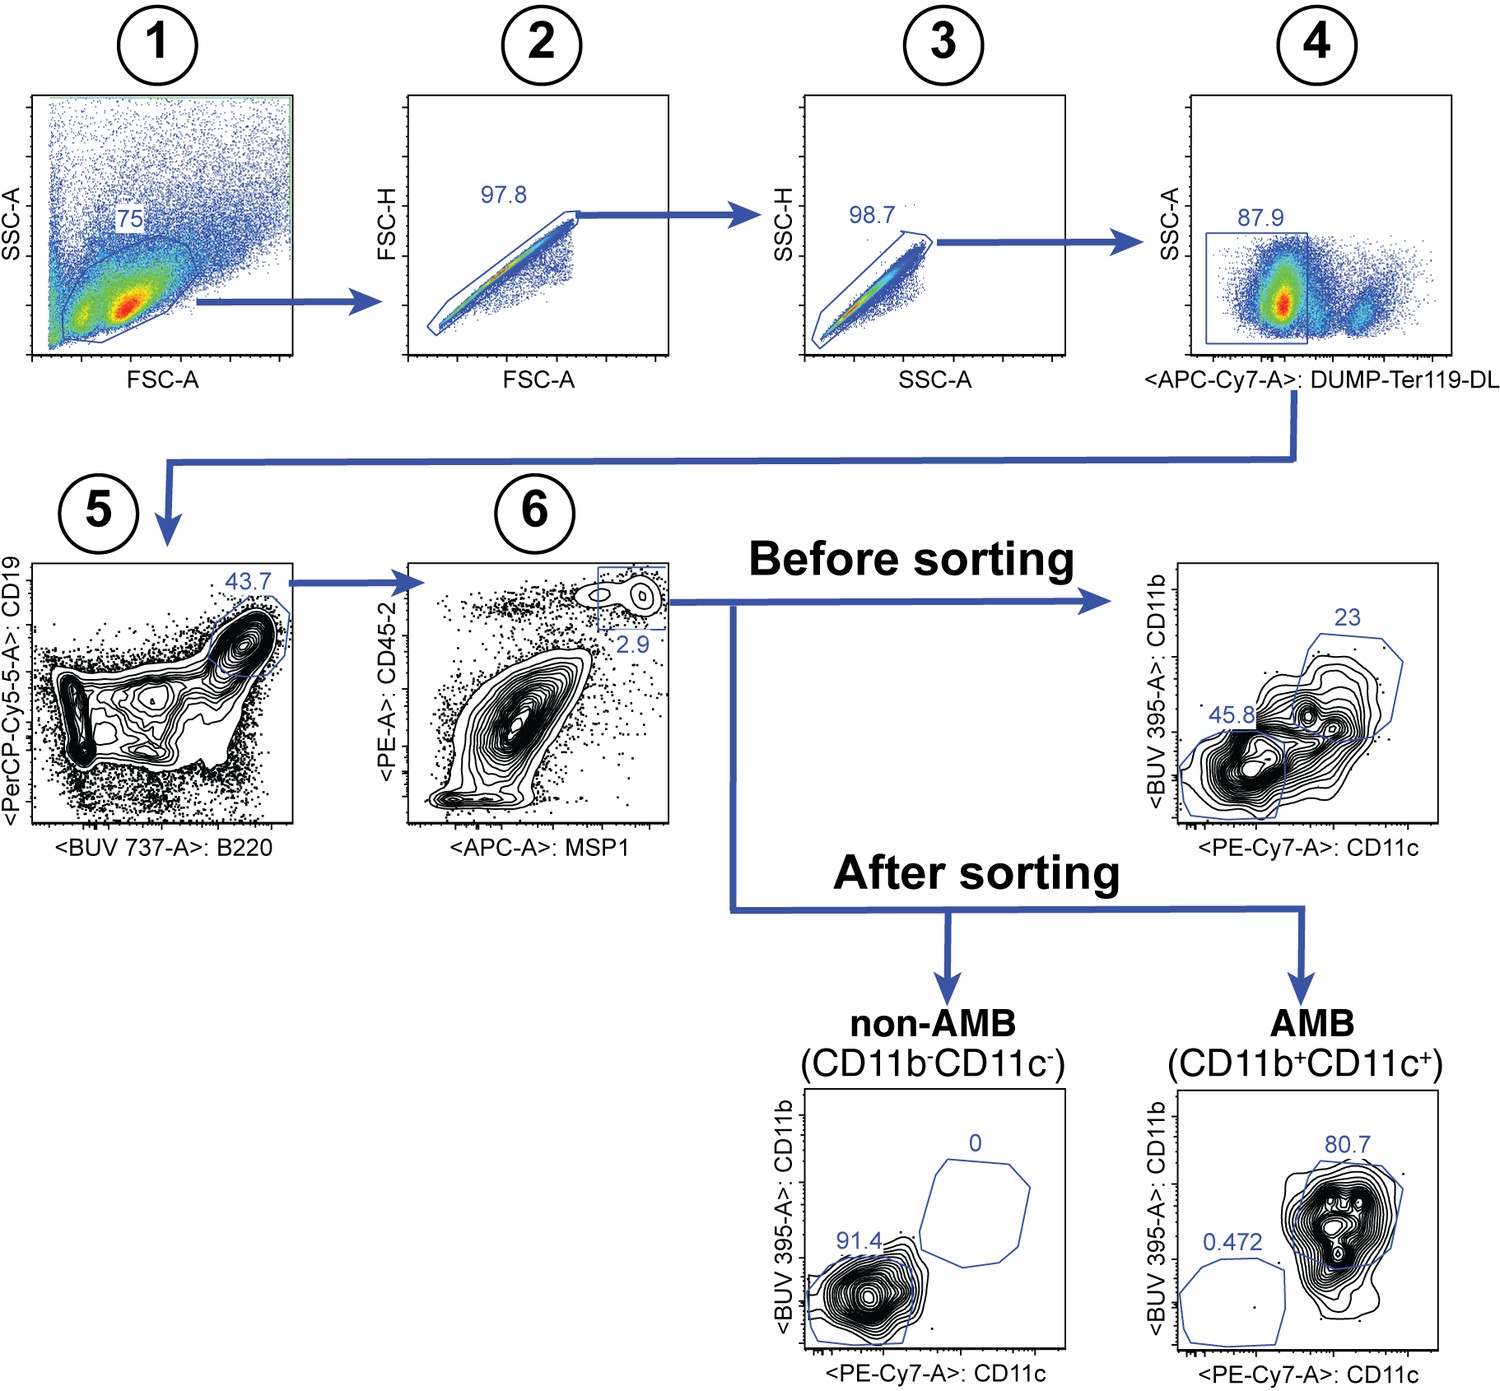
Gating strategy for the sorting of splenic MSP121-specific CD11b+CD11c+ AMB and CD11b—CD11c— B cells at 35dpi.
https://doi.org/10.7554/eLife.39800.007
Figure 3—figure supplement 2
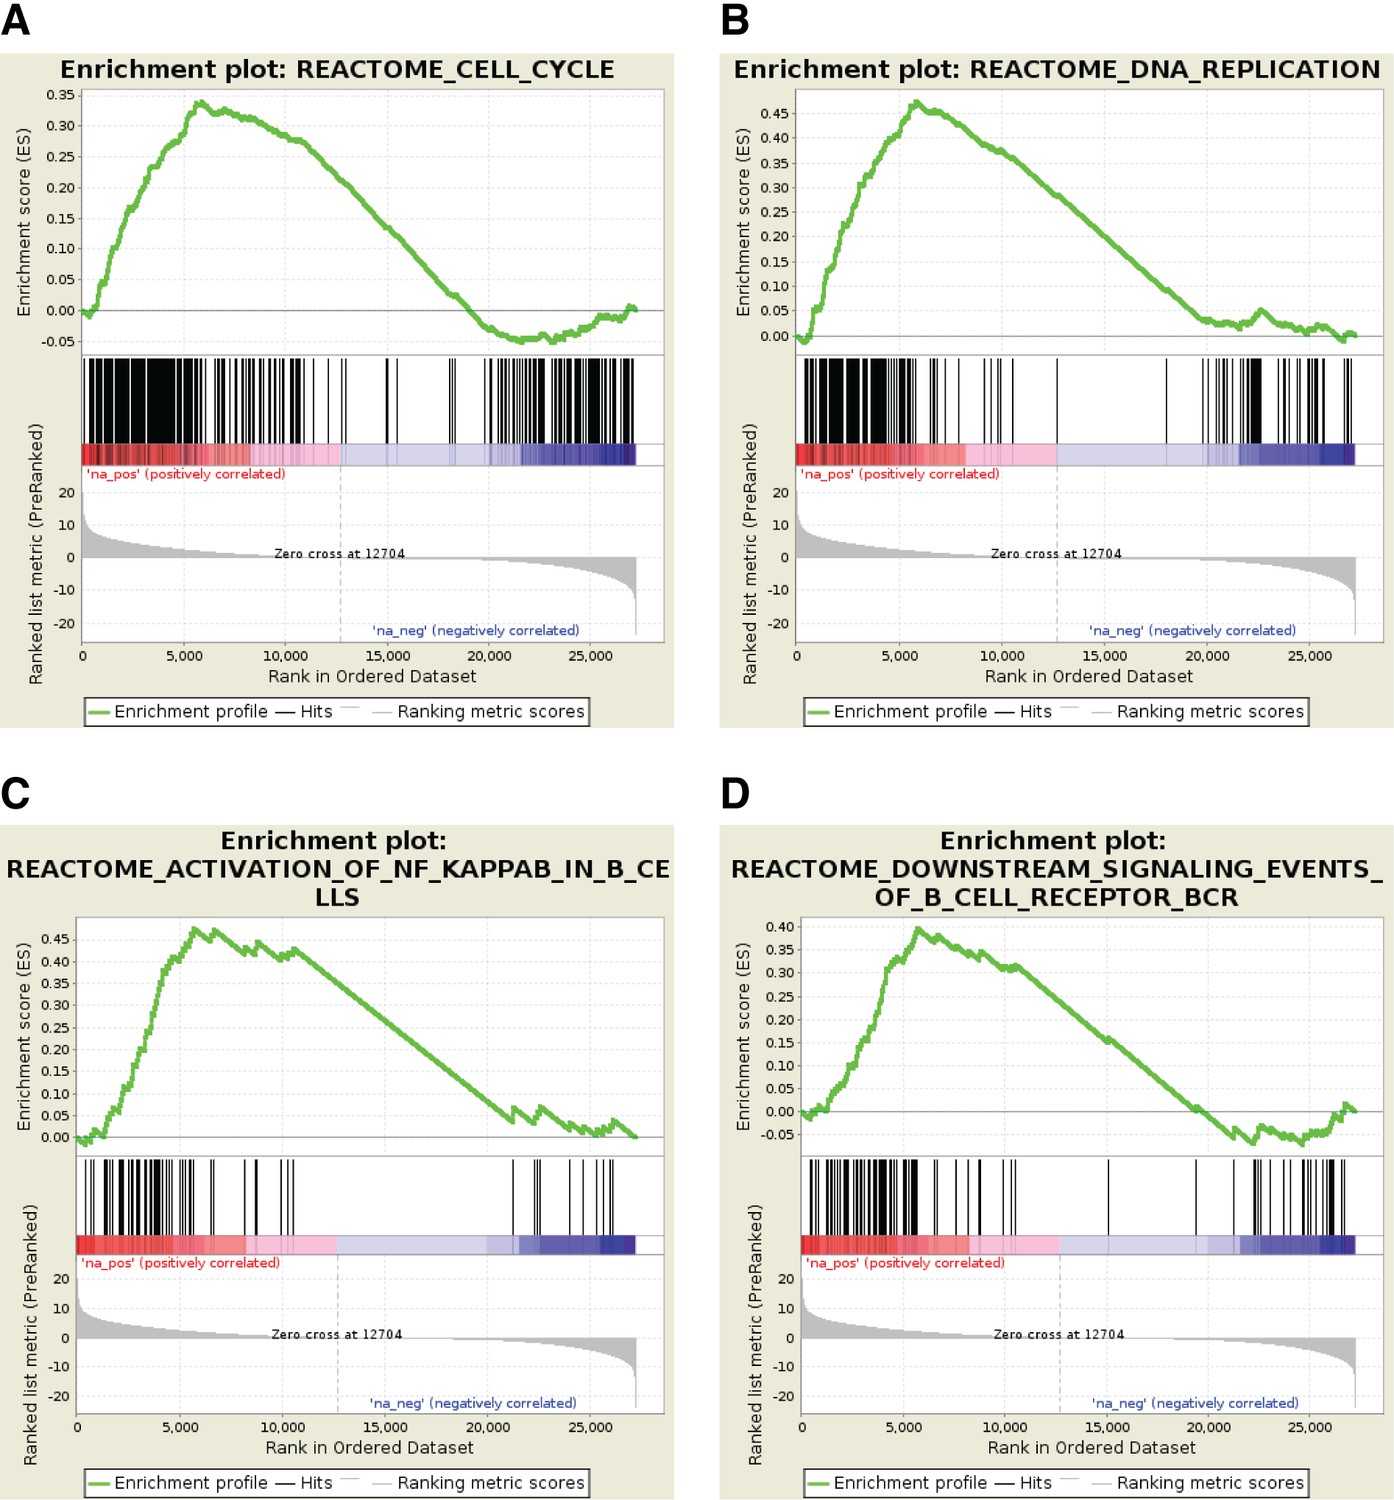
Profile of the Running ES Score and positions of GeneSet members on the rank ordered list for selected Reactome pathway gene sets.
https://doi.org/10.7554/eLife.39800.008
Figure 4
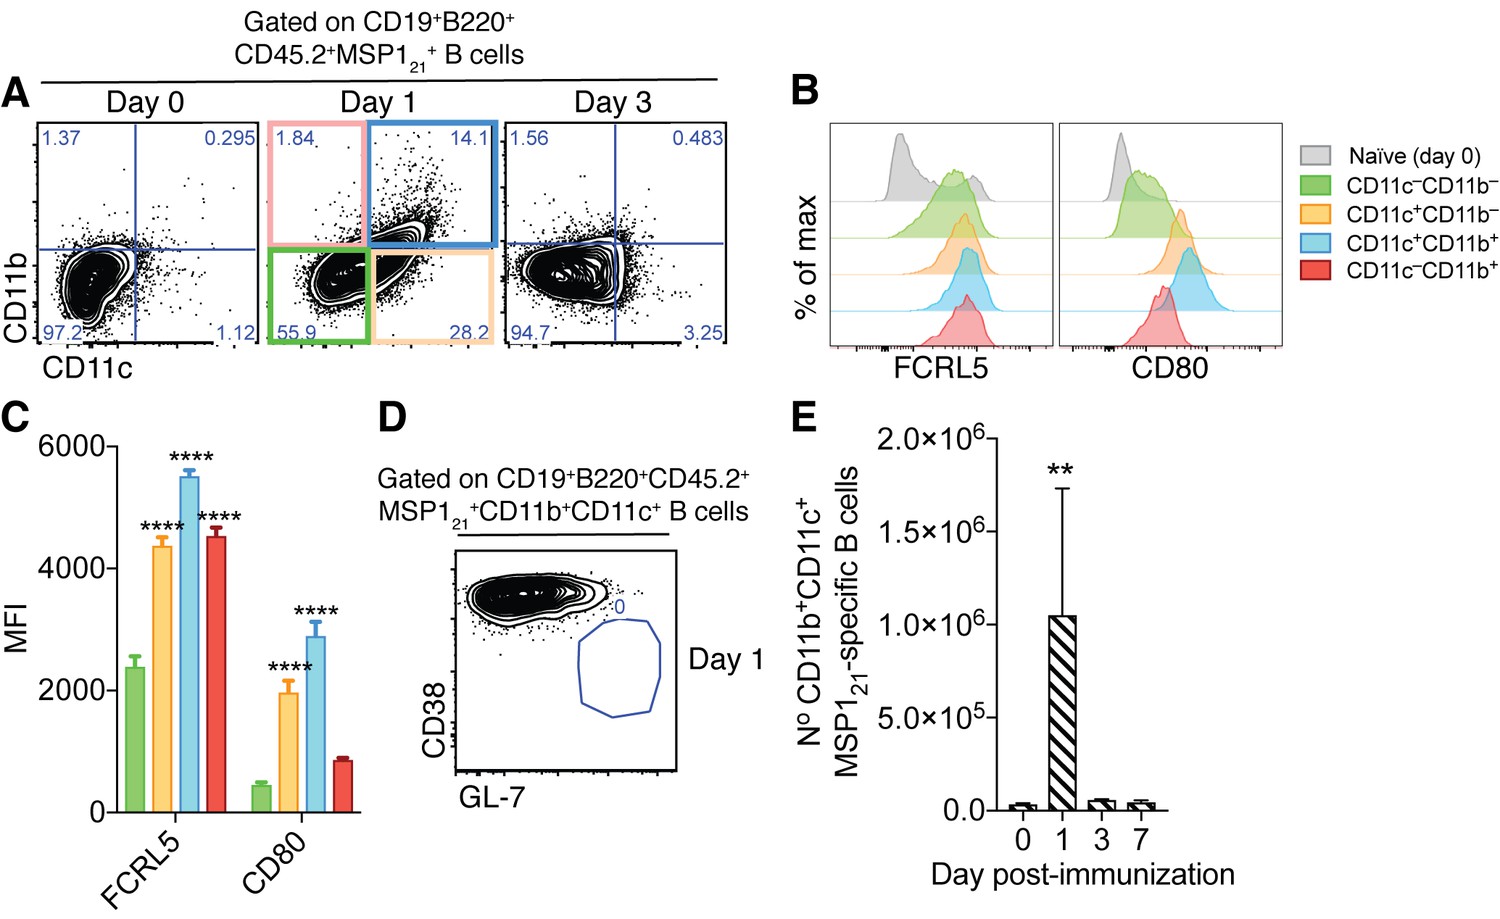
Generation of splenic MSP121-specific CD11b+CD11c+AMB in response to immunization.
(A) Flow cytometry showing differential expression of CD11b and CD11c on splenic MSP121-specific B cells from IghNIMP23/+ mice before immunization (day 0) and at days 1 and 3 post-immunization with R848 and MSP121. (B) Flow cytometry showing expression of FCRL5 and CD80 on different subsets of splenic MSP121-specific B cells from IghNIMP23/+ defined based on CD11b and CD11c expression at day one post-immunization and naïve mice. (C) Geometric MFI of FCRL5 and CD80 expression on different subsets of splenic MSP121-specific B cells from IghNIMP23/+ defined based on CD11b and CD11c expression at day one post-immunization. Two-way ANOVA vs CD11b—CD11c— subset. ****p<0.0001. (D) Flow cytometry of CD38 vs GL-7 (GC markers) on CD11b+CD11c+ MSP121-specific B cells from IghNIMP23/+ at day one post-immunization. (E) Numbers of splenic CD11b+CD11c+ MSP121-specific B cells from IghNIMP23/+ during the course of immunization. Kruskal-Wallis test compared to day 0. **p<0.01. Error bars are SEM. Data pooled from three independent experiments with 3–5 mice per group.
Figure 5
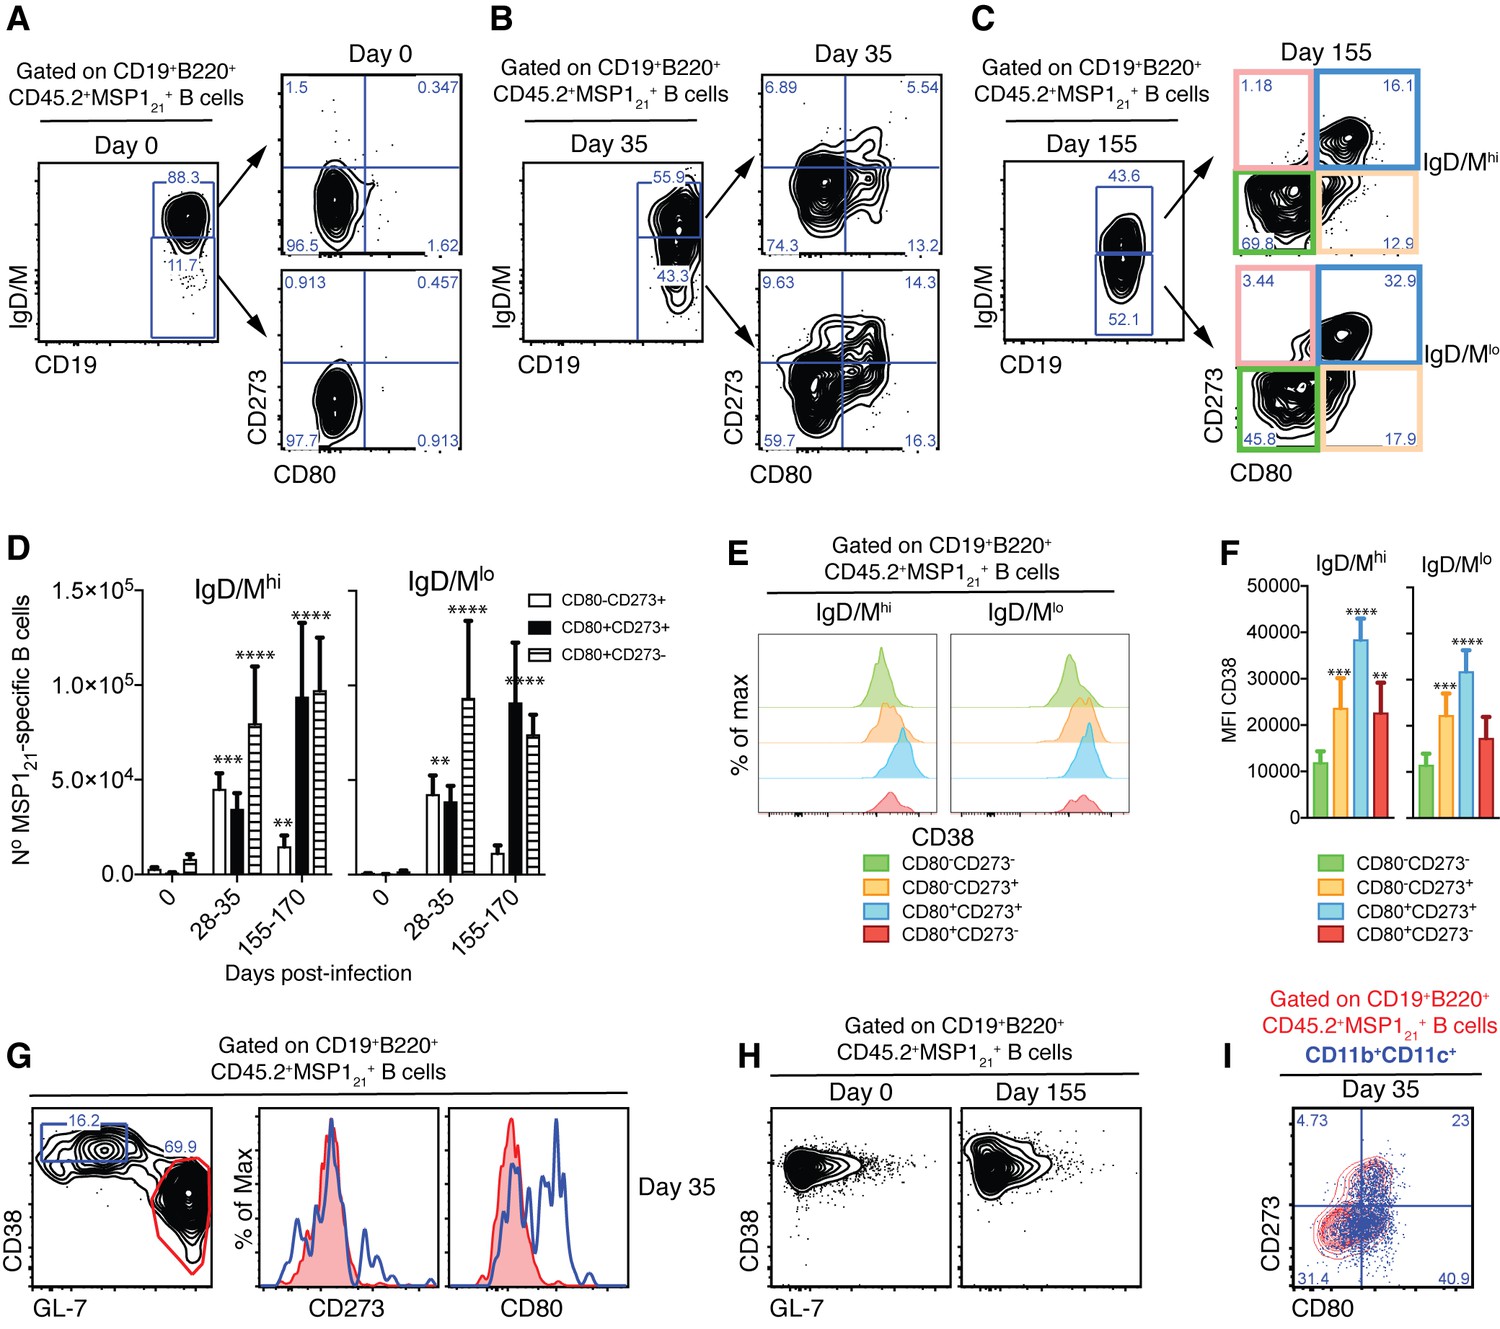
Detection of MSP121-specific Bmem after resolution of P.chabaudi infection.
(A), (B) and (C) Flow cytometry showing gating strategy to identify splenic IgM/Dhi and IgM/Dlo CD273+ and/or CD80+ MSP121-specific Bmem in NIMP23→Rag2-/- chimeric mice before infection (day 0), at 35 and 155dpi, respectively. (D) Numbers of splenic IgM/Dhi and IgM/Dlo CD273+ and/or CD80+ MSP121-specific Bmem in NIMP23→Rag2-/- chimeric mice during the course of mosquito transmitted P. chabaudi infection. Two-way ANOVA vs day 0. **p<0.01; ***p<0.001; ****p<0.0001. (E) Flow cytometry showing expression of CD38 on different subsets of splenic IgM/Dhi and IgM/Dlo MSP121-specific B cells from NIMP23→Rag2-/- chimeric mice defined based on CD273 and CD80 expression at 155dpi. (F) Geometric MFI of CD38 expression on different subsets of IgM/Dhi and IgM/Dlo splenic MSP121-specific B cells from NIMP23→Rag2-/- chimeric mice defined based on CD273 and CD80 expression at day 155 post-mosquito transmitted P. chabaudi infection. Two-way ANOVA vs CD273-CD80- subset. **p<0.01; ***p<0.001; ****p<0.0001. Error bars are SEM. (G) Flow cytometry of CD273 and CD80 expression on non-GC (CD38hiGL-7lo, blue) and GC (CD38loGL-7hi, red) splenic MSP121-specific B cells from NIMP23→Rag2-/- chimeric mice at 35dpi. (H) Flow cytometry of CD38 vs GL-7 (GC markers) on splenic MSP121-specific B cells from NIMP23→Rag2-/- chimeric mice at 0 and 155dpi. (I) CD11b+CD11c+ MSP121-specific B cells overlaid on the CD80 vs CD273 plot corresponding to total MSP121-specific B cells. Data pooled from three independent experiments with 3–7 mice per group.
Figure 6 with 2 supplements
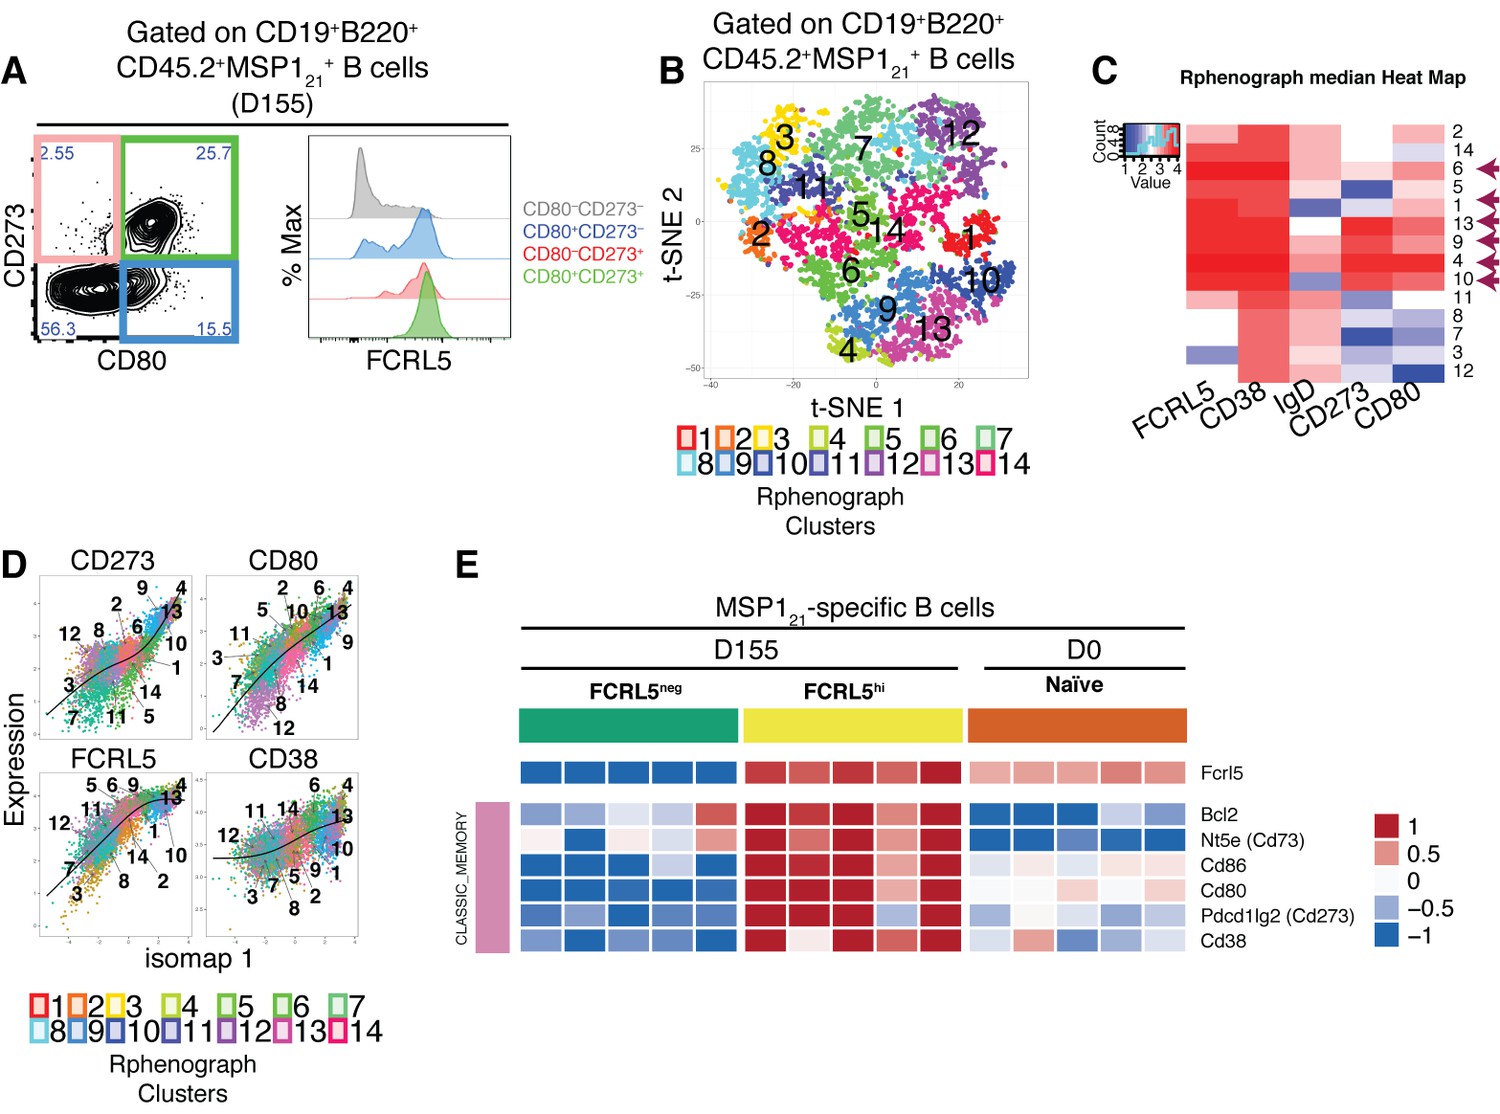
FCRL5hi identifies MSP121-specific Bmem after resolution of P.chabaudi infection.
(A) Flow cytometry showing expression of FCRL5 (right) on different subsets of splenic MSP121-specific B cells from NIMP23→Rag2-/- chimeric mice defined based on CD273 and CD80 expression (left) at 155dpi. (B) t-SNE analysis of splenic MSP121-specific B cells based on FCRL5, CD38, IgD, CD273 and CD80 expression measured by flow cytometry (n = 5). Clusters identified by PhenoGraph are colored and numbered. (C) PhenoGraph heat map showing median expression of FCRL5, CD38, IgD, CD273 and CD80 on the different clusters of MSP121-specific B cells. Arrows point at the different clusters displaying a memory B cell phenotype. (D) Expression profiles of FCRL5, CD38, CD273 and CD80 for the different PhenoGraph clusters visualized on the first component of ISOMAP. The regression line estimated using the generalized linear model (GLM) is added for each marker. Data representative of three independent experiments with 4–7 mice per group. (E) Heat map showing expression levels of different genes on splenic FCRL5— and FCRL5hi MSP121-specific B cells sorted at 155dpi, and MSP121-specific B cells sorted before infection (naïve), determined by RNAseq analysis. Each column corresponds to data from an individual mouse (n = 5 155 dpi, n = 5 0 dpi).
Figure 6—figure supplement 1
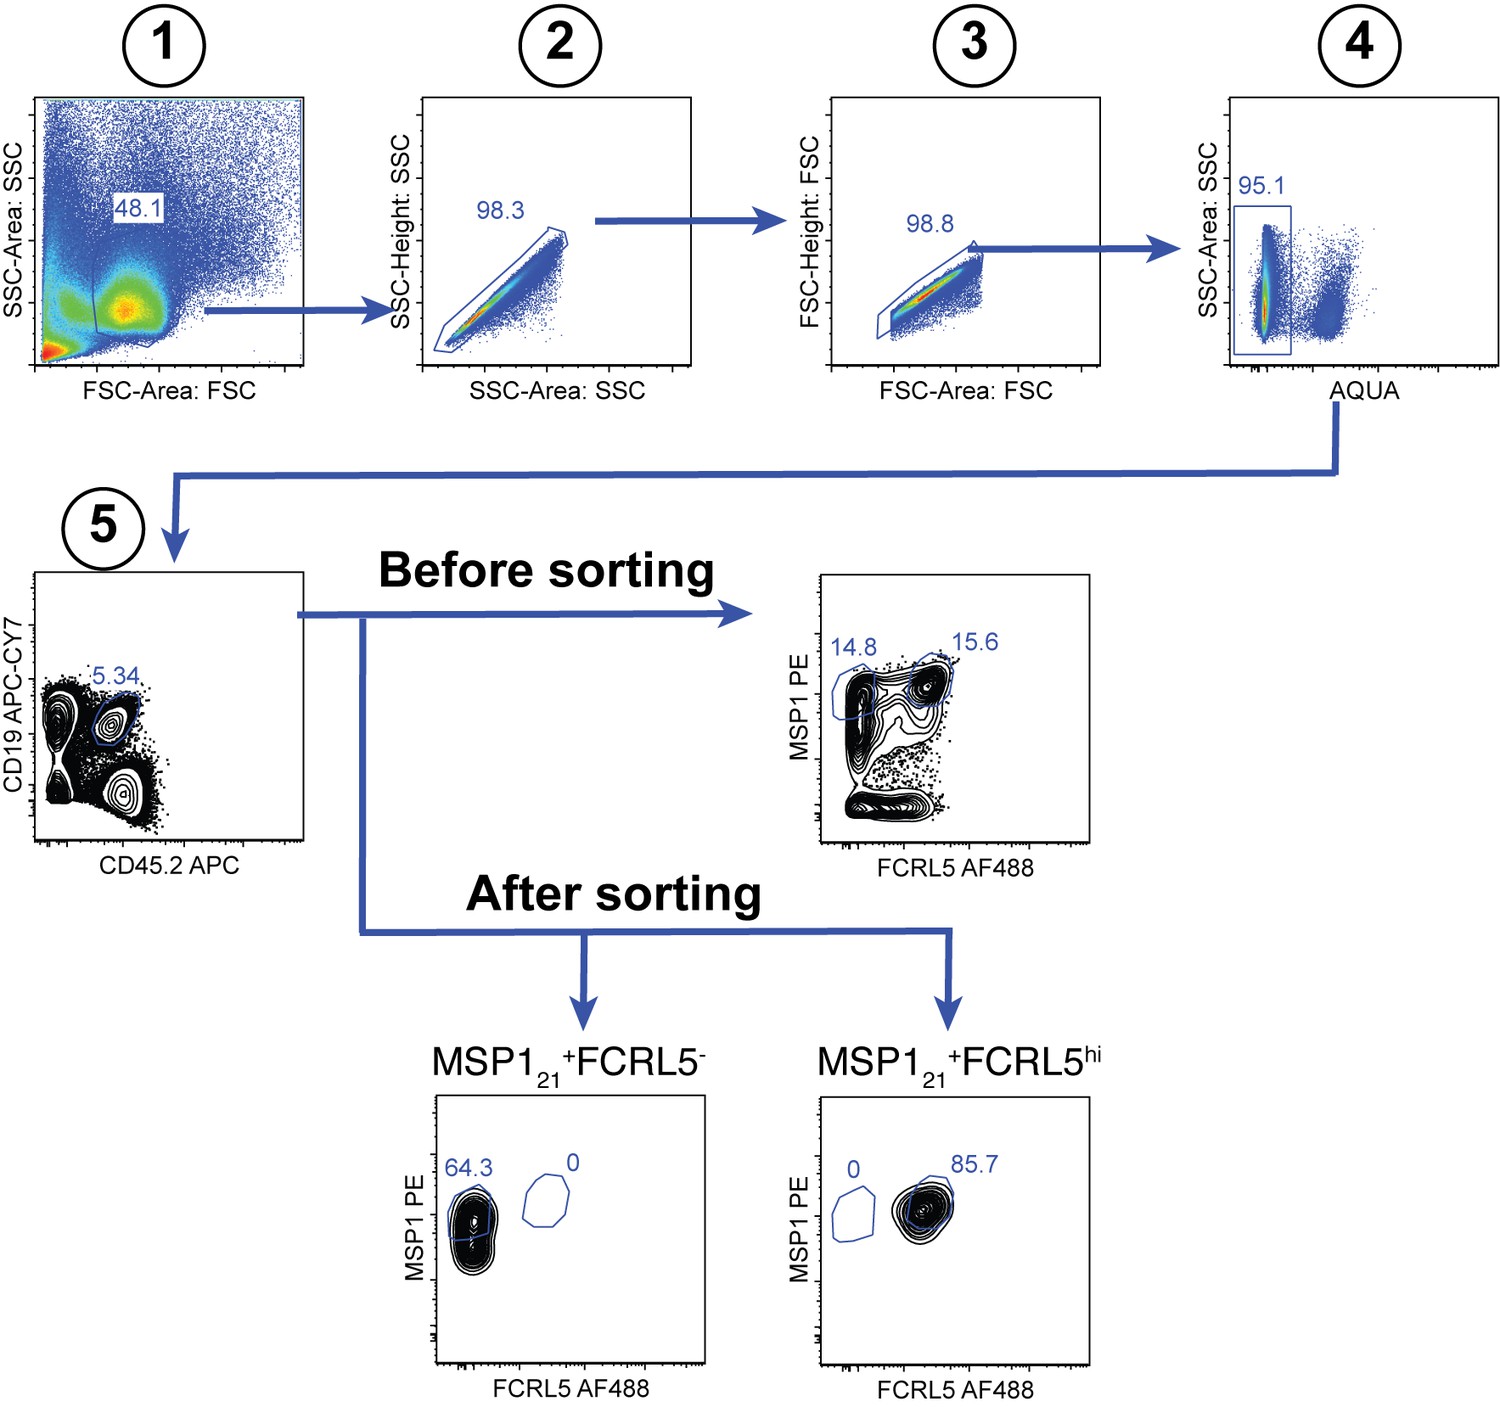
Gating strategy for the sorting of splenic MSP121-specific FCRL5hi Bmem and FCRL5— B cells at 155dpi.
https://doi.org/10.7554/eLife.39800.012
Figure 6—figure supplement 2
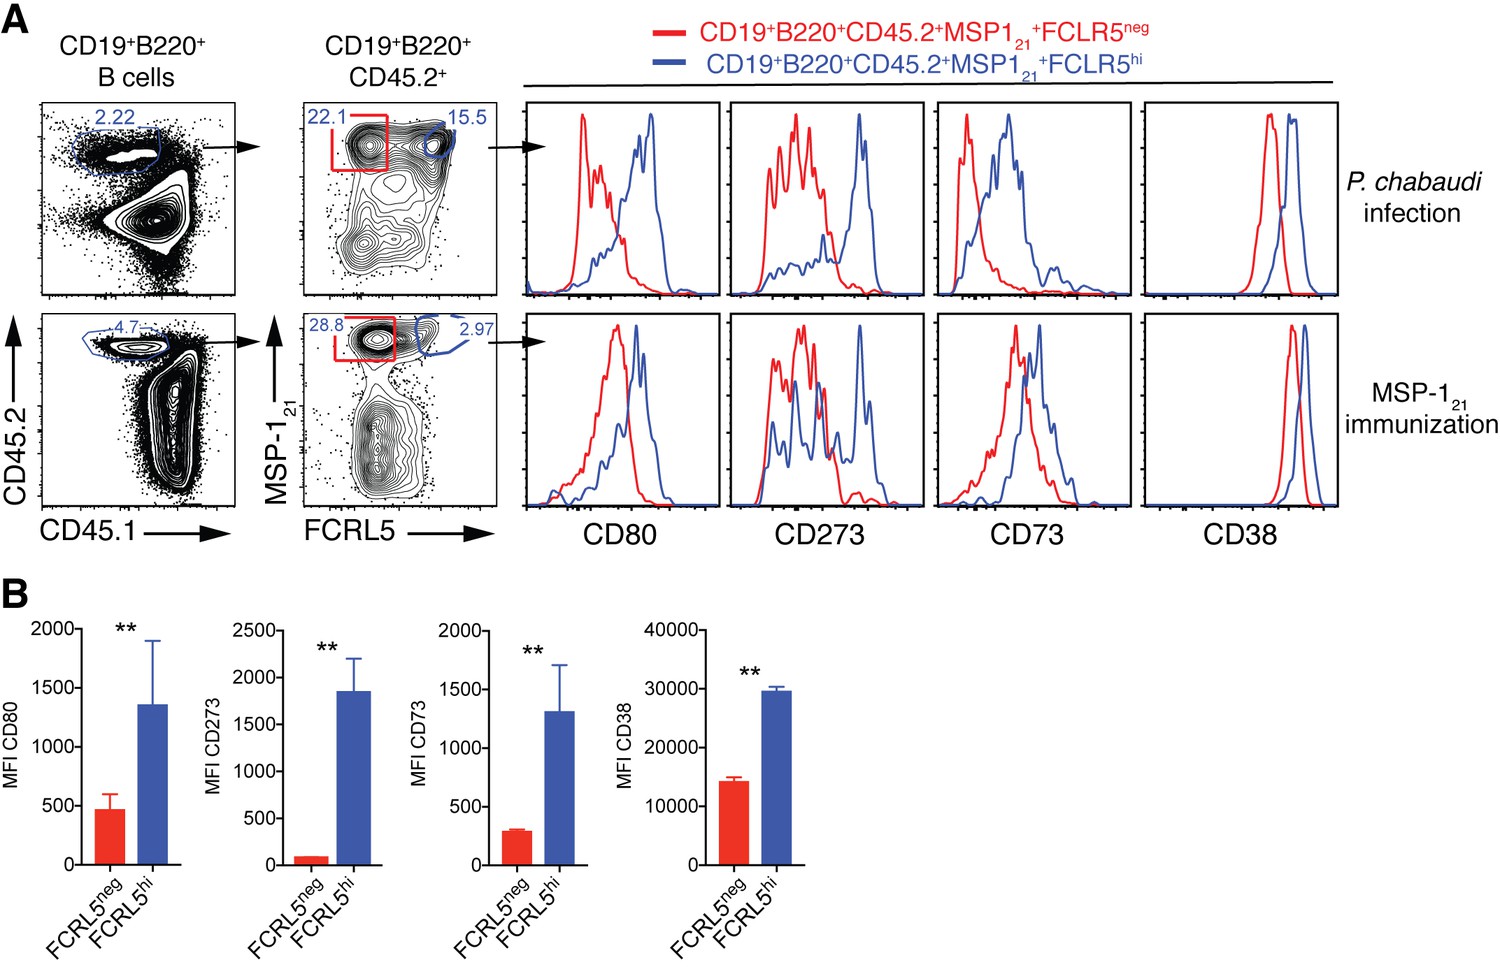
High expression of FCRL5 identifies Bmem.
(A) Flow cytometry gating strategy to identify splenic MSP121-specific FCRL5neg (red) and FCRL5hi (blue) B cells, and additional surface markers expressed on these cells, in NIMP23→ Rag2-/- mixed bone marrow chimeras infected with P. chabaudi (155dpi, top row) and immunized with recombinant MSP121 in Titermax Gold emulsion (day 29 post-immunization, bottom row). (B) Cumulative data showing geometric MFI for CD80, CD273, CD73, and CD38 memory markers on splenic MSP121-specific FCRL5neg and FCRL5hi B cells obtained from immunized mice. Mann Whitney U test. **, p<0.01. Error bars are SEM. Data representative of two independent experiments with 3–5 mice per group.
Figure 7
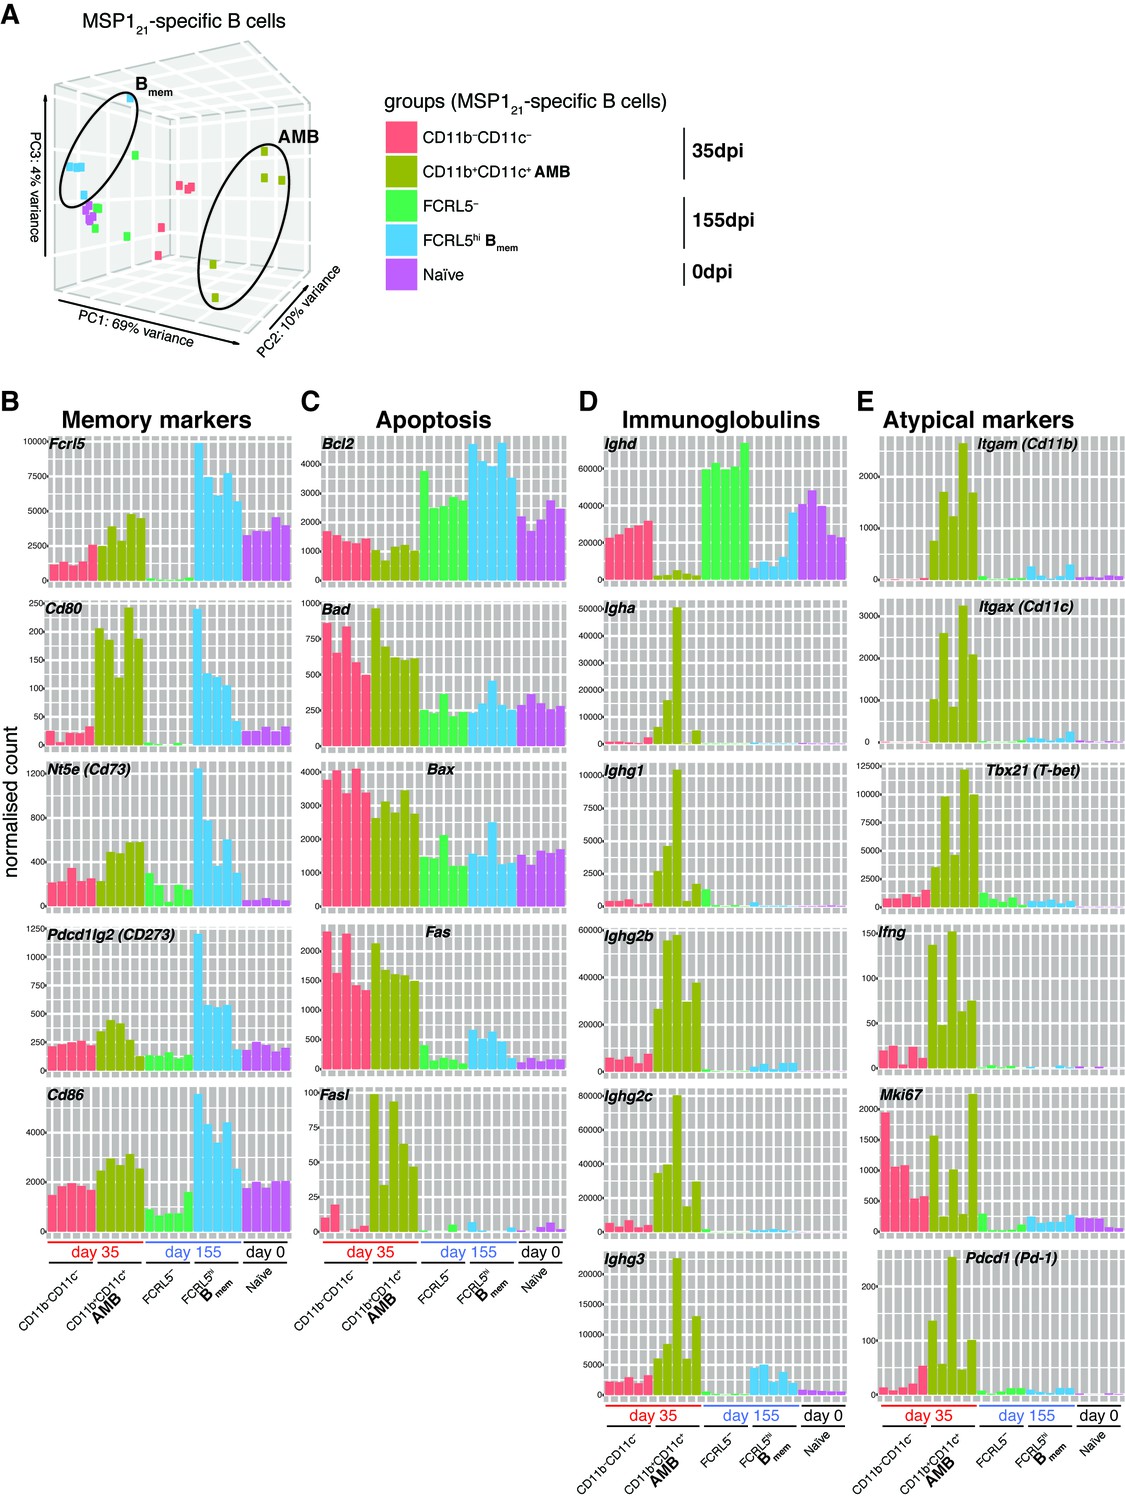
MSP121-specific AMB are a distinct short-lived activated B cell subset.
(A) Principal component analysis of RNAseq transcriptome data from splenic MSP121-specific AMB (CD11b+CD11c+, 35dpi), CD11b—CD11c— B cells (35dpi), Bmem (FCRL5hi, 155dpi), FCRL5— B cells (155dpi) and B cells from naïve mice (0dpi). The MSP121-specific AMB and Bmem are contained inside ellipses. (B) (C) (D) (E) Normalized counts corresponding to selected genes representing memory B-cell markers, anti and pro-apoptotic genes, immunoglobulins and atypical memory B-cell markers, respectively, for all five groups described in (A). Each bar represents an individual mouse. Data generated with five mice per group.
Figure 8

Analysis of MZ, B1 and GC B cell characteristics on MSP121-specific AMB.
(A) MSP121-specific CD11b+CD11c+ (AMB) and CD11b—CD11c— B cells were flow cytometry sorted from the spleen of NIMP23→Rag2-/- chimeric mice at 35dpi; MSP121-specific B cells were flow cytometry sorted from the spleen of naïve NIMP23→Rag2-/-, and these three B cell populations were submitted to mRNAseq analysis. The heat map displays level of expression of selected individual genes known to be up or downregulated on either MZ, B1 B cells or both. Each column represents an individual mouse. (B) Flow cytometry analysis of surface markers of either MZ, B1 B cells or both, on MSP121-specific CD11b+CD11c+ (AMB) (blue) and MSP121-specific IgMhi (red) B cells from the spleen of IghNIMP23/+ mice at 20dpi. (C) Flow cytometry analysis of GC markers on MSP121-specific CD11b—CD11c— (non-AMB, left) and CD11b+CD11c+ (AMB, right) B cells from the spleen of IghNIMP23/+ mice at 20dpi. (D) Flow cytometry analysis showing the expression of CD11b and CD11c on MSP121-specific CD11b+CD11c+ (AMB, blue) compared to GC (CD38loGL-7hi, red) B cells from the spleen of IghNIMP23/+ mice. Data generated with 5–6 mice per group.
Author response image 1
Tables
Key resources table
| Reagent type (species) or resource | Designation | Source or reference | Identifiers | Additional information |
|---|---|---|---|---|
| Genetic reagent (M. musculus) | B6.SJL-Ptprca Pepcb/BoyJ (B6.CD45.1) | The Jackson Laboratory | MGI:4819849 | Bred in the specific pathogen-free facilities of the MRC National Institute for Medical Research and The Francis Crick Institute |
| Genetic reagent (M. musculus) | Rag2tm1Fwa(Rag2-/-) | The Jackson Laboratory | MGI:1858556 | Bred in the specific pathogen- free facilities of the MRC National Institute for Medical Research and The Francis Crick Institute |
| Genetic reagent (M. musculus) | IghNIMP23/+ | This paper | _ | Bred in the specific pathogen-free facilities of the MRC National Institute for Medical Research and The Francis Crick Institute |
| Strain, strain background (Plasmodium chabaudi chabaudi, strain AS) | P. chabaudi | other | _ | European Malaria Reagent Repository, University of Edinburgh. |
| Strain, strain background (Anopheles stephensi, strain SD500, female) | mosquitos | PMID: 23217144 | _ | Bred in Jean Langhorne's lab |
| Antibody | Monoclonal Rat Anti-CD11b | BD Biosciences | 563553 | (dil 1/50) |
| Antibody | Monoclonal Hamster Anti-Mouse CD11c | BD Biosciences | 561022 | (dil 1/50) |
| Antibody | Monoclonal Rat Anti-Mouse CD138 | BD Biosciences | 553714 | (dil 1/400) |
| Antibody | Monoclonal Rat Anti-Mouse CD19 | BD Biosciences | 565076 | (dil 1/200) |
| Antibody | Monoclonal Rat anti-Mouse CD19 | Biolegend | 115530 | (dil 1/400) |
| Antibody | Monoclonal Rat anti-Mouse CD19 | Biolegend | 115543 | (dil 1/400) |
| Antibody | Monoclonal Rat anti-Mouse CD1d | Biolegend | 123510 | (dil 1/100) |
| Antibody | Monoclonal Rat anti-mouse CD2 | Biolegend | 100112 | (dil 1/100) |
| Antibody | Monoclona Rat Anti-Mouse CD21/35 | BD Biosciences | 563176 | (dil 1/100) |
| Antibody | Monoclona Rat Anti-Mouse CD21/35 | BD Biosciences | 553818 | (dil 1/100) |
| Antibody | Monoclonal Rat anti-Mouse CD23 | eBioscience | 25–0232 | (dil 1/100) |
| Antibody | Monoclonal Rat anti-Mouse CD273 | BD Biosciences | 564245 | (dil 1/25) |
| Antibody | Armenian Hamster anti-Mouse CD3 | Biolegend | 100336 | (dil 1/100) |
| Antibody | Monoclonal Rat anti-Mouse CD38 | Biolegend | 102718 | (dil 1/400) |
| Antibody | Monoclonal Rat anti-Mouse CD38 | eBioscience | 17–0381 | (dil 1/400) |
| Antibody | Monoclonal Rat anti-Mouse CD38 | BD Biosciences | 740697 | (dil 1/400) |
| Antibody | Monoclonal Rat anti-Mouse CD4 | Biolegend | 100414 | (dil 1/400) |
| Antibody | Monoclonal Rat anti-Mouse CD45.1 | Biolegend | 110706 | (dil 1/400) |
| Antibody | Monoclonal Rat anti-Mouse CD45.1 | Biolegend | 110728 | (dil 1/400) |
| Antibody | Monoclonal Mouse anti-Mouse CD45.2 | BD Biosciences | 563685 | (dil 1/50) |
| Antibody | Monoclonal Mouse anti-Mouse CD45.2 | Biolegend | 109814 | (dil 1/50) |
| Antibody | Monoclonal Mouse anti-Mouse CD45.2 | Biolegend | 109808 | (dil 1/50) |
| Antibody | Monoclonal Rat anti-Mouse CD45R/B220 | BD Biosciences | 564449 | (dil 1/400) |
| Antibody | Monoclonal Rat anti-Mouse CD45R/B220 | Biolegend | 103224 | (dil 1/400) |
| Antibody | Monoclonal Rat anti-Mouse CD45R/B220 | eBioscience | 25–0452 | (dil 1/400) |
| Antibody | Monoclonal Rat anti-Mouse CD73 | BD Biosciences | 550741 | (dil 1/100) |
| Antibody | Monoclonal Armenian Hamster anti-Mouse CD80 | Biolegend | 104729 | (dil 1/25) |
| Antibody | Monoclonal Rat anti-Mouse CD8a | Biolegend | 100734 | (dil 1/400) |
| Antibody | Monoclonal Rat anti-Mouse CD9 | BD Biosciences | 558749 | (dil 1/100) |
| Antibody | Monoclonal Rat anti-Mouse CD93 (AA4.1) | eBioscience | 17–5892 | (dil 1/100) |
| Antibody | FCRL5 | PMID: 17082595 | _ | Produced in Randall Davis' lab (dil 1/400) |
| Antibody | Polyclonal Sheep anti-Mouse FCRL5 | R and D Systems | FAB6756G | (dil 1/50) |
| Antibody | Monoclonal Rat Anti-Mouse T- and B-Cell Activation Antigen GL7 | BD Biosciences | 562080 | (dil 1/100) |
| Antibody | Monoclonal Rat Anti-Mouse IgD | Biolegend | 405725 | (dil 1/400) |
| Antibody | Monoclonal Rat Anti-Mouse IgD | Biolegend | 405723 | (dil 1/400) |
| Antibody | Monoclonal Rat Anti-Mouse IgD | Biolegend | 405710 | (dil 1/400) |
| Antibody | Monoclonal Rat Anti-Mouse IgG2b | Biolegend | 406708 | (dil 1/25) |
| Antibody | Monoclonal Rat Anti-Mouse IgM | Biolegend | 406512 | (dil 1/100) |
| Recombinant DNA reagent | VDJHNIMP23 anti-MSP121 variable region coding exon containing the Leader-V segment intron from gDNA of the NIMP23 hybridoma | PMID: 7141700 | _ | Produced in Jean Langhorne's lab |
| Recombinant DNA reagent | C57Bl/6 IgH HEL variable region knock-in construct | PMID: 12668643 | _ | Donated by Robert Brink of the Garvan Institute of Medical Research, New South Wales, Australia |
| Peptide, recombinant protein | MSP121 | PMID: 11254580 | _ | Produced in Jean Langhorne's lab |
| Commercial assay or kit | EZ-Link Sulfo-NHS-LC-Biotinylation Kit | Thermo Scientific | 21435 | |
| Commercial assay or kit | RiboPure RNA Purification Kit | Invitrogen | AM1924 | |
| Commercial assay or kit | Qubit 1X dsDNA HS Assay Kit | Invitrogen | Q33231 | |
| Commercial assay or kit | SMART-Seq v4 Ultra Low Input RNA Kit for Sequencing | Takara | 634889 | |
| Commercial assay or kit | Ovation Ultralow Library System V2 | Nugen | 0344–32 | |
| Commercial assay or kit | LIVE/DEAD Fixable Aqua Dead Cell Stain Kit | Invitrogen | L34957 | |
| Commercial assay or kit | LIVE/DEAD Fixable Blue Dead Cell Stain Kit | Invitrogen | L23105 | |
| Chemical compound, drug | Streptavidin-R-Phycoerythrin | Prozyme | PJRS25 | |
| Chemical compound, drug | Streptavidin-Allophycocyanin | Prozyme | PJ27S | |
| Chemical compound, drug | TiterMax Gold Adjuvant | Merck (formerly Sigma-Aldrich) | T2684-1ML | |
| Chemical compound, drug | R848 (Resiquimod) | Invivogen | tlrl-r848 | |
| Chemical compound, drug | TRI Reagent Solution | Invitrogen | AM9738 | |
| Software, algorithm | cutadapt v1.9.1 | doi:10.14806/ej.17.1.200 | ||
| Software, algorithm | RSEM v1.2.31 | doi:10.1186/1471-2105-12-323 | ||
| Software, algorithm | STAR v2.5.1b | doi:10.1093/ bioinformatics/bts635 | ||
| Software, algorithm | DESeq2 | doi:10.1186/s13059-014-0550-8 | ||
| Software, algorithm | R v3.4.0 | other | https://www.r-project.org | |
| Software, algorithm | Bioconductor v3.5 | other | http://www. bioconductor.org | |
| Software, algorithm | Broad's Gene Set Enrichment Analysis (GSEA) | other | http://software.broadinstitute.org/gsea/index.jsp | |
| Software, algorithm | FlowJo version 9.6 or higher | Tree Star | ||
| Software, algorithm | Cytofkit | doi:10.1371/journa l.pcbi.1005112.s009 | ||
| Software, algorithm | Prism v6 | GraphPad |
Additional files
-
Supplementary file 1
Mouse homologues to human genes previously described to be either up (↑) or down (↓) regulated in human atypical memory B cells (AMB).
- https://doi.org/10.7554/eLife.39800.016
-
Supplementary file 2
List of top 50 Reactome gene sets yielding the highest normalized enrichment score (NES) by GSEA.
- https://doi.org/10.7554/eLife.39800.017
-
Transparent reporting form
- https://doi.org/10.7554/eLife.39800.018
Download links
A two-part list of links to download the article, or parts of the article, in various formats.
Downloads (link to download the article as PDF)
Open citations (links to open the citations from this article in various online reference manager services)
Cite this article (links to download the citations from this article in formats compatible with various reference manager tools)
Plasmodium-specific atypical memory B cells are short-lived activated B cells
eLife 7:e39800.
https://doi.org/10.7554/eLife.39800


