Spatial sampling in human visual cortex is modulated by both spatial and feature-based attention
- Vrije Universiteit Amsterdam, The Netherlands
- Royal Academy of Sciences, The Netherlands
Figures
Figure 1
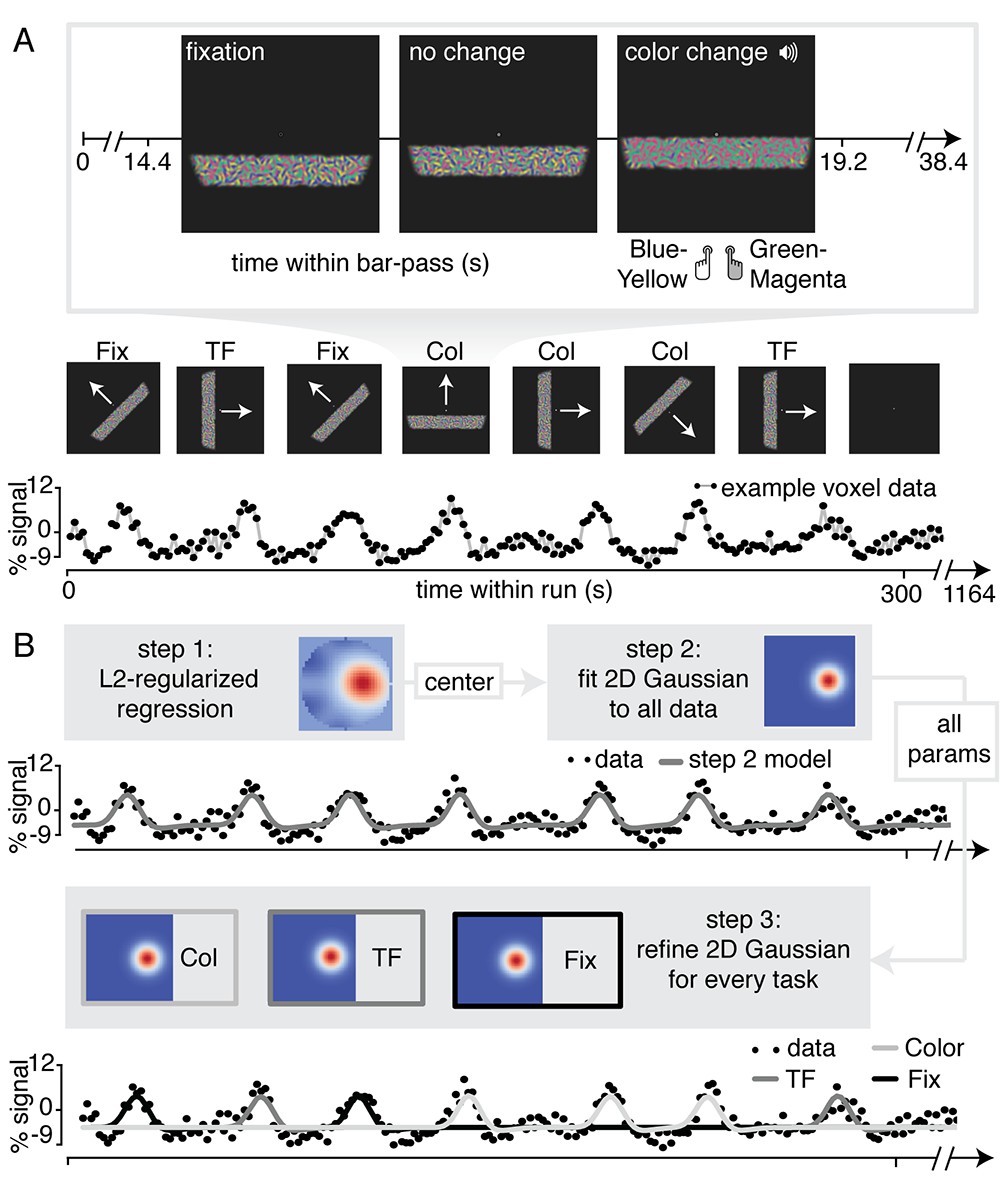
Experimental design and pRF fitting procedure.
(A) Experimental design. Throughout a bar pass participants reported either changes in color (Attend Color) or temporal frequency (Attend TF) of Gabor elements within the moving bar stimulus, or changes in fixation mark luminance (Attend Fixation), while maintaining accurate fixation. Participants were informed auditorily about the upcoming task 2 s before each bar pass. (B) Overview of pRF fitting procedure. pRF parameters were estimated from each voxel's BOLD signal time course in a three-step procedure. First, a design matrix was constructed based on 31 × 31 pixels' visual stimulation time course of the entire experiment, which was convolved with a participant-specific HRF (derived from separate data, see Feature preference and HRF Mapper). L2-regularized regression was used to find the position of the spatial response profile's peak of each voxel. Second, to find precise estimates of pRF center location and size, we used a more fine-grained 101 × 101 design matrix and gradient descent to fit a single parameterized 2D Gaussian pRF model to data from all attention conditions combined, initialized at the L2-regression derived peak location. Third, 2D Gaussian pRF models were fitted to data from the different attention conditions separately, initialized with the parameters resulting from step 2.
Figure 2 with 2 supplements
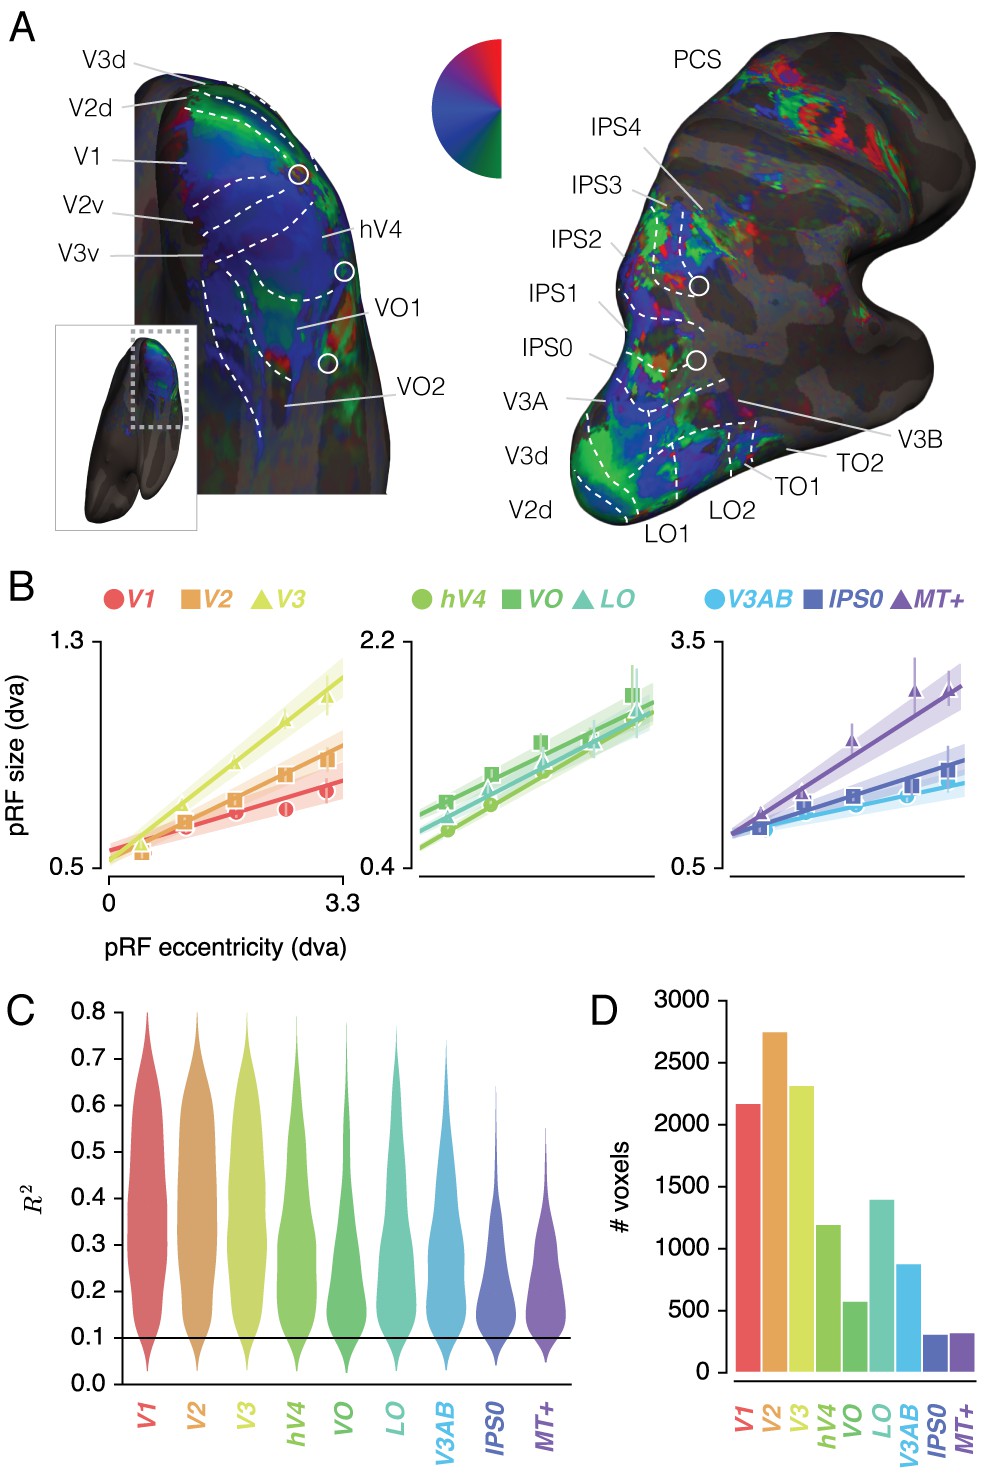
ROI definition.
(A) Attend Fixation pRF polar angle maps for an example participant with retinotopic areas up to the intra-parietal sulcus defined by hand. (B) Attend Fixation pRF size as a function of eccentricity for all areas that showed robust relationships. (C) Distribution of explained variance across the different regions of interest. The violins are normalized to have equal maximum width. (D) Number of voxels per ROI included in all subsequent analyses. All error bars and shaded error regions denote 95% CI of data and linear fits, respectively, across voxels. Also see Figure 2—figure supplements 1–2.
Figure 2—figure supplement 1
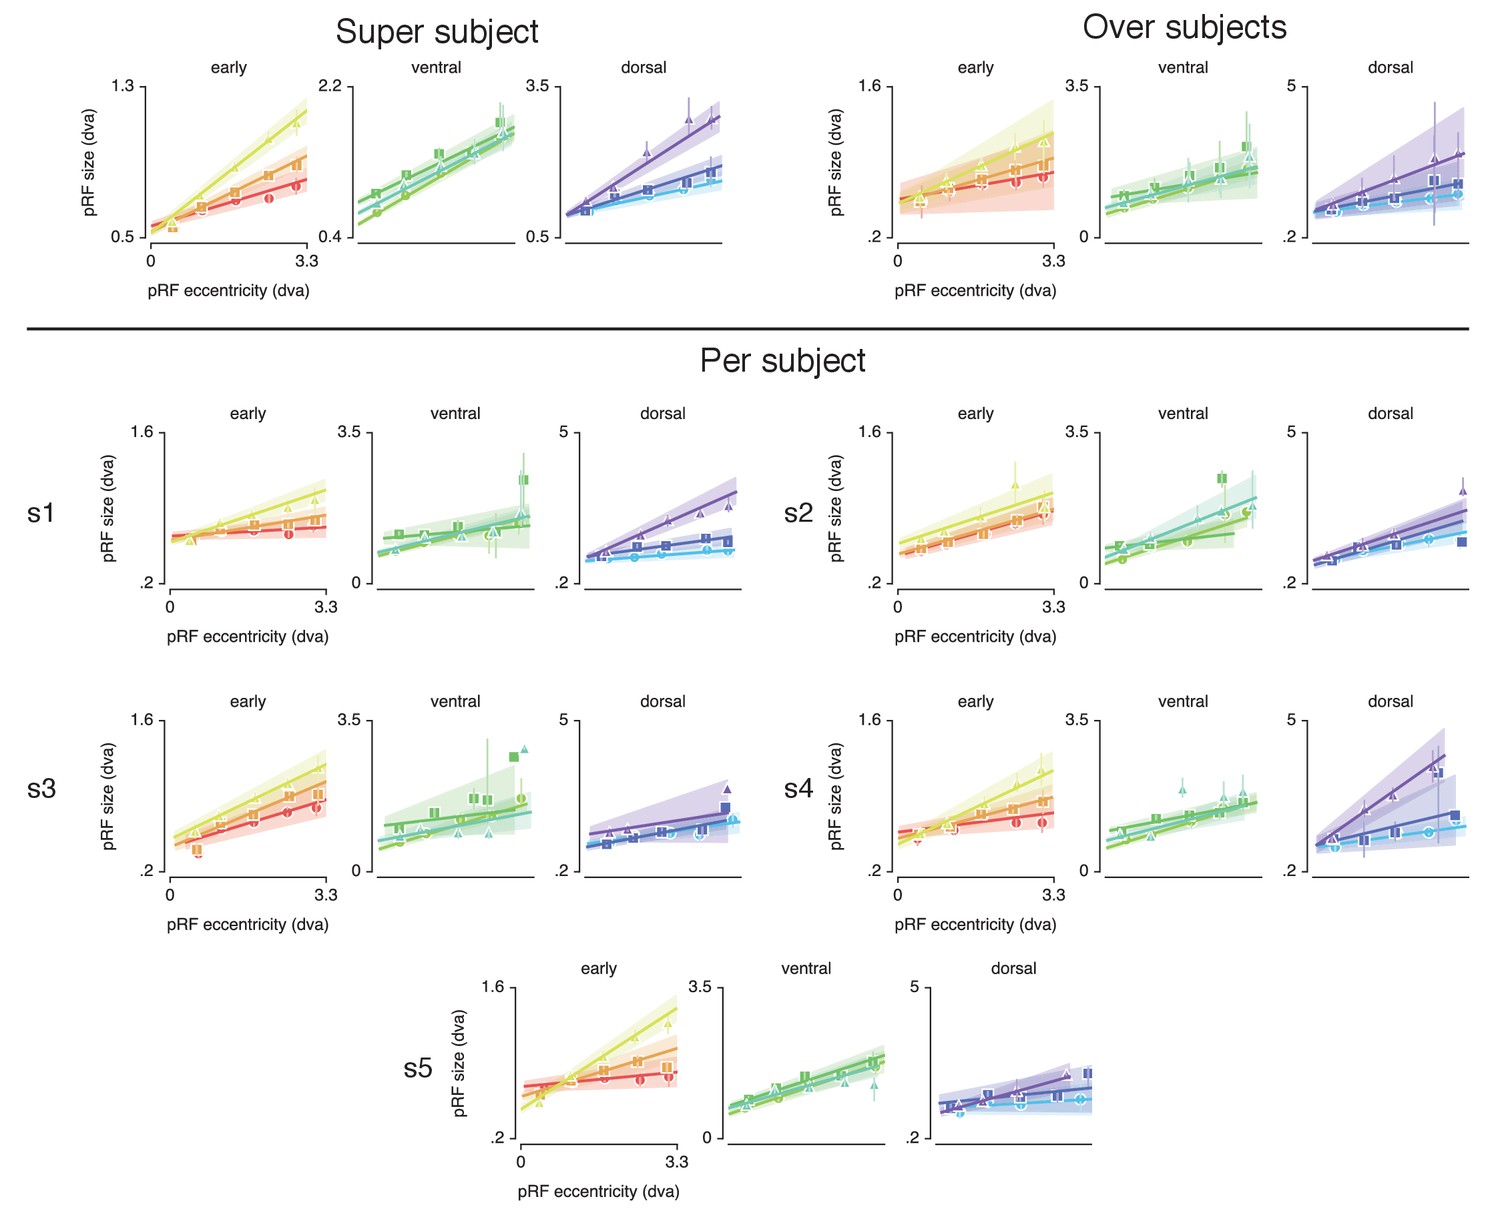
Eccentricity-size relations for all statistical methods.
This figure shows that eccentricity-size relations are positive in all ROIs for both the 'super subject' method (Supplementary file 1 - Table 1) and the 'over subjects' method (Supplementary file 1 - Table 11). Regarding the individual subjects, we find that although slopes between eccentricity and size were positive in all ROIs in all subjects, this was not always significant with α of 0.05. Yet, this occured for maximally one out of five subjects in some ROIs: in MT+ in s3 (p = 0.058), in V3AB (p = 0.073) and IPS0 (p = 0.078) in s5 and VO in s1 (p = 0.146). In the 'super subject' and 'per subject' methods, error bars denote 95% CI over voxels; in the 'over subjects' method, error bars denote 95% CI over subjects. See Materials and methods section for definitions of 'super subject', 'over subjects' and 'per subject' methods.
Figure 2—figure supplement 2

Explained variance and voxel count for all statistical methods.
The violin plots depict the distribution of explained variance across voxels for the different ROIs and for all subjects.The horizontal line at 0.10 indicates the exclusion criterion (voxels with explained variance lower than 0.10 are also excluded from these violin plots). The bar plots show the number of voxels that survived different rejection criteria for all ROIs and for all subjects. The first bar of each ROI depicts all voxels within the retinotopically defined mask where explained variance is larger than >0.01. This serves as a baseline of 'all' voxels within that area. The second bar depicts all voxels where explained variance is larger than >0.10 (the criteria used in all subsequent analyses). The third bar depicts the number of voxels where explained variance is >0.10 and where pRF eccentricity was smaller than 3.3 dva. The last bar depicts the number of voxels where explained variance is >0.10, where pRF eccentricity is <3.3 dva and where pRF size is <7.2 dva. The figure shows that most voxels are rejected either because their explained variance was too low or because they fell outside of the stimulus region. The additional pRF size rejection criterion virtually did not reject any additional voxels. The last bar of the 'super subject' is shown in the main figure. See Materials and methods section for definitions of 'super subject' and 'per subject' methods.
Figure 3 with 3 supplements
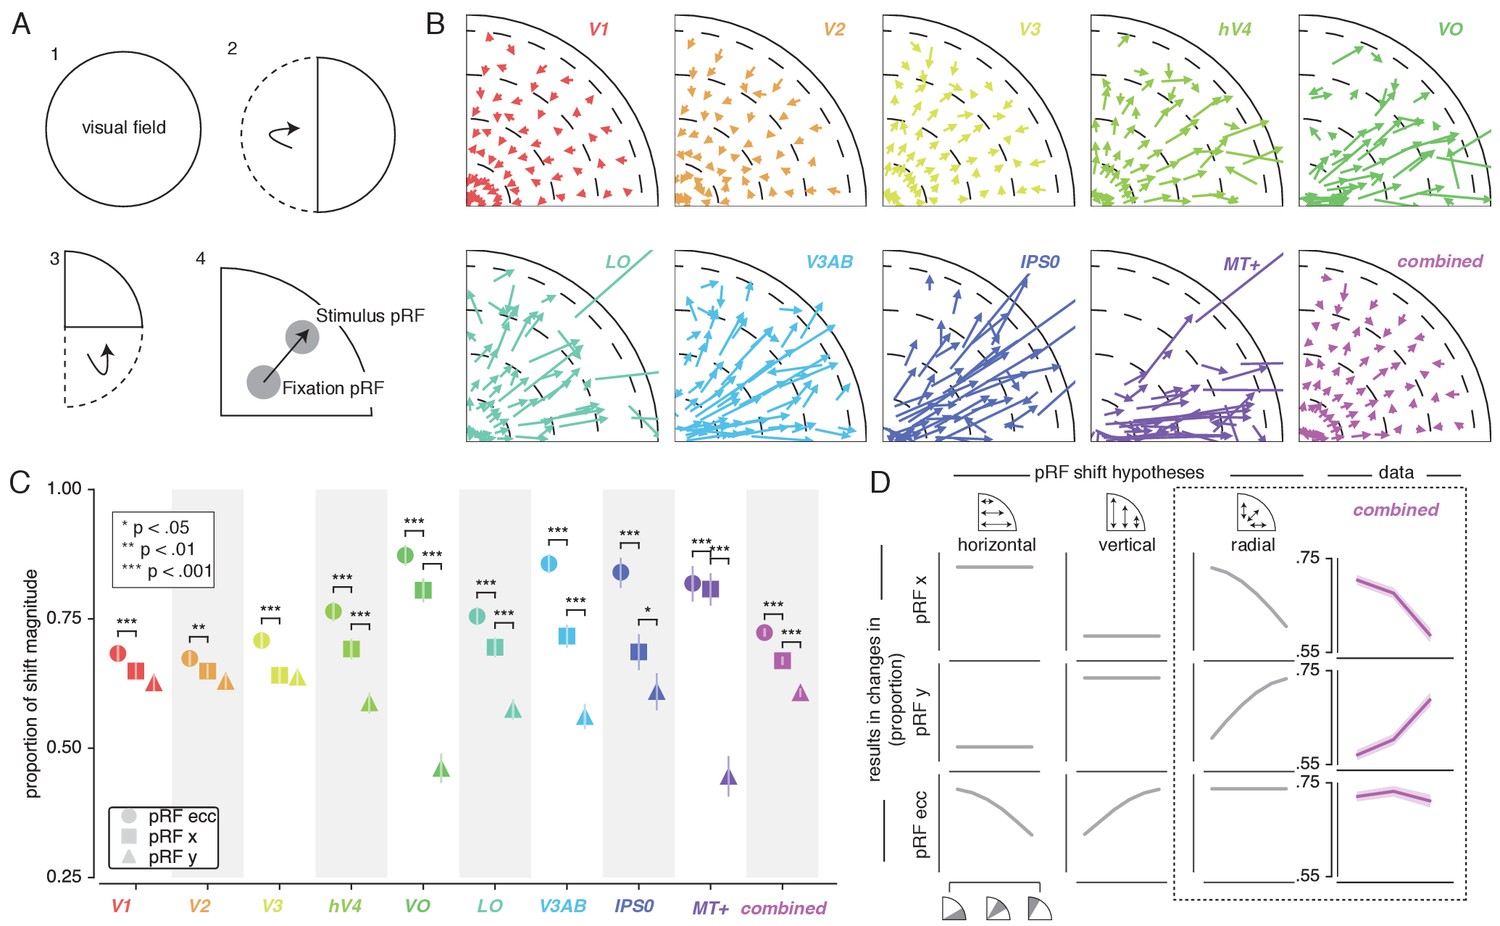
Effect of spatial attention on pRF position.
(A) Plotting strategy. For pRF shift visualizations, all pRF positions are mirrored into one quadrant of the visual field. Then, vectors representing the shift of pRF centers between conditions were drawn from the Attend Fixation to the Attend Stimulus pRF position. (B) Shift vectors as described in (A). pRF shift magnitude increased up the visual hierarchy, and shifts appear to occur mainly in the radial direction (i.e. changes in pRF eccentricity). Dotted lines demarcate eccentricity bins used in subsequent analyses. (C) Changes in pRF position in the horizontal, vertical and radial directions as a proportion of the length of the shift vectors, as depicted in (B). The magnitude of pRF shifts is consistently best described by changes in pRF eccentricity. (D) pRF x, y and eccentricity position shifts plotted as a function of polar angle, for different shift direction hypotheses. The data closely match the radial shift direction hypothesis, showing strongest pRF x shifts close to the horizontal meridian, strongest pRF y shifts close to the vertical meridian and strong pRF eccentricity changes across all polar angles. In (C), single, double and triple asterisks indicate significant differences with FDR corrected p < 0.05, < 0.01 and < 0.001, respectively. Also see Figure 3—figure supplements 1–3.
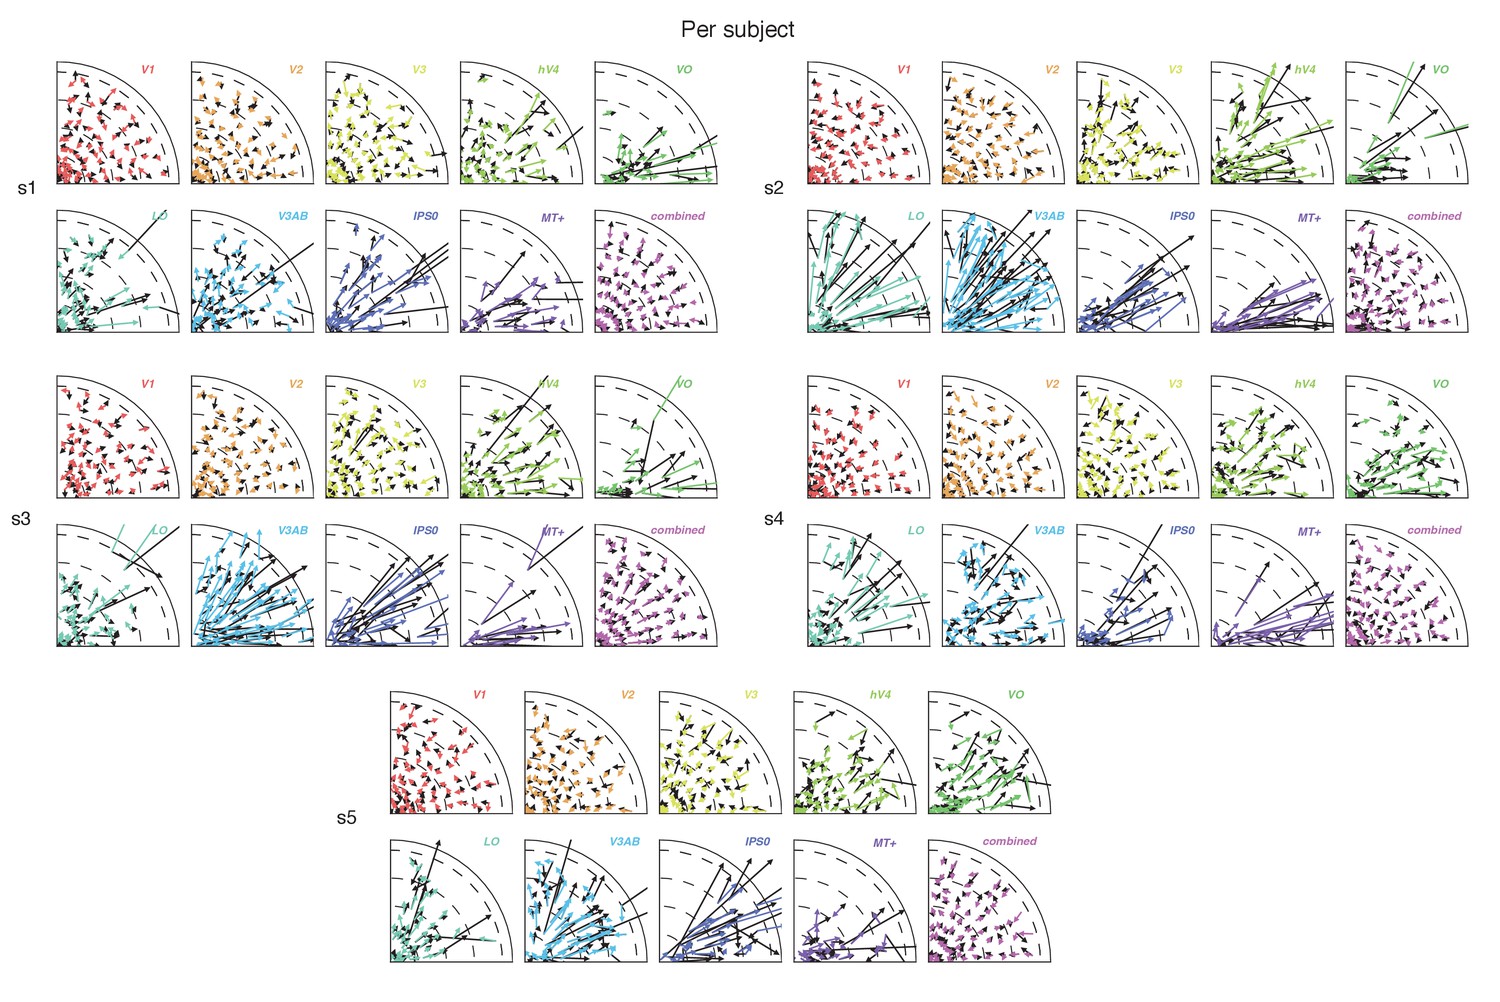
Figure 3—figure supplement 1
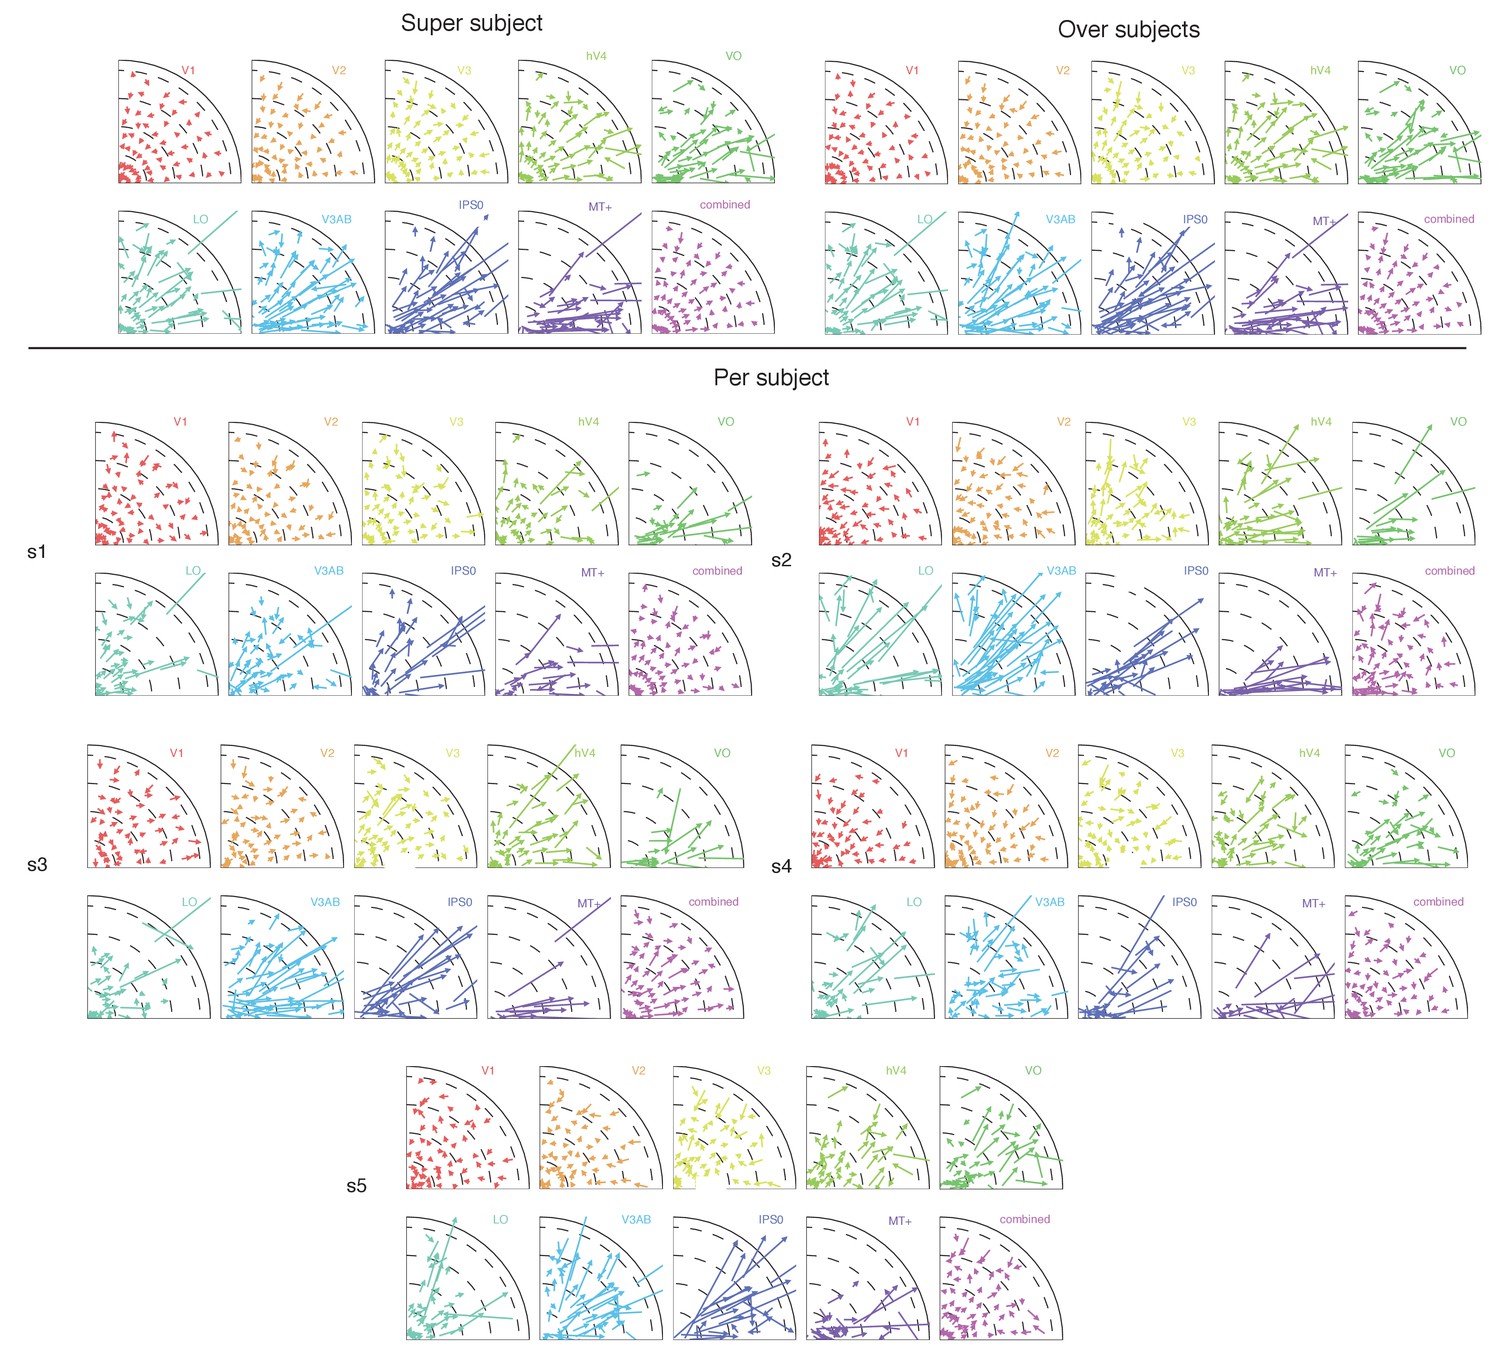
pRF shift plots for all statistical methods.
Shift vectors run from the Attend Fixation to the Attend Stimulus pRF location. This figure indicates that the shift patterns seen in the 'super subject' are almost identical to the 'over subjects' method, and highly agree with the individual subject figures. Note the radial shift direction that is readily apparent in all ROIs in all subjects. Also note how the combined ROI clearly shows parafoveal pRFs shifting toward the periphery and peripheral pRFs shifting toward the fovea across subjects. Finally, the absence of pRFs near the vertical meridian in data from all subjects in VO, IPS0 and MT+ highlights the overrepresentation of the horizontal meridian that is found in all ROIs (see Supplementary file 1- Tables 3, 14 and 15). See Materials and methods section for definitions of 'super subject', 'over subjects' and 'per subject' methods.
Figure 3—figure supplement 2
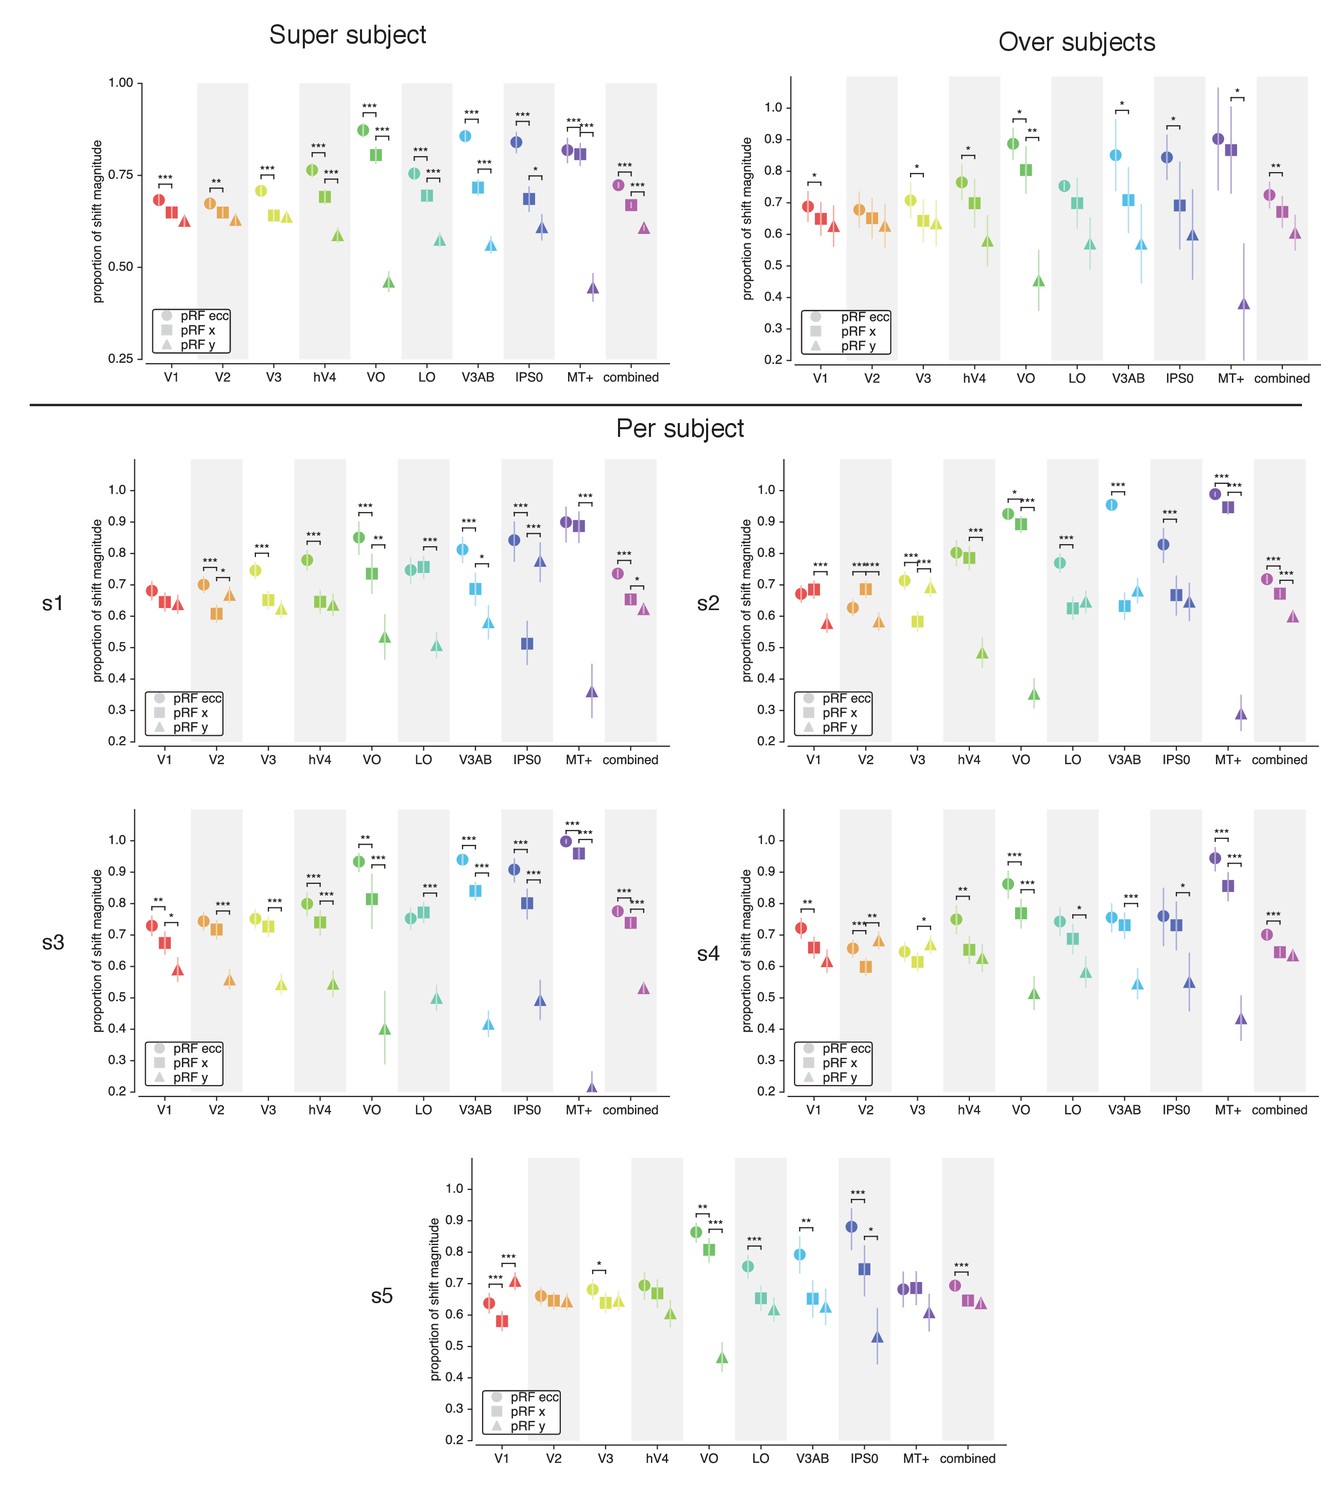
pRF shift directions for all statistical methods.
The 'over subjects' panel replicates the 'super subject' results, namely that shifts are best explained by eccentricity changes, followed by changes in pRF x and finally in pRF y in all ROIs (see Supplementary file 1 - Table 2). The dominance of eccentricity over x changes was significant in all individual subjects ('per subject' method) in the combined ROI, and in at least two (but often five) subjects in all other ROIs (see Supplementary file 1- Table 13). The individual subject evidence also replicates the finding that pRFs shifted more in the x compared to y directions in hV4/VO/LO/V3AB/IPS0/MT+ and in the combined ROI (i.e. significant in at least two out of five subjects; see Supplementary file 1 - Table 12). The dominance of x over y shifts was explained from a non-uniformity in the distribution of pRF polar angle (i.e. overrepresentation of horizontal meridian, see Supplementary file 1 -Table 3). This was also found in most individual subjects for most ROIs (see Supplementary file 1 -Tables 14 and 15). Single, double and triple asterisks indicate significant differences at p < 0.05, 0.01 and 0.001, respectively. In the 'super subject' and 'per subject' methods, error bars denote 95% CI of data over voxels; in the 'over subjects' method, error bars denote 95% CI over subjects. See Materials and methods section for definitions of 'super subject', 'over subjects' and 'per subject' methods.
Figure 3—figure supplement 3
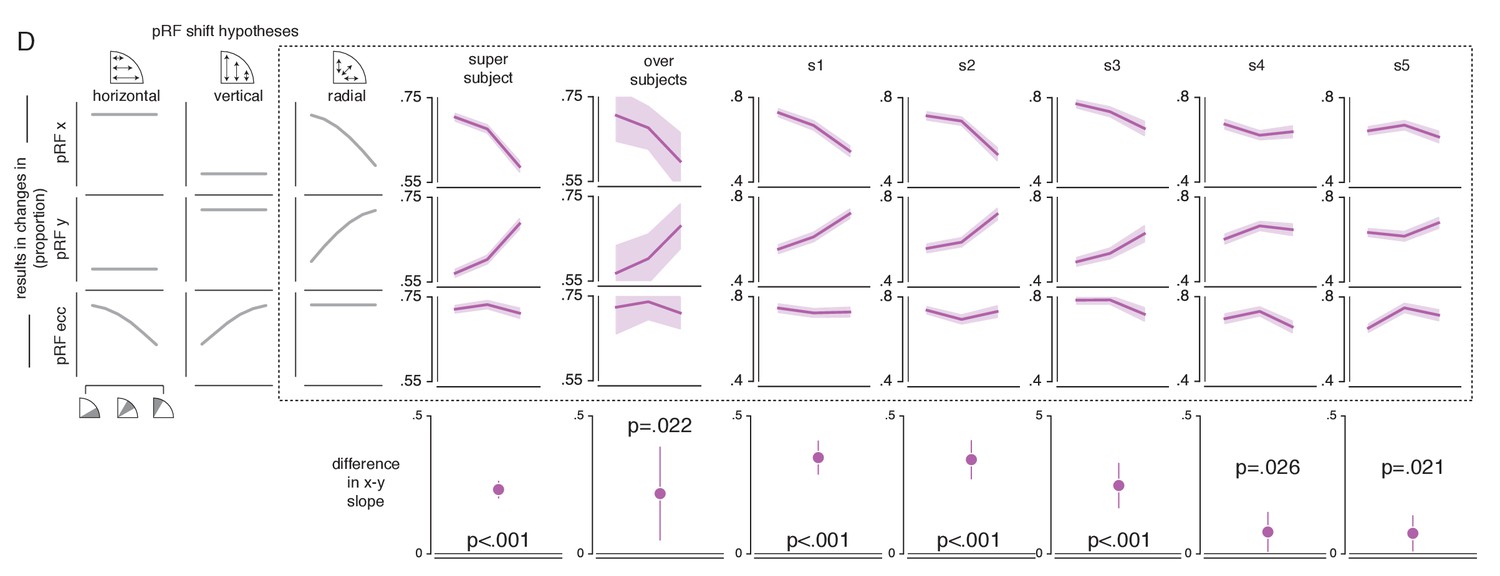
pRF x, y and eccentricity position shifts as a function of polar angle for all statistical methods.
The data from all statistical methods closely matches the radial shift direction hypothesis, showing strongest pRF x shifts close to the horizontal meridian, strongest pRF y shifts close to the vertical meridian and no polar angle dependence of pRF eccentricity shifts. Evidence for this is the more positive slope of y change over polar angle compared to slope of x change over polar angle in the 'super subject' method (see main text for statistics), for the 'over subjects' method (slope difference = 0.219, t(4) = 3.616, p = 0.022, Cohen's d = 1.808). Error bars reflect 95% CIs across voxels in the 'super subject' and 'per subject' methods, and across subjects in the 'over subjects' method. See Materials and methods section for definitions of 'super subject' and 'over subjects' methods.
Figure 4 with 2 supplements
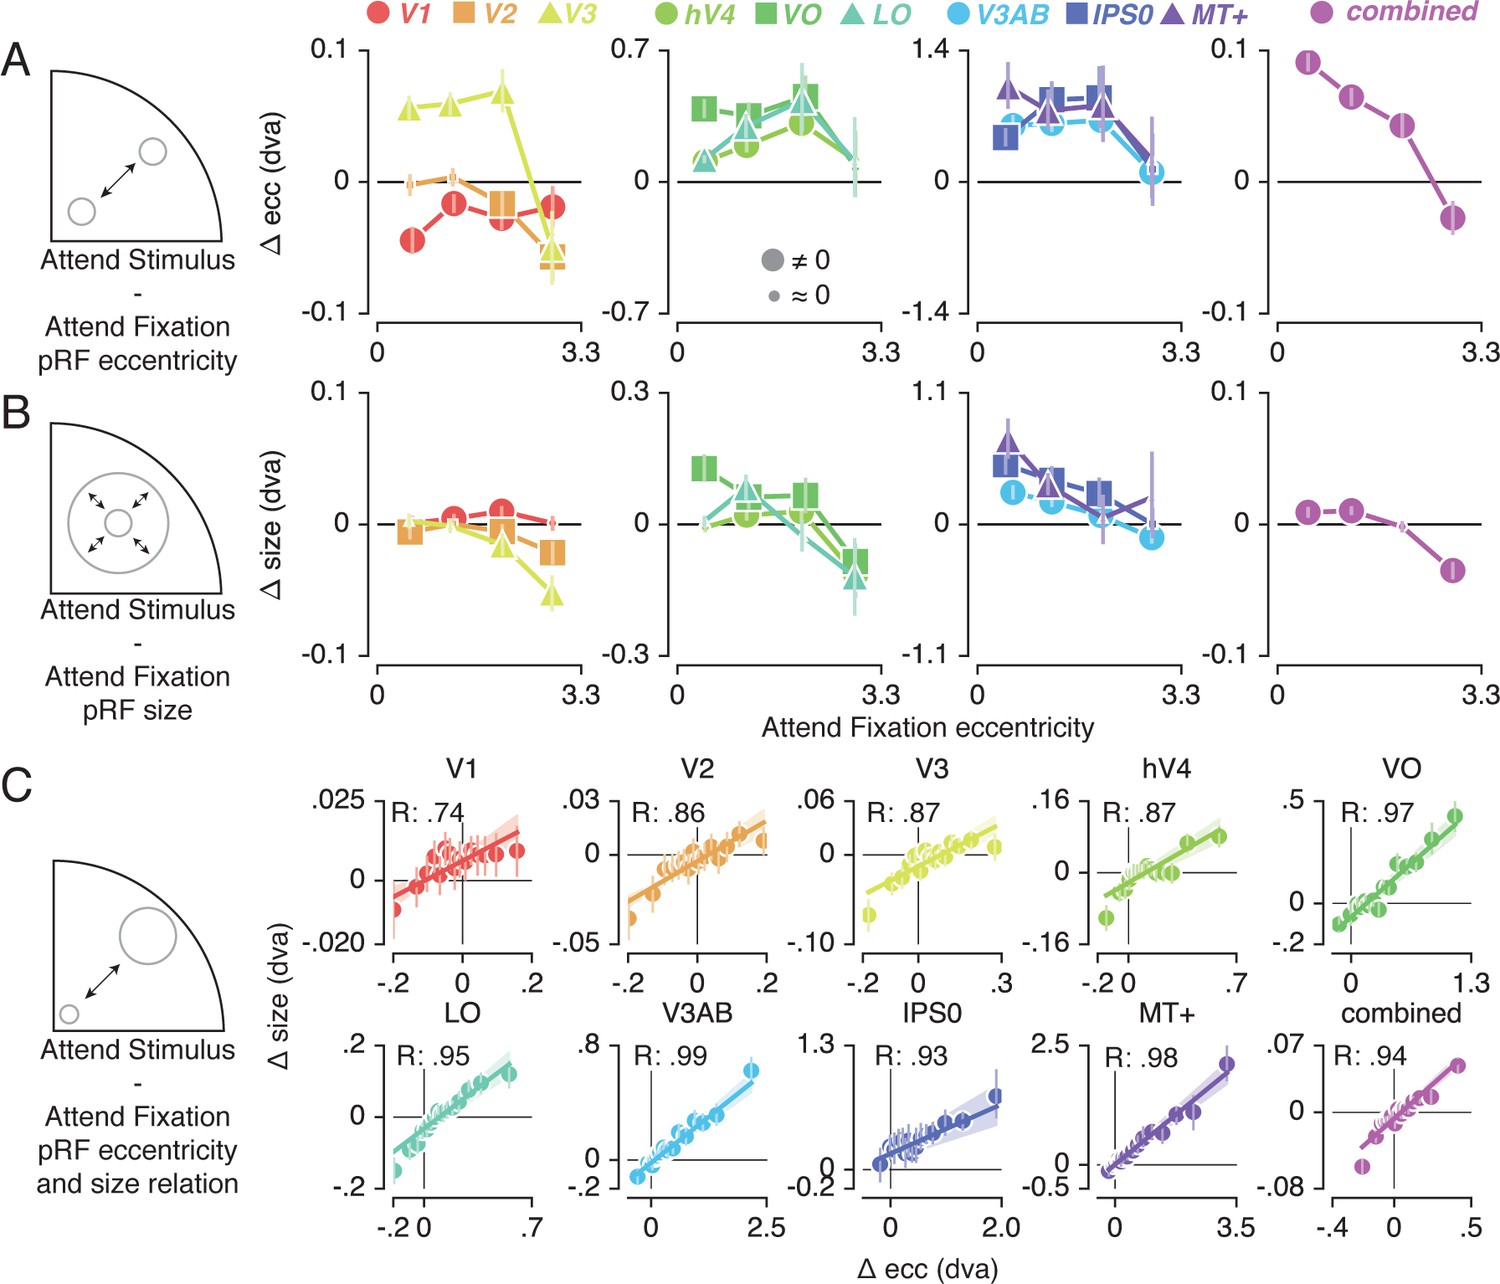
Effect of spatial attention on pRF eccentricity and size.
Difference between Attend Stimulus and Attend Fixation pRF eccentricity (A) and size (B) as a function of Attend Fixation eccentricity. Overall, parafoveal pRFs tend to shift away from the fovea and increase in size, while peripheral pRFs tend to shift toward the fovea and decrease in size. (C) Changes in pRF eccentricity and size were strongly correlated in all ROIs. In (A) and (B), markers are increased in size when bootstrapped distributions differ from 0 with FDR corrected p < 0.05. In (C) the markers' error bar denotes 95% CI of data over voxels and shaded error regions denote 95% CI of linear fit parameters over bins. Also see Figure 4—figure supplements 1–2.
Figure 4—figure supplement 1
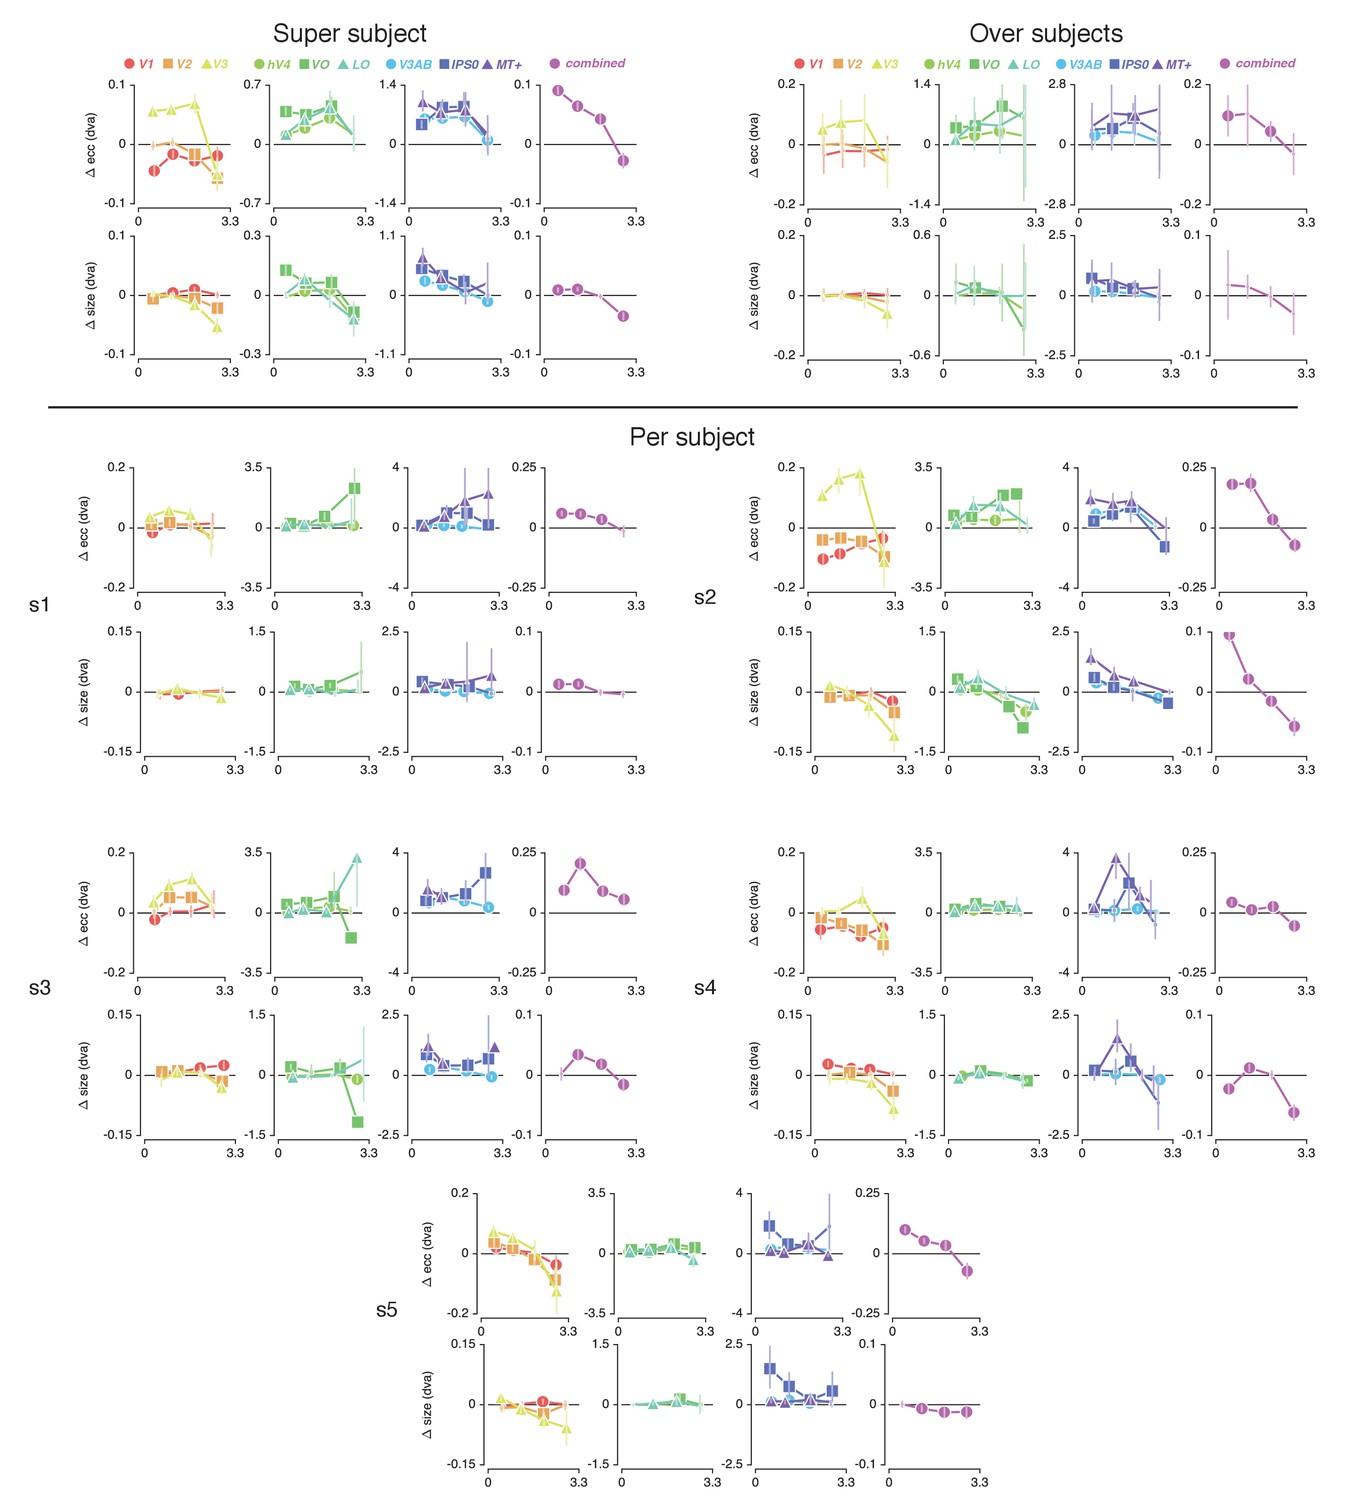
Effect of spatial attention on pRF eccentricity and size for all statistical methods.
Difference between Attend Stimulus and Attend Fixation pRF eccentricity and size as a function of Attend Fixation eccentricity (see Supplementary file 1 -Tables 4-7 and 16-23). The data show a transition from inwards to outwards shifts across the visual hierarchy in all subjects. Additionally, the progressions of change over eccentricity show some variability within ROIs between subjects. Finally, data from the combined ROI in most subjects reveal that parafoveal pRFs tend to shift away from the fovea and increase in size, while peripheral pRFs tend to shift toward the fovea and decrease in size. Error bars reflect 95% CIs across voxels in the 'super subject' and 'per subject' methods, and across subjects in the 'over subjects' method. Increased marker size indicates significance with p < 0.05 (FDR corrected for 'super subject'). See Materials and methods section for definitions of 'super subject', 'over subjects' and 'per subject' methods.
Figure 4—figure supplement 2

Correlation between pRF eccentricity and size changes for all statistical methods.
In the 'over subjects' method, we find that pRF eccentricity and size changes are significant in all ROIs except IPSO (although p = 0.070). In the 'per subject method', we find such a significant correlation in at least two (but often five) subjects (see Supplementary file 1 -Table 24). Error bars reflect 95% CIs across voxels in the 'super subject' and 'per subject' methods, and across subjects in the 'over subjects' method. See Materials and methods section for definitions of 'super subject', 'over subjects' and 'per subject' methods.
Figure 5 with 2 supplements

Capturing spatial attention in attentional gain field model.
(A) Observed (black) and predicted (color) pRF shifts. (B) Observed and predicted changes in pRF eccentricity (the main pRF shift direction) as a function of eccentricity. Markers depict data and lines the corresponding attentional gain field model fit. (C) Fitted fixation and stimulus attentional gain field sizes. Dots depict individual subjects, and bars the average across subjects. (D-F). Left panels depict changes in eccentricity induced by attending fixation (dark gray lines) and by attending the stimulus (light gray lines). Although both sources of attention cause a pull toward the fovea in all ROIs, relative shift magnitude differs across eccentricity. The right panels show how the difference between both spatial attention conditions results in the patterns as observed in (B). In (B), error bars denote 95% CIs over subjects. Plotting conventions as in Figure 3. Also see Figure 5—figure supplements 1–2.
Figure 5—figure supplement 1
Attentional gain field modeling results for each subject - shift vectors.
Arrows depict observed (black) and predicted (color) pRF shifts. This shows that the model closely captured the data in all individual subjects.
Figure 5—figure supplement 2
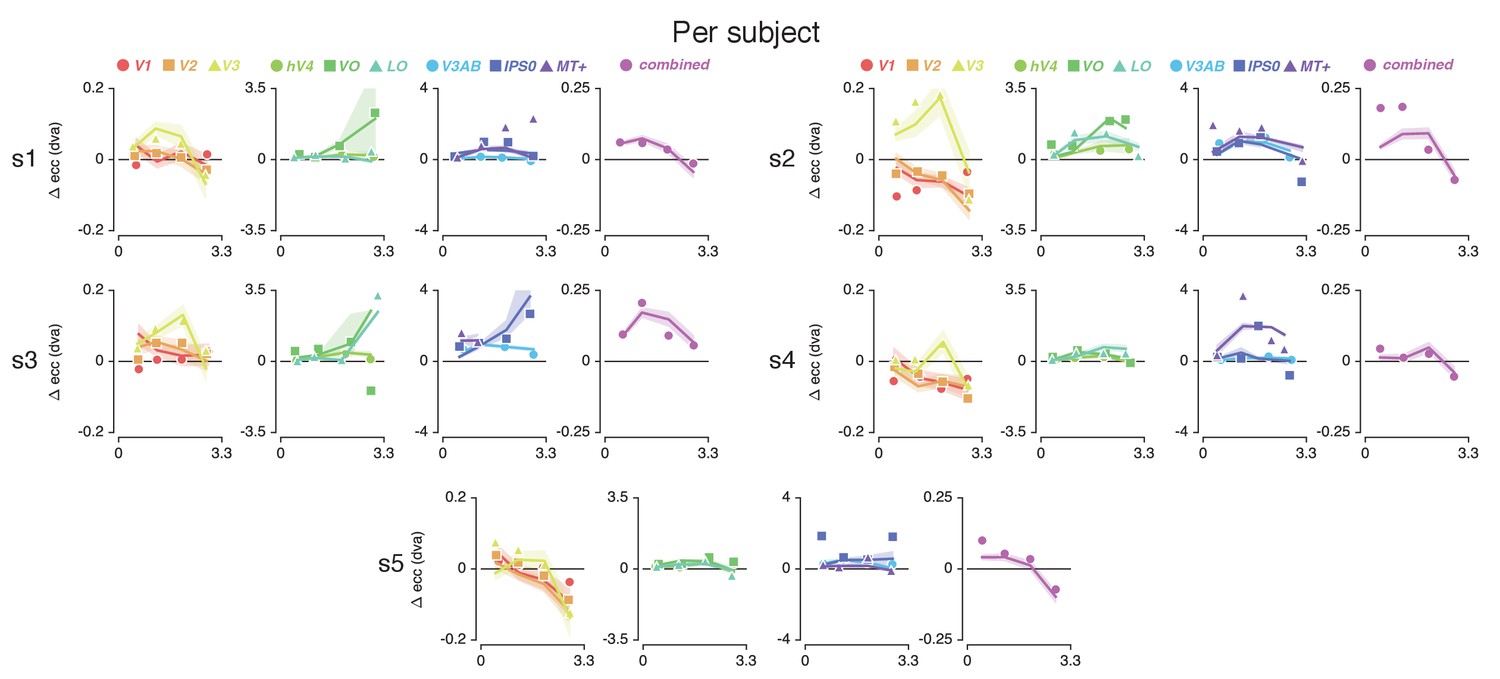
Attentional gain field modeling results for each subject - changes in pRF eccentricity.
Observed (markers) and predicted (solid lines) pRF eccentricity difference between Attend Fixation and Attend Stimulus conditions for each subject. This shows that although individual subjects show some variation in the changes in pRF eccentricity across eccentricity, this is well captured by the attentional gain field model. This suggests that individual differences in average pRF changes are not the result of a differential attentional mechanism operating between subjects, but rather that this results from known individual differences in baseline distribution of pRF parameters (e.g. see Figure 2—figure supplement 1). Shaded areas indicate 95% CI over voxels.
Figure 6 with 4 supplements
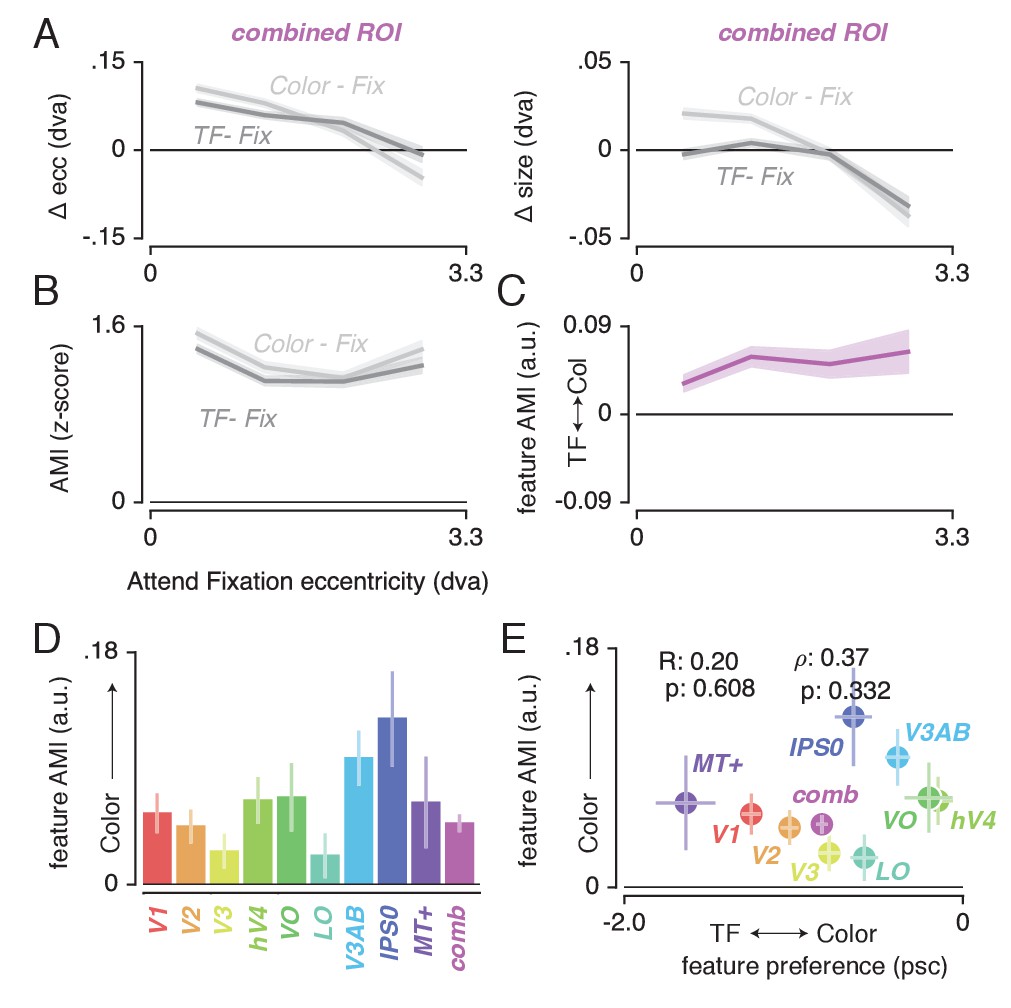
Feature-based attentional modulation of pRF changes.
(A) Differences in pRF eccentricity and size relative to the Attend Fixation condition, for both the Attend Color and Attend TF conditions. The changes in both eccentricity and size are more pronounced when attending changes in color versus TF changes in the bar. (B) The Attentional Modulation Index (AMI) combines eccentricity and size changes to form one robust index of spatial attention and is greater when attending color compared to TF. (C) The feature AMI quantifies this difference. Positive values of this feature AMI across eccentricity confirm stronger pRF modulations when attending color compared to TF. (D) Average feature AMI for each ROI, extending greater observed pRF modulations when attending color compared to TF to all individual ROIs. (E) Average feature AMI as a function of average feature preference across ROIs. Feature preference increases with higher color compared to TF preference. Although hV4 and VO are relatively sensitive to color and MT+ is relatively sensitive to TF, feature AMI is comparable in these areas. Error bars denote 95% CI over voxels. Also see Figure 6—figure supplements 1–4.
Figure 6—figure supplement 1
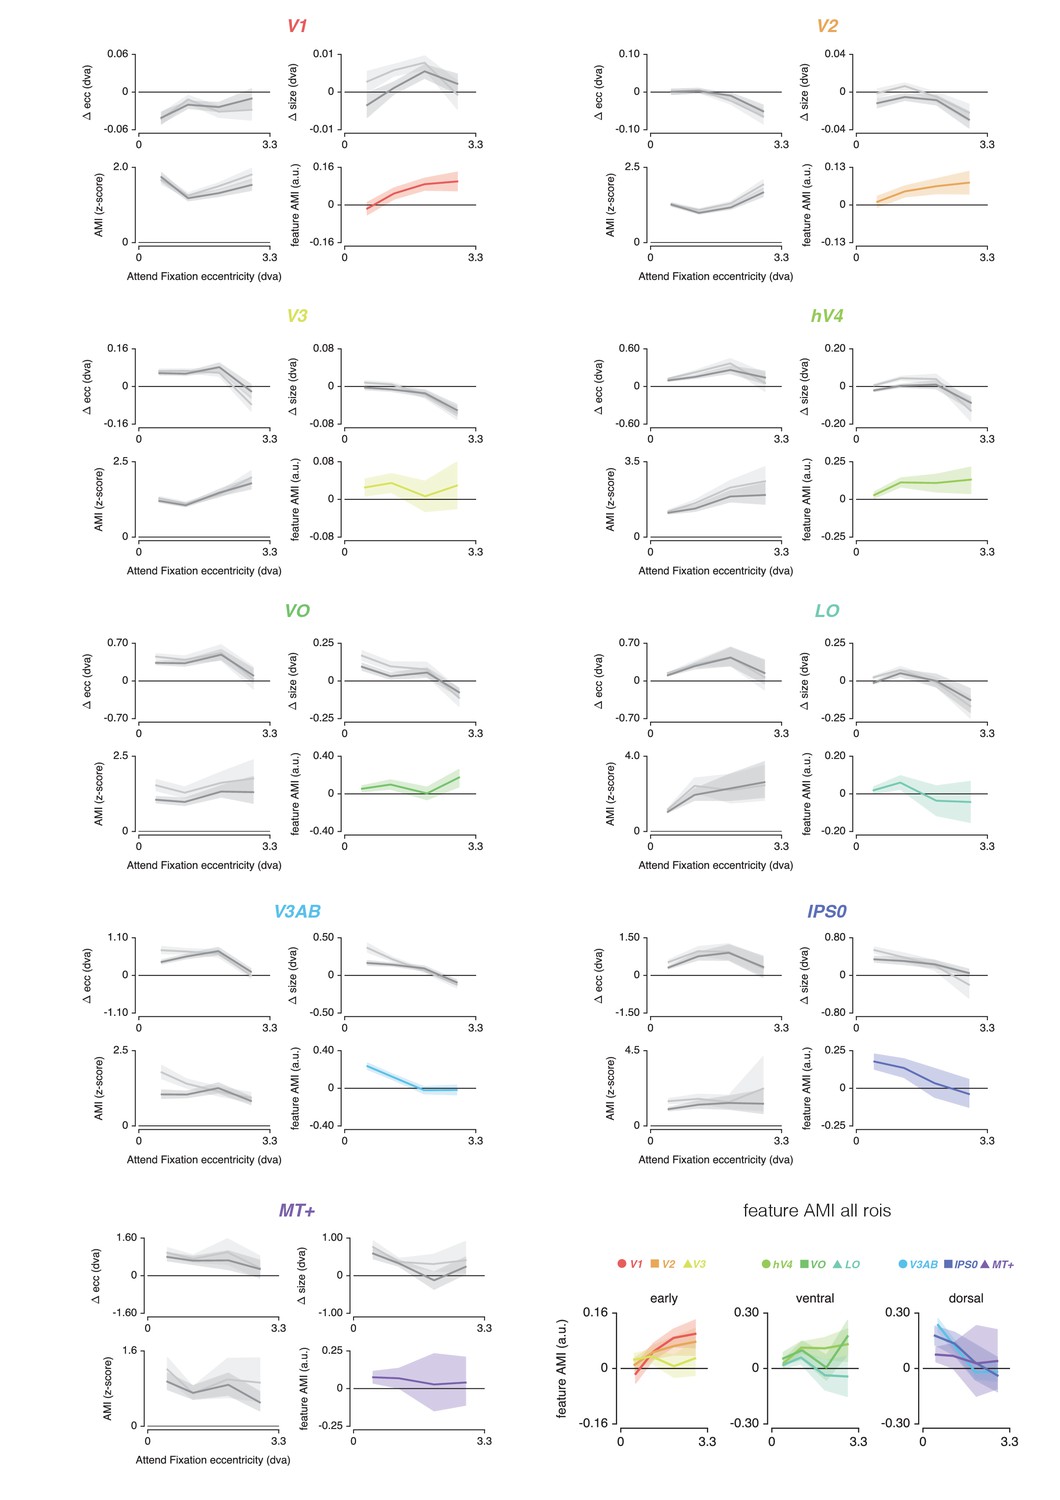
Feature-based attentional modulation of pRF parameters across eccentricity for each ROI.
The bottom-right panel shows the feature AMI for all ROIs together for the 'super subject'. This shows that feature AMI is generally positive along eccentricity across ROIs. In addition, differences in this pattern between ROIs are comparable to differences in the magnitude of pRF changes that resulted from differential spatial attention (Figure 4). Figure 5 showed that these differential patterns along eccentricity are well explained using a similar attentional influence across visual regions. This means that differential feature AMI patterns along eccentricity are likely the result of differential pRF center and size distributions between ROIs. Inspecting differences in feature AMI between visual regions should therefore be inspected as an average across the visual field (as presented in Figure 6D and E). Error bars denote 95% CI over voxels.
Figure 6—figure supplement 2
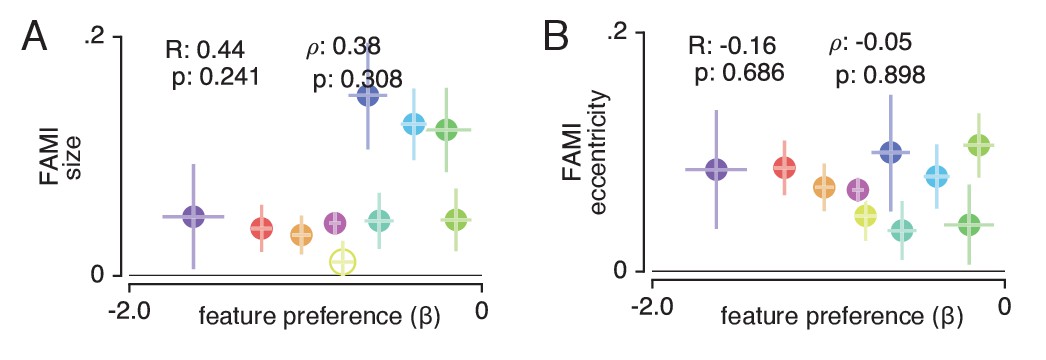
Feature AMI compared to feature preference across ROIs with different ways of computing the FAMI.
In (A), FAMI only includes the change in pRF size, whereas in (B), FAMI only includes the change in pRF eccentricity. This reveals comparable results to use of the combined FAMI pRF size and eccentricity measure. This corroborates that changes in pRF eccentricity and size are closely coupled, warranting the combination of both measures into a single attentional index as presented in the main figure. Error bars denote 95% CI over voxels. Filled markers indicate a significant deviation from 0 with FDR corrected p < 0.05.
Figure 6—figure supplement 3

Feature-based attentional modulation of pRF size and eccentricity changes in the combined ROI for all statistical methods.
Differences in pRF eccentricity and size relative to the Attend Fixation condition, for both the Attend Color and Attend TF conditions separately.The changes in both eccentricity and size are more pronounced when attending changes in color versus TF in the bar. This pattern is most clear in the 'super subject' and 'over subjects' methods (albeit with larger variance), and is present in most individual subjects. Error bars reflect 95% CIs across voxels in the 'super subject' and 'per subject' methods, and across subjects in the 'over subjects' method. See Materials and methods section for definitions of 'super subject', 'over subjects' and 'per subject' methods.
Figure 6—figure supplement 4
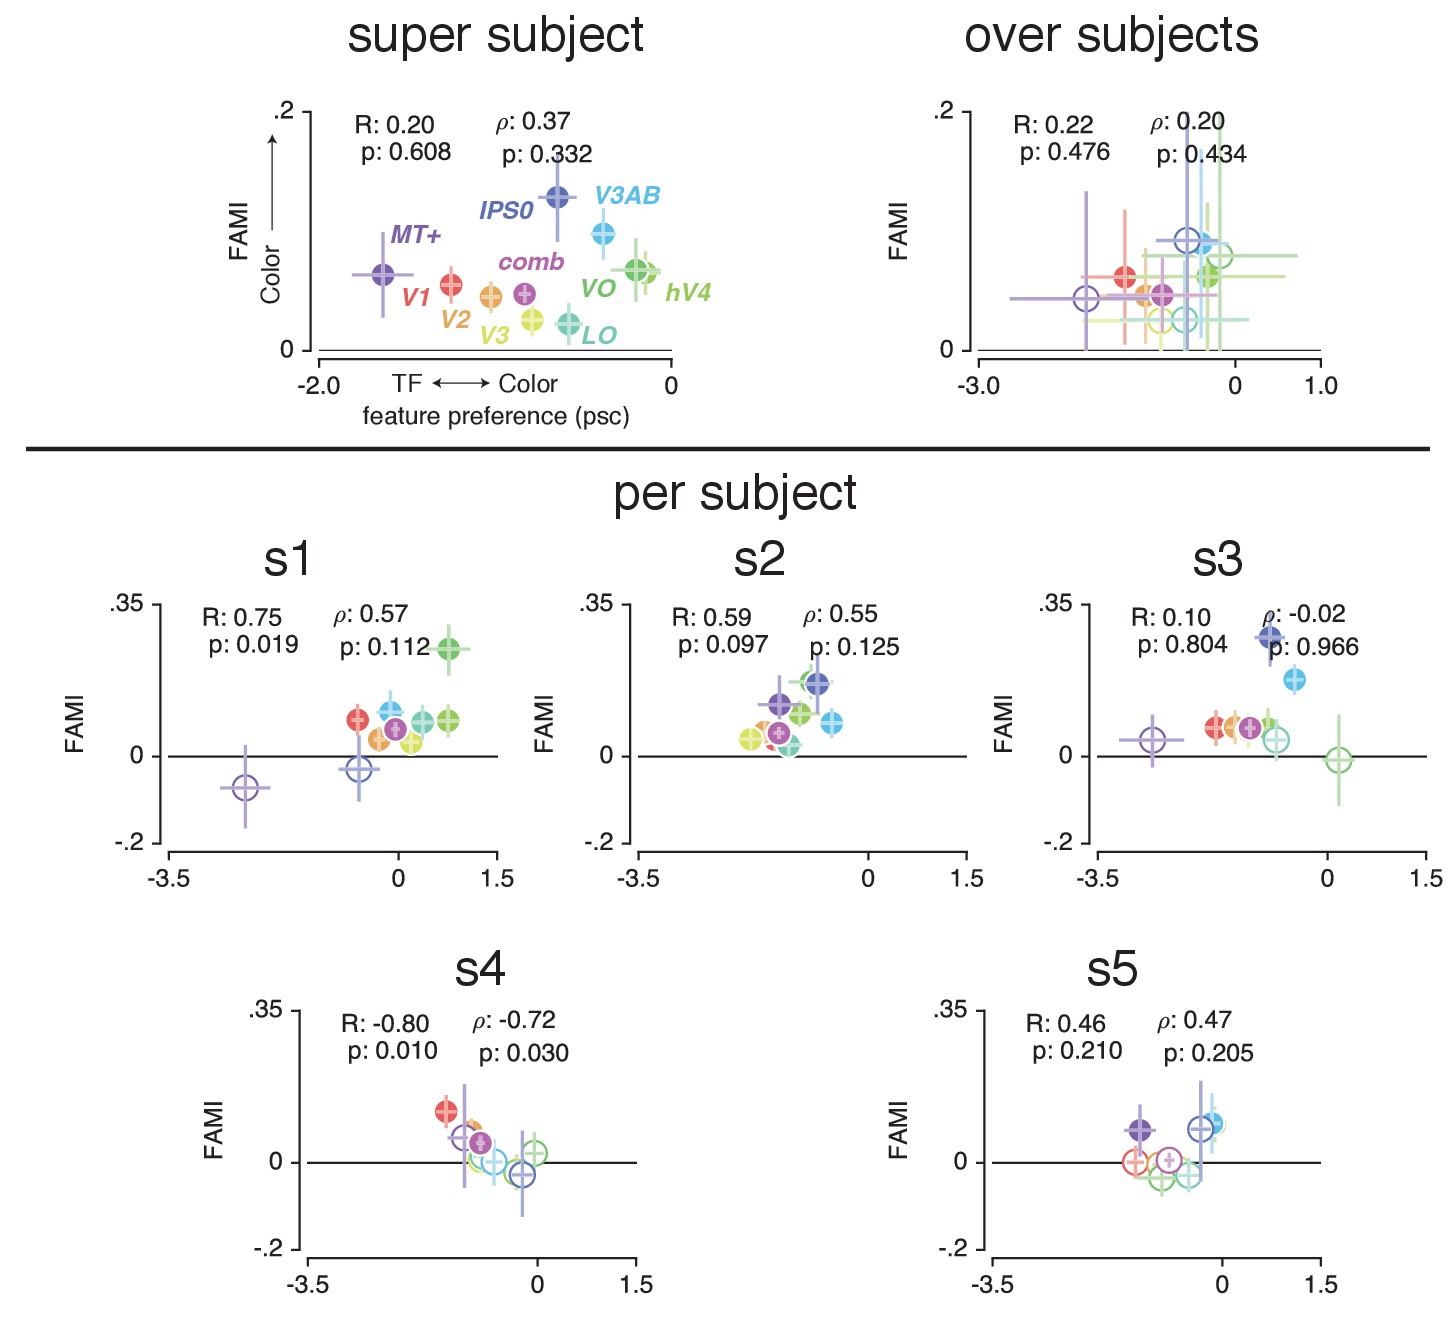
Feature AMI compared to feature preference for each ROI, for all statistical methods.
The y-axis displays feature AMI, which increases when pRF modulations (size and eccentricity changes combined, see Materials and methods) are greater when attending color compared to TF. The x-axis displays feature preference, which increases with higher color compared to TF preference. pRF modulations were greater when attending color in all ROIs in the 'super subject' method, and were unrelated to feature preference (see Supplementary file 1 -Table 9). In the 'over subjects' method, we confirm that feature AMI was not different between ROIs (RM ANOVA, factor of ROI: F(8,32) = 0.631, p = 0.746, η2p= 0.066), and that it was on average 0.059 over ROIs across subjects, F(1,4) = 18.868, p = 0.012, η2p = 0.394). Additionally, we found that for the ‘over subjects’ method, feature AMI was significantly positive in the combined ROI t(4) = 4.316, p = 0.012, Cohen’s d = 2.158 (see Supplementary file 1 -Table 25 for all ROIs). Finally, we also found no correlation with feature preference in the 'over subjects' method (mean Spearman correlation = 0.20, t(4) = 0.850, p = 0.434, Cohen's d = 0.446; mean Pearson correlation = 0.22, t(4) = 0.770, p = 0.476, Cohen’s d = 0.429). Error bars reflect 95% CIs across voxels in the 'super subject' and 'per subject' methods, and across subjects in the 'over subjects' method. See Material and methods section for definitions of 'super subject', 'over subjects' and 'per subject' methods.
Figure 7 with 1 supplement
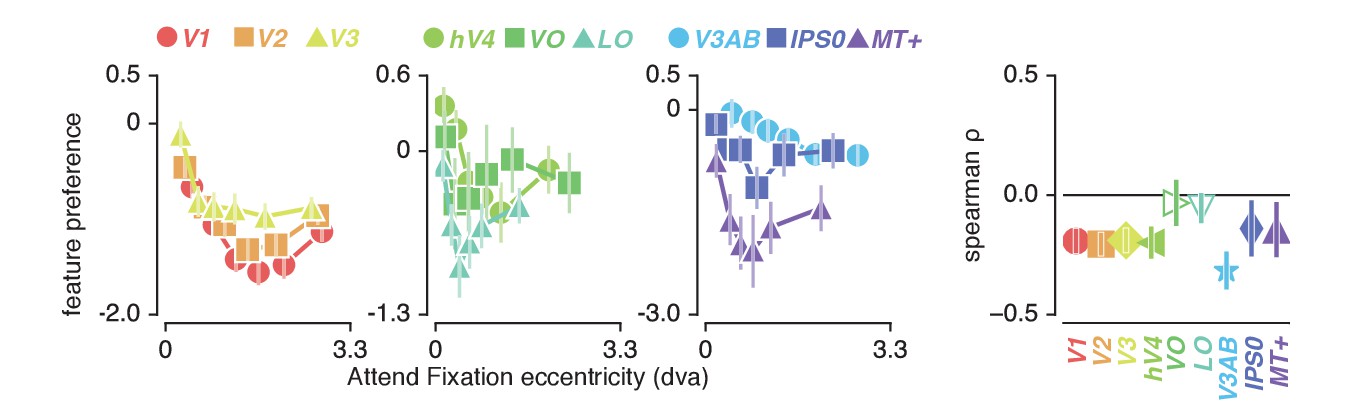
Feature preference and eccentricity.
Preference to color compared to TF is greatest near the fovea. Error bars denote 95% CI over voxels. Also see Figure 7—figure supplement 1.
Figure 7—figure supplement 1
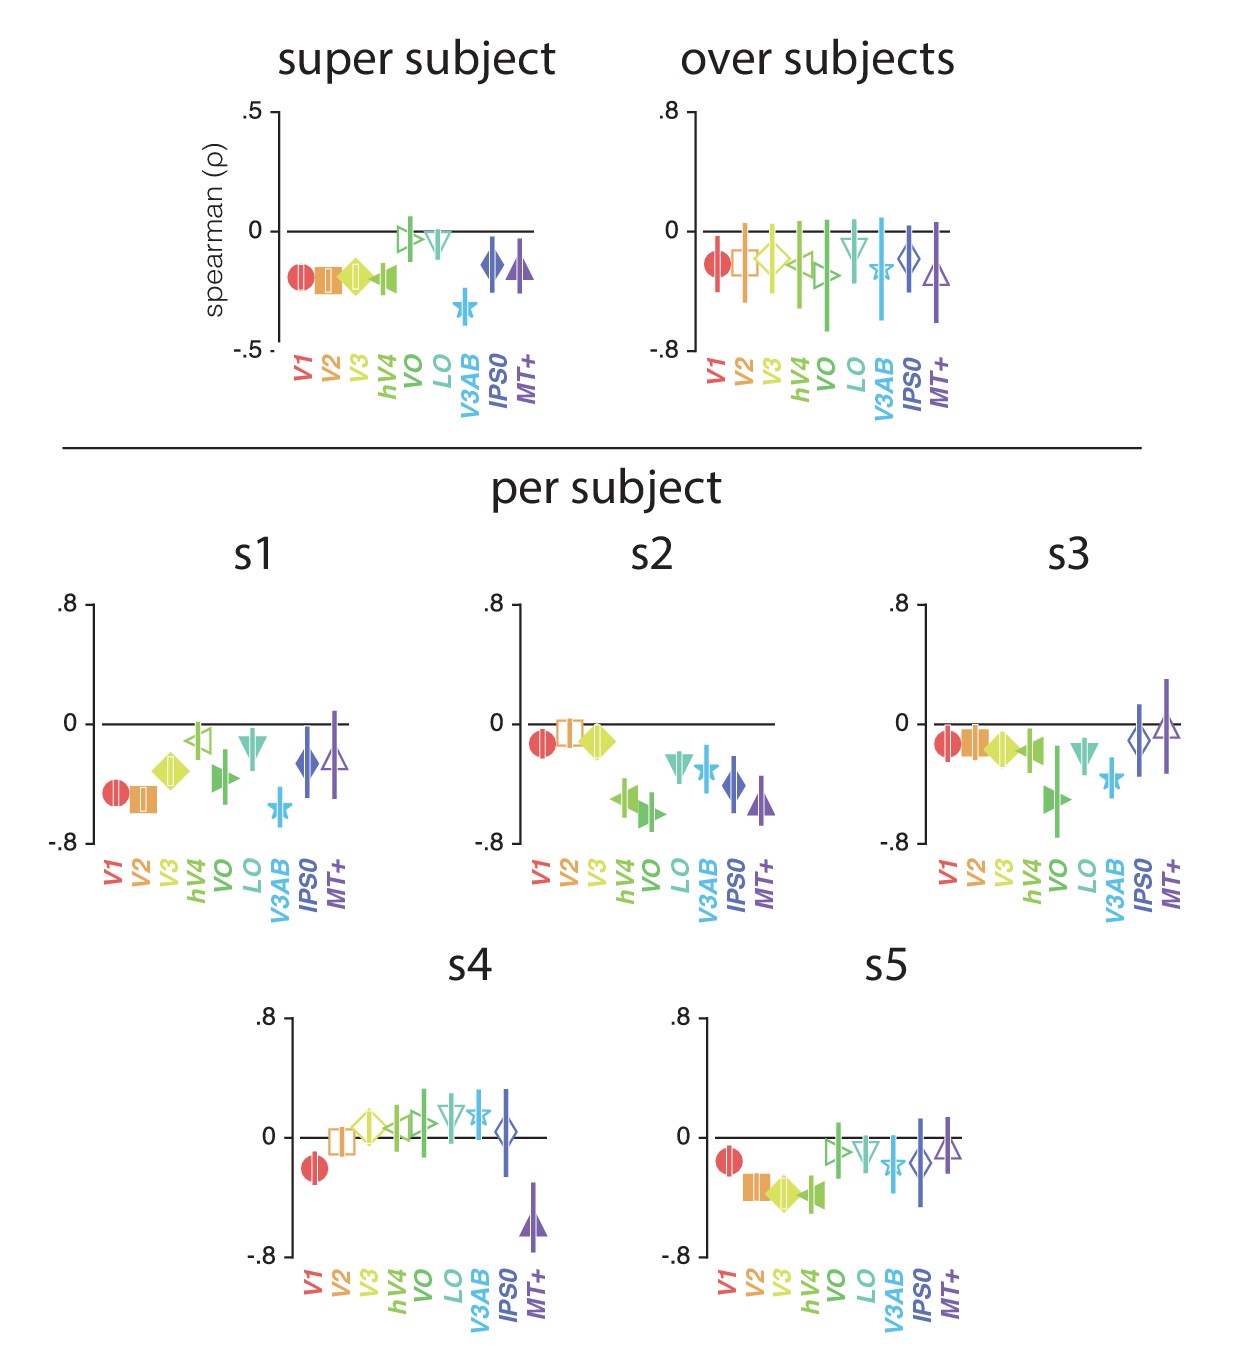
Color compared to TF preference versus eccentricity correlations for all statistical methods.
The 'super subject' method shows negative Spearman correlations in all ROIs except VO and LO (see Supplementary file 1 -Table 10). The 'over subjects' method shows that this correlation is negative on average and does not vary across ROI (RM ANOVA with main factor of ROI F(8,32) = 0.354, p = 0.937, η2p = 0.030, on average -0.22 over ROIs, F(1,4) = 15.630, p = 0.017, η2p = 0.641). When looking at individual subjects, we find that correlations are positive in at least two but often in the majority of subjects across ROIs (see Supplementary file 1 -Table 26). Error bars reflect 95% CIs across voxels in the 'super subject' and 'per subject' methods, and across subjects in the 'over subjects' method. See Materials and methods section for definitions of 'super subject', 'over subjects' and 'per subject' methods.
Figure 8
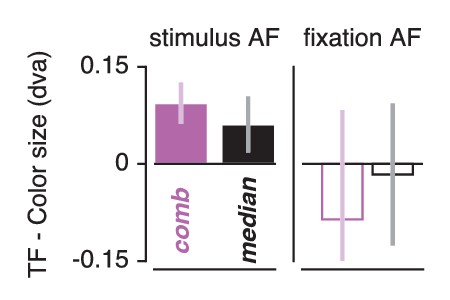
Feature-based attentional modulation of attentional gain field sizes.
Results are shown for the combined ROI and for the median across ROIs. Positive values here indicate smaller attentional gain fields when attending color compared to temporal frequency in the bar. This means that positive values demarcate stronger spatial resampling when attending color (in correspondence with Figure 6D and E). Error bars represent 95% CI over subjects.
Figure 9 with 1 supplement
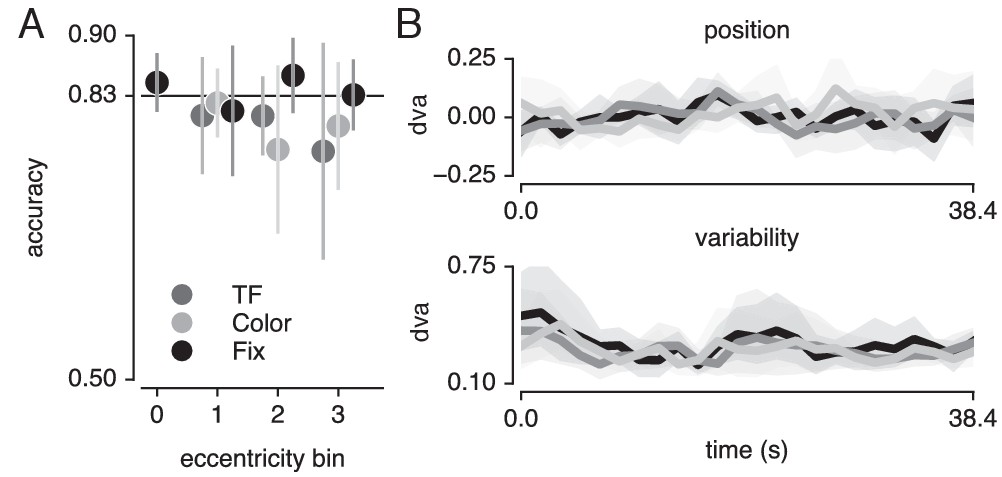
Task and fixation performance.
(A) Behavioral accuracy per attention condition and per bar stimulus eccentricity bin. Horizontal line denotes Quest target of 83%; chance level was 50%. (B) Median (top panel) and standard deviation (bottom panel) gaze position in the direction of bar movement per bar position. Error bars denote 95% CI across five participants. Also see Figure 9—figure supplement 1.
Figure 9—figure supplement 1
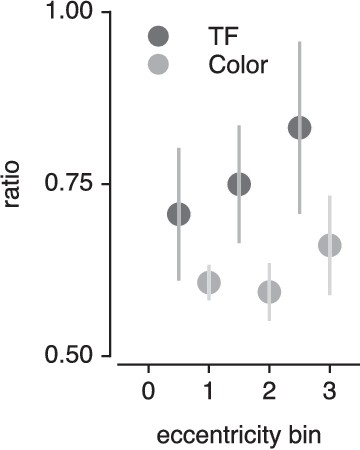
Ratio of Gabor elements of either feature value used by the Quest procedure to equate difficulty.
In the Attend Color condition, this reflected the ratio of elements that were either blue/yellow or green/magenta. In the Attend TF condition this reflected the ratio of elements that were either the high or low TF. A RM ANOVA returned a main effect of eccentricity (F(2,8) = 6.515, p = 0.021, η2p = 0.620), a main effect of condition (F(1,4) = 31.025, p = 0.005, η2p = 0.886) and no interaction between eccentricity and condition (F(2,8) = 1.323, p = 0.319, η2p = 0.249). First, this shows (as expected) that to equate difficulty, the ratio of elements with the target feature value increased with eccentricity. In addition, it shows that the number of elements with either high or low temporal frequency was higher than the ratio of elements that was either blue/yellow or green/magenta. This suggests that the two temporal frequencies used in our experiment were perceptually more similar than the two color combinations. Importantly, however, the Quest procedure successfully eliminated any effects of this potential difference on task difficulty between conditions (see results on accuracy, Figure 9A). The lack of interaction between attention condition and eccentricity is at apparent odds with the observed decreasing relative preference for color compared to temporal frequency with increasing eccentricity (Figure 7). This could suggest that the greater degree of spatial resampling we observed when attending color discounted the lower relative sensitivity for color in the periphery.
Figure 10
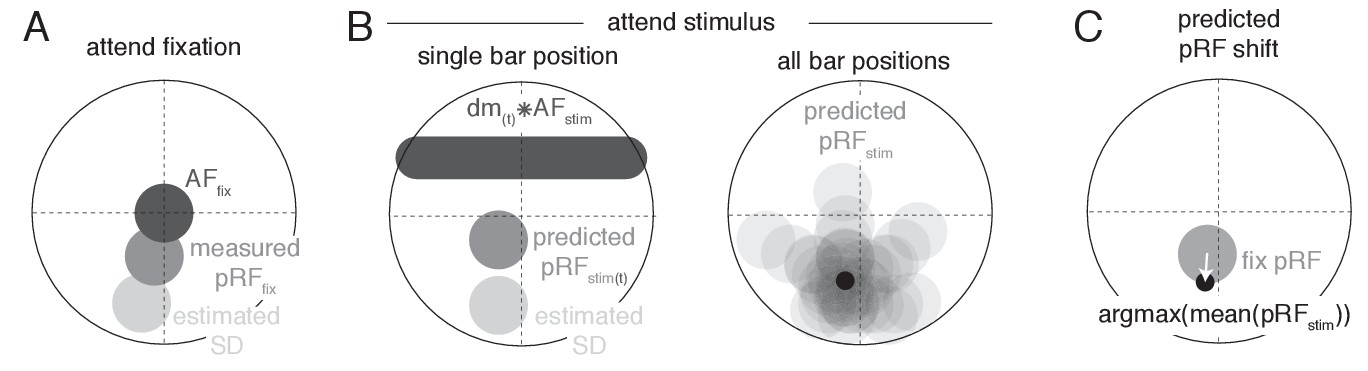
Schematic overview of modeling procedure.
(A) The Stimulus Drive (SD) was estimated by dividing the measured Attend Fixation pRF by an AF at fixation (). (B) Attention toward the bar stimulus at a given timepoint was modeled as the multiplication of the estimated SD with the bar stimulus at that timepoint ( ) convolved with another AF (). These predicted Attend Stimulus pRFs were averaged over all timepoints. The maximum position of this profile was taken as the predicted Attend Stimulus pRF position. (C) The predicted pRF shift ran from the measured Attend Fixation pRF toward the predicted Attend Stimulus position.
Additional files
-
Supplementary file 1
Statistical tables.
- https://doi.org/10.7554/eLife.36928.028
-
Transparent reporting form
- https://doi.org/10.7554/eLife.36928.029
Download links
A two-part list of links to download the article, or parts of the article, in various formats.
Downloads (link to download the article as PDF)
Open citations (links to open the citations from this article in various online reference manager services)
Cite this article (links to download the citations from this article in formats compatible with various reference manager tools)
Spatial sampling in human visual cortex is modulated by both spatial and feature-based attention
eLife 7:e36928.
https://doi.org/10.7554/eLife.36928


