Functional properties of stellate cells in medial entorhinal cortex layer II
- Norwegian University of Science and Technology, Norway
Figures
Figure 1 with 3 supplements
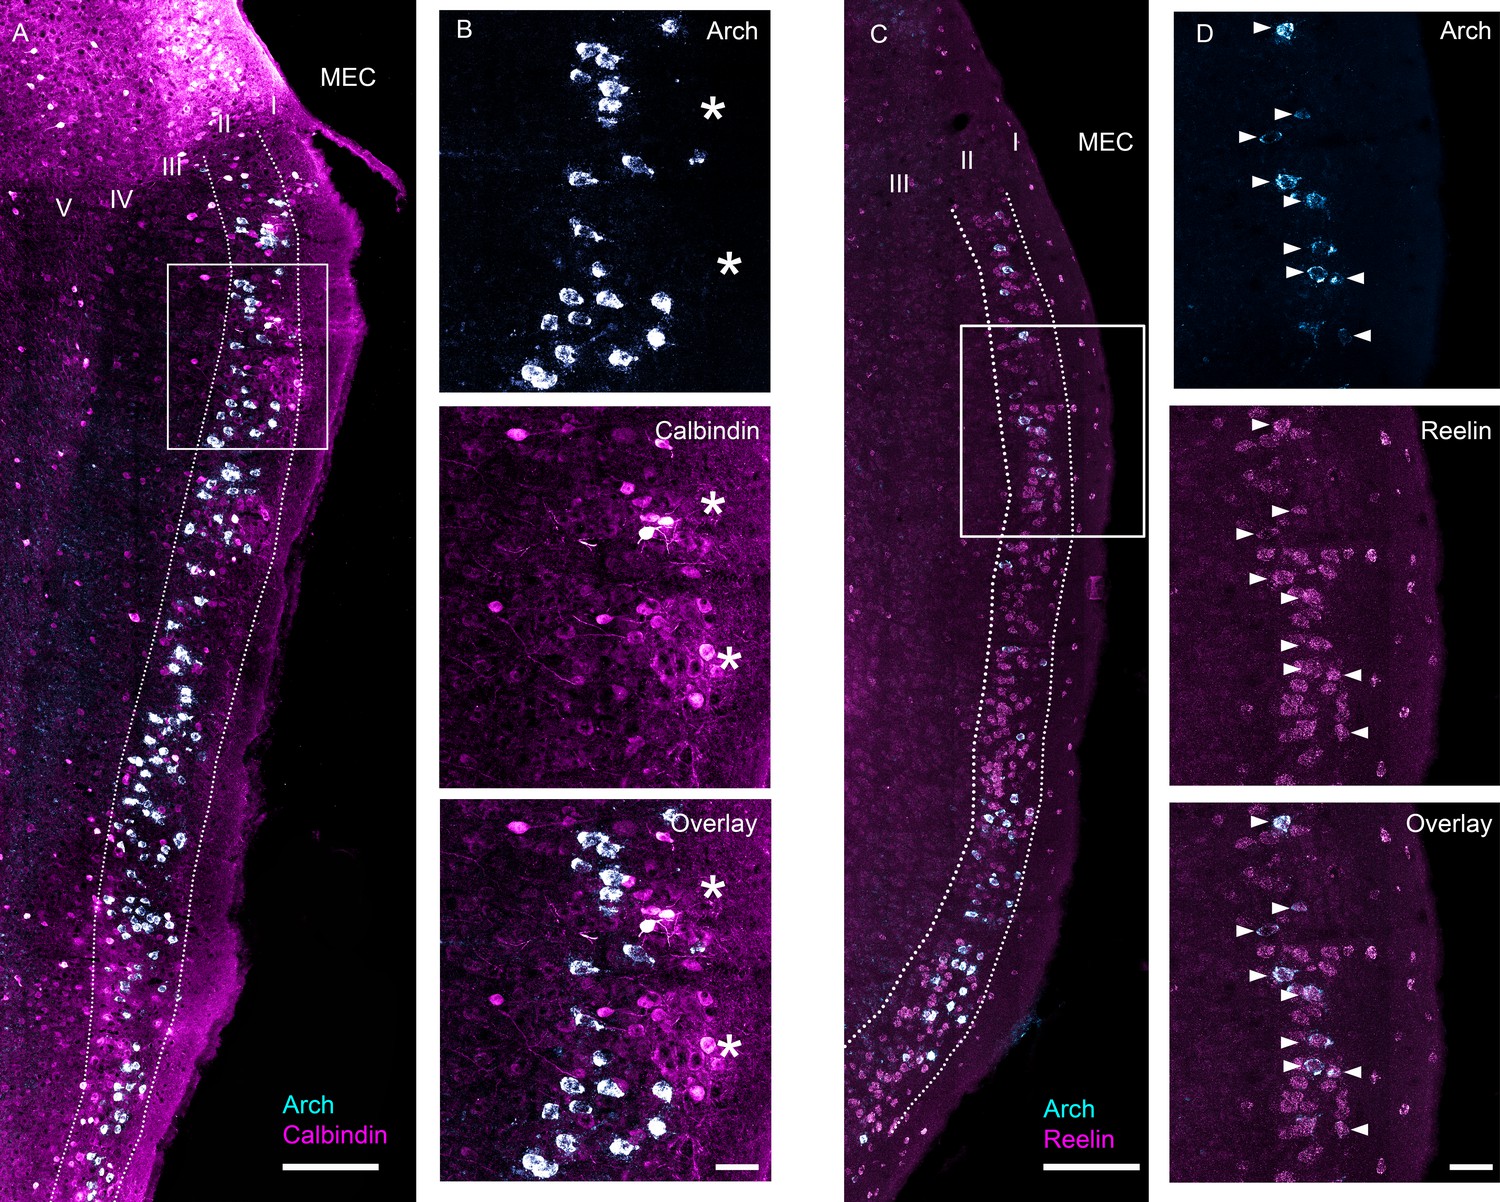
Characterization of ArchT expression in the EC-tTA x tetO-ArchT-GFP transgenic mouse line.
Images are 63x scans acquired under a confocal microscope at multiple focal planes and collapsed into a single maximum intensity projection. (A) Overlap between Arch mRNA expression (cyan) and calbindin, a marker for MEC layer II pyramidal neurons, protein expression (magenta). (B) Blowup of boxed area in (A) for Arch mRNA expression (top), calbindin protein expression (middle) and overlay (bottom). Asterisks indicate islands of calbindin-positive cells. None of the Arch-expressing cells in this section also expressed calbindin. (C) Overlap between Arch mRNA expression (cyan) and reelin, a marker for MEC layer II stellate cells, mRNA expression (magenta). (D) Blowup of boxed area in (C). All the Arch-expressing cells also expressed reelin in this field of view. Scale bars are 200 um for overview images and 50 μm for blowups.
Figure 1—figure supplement 1
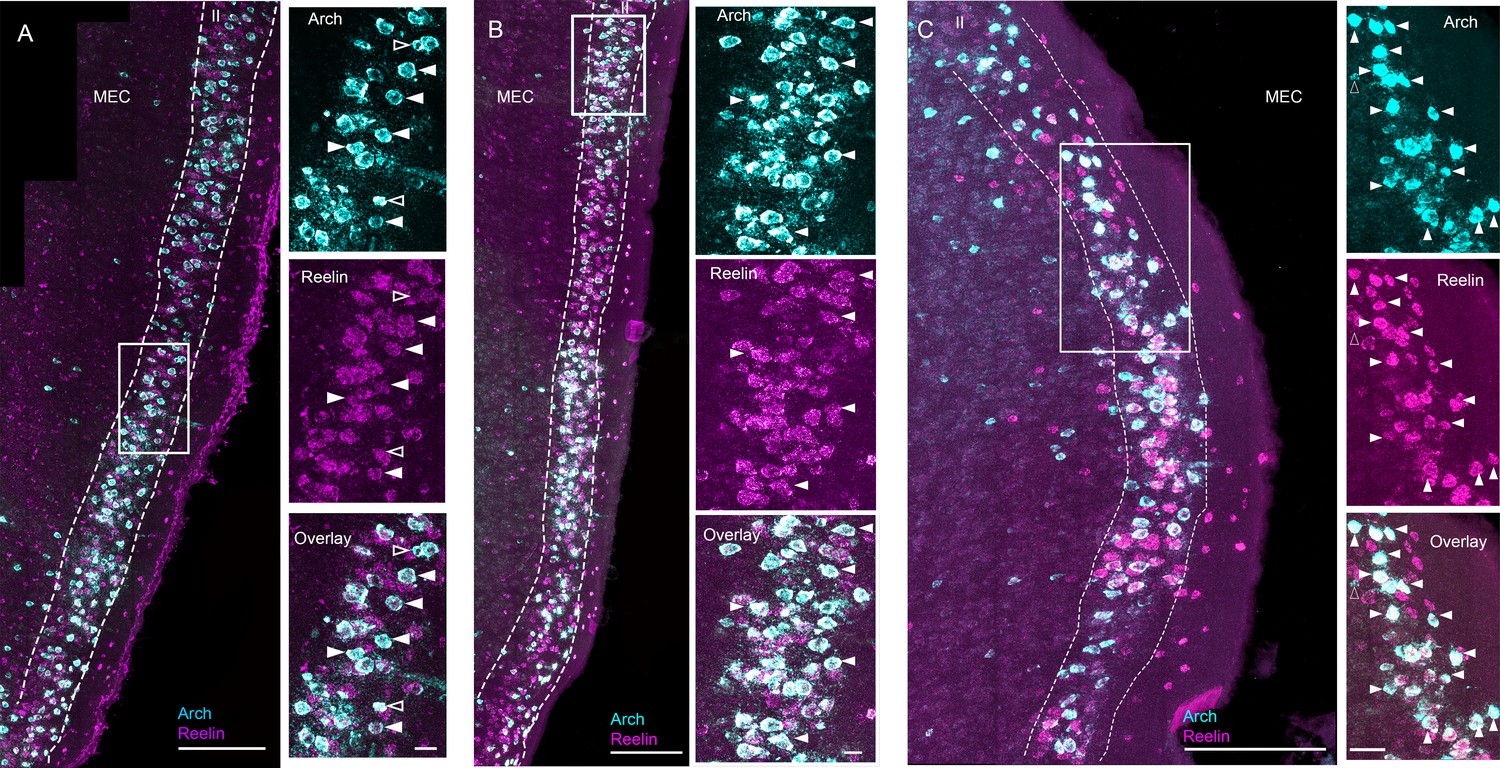
Examples of ArchT and reelin mRNA labeling in three additional EC-tTA x tetO-ArchT-GFP mice.
Images are 63x scans of sagittal sections acquired under a confocal microscope at multiple focal planes and collapsed into a single maximum intensity projection. Panels (A–C) show stainings from three different animals. Wide view of Arch (cyan) and reelin (magenta) are shown on the left and blowups of the boxed area are shown on the right. Arch label was largely limited to layer II. Within layer II, the vast majority of cells expressed reelin. A subset of the double-labeled cells are marked with arrowheads and all of the non-double-labeled Arch + cells are marked with open arrowheads. All unmarked Arch + cells were also positive for reelin. Scale bars are 200 microns for the overview images and 50 microns for the blowups.
Figure 1—figure supplement 2
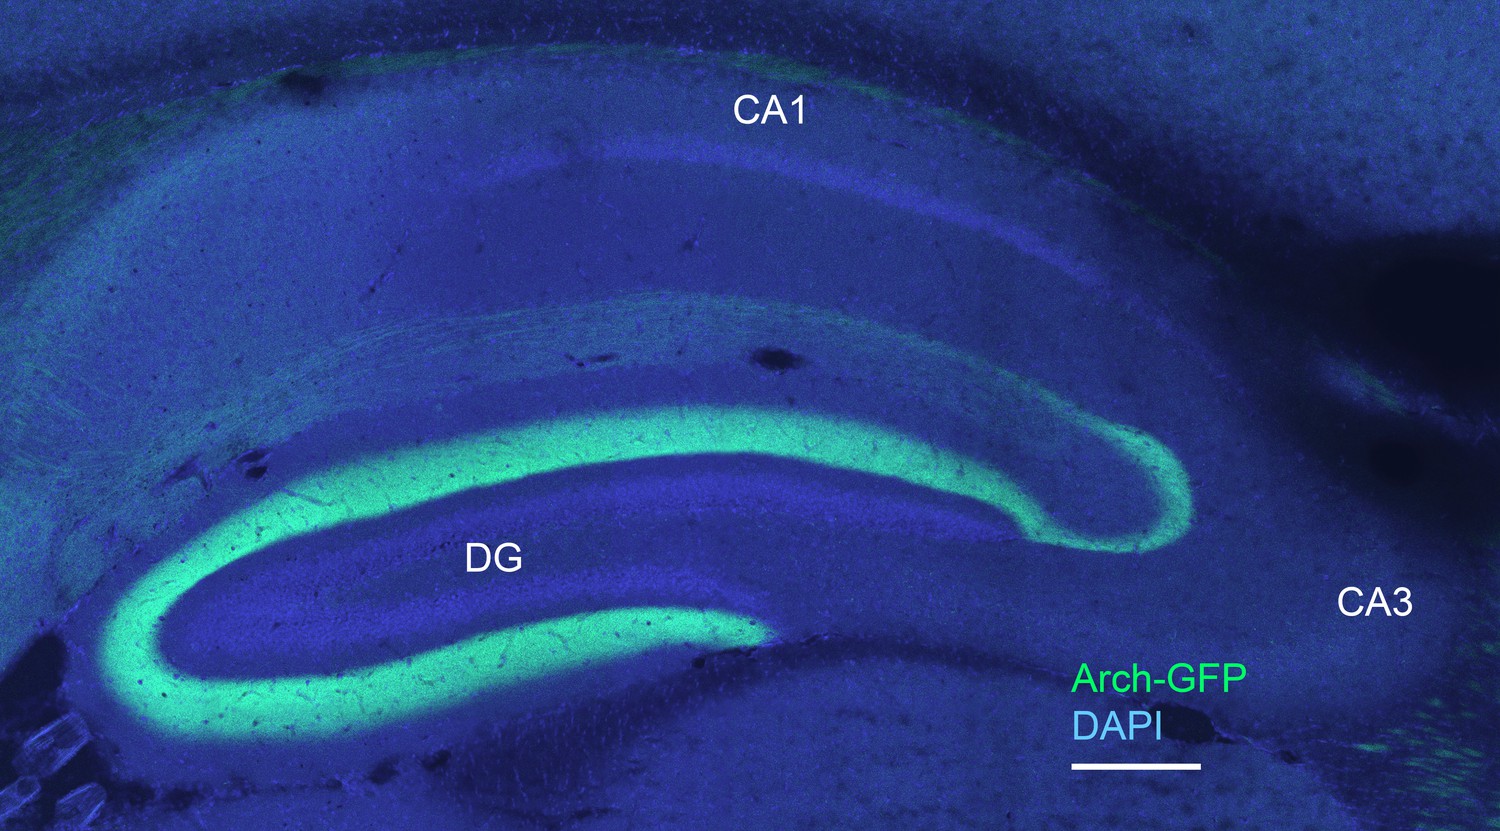
Arch-expressing cells project to the dentate gyrus (DG) and CA3 regions of the hippocampus.
The image is a 20x scan of the hippocampal region in a sagittal section, where the fibers of the transgene-expressing cells are labeled in green (ArchT-GFP) and cell nuclei in blue (DAPI stain). Dense terminals can be seen in both the DG and CA3, as expected for labeling of entorhinal stellate cells. Considerably lighter label is visible in the CA1 region, consistent with very sparse Arch expression in layer III and in layer II pyramidal cells. Scale bar = 200 microns.
Figure 1—figure supplement 3

Nissl-stained saggital brain sections showing recording locations for seven EC-tTA x tetO-ArchT-GFP mice used in the study and three additional wild-type animals used in the extended layer II dataset.
Triangle shows the dorsal extent of MEC and dots show the final recording locations. Scale bars are 500 microns.
Figure 2 with 1 supplement
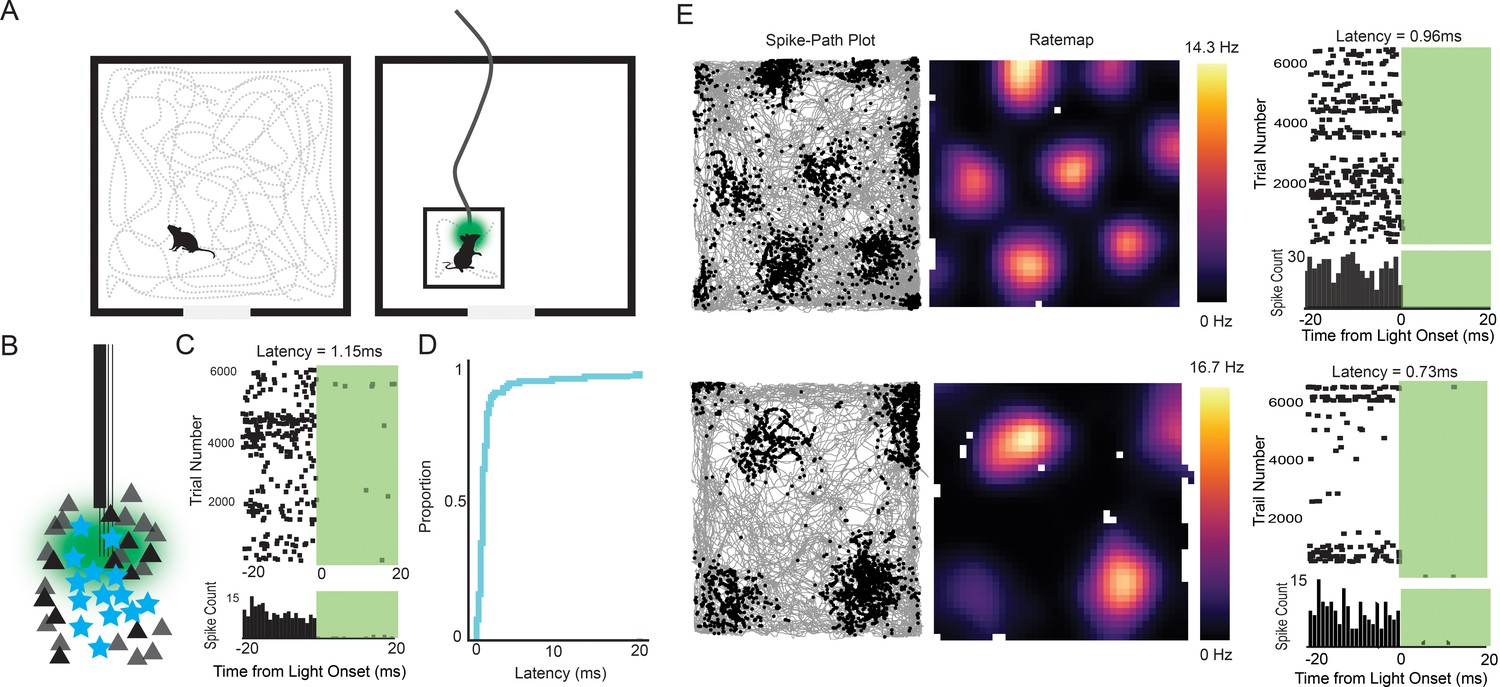
Experimental design and examples of tagged grid cells.
(A) Mice were run in a 0.8 or 1 m box for 30–40 min while cells in the MEC were recorded. The mice were then connected to a patch cable and placed in a towel-lined holding box for an optogenetic tagging session. The tagging session consisted of 10–20 ms light pulses delivered thousands of times at 1–4 Hz. (B) Cartoon of the experimental logic. ArchT-expressing stellate cells (cyan stars) should be immediately inactivated by light delivery while neighboring pyramidal cells (black triangles) should not, allowing functional identification of stellate cells. (C) Raster plot (top) and histogram (bottom; bin size = 1 ms) for an example tagged cell. The cell was silenced with an estimated latency of 1.15 ms. (D) Cumulative histogram of latencies for all inhibited cells. Median latency was 0.85 ms. (E) Two further example tagged grid cells (spike-path plots on left and color-coded rate maps with colorbar in the middle) and their corresponding raster plots and histograms from the tagging session (right). Both cells had sub-millisecond latencies.
Figure 2—figure supplement 1
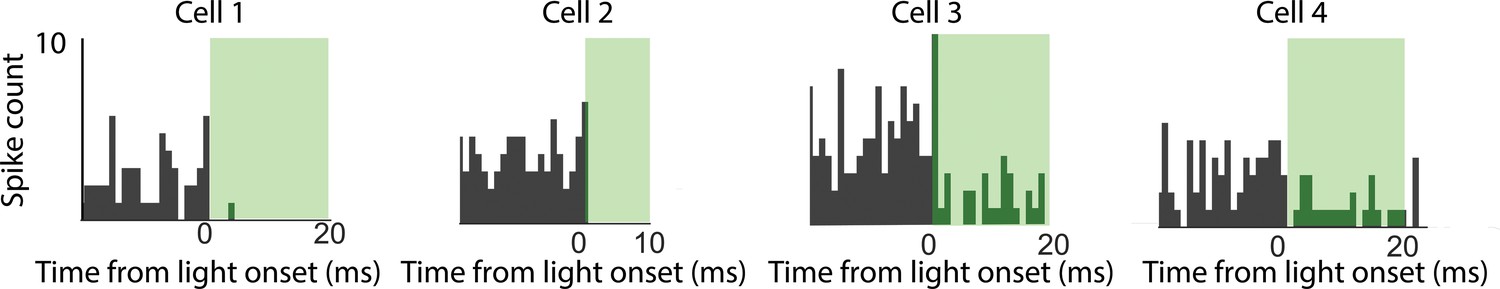
Four additional tagged cells.
The peri-event time histograms are shown for four cells from the highest 30% of p-values of the tagged dataset (higher p-values mean less confidently tagged). Cell 4 had the highest p-value of all the tagged cells (i.e. it was the least confidently tagged). All four cells show clear light-induced silencing at short latency.
Figure 3 with 1 supplement

Properties of tagged cells.
(A) Percentage of tagged (cyan, left) and untagged (black, right) cells in the unclassified category (Unx) and each of the 4 functional cell classes: grid (G), head direction (HD), speed (S) and border cells (B). Light regions of the bar plots show the percentage of cells in each class that belonged to more than one class (‘Mix’). Note that because a cell could belong to more than one class, the total percentages exceed 100. (B) Violin plots of grid, head direction, speed and border scores where the shaded region gives kernel density estimate for tagged (light cyan) and untagged cells (grey). Individual data points overlaid on top of the violins. Asterisks indicate a significant difference between the two populations (**p<0.01, all tests Mann-Whitney U-tests).
Figure 3—figure supplement 1
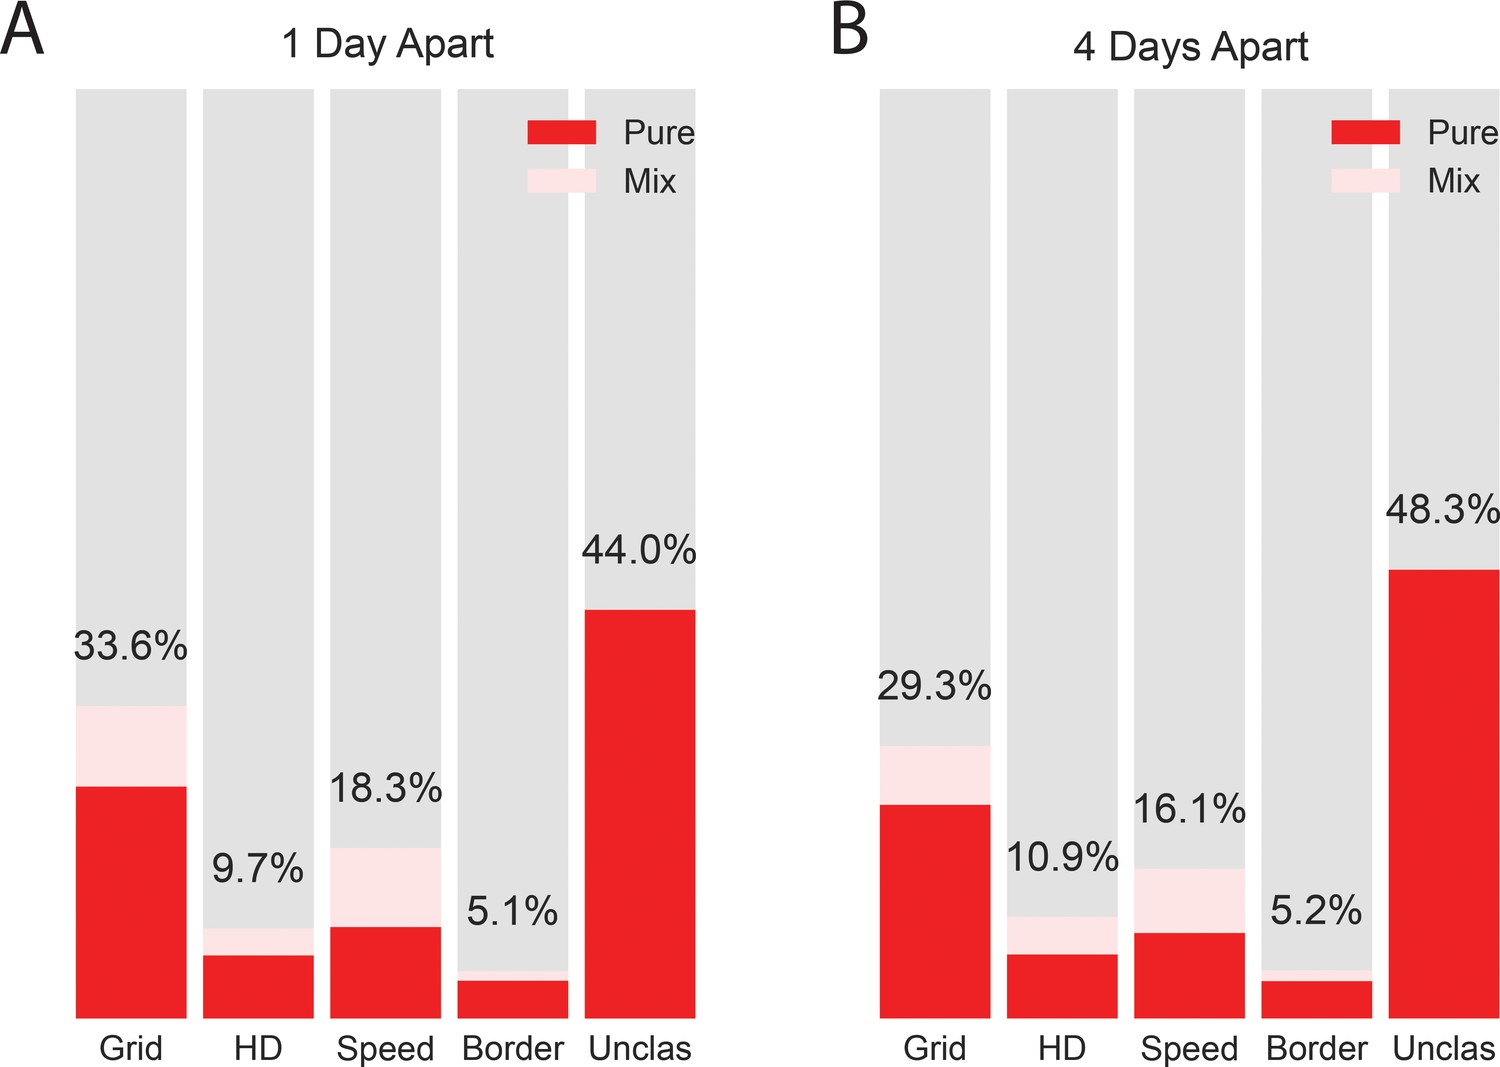
Distribution of functional cell types for the whole dataset (A) and a downsampled dataset of all cells with sessions separated by 4 or more days (B), when the electrodes had been turned 100 microns.
Similar percentages were obtained when the data were downsampled. Methods for classifying the cells into functional categories are the same as in the main figures.
Figure 4 with 3 supplements
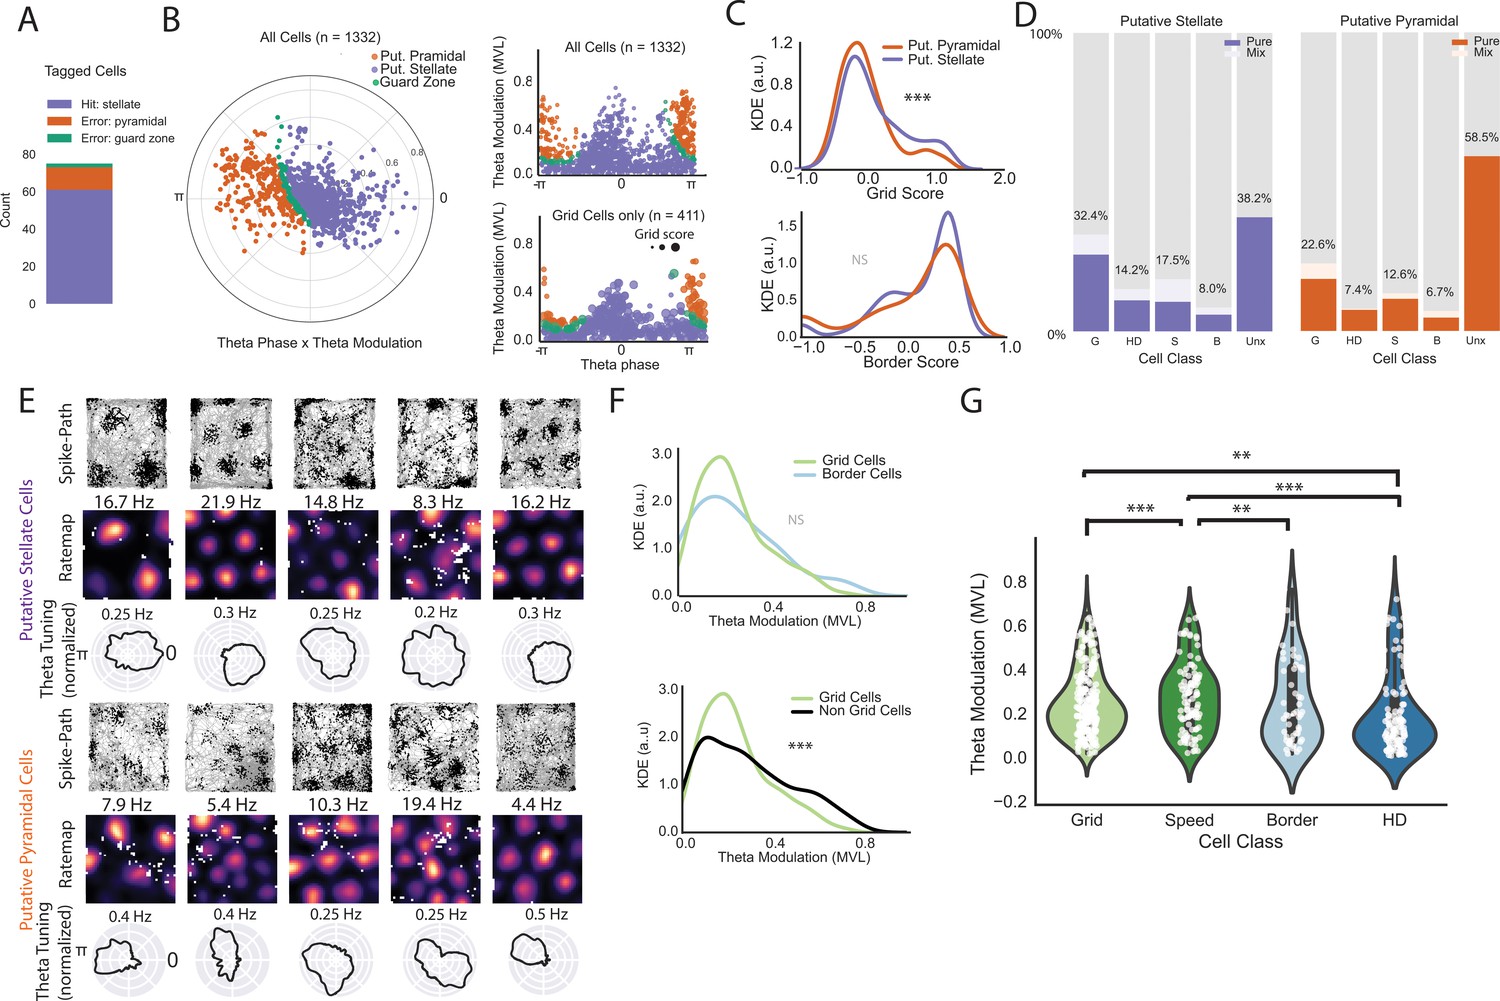
Classifier performance and comparison of theta phase locking for different functional classes on an extended layer II dataset.
(A) Classifier performance on the population of tagged cells. Numbers of cells correctly identified as stellate cells (purple), incorrectly identified as pyramidal cells (orange), and in the guard zone (green) are shown in the stacked bar chart. (B) Preferred theta phase (angle) and strength of theta phase modulation (mean vector length, MVL, radius, peak of the oscillation is 0 and trough is pi) for all cells in in the extended layer II dataset. The data for all cells are presented in circular form on the left and unwrapped on the top right. Cells are color-coded based on their classification into putative stellate and pyramidal categories (classification based on phase locking to local theta oscillation; see text). Cells showed some clustering around the peak (0) and trough (pi). Bottom right shows the distribution of grid cells only where the dot size is proportional to the grid score. (C) Kernel density estimates (KDE) of grid scores (top) and border scores (bottom) for putative stellate cells and putative pyramidal cells. (D) Breakdown of the two groups by functional category. (E) Example grid cells (path plots and color-coded rate maps) with theta phase histograms (normalized such that the area under the curve equals 1 for comparison of depth of modulation between cells) for the two categories of cells. Peak rates for rate maps are indicated above the maps. Clear grid cells exist in both populations and exhibit a variety of theta phase preferences. (F) KDEs showing that grid cells exhibit no significant difference in theta modulation from border cells (top) but less theta modulation than non-grid cells as a group. (G) Violin plots with individual data points in white overlaid for theta modulation by cell class (shaded regions give the kernel density estimates and the white dots are individual data points). We only included pure cells (cells that classified criteria for only one cell type) in this analysis to preserve independence between groups. (**=P < 0.01, ***=P < 0.001, two-sided Mann-Whitney U-test).
Figure 4—figure supplement 1
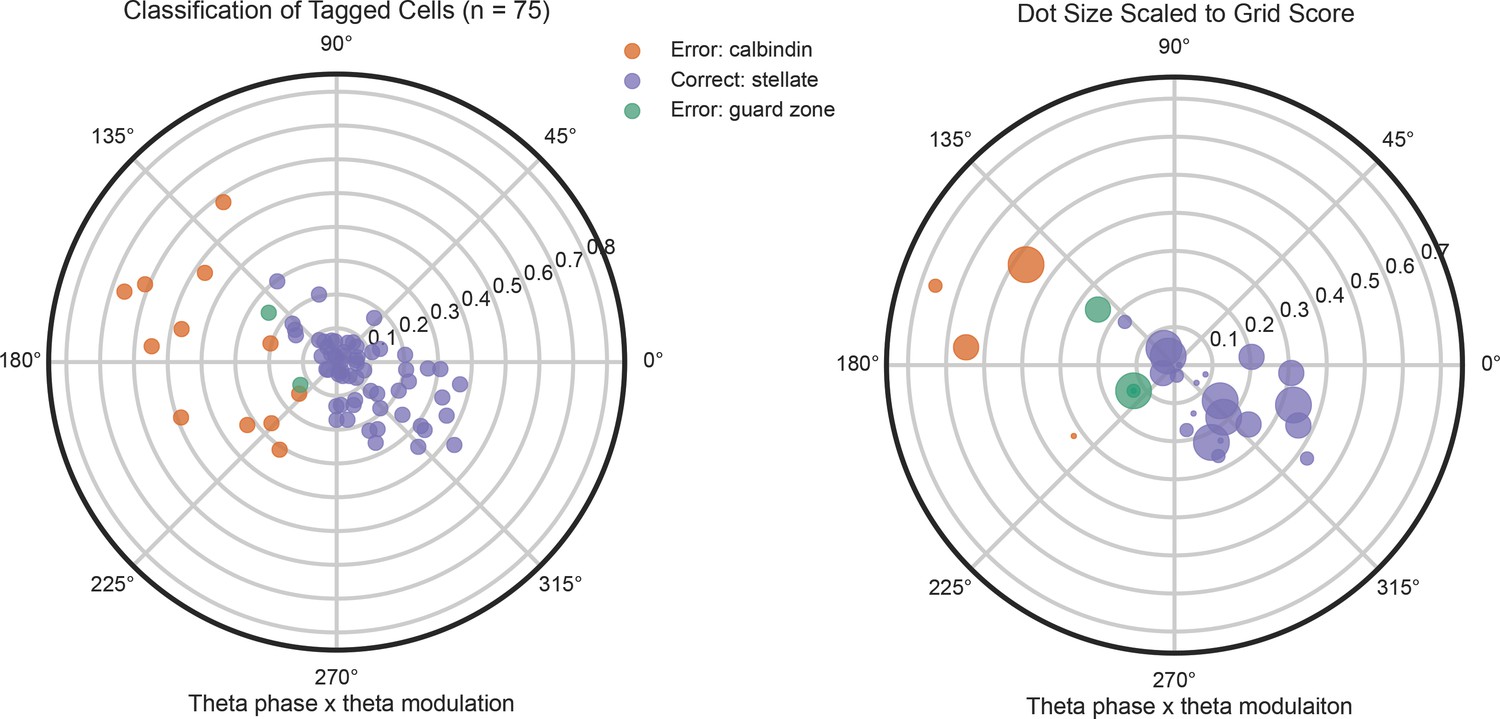
Performance of the Tang et al
classifier on the population of ArchT-tagged cells (same method and presentation as Figure 4). The classifier correctly assigned the cells to the stellate category 73% of the time. Most of the misclassified cells were putative pyramidal cells, not in the guard zone. Tagged cells with the highest grid scores (right) showed a similar distribution as the overall tagged population.
Figure 4—figure supplement 2
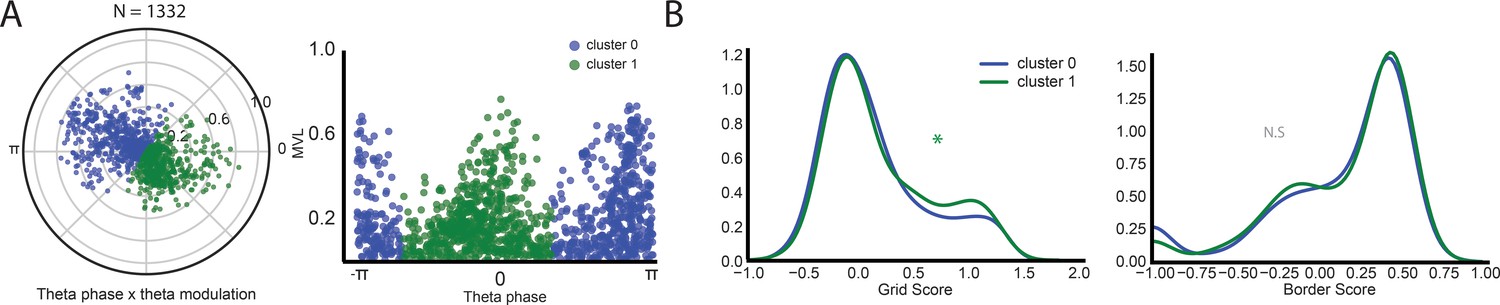
A second approach to clustering the data gives similar results.
Data show the result of clustering the cells based on their preferred theta phase and depth of theta modulation using an agglomerative clustering approach with the number of clusters set to 2. (A) Cells color-coded by cluster identity are shown in a circular view (left) and unwrapped (right). (B) Grid score and border score for the two clusters. Grid score was significantly higher in the peak-preferring population (cluster 1, *= p < 0.05, two-sided Mann-Whitney U-test).
Figure 4—figure supplement 3
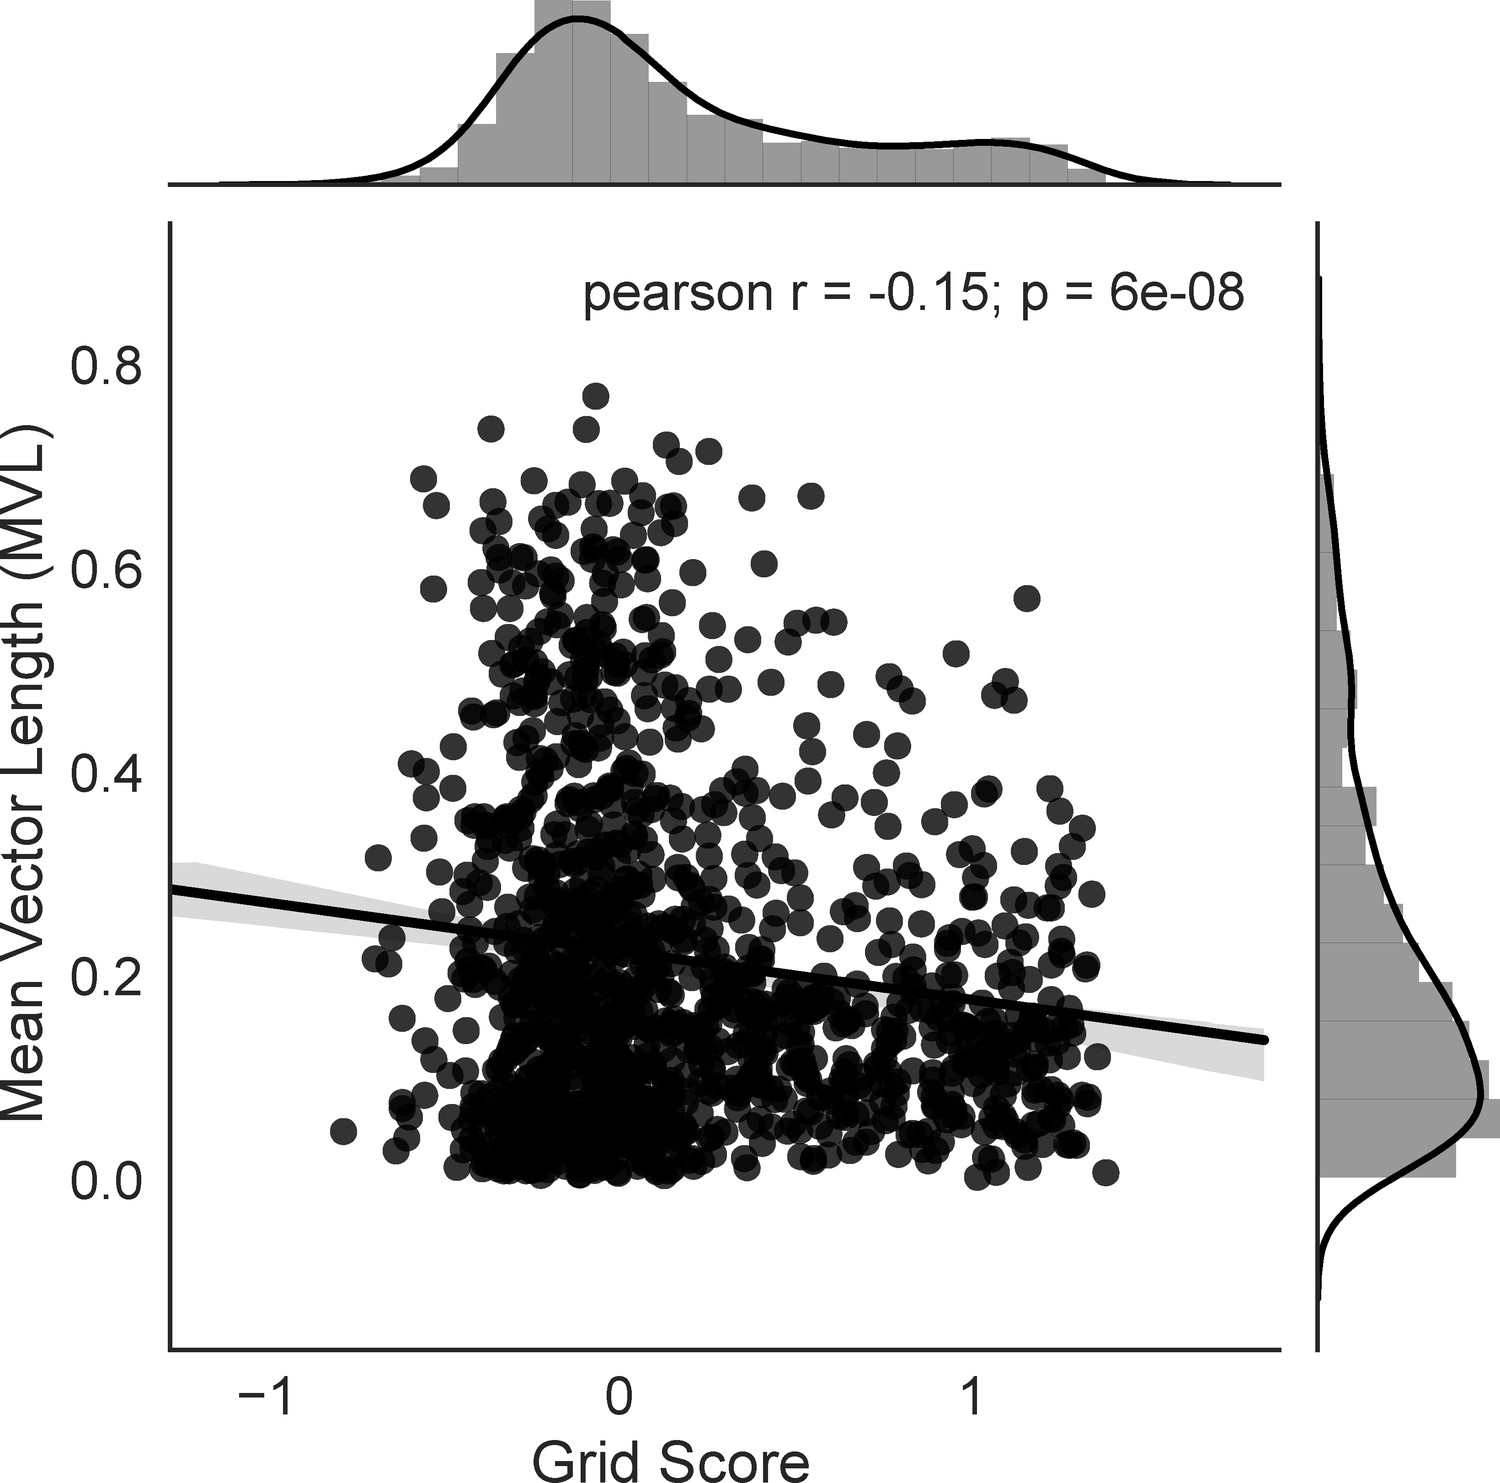
Grid score is negatively correlated with depth of theta modulation.
Grid score and theta modulation for cells in the extended layer II data set are shown in the scatter plot (N = 1332). Histograms and KDE plots for the two variables are shown along the axes, regression line and 95% confidence interval shown on plot. Grid score and depth of theta modulation are weakly negatively correlated (Pearson’s r = −0.15, p<0.001).
Additional files
-
Transparent reporting form
- https://doi.org/10.7554/eLife.36664.014
Download links
A two-part list of links to download the article, or parts of the article, in various formats.
Downloads (link to download the article as PDF)
Open citations (links to open the citations from this article in various online reference manager services)
Cite this article (links to download the citations from this article in formats compatible with various reference manager tools)
Functional properties of stellate cells in medial entorhinal cortex layer II
eLife 7:e36664.
https://doi.org/10.7554/eLife.36664


