TFAP2 transcription factors are regulators of lipid droplet biogenesis
- University of Geneva, Switzerland
Figures
Figure 1 with 1 supplement
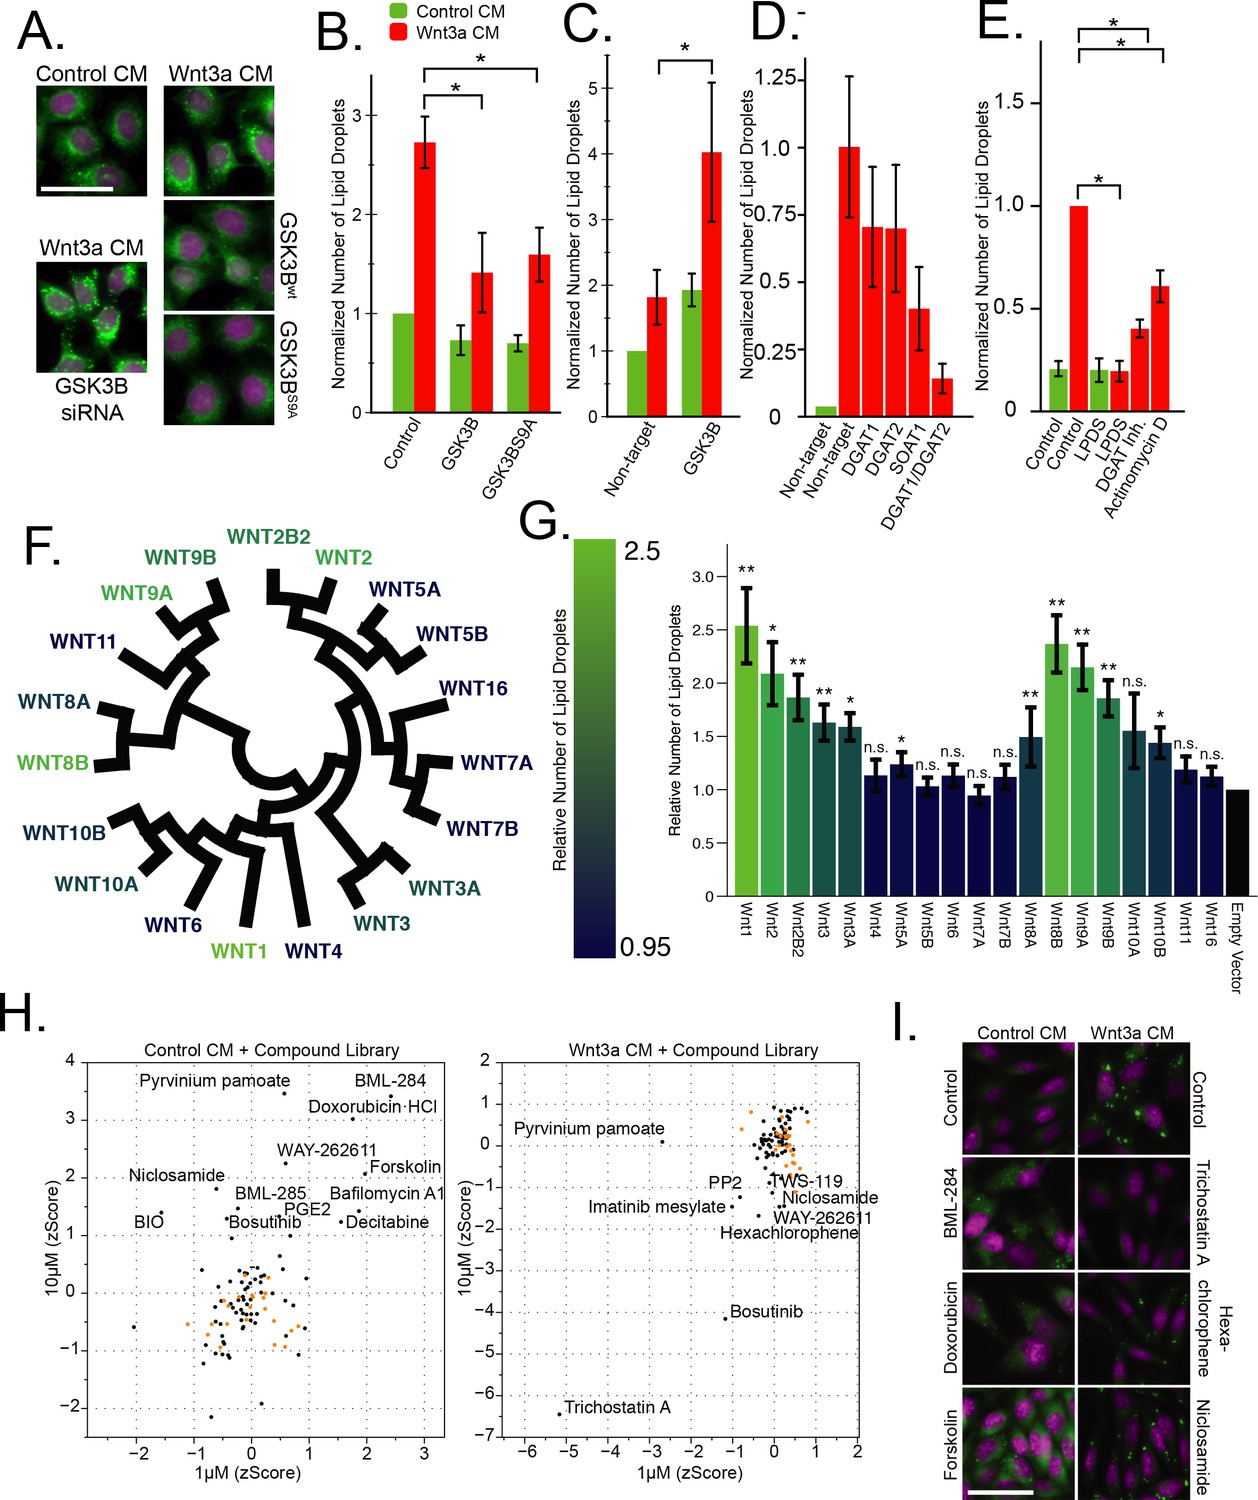
The Wnt pathway and the regulation of lipid droplets.
(A–B) HeLa-MZ cells were transfected with plasmids encoding wild-type or a S9A mutant of GSK3B 24 hr before the addition of Wnt-3a- or control-conditioned media (CM) for a further 24 hr. Cells were fixed, labeled with BODIPY (lipid droplets, green) and Hoechst 33342 (nuclei, magenta), and imaged by light microscopy. In (B) the number of lipid droplets was quantified by automated microscopy (bar graph), and the data are presented as the mean number of lipid droplets per cell of five independent experiments ± SEM, normalized to the control condition. (C–D) As in (A), except that HeLa-MZ cells (C) or L Cells (D) were transfected with siRNAs against the indicated targets for 48 hr, before the addition of Wnt3a. Efficient silencing was confirmed by qPCR (Figure 1—figure supplement 1B) and the data are presented as the mean number of lipid droplets per cell of 3 independent experiments ± SEM, normalized to the control condition. (E) L cells were incubated with the indicated compounds together with Wnt3a for 24 hr, processed and analyzed as in (A) and the data are presented as the mean number of lipid droplets per cell of five independent experiments ± SEM, normalized to the control condition. (F) Evolutionary relationship of the 19 Wnt ligands. Color indicates ability to induce lipid droplets as detailed in (G). (G) L Cells were transfected with plasmids containing each of Wnt ligand for 48 hr, imaged and analyzed as in (A). Data are normalized to the empty vector control and were tested for significance and are presented as the mean number of lipid droplets per cell of two independent replicates of the screen ± SEM, normalized to the control condition. The data are color-coded from a high (light) to a low (dark) number of lipid droplets induced by each Wnt ligand. (H–I) High-content image-based screen of a library of compounds that affect the Wnt pathway in HeLa-MZ cells. Cells were incubated for 24 hr with Wnt-3a- or control-conditioned media for 24 hr in the presence of the compounds at 1 µM and 10 µM, fixed, labeled with BODIPY (lipid droplets) and Hoechst 33342 (nuclei) and imaged by automated microscopy. The number of droplets per cell was counted and the zscores established, in order to quantify the ability of each compounds to induce lipid droplets in untreated cells (H, left panel), or to inhibit lipid droplet formation in Wnt3a-treated cells (H, right panel). Panel I illustrates the effects of compounds that induce droplet formation (left column) or that do (Trichostatin A) or do not (niclosamide, hexachlorophene) inhibit droplet formation (right column) in Wnt3a-treated cells. Nuclei are in magenta, and lipid droplets in green. Green bars, control-conditioned media (control CM); Red bars, Wnt3a-conditioned media (Wnt3a CM). In this figure, pValues are indicate as: *,<0.05; **, <0.005, and n.s., not significant.
-
Figure 1—source data 1
Effect of Wnt pathway related compounds on lipid droplet induction.
- https://doi.org/10.7554/eLife.36330.004
Figure 1—figure supplement 1
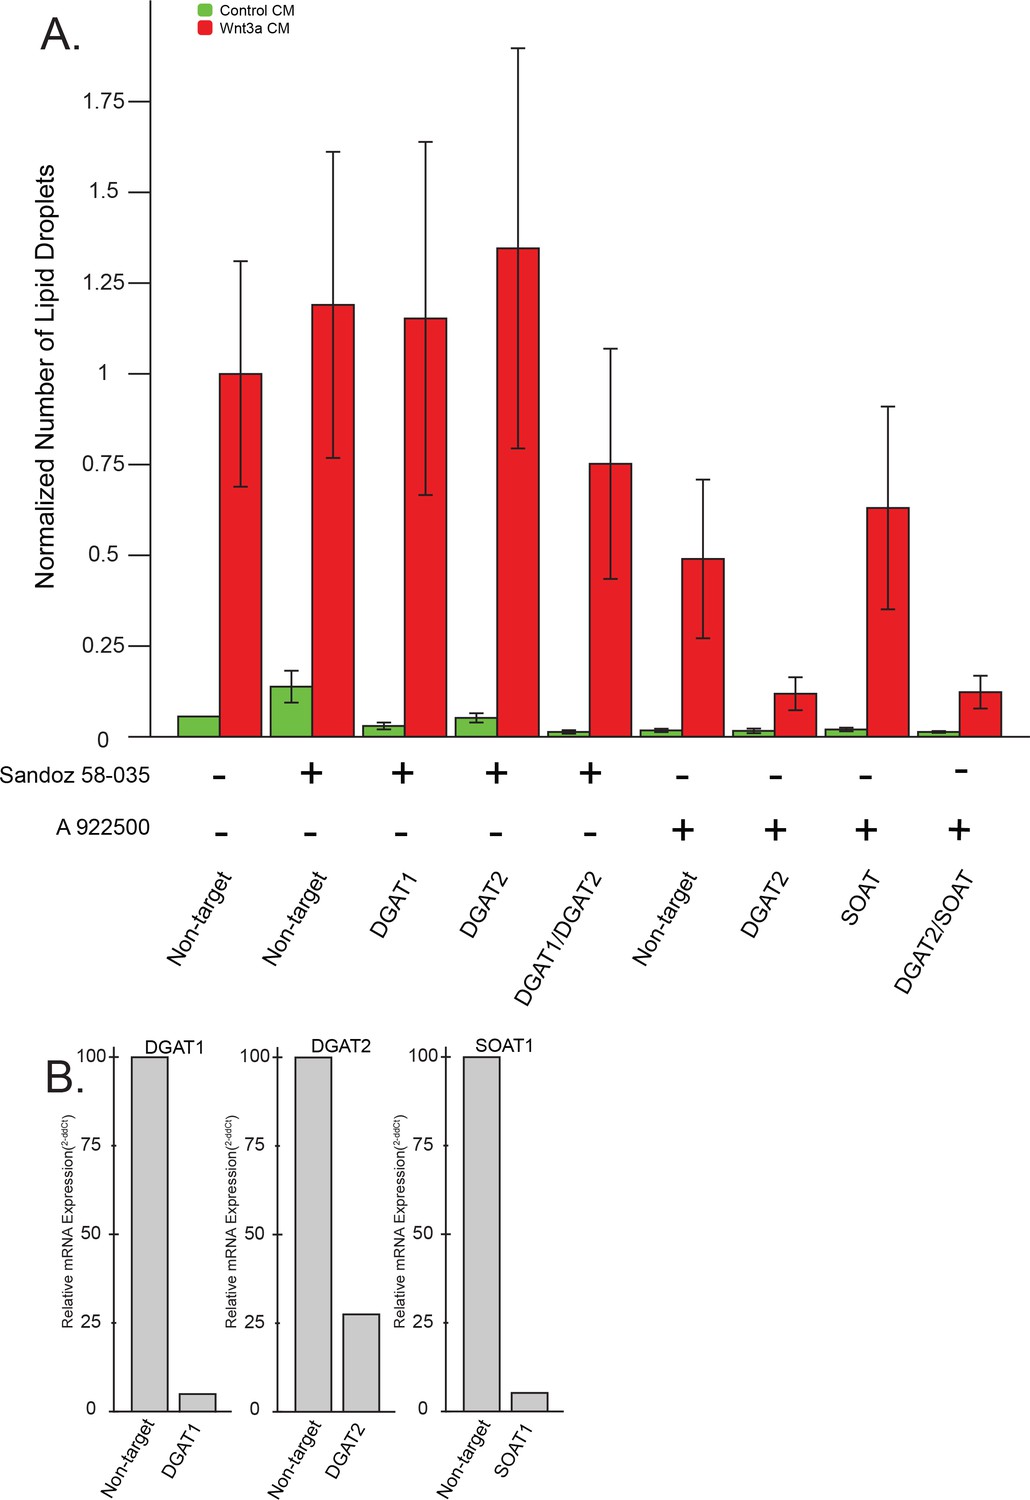
Lipid droplet accumulation in response to Wnt3a: combinatorial treatments against lipid droplet enzymes by RNAi and chemical inhibitors.
(A) L cells were treated with the indicated siRNAs for 48 hr before addition of the indicated compounds together with control, or Wnt3a, conditioned media and incubation for an additional 24 hr. Cells were then fixed, stained and lipid droplet number quantified as in Figure 1A. Data are presented as the normalized mean number of lipid droplets per cell of three independent experiments ± SEM. (B) L Cells were treated as in Figure 1A with the indicated siRNAs and the amounts of the corresponding mRNA were determined by qPCR.
Figure 2 with 4 supplements
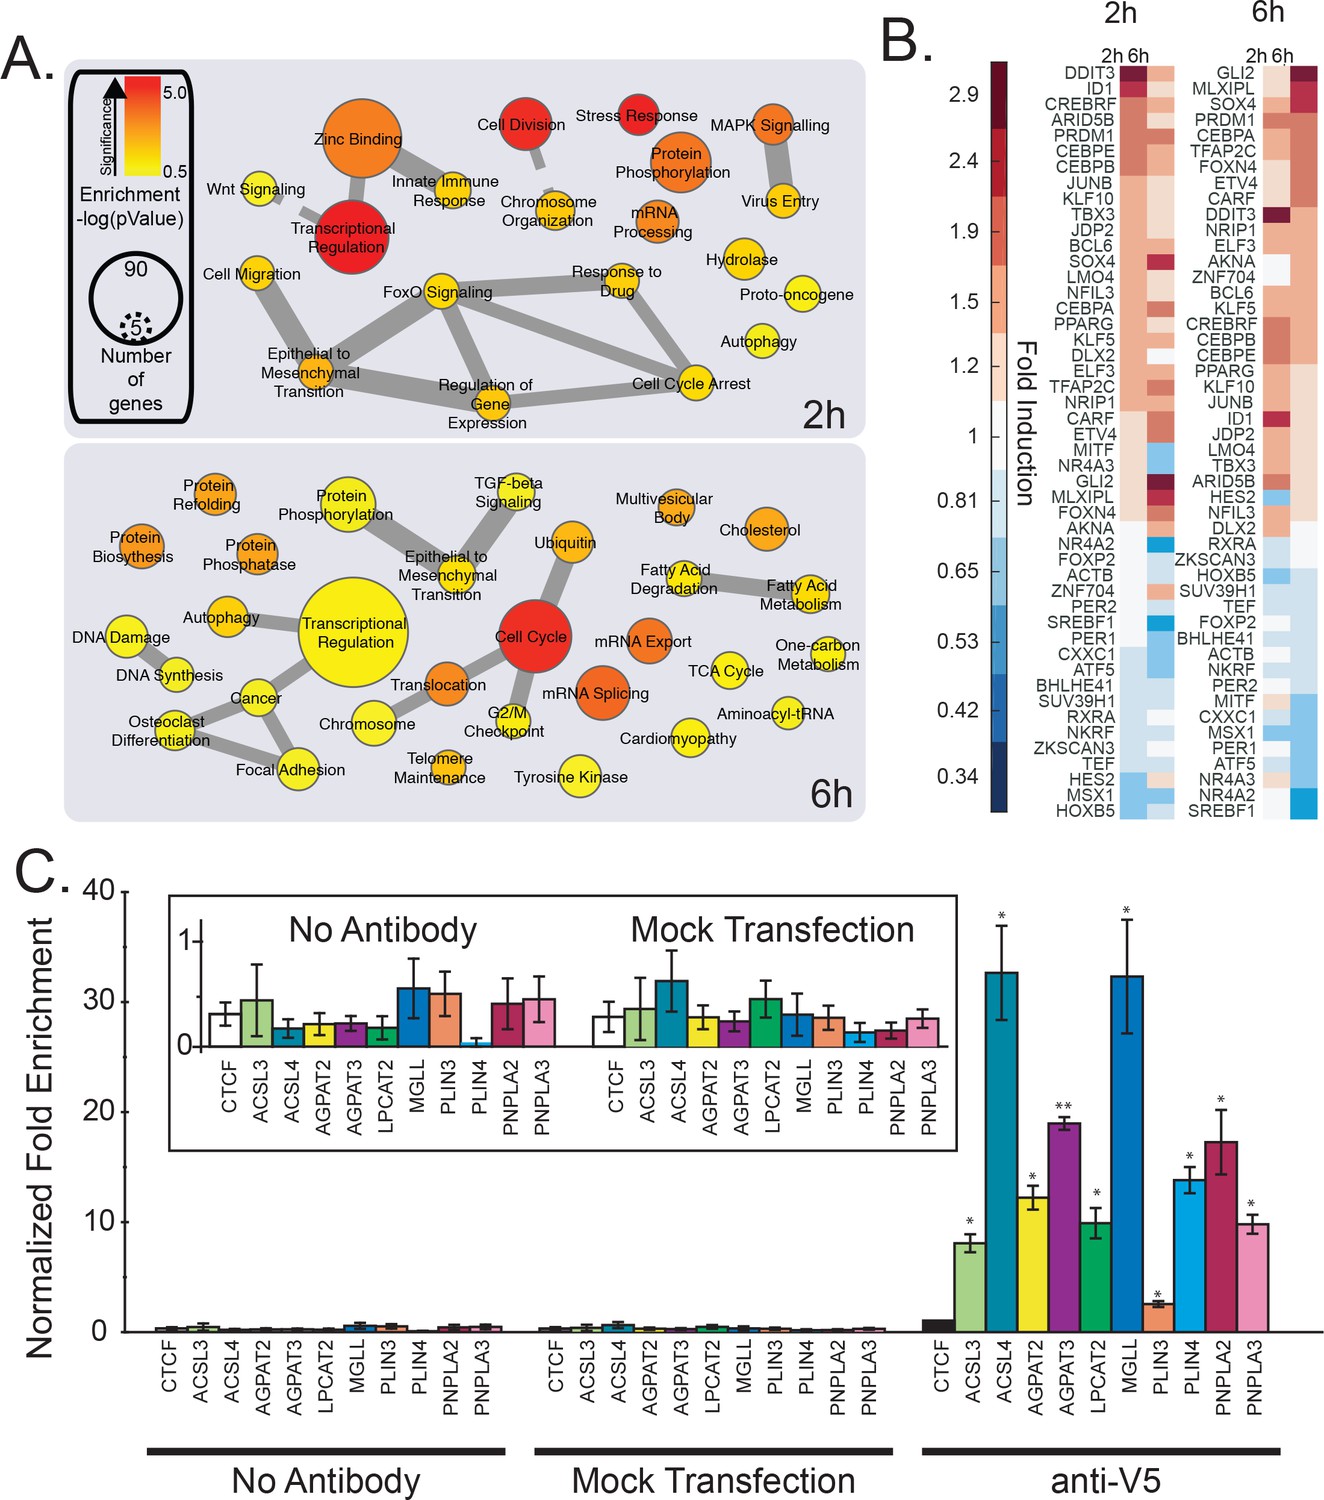
mRNA profiling and analysis of gene expression of cells treated with Wnt3a.
(A-B) HeLa-MZ cells were treated with control- or Wnt3a-conditioned media for 2 hr or 6 hr before RNA isolation and RNAseq analysis. Panel (A) shows the pathway enrichment of perturbed mRNAs. Node size indicates number of genes in each ontology and colour the statistical strength of the enrichment. Edge thickness indicates the strength of overlap of related ontologies. From (A), the fold change of transcription factors amounts in response to Wnt3a is shown in panel B. C. The ability of TFAP2 family member TFAP2A to bind to regulatory regions of lipid droplet at lipid metabolic enzyme genes was tested by ChIP-qPCR (see Materials and methods). Data are presented as the mean DNA amounts normalized to the negative control (CTCF) of three independent experiments ± SEM. (*) indicates a p-value<0.05; (**) indicates a p-value<0.005. Inset; re-scaled view of signal of the control conditions.
-
Figure 2—source data 1
Effect of silencing transcription factors on cellular cholesterol amounts.
- https://doi.org/10.7554/eLife.36330.010
-
Figure 2—source data 2
Comparative enrichment of transcriptional targets in cells treated with Wnt3a or fatty acid perturbation.
- https://doi.org/10.7554/eLife.36330.011
-
Figure 2—source data 3
TFAP2 family member consensus binding sites in lipid droplet genes.
- https://doi.org/10.7554/eLife.36330.012
Figure 2—figure supplement 1
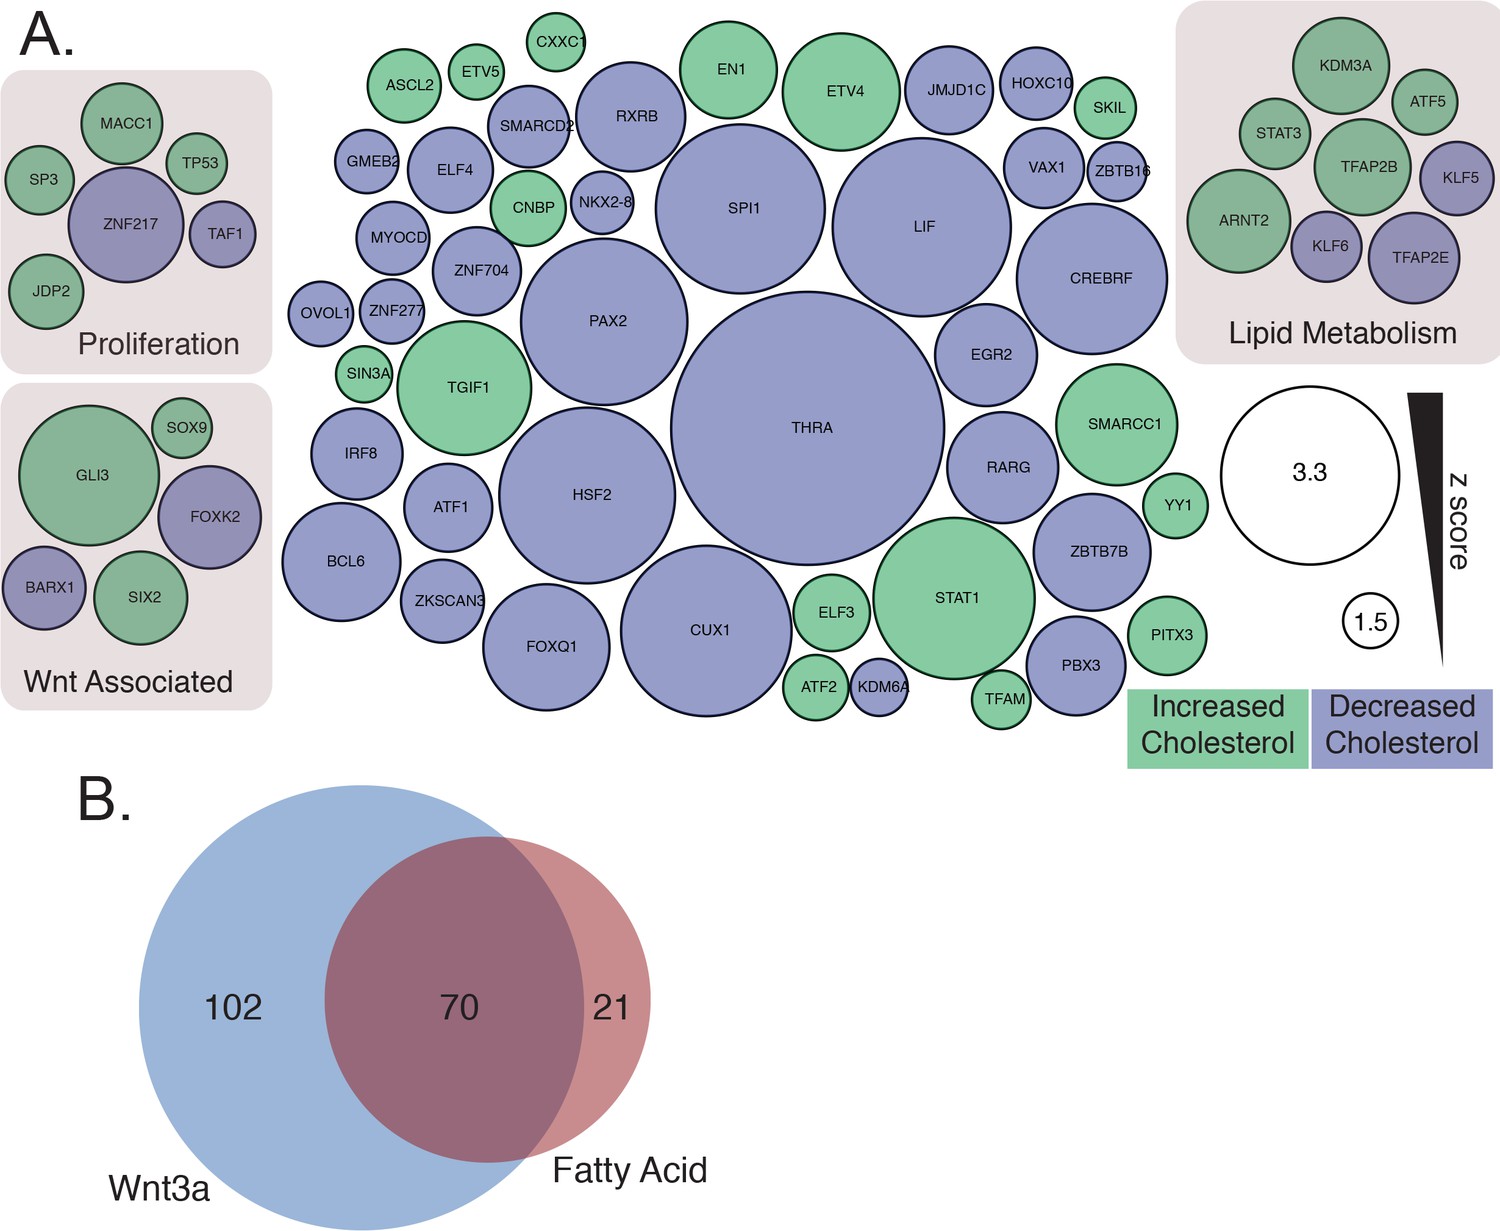
Datamining for putative lipid droplet transcriptional regulators.
(A) Transcription factors that influence cellular cholesterol amounts from a genome-wide screen of cholesterol regulatory genes (Scott et al., 2015). Node size is proportional to the absolute z-score difference from the control, and the color indicates increased (green) or decreased (blue) cellular cholesterol levels. (B) Existing mRNA profiling experiments of cells treated with Wnt3a (blue), or perturbations likely to induce lipid droplet accumulation (see Materials and methods) (pink), were analyzed for enrichment of genes linked to known transcriptions factors to identify candidate transcription factors linking Wnt3a to lipid droplet biogenesis.
Figure 2—figure supplement 2
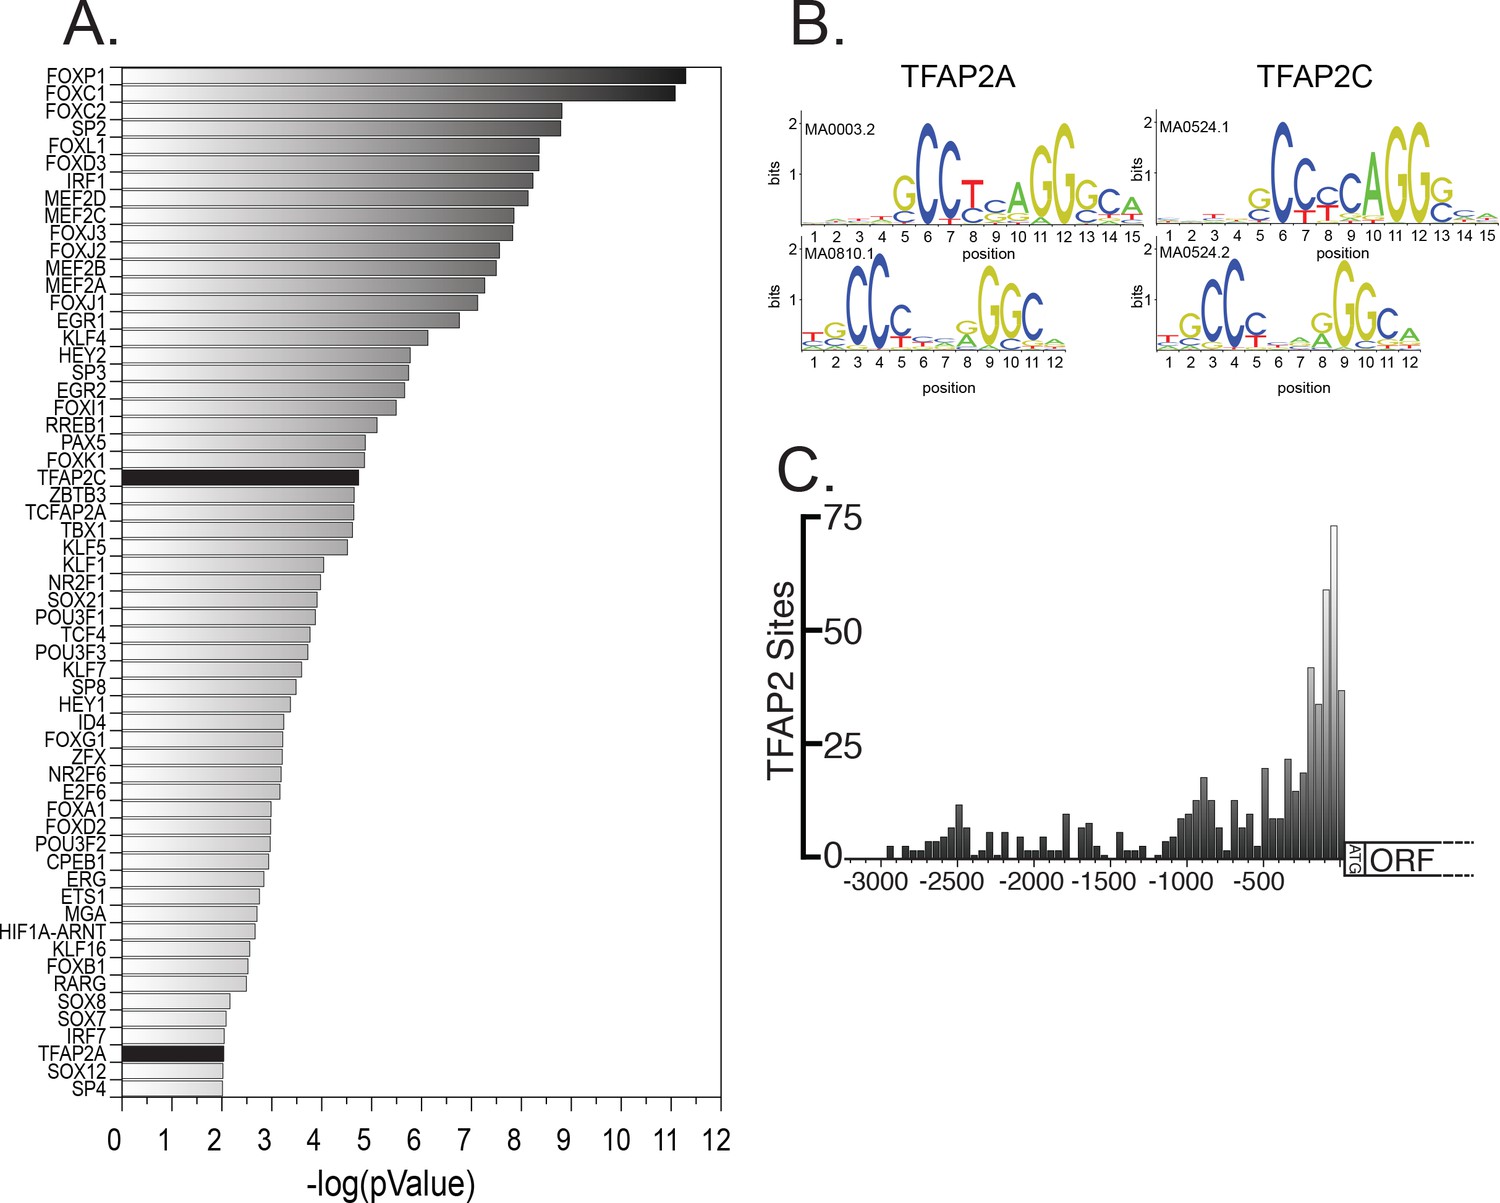
The consensus binding sites of TFAP2 family members are overrepresented in lipid droplet genes.
(A) Enrichment of known transcription factor consensus sequences in lipid droplet genes. (B) TFAP2A and TFAP2C consensus binding site motifs. (C) Distribution of TFAP2 consensus sites in the promoter region of genes annotated to be lipid droplet related.
Figure 2—figure supplement 3
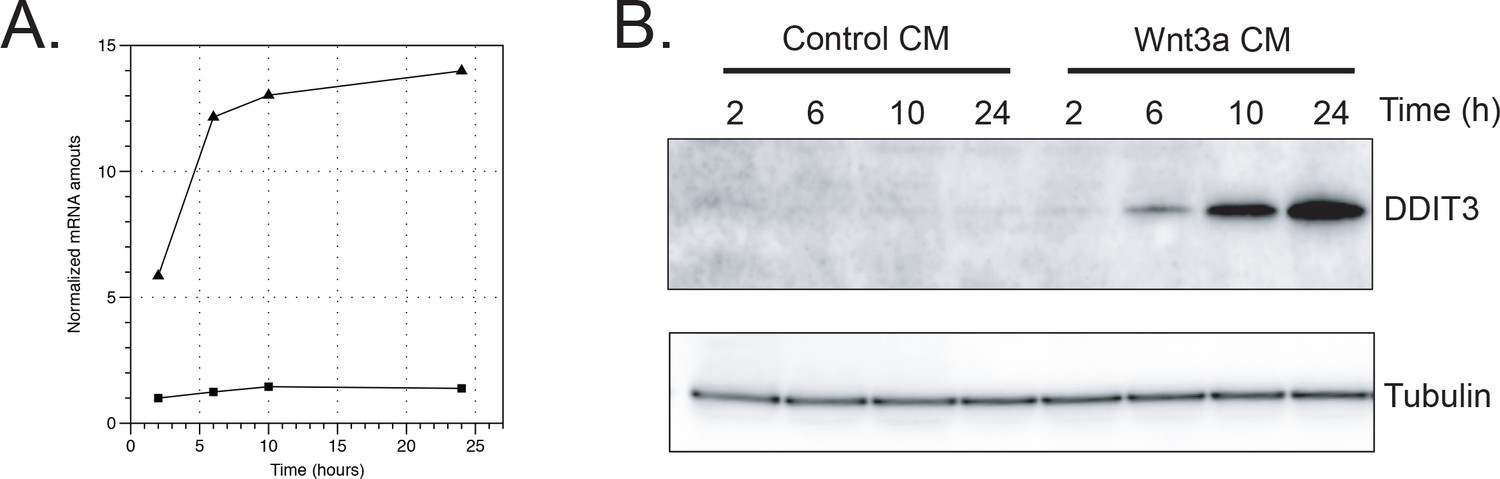
Effect of Wnt3a on DDIT3 protein and mRNA amounts in L Cells.
Cells were treated with control- or Wnt3a-conditioned media for the indicated times before lysis. A. mRNA was extracted from L Cells cells and amounts were determined by qPCR. B. Cell extracts were analyzed by SDS-PAGE and western blot using antibodies against the indicated proteins.
Figure 2—figure supplement 4

SREBF activity does not significantly influence lipid droplet number.
(A) L Cells were transfected or not with constitutively active truncation mutants of SREBF1a, SREBF1c, and SREBF2 for 24 hr before addition of control- or Wnt3a-conditioned media for an additional 24 hr. Cells were fixed, labeled and imaged by automated microscopy as in Figure 1A. Data are box-and-whisker plots of a representative experiment. (B) L Cells were treated with the indicated chemical inhibitors simultaneously with the conditioned media, and processed as (A). PF-429242; inhibitor of the SREBF site one protease (S1P). Torin-2; mTOR inhibitor. (C) L Cells were transfected as in A before mRNA extraction and quantitation of HMGCR and LDLR mRNAs by qPCR.
Figure 3 with 2 supplements
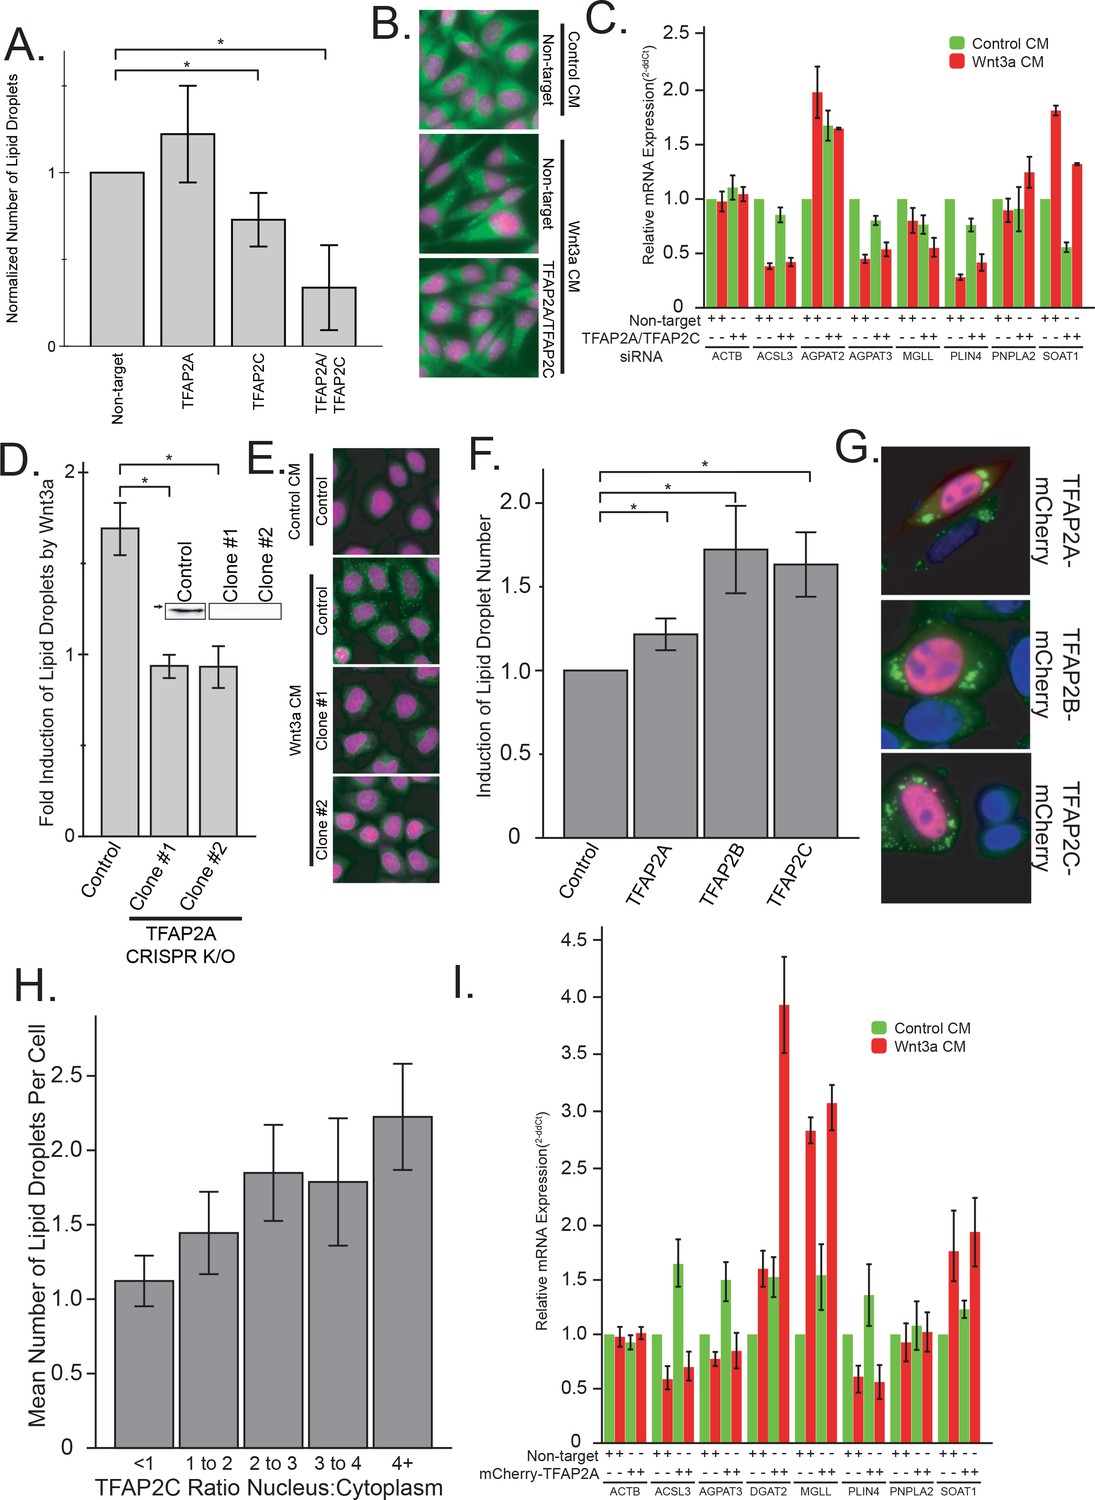
The TFAP2 family of transcription factors are both necessary and sufficient to mediated lipid droplet accumulation.
(A–B) L Cells were treated with siRNAs against the indicated targets for 48 hr before the addition of Wnt3a-conditioned medium for an additional 24 hr. Cells were then fixed, labeled, imaged and analyzed by automated microscopy as in Figure 1A. In (A), data are presented as the normalized mean number of lipid droplets per cell of 5 independent experiments ± SEM. Cells treated with non-target siRNAs or with siRNAs to both TFAP2A and TFAB2C are shown in panel B (nuclei in magenta; lipid droplets in green). (C) L cells were treated with siRNAs against both TFAP2A and TFAP2C or with non-targeting controls as in (A), before the addition of Wnt3a- or control-conditioned media for an additional 24 hr. RNA was isolated and analyzed by qPCR using primers to the indicated genes, and that data are expressed relative to the non-target control and are presented as the mean mRNA amounts of two to five independent experiments ± SEM. (D–E) HeLa-MZ cells were transfected with targeted CRISPR/Cas9 plasmids against TFAP2A. The corresponding knock-out clones as well as control cells were treated with Wnt3a-conditioned media for 24 hr. In D), the number of lipid droplets was quantified as in Figure 1A and is expressed as fold induction relative to the control cells in five independent experiments ± SEM. Inset: TFAP2A protein levels of each clone determined by Western blot. Arrow indicate position of 50 kDa marker. Representative images are shown in E (nuclei in magenta; lipid droplets in green). (F–H) L Cells were transfected or not with mCherry-tagged TFAP2 family members for 48 hr before fixation, labeling and imaging as in Figure 1A. The mean number of lipid droplets per cell expressing each mCherry-tagged TFAP2 protein was counted, and is expressed, as in panel (D), as fold induction relative to the control cells in six independent experiments ± SEM. Panel G shows cells expressing each mCherry-tagged TFAP2 protein (Blue, nucleus; Green, lipid droplets; Red, TFAP2-mCherry fusion proteins), and panel H shows the number of lipid droplets per cell in cells overexpression TFAP2C-mCherry, binned by their nuclear:cytoplasmic distribution. Data are the mean lipid droplets per cell ±SEM for 450 cells. (I) L Cells were treated as in (F) before extraction and determination of the indicated mRNAs by qPCR. Data are presented as the mean mRNA amounts of two to five independent experiments ± SEM. In this figure, (*) indicates a p-value<0.05.
Figure 3—figure supplement 1

Characterization of lipid droplets by PLIN1a-GFP, cholesterol esters and triglycerides.
(A) L Cells were treated with the indicated siRNAs for 48 hr before an additional 24 hr with control-, or Wnt3a-conditioned media before cells were collected and assayed for protein and cholesterol ester content (see Materials and methods). Data are the mean normalized increase in triglycerides of two replicates ± SEM. (B) CRISPR clones were treated for 24 hr with control- or Wnt3a-conditioned media before lysis and determination of protein and triglyceride content (see Materials and methods). Data are the mean normalized increase in triglycerides of two replicates ± SEM. (C–D) CRISPR cells were transfected PLIN1a-GFP and treated as in (B) before fixation, staining and determination of lipid droplet number by automated microscopy (representative images in C). Data are presented in (D) and are the mean relative induction of lipid droplets with at least 3000 cells measured per condition and are representative of two independent experiments and the SEM for each condition. (E) HeLa-MZ were transfected with the indicated plasmids (control; LAMP1-mCherry) for 36 hr before lipid and protein determination as in (A–B) Data are the mean of two replicates ± SEM. (F–G) HeLa-MZ were co-transfected with the indicated plasmids (control; LAMP1-mCherry) and PLIN1a-GFP for 36 hr before quantitation as in (C–D) Data are presented in (G) and are the mean relative induction of lipid droplets with at least 500 cells measured per condition and are representative of two independent experiments and the SEM for each condition.
Figure 3—figure supplement 2
Characterization of knock-down efficiencies and relative over-expression levels by qPCR.
(A–D) mRNA was extracted from HeLa-MZ (B,D) or L Cells (A,C) transfected with either siRNAs (72 hr; A,C) or the indicated plasmids (48 hr (B), (D) and amounts determined by qPCR. Data are the normalized means of two or three replicates, presented ± SEM. In this figure, (*) indicates a p-value<0.05.
Figure 4 with 1 supplement
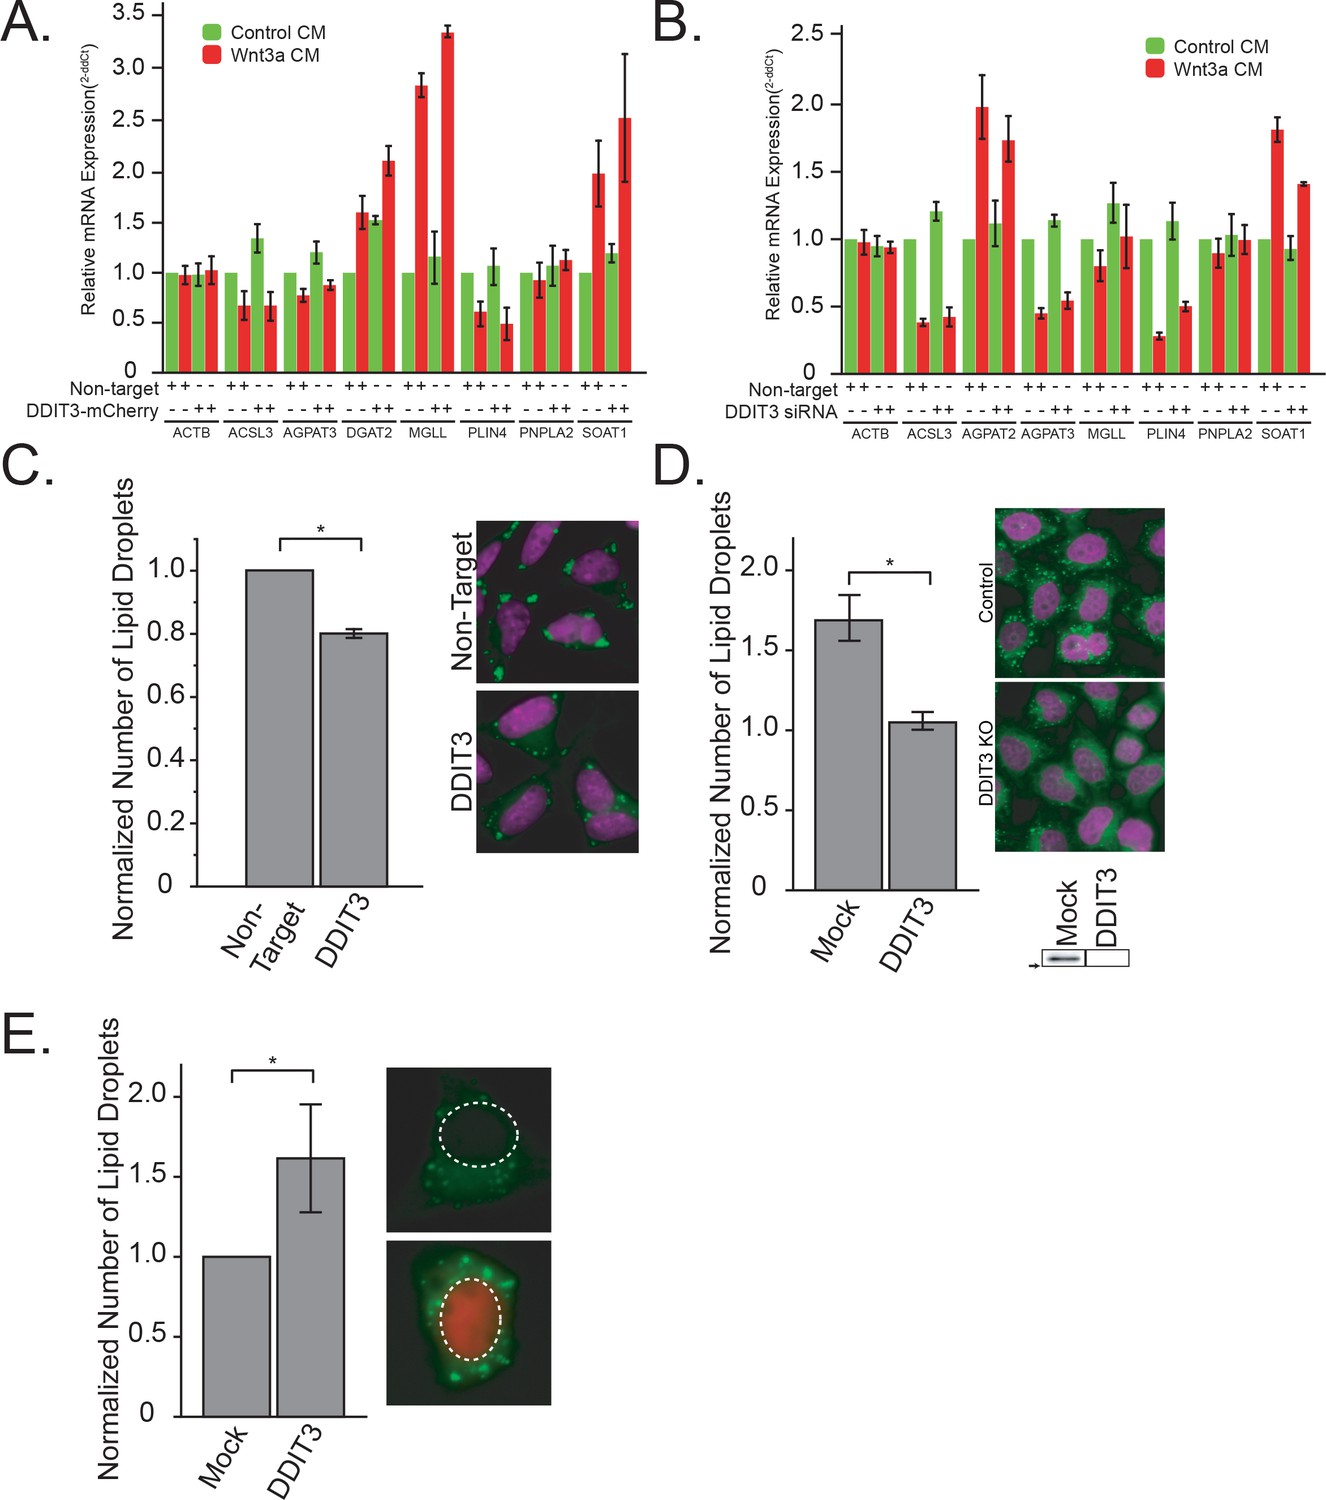
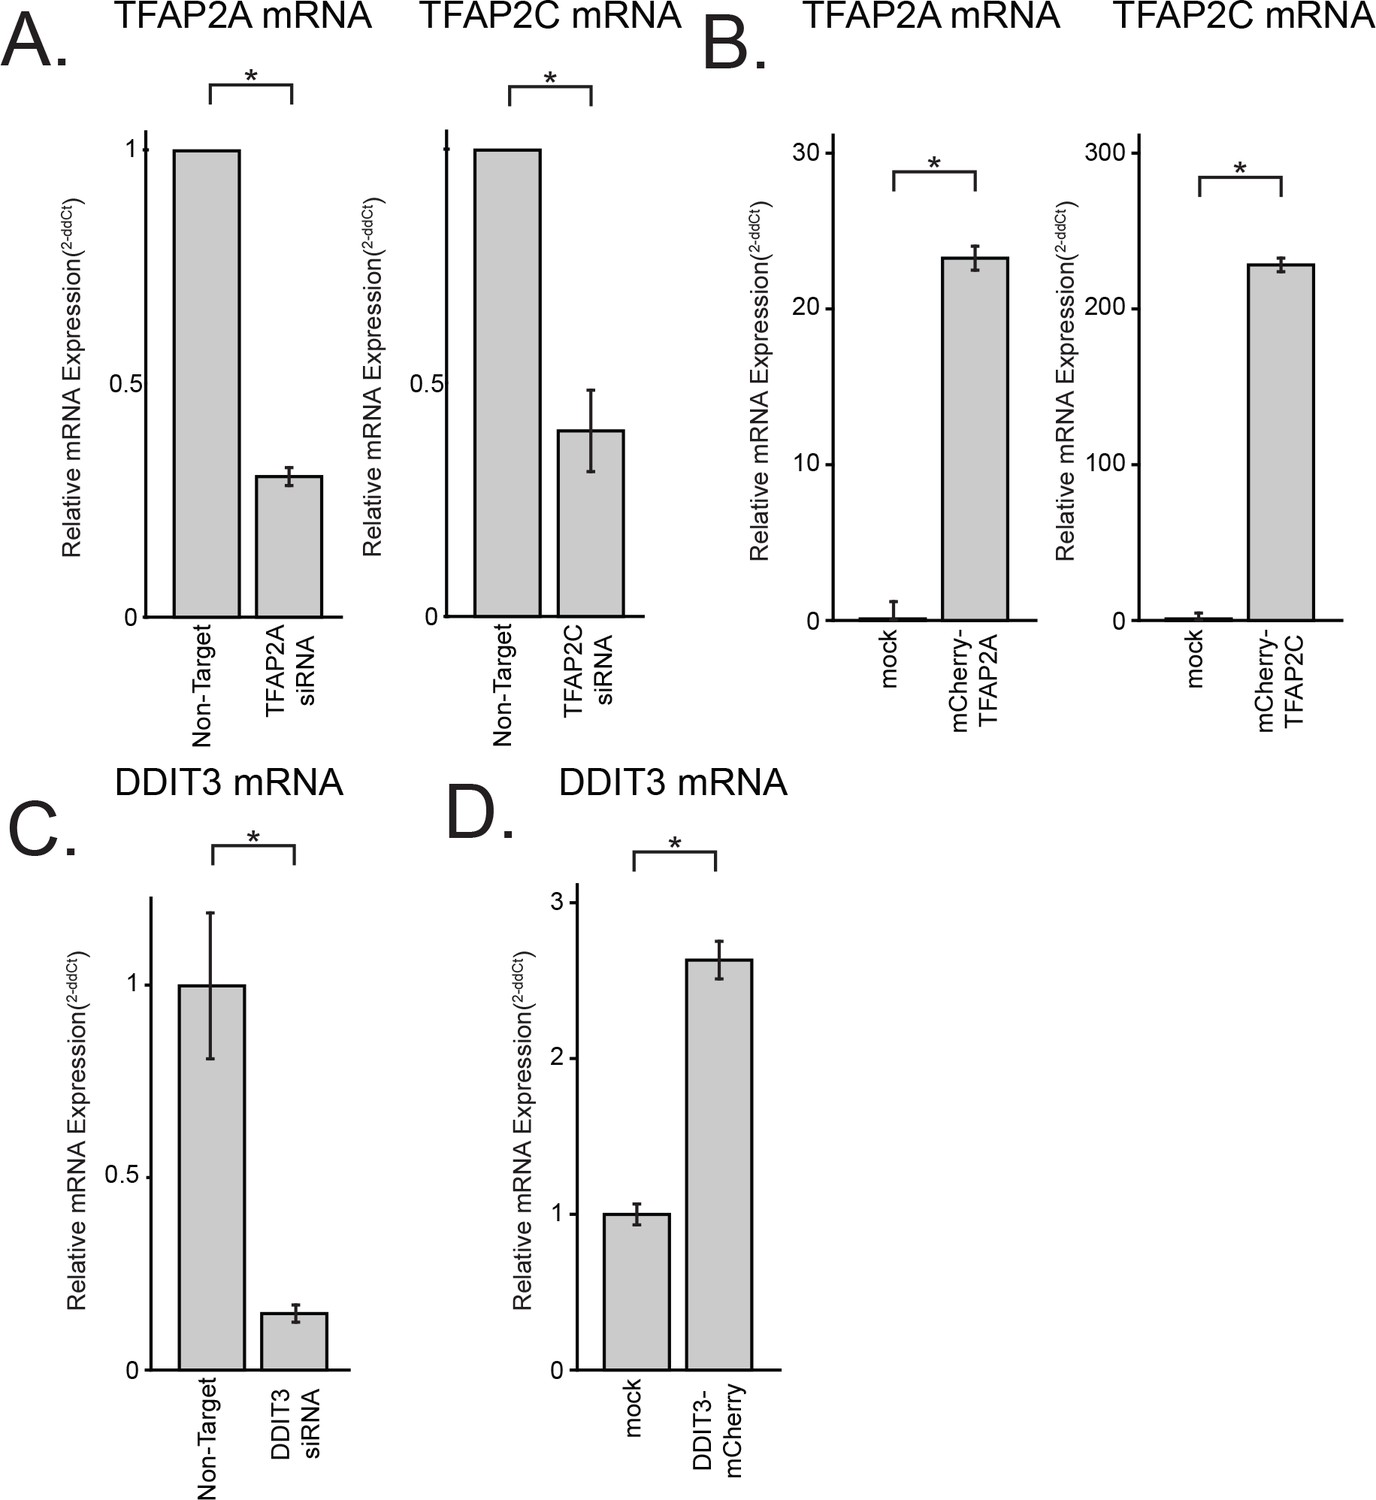
DDIT3 is both necessary and sufficient to mediated lipid droplet accumulation A-B.
qPCR of DDIT3, DGAT2 and SOAT1 after overexpression of DDIT3-mCherry (A), or siRNAs to DDIT3 (B). Data are presented as the mean of two to five independent experiments ± SEM. (C). L cells were treated, processed and analyzed like in Figure 3A, except that they were transfected with siRNAs to DDIT3 before stimulation with Wnt3a. Data are presented as the normalized mean number of lipid droplets per cell of three independent experiments ± SEM. (*) indicates a p-value<0.05. Panel E shows cells treated with non-target or anti-DDIT3 siRNAs (magenta, nucleus; green, lipid droplets). D. HeLa-MZ CRISPR/Cas9 clones were prepared and analysed as in Figure 3D. Data are expressed as fold induction relative to the control cells in five independent experiments ± SEM. Inset: DDIT3 protein levels of each clone determined by western blot. Arrow indicate position of 25 kDa marker. Representative images are shown (nuclei in magenta; lipid droplets in green). (E) L cells were treated, processed and analyzed like in Figure 3F, except that they were transfected with a plasmid encoding DDIT3-mCherry. Data are presented as the normalized mean number of lipid droplets per cell of six independent experiments ± SEM. (*) indicates a p-value<0.05. Panel E shows cells expressing or not DDIT3-mCherry (blue, nucleus; green, lipid droplets, red, DDIT3-mCherry fusion protein). In this figure, (*) indicates a p-value<0.05.
Figure 4—figure supplement 1
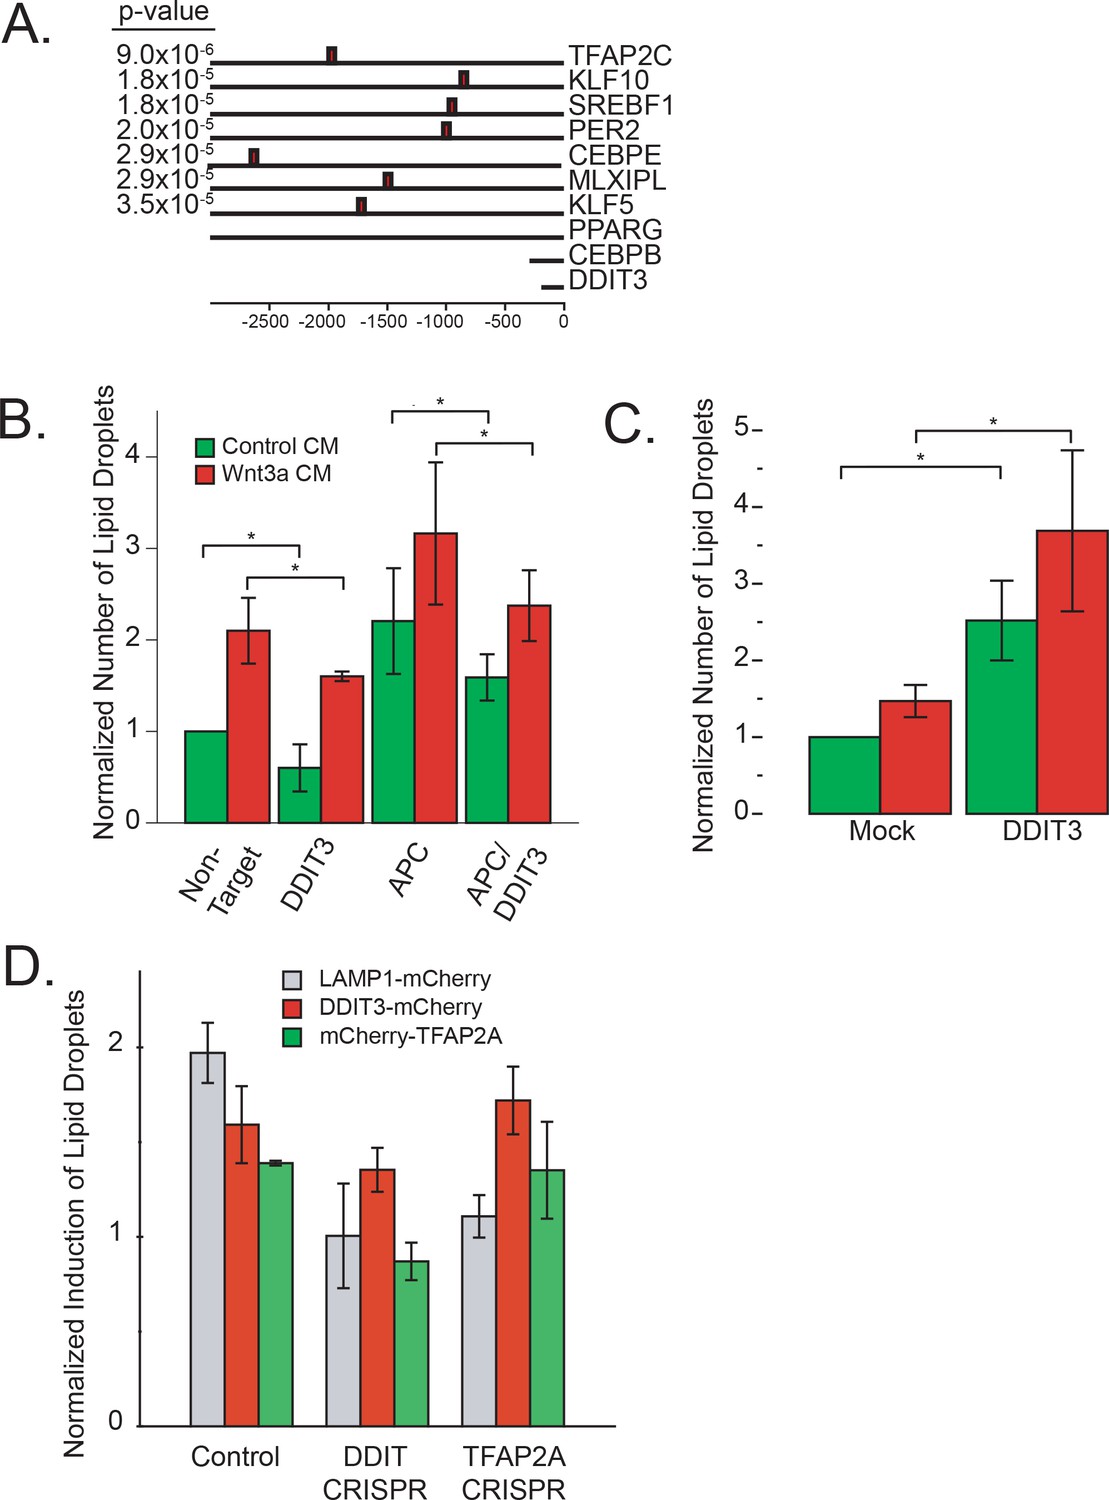
DDIT3 and lipid homeostasis.
(A) Location of DDIT3:CEBPA consensus sites in the promoter regions of the transcription factors Figure 2B reported to be involved in lipid homeostasis. Indicated is the pvalue of the match of the consensus motif. (B) HeLa-MZ cells were treated with siRNAs to the indicated target proteins for 48 hr, and then further incubated for 24 hr in the presence of control- or Wnt3a-conditioned media. Cells were then fixed, stained and the number of lipid droplets was quantified as in Figure 1A. Data are presented as the normalized mean number of lipid droplets per cell of three independent experiments ± SEM. (C) DDIT3-mCherry was overexpressed in HeLa-MZ cells for 24 hr and then further incubated for 24 hr in the presence of control, or Wnt3a, conditioned media. Cells were then fixed and labeled, and the number of lipid droplets per cell expressing DDIT3-mCherry was quantified as in Figure 4F. Data are presented as the normalized mean number of lipid droplets per cell of 5 independent experiments ± SEM. (D) CRISPR clones and the Hela-MZ parental line were transfected with the indicated plasmids for 36 hr before addition of control-, or Wnt3a-conditioned media for and additional 24 hr. Cells were fixed, stained and the number of lipid droplets quantified by automated microscopy and transfected cells were identified by the presence of mCherry. Data are expressed as the normalized mean induction of lipid droplets per transfected cell of three independent experiments ± SEM.
Tables
Key resources table
| Reagent type (species) or resource | Designation | Source or reference | Identifiers | Additional information |
|---|---|---|---|---|
| Cell line (Mus musculus) | L Cells | American Type Culture Collection | Cat #: CRL-2648; RRID:CVCL_4536 | PMID:14056989 |
| Cell line (Mus musculus) | L Wnt3A Cells | American Type Culture Collection | Cat #: CRL-2647; RRID:CVCL_0635 | PMID:12717451 |
| Cell line (Homo sapiens) | HeLa-MZ | other | Clone of HeLa (American Type Culture Collection Cat#: CCL-2) provided by Prof. Lucas Pelkmans (University of Zurich) | |
| Cell line (Homo sapiens) | CRISPR DDIT3 | this paper | ||
| Cell line (Homo sapiens) | CRISPR TFAP2A | this paper | ||
| Transfected construct (Homo sapiens) | GSK3B | Addgene | Cat #: 49491 | |
| Transfected construct (Homo sapiens) | GSK3BS9A | Addgene | Cat #: 49492 | |
| Transfected construct (Homo sapiens) | Wnt Project plasmid library | Addgene | Kit # 1000000022 | |
| Transfected construct (Homo sapiens) | pCMV-SREBP-1a(460 ) | American Type Culture Collection | Cat #: 99637 | PMID:9062341 |
| Transfected construct (Homo sapiens) | pCMV-SREBP-1c(436 ) | American Type Culture Collection | Cat #: 99636 | PMID:9062341 |
| Transfected construct (Homo sapiens) | pCMV-SREBP-2(468) | American Type Culture Collection | Cat #: 63452 | PMID:9062341 |
| Transfected construct (Homo sapiens) | DDIT3-mCherry | this paper | ||
| Transfected construct (Homo sapiens) | mCherry-TFAP2A | this paper | ||
| Transfected construct (Homo sapiens) | mCherry-TFAP2B | this paper | ||
| Transfected construct (Homo sapiens) | mCherry-TFAP2C | this paper | ||
| Transfected construct (Homo sapiens) | V5-TFAP2A | this paper | ||
| Biological sample (Bos taurus) | Lipoprotein-depleted serum | PMID:13252080 | ||
| Antibody | Rabbit anti-AP2 alpha; anti-TFAP2A | Abcam | Cat #: ab52222 | |
| Antibody | Mouse anti-CHOP (L63F7); anti-DDIT3 | Cell Signaling | Cat #: 2895 | |
| Antibody | Mouse anti-V5 Tag | ThermoFisher Scientific | Cat #: R960-25 | |
| Recombinant DNA reagent | CRISPR Forward: DDIT3 | Microsynth | CACCGGCACCTATATCTCATCCCC | |
| Recombinant DNA reagent | CRISPR Forward: TFAP2A | Microsynth | CACCGGAGTAAGGATCTTGCGACT | |
| Recombinant DNA reagent | CRISPR Reverse: DDIT3 | Microsynth | AAACGACTGATCCAACTGCAGAGAC | |
| Recombinant DNA reagent | CRISPR Reverse: TFAP2A | Microsynth | AAACAGTCGCAAGATCCTTACTCC | |
| Recombinant DNA reagent | Primer Forward: ACSL3 | Microsynth | TGAGCTCTCTTTGCTTGGTG | |
| Recombinant DNA reagent | Primer Forward: ACSL4 | Microsynth | AAGGACATCCCGAAACACAC | |
| Recombinant DNA reagent | Primer Forward: AGPAT2 | Microsynth | GGCCTAAGGCAAAAGGATGTG | |
| Recombinant DNA reagent | Primer Forward: AGPAT3 | Microsynth | ACCCAAGCTCAGCAAGTCC | |
| Recombinant DNA reagent | Primer Forward: CTCF | Microsynth | GCCAGTCCAACCGGCTTATG | |
| Recombinant DNA reagent | Primer Forward: LPCAT2 | Microsynth | AGGGGAAGTGGTTGCTCAATG | |
| Recombinant DNA reagent | Primer Forward: MGLL | Microsynth | GAACCCAGCTCAGTTCAGG | |
| Recombinant DNA reagent | Primer Forward: PLIN3 | Microsynth | TTTGGCAGAGGTGGCAAAC | |
| Recombinant DNA reagent | Primer Forward: PLIN4 | Microsynth | AACCTGCAGGGAAGGTGTTC | |
| Recombinant DNA reagent | Primer Forward: PNPLA2 | Microsynth | TGGCTTCCCTAACTCAGCTTG | |
| Recombinant DNA reagent | Primer Forward: PNPLA3 | Microsynth | TGTCAAGGAAAACAGAAGGAAGC | |
| Recombinant DNA reagent | Primer Reverse: ACSL3 | Microsynth | TGAAAGGTTGCCTTCCTGAG | |
| Recombinant DNA reagent | Primer Reverse: ACSL4 | Microsynth | TCGCCTCAAGTTGTTGCTC | |
| Recombinant DNA reagent | Primer Reverse: AGPAT2 | Microsynth | CTTCAAATGAATGGGGAACTGC | |
| Recombinant DNA reagent | Primer Reverse: AGPAT3 | Microsynth | GCCCGGTACCTTGTGTGAC | |
| Recombinant DNA reagent | Primer Reverse: CTCF | Microsynth | GGTTCTCCCAAGCAGGAGCA | |
| Recombinant DNA reagent | Primer Reverse: LPCAT2 | Microsynth | TCTATGAACCTCGGTTGCCTTC | |
| Recombinant DNA reagent | Primer Reverse: MGLL | Microsynth | CAGCCACGCACTCCTCTC | |
| Recombinant DNA reagent | Primer Reverse: PLIN3 | Microsynth | GATCCACAGGAAGTTCAAGCTG | |
| Recombinant DNA reagent | Primer Reverse: PLIN4 | Microsynth | TTCCTCCTTCGCTTGCTTC | |
| Recombinant DNA reagent | Primer Reverse: PNPLA2 | Microsynth | TCATCTCTGGACCTAGCTGTTGC | |
| Recombinant DNA reagent | Primer Reverse: PNPLA3 | Microsynth | GCAGCGACTCGAGAGAAAGC | |
| Recombinant DNA reagent | Primer set: ACSL3 | QIAGEN | Cat #: QT01068333 | |
| Recombinant DNA reagent | Primer set: ACTB | QIAGEN | Cat #: QT01136772 | |
| Recombinant DNA reagent | Primer set: AGPAT2 | QIAGEN | Cat #: QT00104888 | |
| Recombinant DNA reagent | Primer set: AGPAT3 | QIAGEN | Cat #: QT00131481 | |
| Recombinant DNA reagent | Primer set: DDIT3 | QIAGEN | Cat #: QT01749748 | |
| Recombinant DNA reagent | Primer set: DGAT2 | QIAGEN | Cat #: QT00134477 | |
| Recombinant DNA reagent | Primer set: HMGCR | QIAGEN | Cat #: QT00004081 | |
| Recombinant DNA reagent | Primer set: LDLR | QIAGEN | Cat #: QT00045864 | |
| Recombinant DNA reagent | Primer set: MGLL | QIAGEN | Cat #: QT01163428 | |
| Recombinant DNA reagent | Primer set: PLIN4 | QIAGEN | Cat #; QT00112301 | |
| Recombinant DNA reagent | Primer set: PNPLA2 | QIAGEN | Cat #: QT00111846 | |
| Recombinant DNA reagent | Primer set: SOAT1 | QIAGEN | Cat #: QT01046472 | |
| Recombinant DNA reagent | Primer set: SREBPF1 | QIAGEN | Cat #: QT00167055 | |
| Recombinant DNA reagent | Primer set: SREBPF1 | QIAGEN | Cat #: QT00036897 | |
| Recombinant DNA reagent | Primer set: SREBPF2 | QIAGEN | Cat #: QT00255204 | |
| Recombinant DNA reagent | Primer set: SREBPF2 | QIAGEN | Cat #: QT00052052 | |
| Recombinant DNA reagent | Primer set: TFAP2A | QIAGEN | Cat #: QT00085225 | |
| Recombinant DNA reagent | Primer set: TFAP2C | QIAGEN | Cat #: QT00073073 | |
| Sequence-based reagent | siRNA DDIT3 | Dharmacon | Cat #: J-062068 | |
| Sequence-based reagent | siRNA TFAP2A | Dharmacon | Cat #: J-062799 | |
| Sequence-based reagent | siRNA TFAP2C | Dharmacon | Cat #: J-048594 | |
| Sequence-based reagent | siRNA APC | QIAGEN | Cat #: S102757251 | |
| Sequence-based reagent | siRNA DGAT1 | QIAGEN | Cat #: S100978278 | |
| Sequence-based reagent | siRNA DGAT2 | QIAGEN | Cat #: S100978278 | |
| Sequence-based reagent | siRNA GSK3B | QIAGEN | Cat #: S100300335 | |
| Sequence-based reagent | siRNA SOAT1 | QIAGEN | Cat #: S101428924 | |
| Commercial assay or kit | Bio-Rad Protein Assay Kit | Bio-Rad Laboratories | Cat #: 500 – 0006 | |
| Commercial assay or kit | SsoAdvanced SYBR Green Supermix | Bio-Rad Laboratories | Cat #: 1725270 | |
| Commercial assay or kit | Triglyceride Colorimetric Assay Kit | Cayman Chemicals | Cat #: 10010303 | |
| Commercial assay or kit | Wizard SV gel and PCR Clean -up system | Promega | Cat #: A9281 | |
| Commercial assay or kit | RNeasy Mini Kit | QIAGEN | Cat #: 74104 | |
| Commercial assay or kit | RNeasy Mini Kit | QIAGEN | Cat #: 74104 | |
| Commercial assay or kit | Amplex Red Cholesterol Assay Kit | ThermoFisher Scientific | Cat #: A12216 | |
| Commercial assay or kit | SuperScript VILO cDNA Synthesis Kit | ThermoFisher Scientific | Cat #: 11754050 | |
| Chemical compound, drug | Wnt Pathway Library | Enzo Life Sciences | Cat #: BML-2838 | |
| Chemical compound, drug | BODIPY 493/503 | ThermoFisher Scientific | Cat #: D3922 | |
| Chemical compound, drug | Hoechst 33342 | ThermoFisher Scientific | Cat #: H3570 | |
| Chemical compound, drug | Lipofectamine 3000 | ThermoFisher Scientific | Cat #: L3000015 | |
| Chemical compound, drug | Lipofectamine LTX | ThermoFisher Scientific | Cat #: A12621 | |
| Chemical compound, drug | Lipofectamine RNAiMax | ThermoFisher Scientific | Cat #: 13778100 | |
| Chemical compound, drug | A-922500 | Tocris Bioscience | Cat #: 3587 | PMID:18183944 |
| Chemical compound, drug | PF-429242 | Tocris Bioscience | Cat #: 3354 | PMID:17583500 |
| Chemical compound, drug | Torin-2 | Tocris Bioscience | Cat #: 4248 | PMID:21322566 |
Additional files
-
Transparent reporting form
- https://doi.org/10.7554/eLife.36330.018
Download links
A two-part list of links to download the article, or parts of the article, in various formats.
Downloads (link to download the article as PDF)
Open citations (links to open the citations from this article in various online reference manager services)
Cite this article (links to download the citations from this article in formats compatible with various reference manager tools)
TFAP2 transcription factors are regulators of lipid droplet biogenesis
eLife 7:e36330.
https://doi.org/10.7554/eLife.36330


