Transcriptional and epigenomic landscapes of CNS and non-CNS vascular endothelial cells
- Johns Hopkins University School of Medicine, United States
- The Salk Institute for Biological Studies, United States
Figures
Figure 1 with 4 supplements
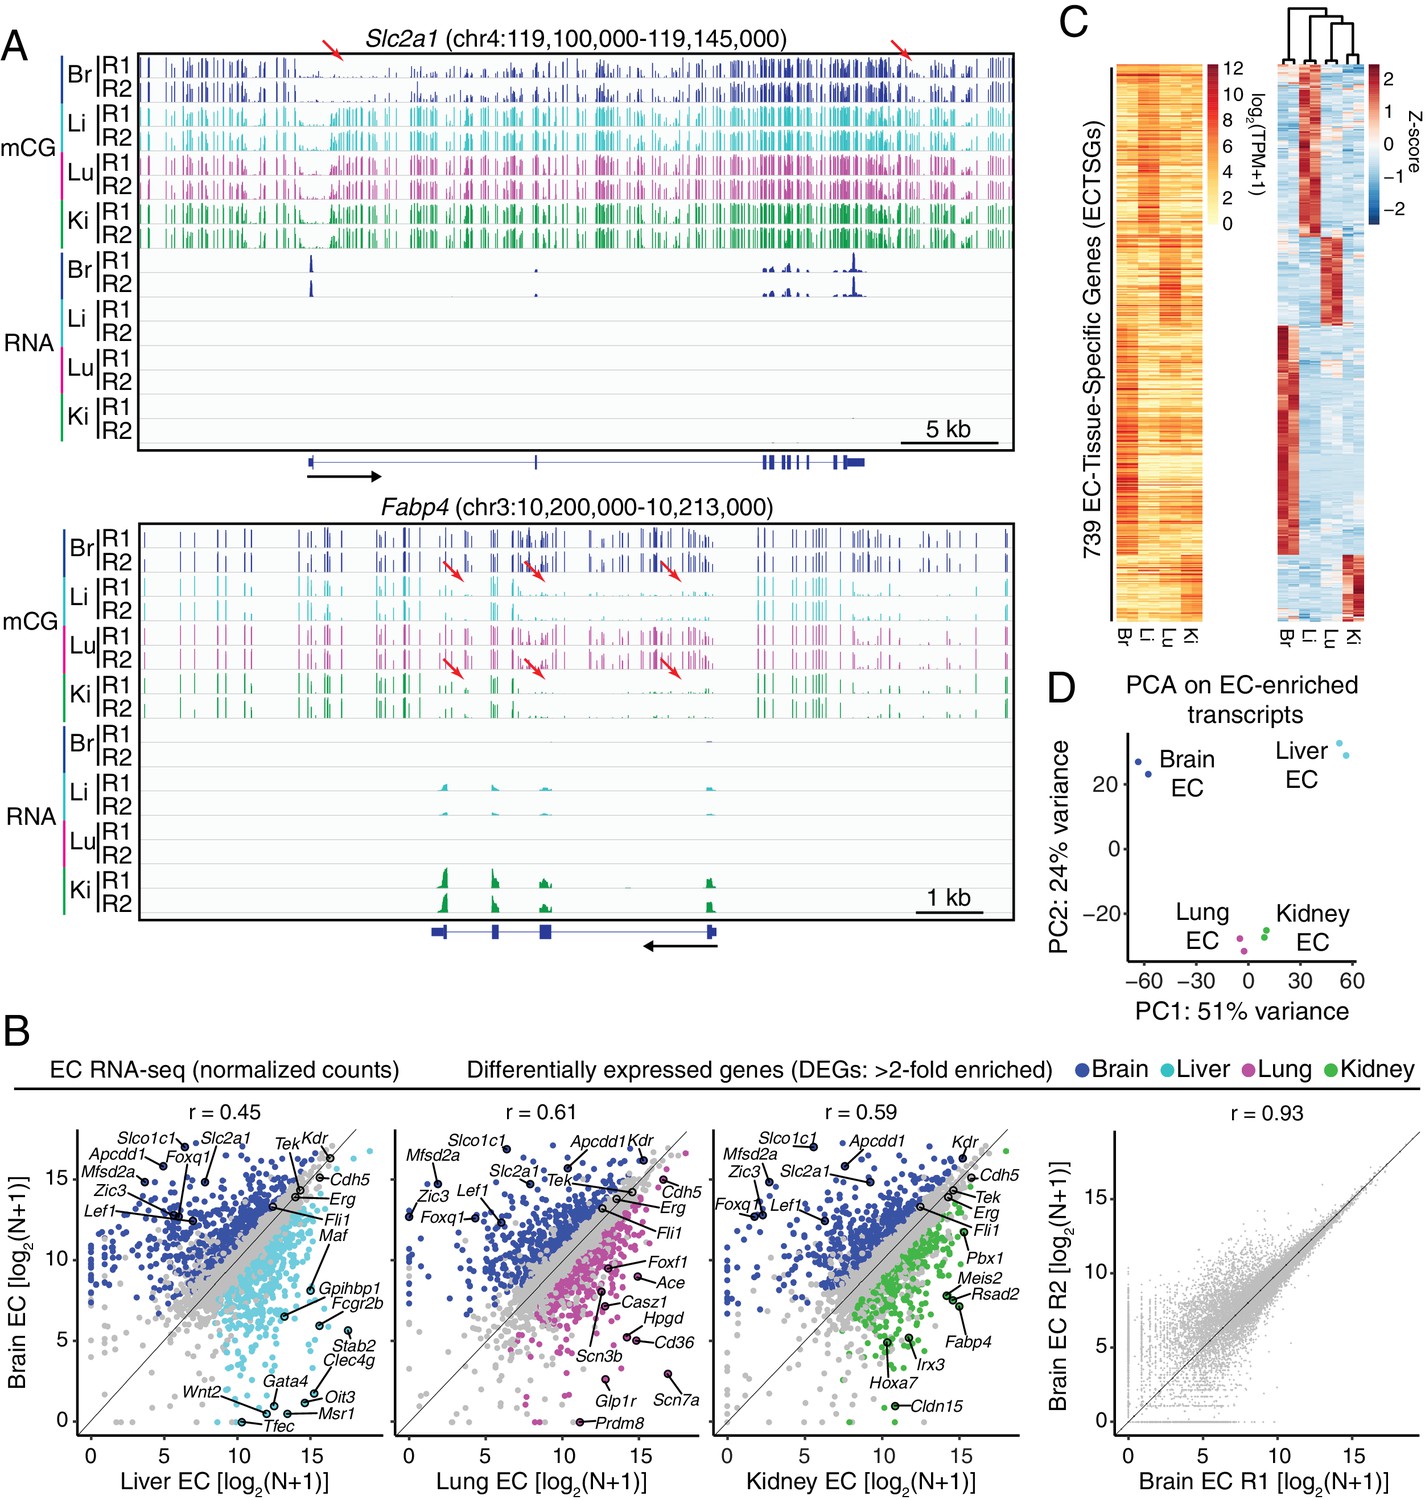
RNA-seq reveals inter-tissue EC heterogeneity.
(A) Genome browser images showing CG methylation (top) and RNA expression (bottom) for two genes: Slc2a1, a glucose transporter expressed in brain ECs, and Fabp4, a fatty acid binding protein expressed in liver and kidney ECs. For DNA methylation, the mCG/CG ratio is shown, with the height of each bar indicating the fractional methylation (range: 0 to 1). For RNA-seq, histograms of the number of aligned reads are shown. For this and all other genome browser images, the heights of all the tracks of a given sequencing experiment are the same across samples. For both genes, tissue-specific gene expression is associated with tissue-specific hypomethylation near the TSS. Red arrows indicate illustrative examples of differential hypomethylation. Br, brain; Li, liver; Lu, lung; Ki, kidney. R1 and R2, biological replicates. Black arrows beneath this and all other genome browser images indicate the direction of transcription. (B) Scatter plots comparing cross-sample normalized RNA-seq read counts of EC-expressed protein-coding genes from brain versus liver, lung, and kidney, showing only those transcripts with TPM >10 for each of the two RNA-seq replicates. Colored symbols indicate transcripts with FDR < 0.05 and enrichment >2 fold for the indicated tissue comparison. Right, comparison of cross-sample normalized RNA-seq read counts for protein-coding genes between the two brain EC replicates. Values depicted are the log2 transformation of cross-sample normalized counts + 1. (C) Heatmaps depicting transcript abundances for 739 Endothelial Cell Tissue-Specific Genes (ECTSGs). Left, log2 transformation of TPM +1. Right, z-scores for the TPMs. (D) Principal component analysis of all EC-enriched transcripts from brain, liver, lung, and kidney. The two symbols for each sample represent biological replicates. In this and all other figures, tissue type is indicated by color: Br, brain, blue; Li, liver, cyan; Lu, lung, magenta; Ki, kidney, green.
Figure 1—figure supplement 1
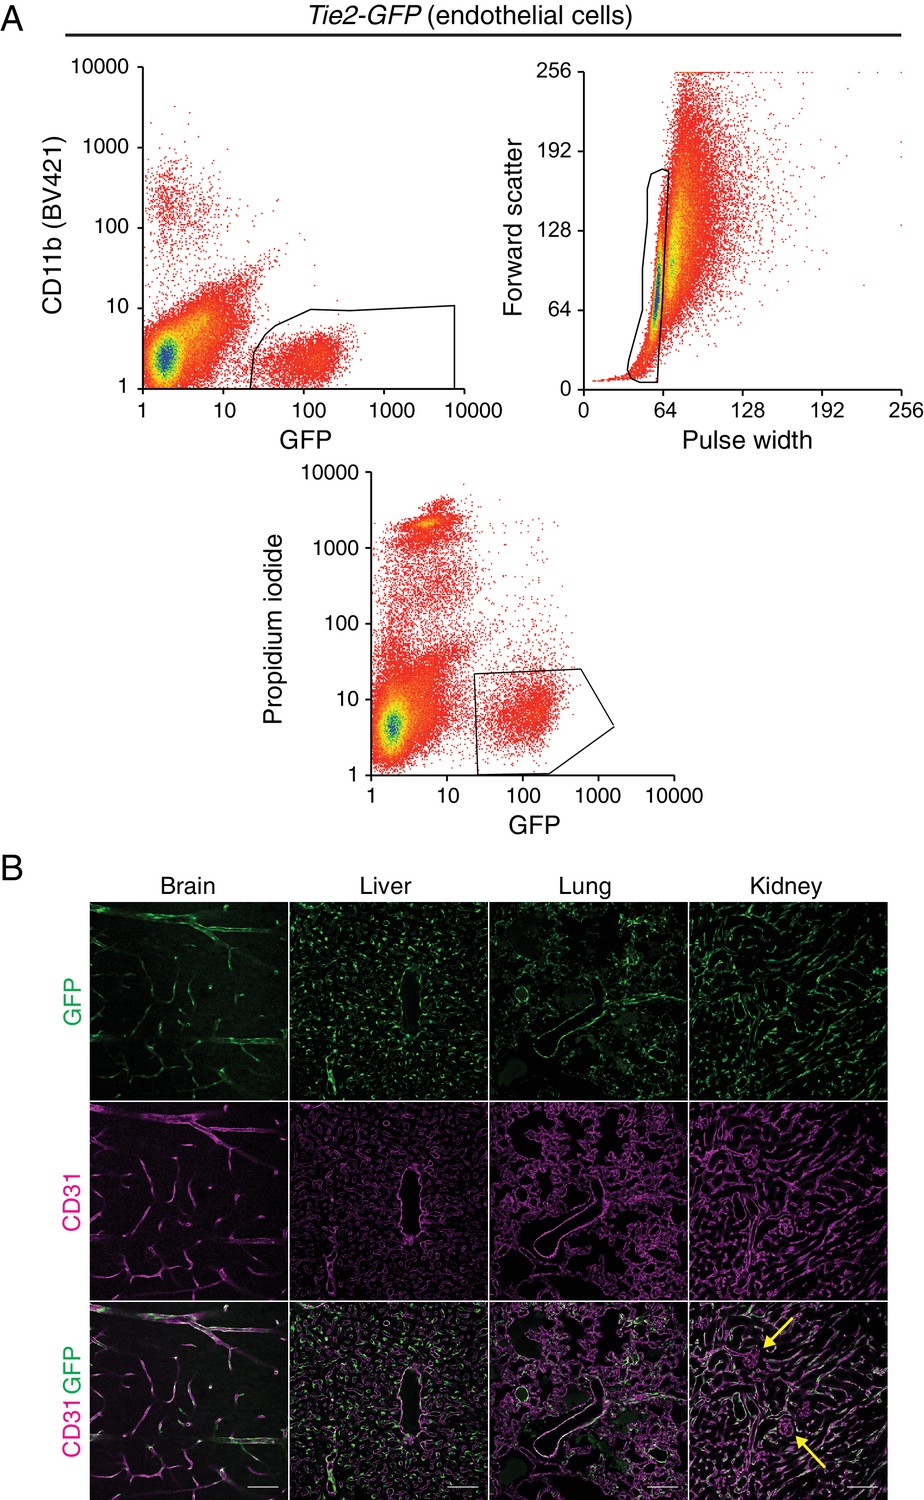
Tie2-GFP transgenic mouse enables isolation of ECs.
(A) A representative flow cytometry profile of ECs sorted from Tie2-GFP kidneys. The thresholds used to define GFP-positive CD11b-negative ECs (top left), singlets (top right), and viable propidium iodide-negative (bottom) ECs are outlined in black. (B) Immunostaining of brain, liver, lung, and kidney from P7 Tie2-GFP mice. Anti-GFP (green) staining in the top row reveals accumulation of GFP in CD31-positive (magenta) blood vessels. Yellow arrows indicate renal glomerular capillaries, which are GFP-negative. Scale bar: 100 um.
Figure 1—figure supplement 2
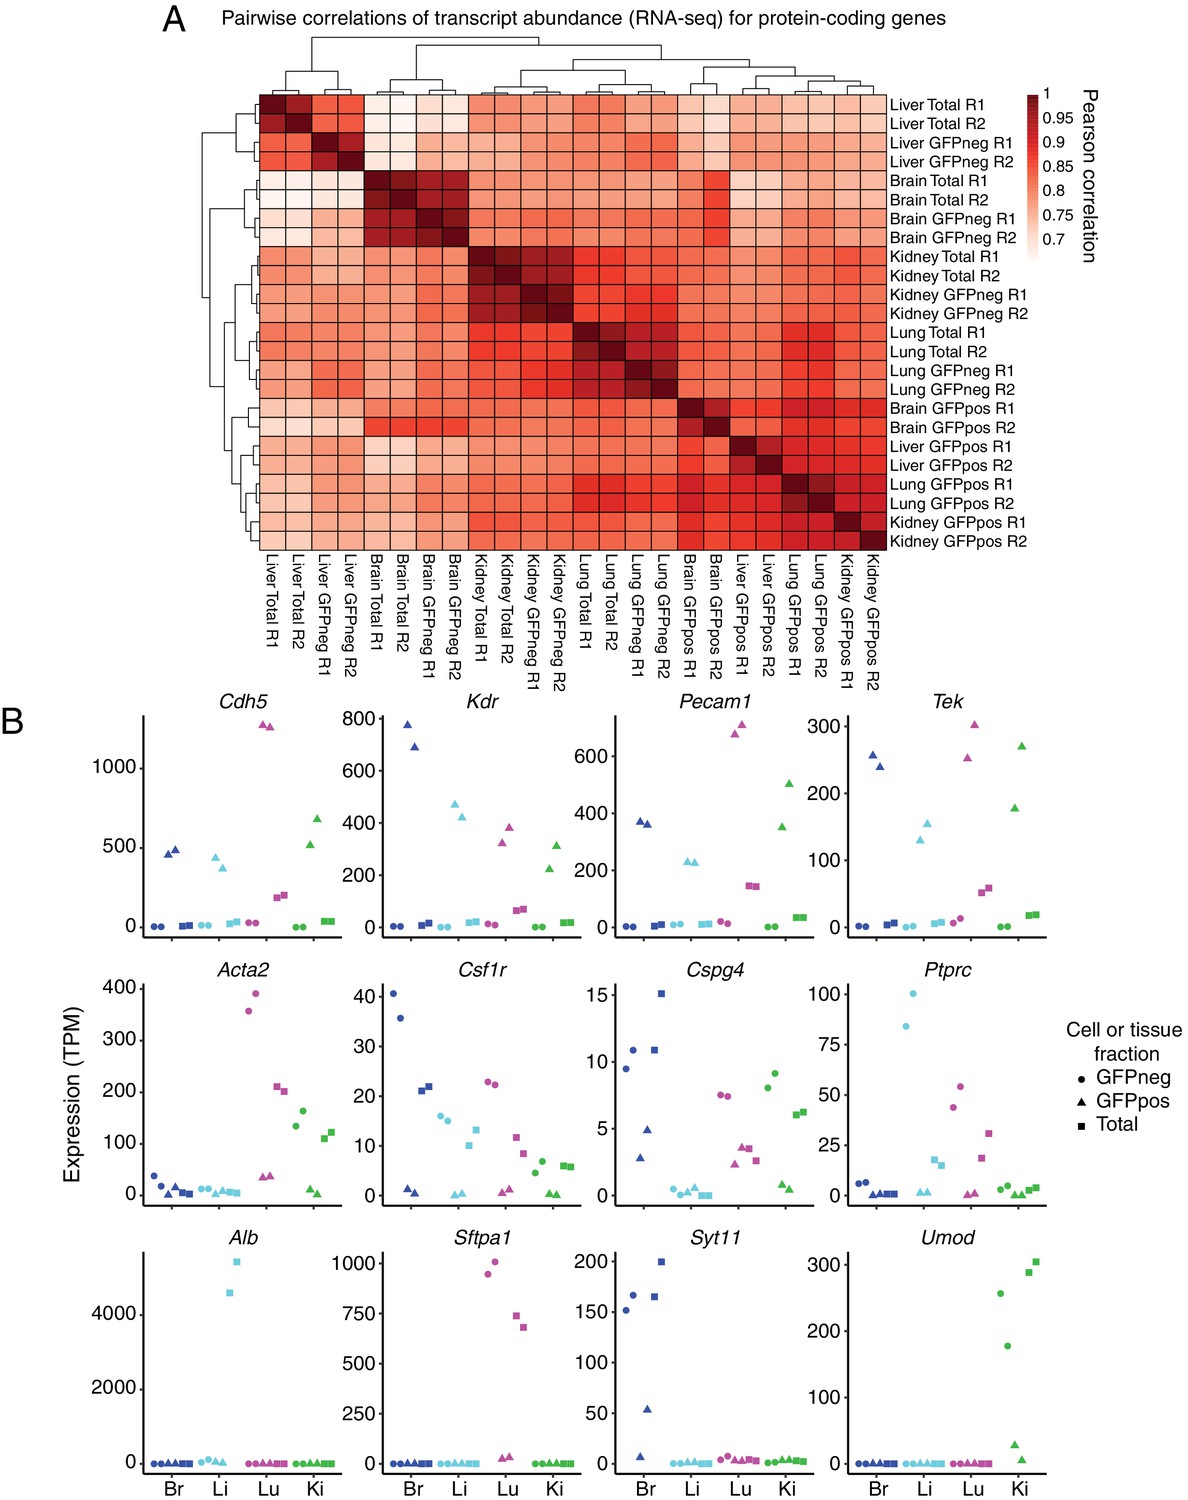
GFP-positive FACS-sorted cells from P7 Tie2-GFP mice represent pure populations of ECs.
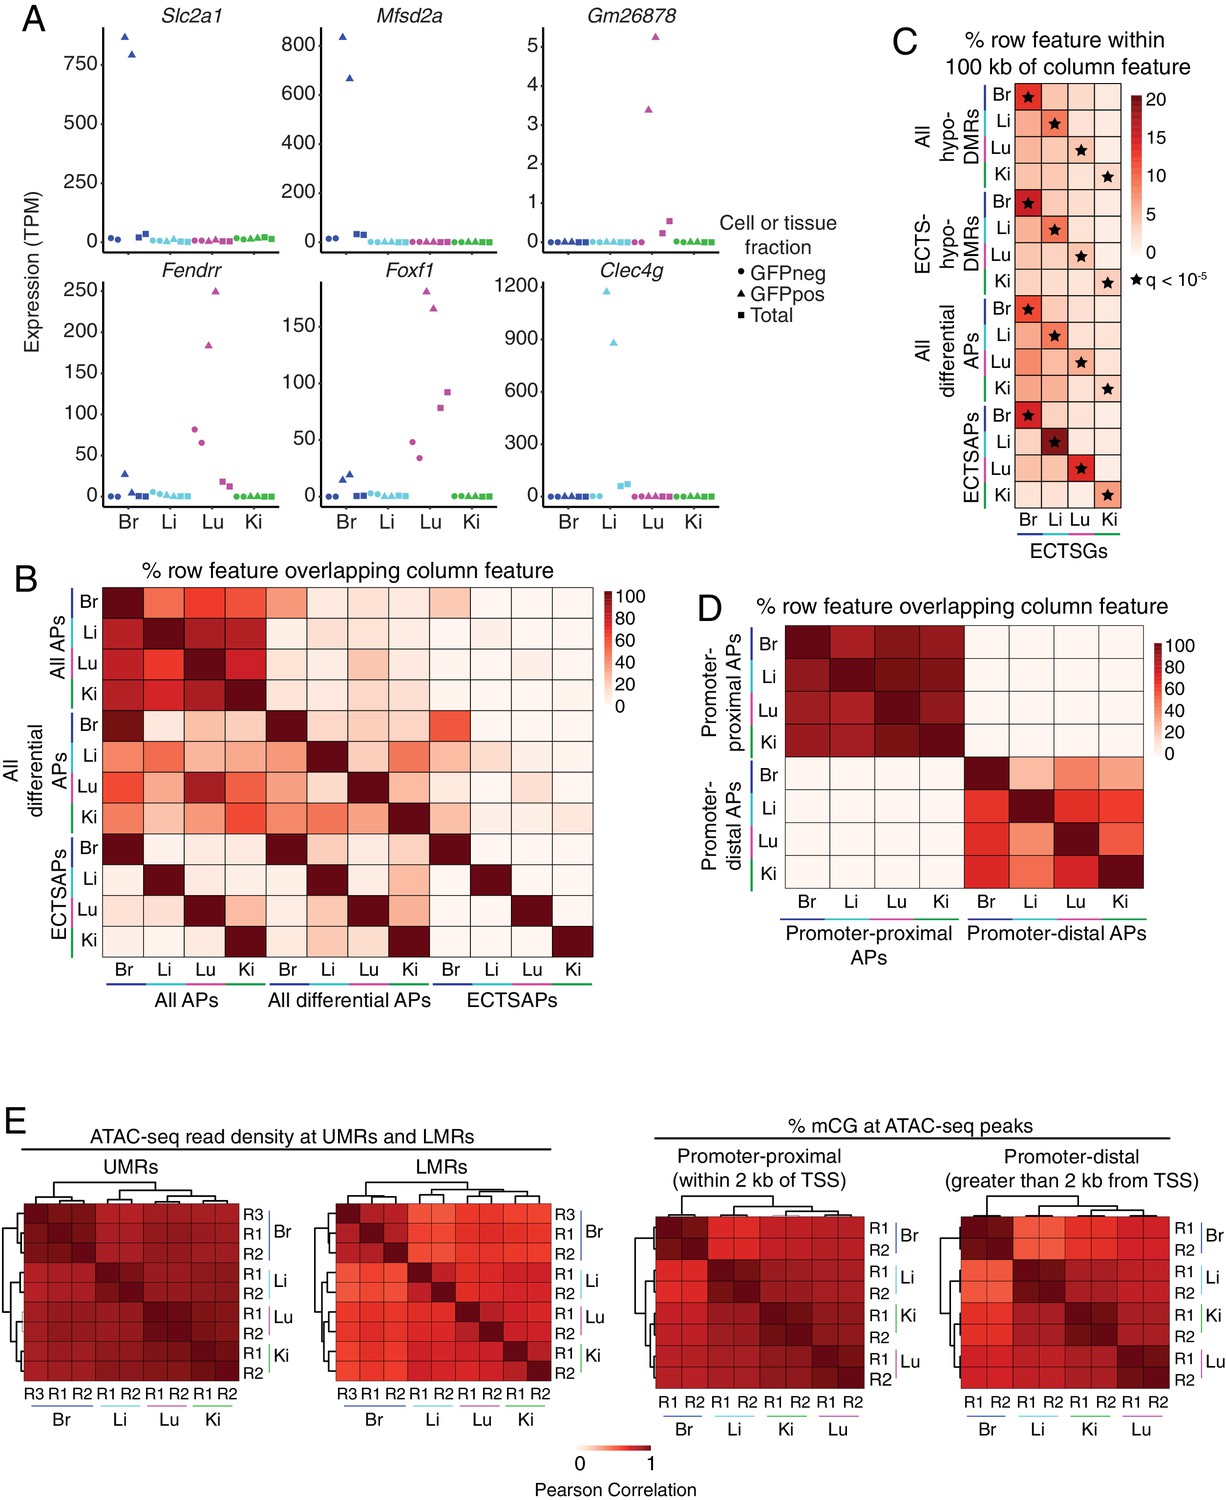
(A) Heatmap indicating pairwise Pearson correlations for RNA-seq TPMs for protein-coding genes. Total indicates sequencing performed on total dissociated tissue, GFPneg indicates sequencing performed on GFP-negative FACS-sorted cells, and GFPpos indicates sequencing performed on GFP-positive FACS-sorted cells. R1 and R2 indicate biological replicates. (B) Expression levels (TPMs) based on RNA-seq for the indicated genes. The top row of genes are known EC-expressed genes. EC-specific transcripts comprise ~15% of total lung transcripts. The middle row of genes are known immune or mural cell-expressed genes. The bottom row of genes are known abundant parenchymal-expressed genes. In this and subsequent figures, cell or tissue fractions are indicated by the following symbols: GFP-negative, circle; GFP-positive, triangle; Total, square. GFP-positive represents FACS-purified ECs.
Figure 1—figure supplement 3

Expression of cell-type-specific transcripts in liver and lung samples.
(A) Examples of liver gene expression to assess purity of FACS-sorted fractions. Expression levels (TPMs) based on RNA-seq for genes known to be expressed in Kupffer cells (top row) or cholangiocytes (bottom row). (B) Examples of lung gene expression to assess purity of FACS-sorted fractions. RNA-seq expression plots for genes known to be pan-EC (Cdh5, Kdr, Pecam1, and Tek), lung epithelial-specific [Cftr and genes coding for surfactant proteins (Sftp)], and lung EC-specific (Ace). Scn3b and Scn7a match the lung EC-specific expression pattern.
Figure 1—figure supplement 4

RNA-seq comparisons between peripheral ECs.
(A) Scatter plots comparing cross-sample normalized RNA-seq read counts of protein-coding genes for pairs of biological replicates from liver ECs, lung ECs, and kidney ECs. (B) Scatter plots comparing cross-sample normalized RNA-seq read counts of EC-expressed protein-coding genes from liver versus lung, liver versus kidney, and lung versus kidney, showing only those transcripts with TPM >10 for each of the two RNA-seq replicates. Colored symbols indicate transcripts with FDR < 0.05 and enrichment >2 fold for the indicated tissue comparison. Values depicted are the log2 transformation of cross-sample normalized counts + 1.
Figure 2 with 2 supplements

MethylC-seq reveals distinct classes of hypomethylated regions in ECs.
(A) Scatter plots comparing the mean fraction of CG methylation in a 5 kb window immediately 3’ of the TSS for protein-coding genes from brain ECs versus liver, lung, and kidney ECs. Colored symbols indicate transcripts with FDR < 0.05 and enrichment >2 fold for the indicated tissue comparison. These plots show a positive correlation between EC tissue-specific gene expression and tissue-specific hypo-methylation. Right, comparison of CG methylation between the two brain EC biological replicates. (B) Heatmap indicating the percentage of each row that overlaps with differentially expressed genes. A significant proportion of ECTS-large hypo-DMRs overlap differentially expressed genes for the same EC-subtype relative to the other EC subtypes. Black stars indicate statistical significance at q < 1×10⁻¹⁰. (C) Heatmap indicating the percentage of each row that overlaps with either ECTS-large hypo-DMRs or DMVs. DMVs exhibit more overlap between EC subtypes than large hypo-DMRs. (D) Genome browser images showing methylation as in Figure 1A at various TF genes. Colored bars indicate DMVs. Each genome browser image is at the same scale.
Figure 2—figure supplement 1
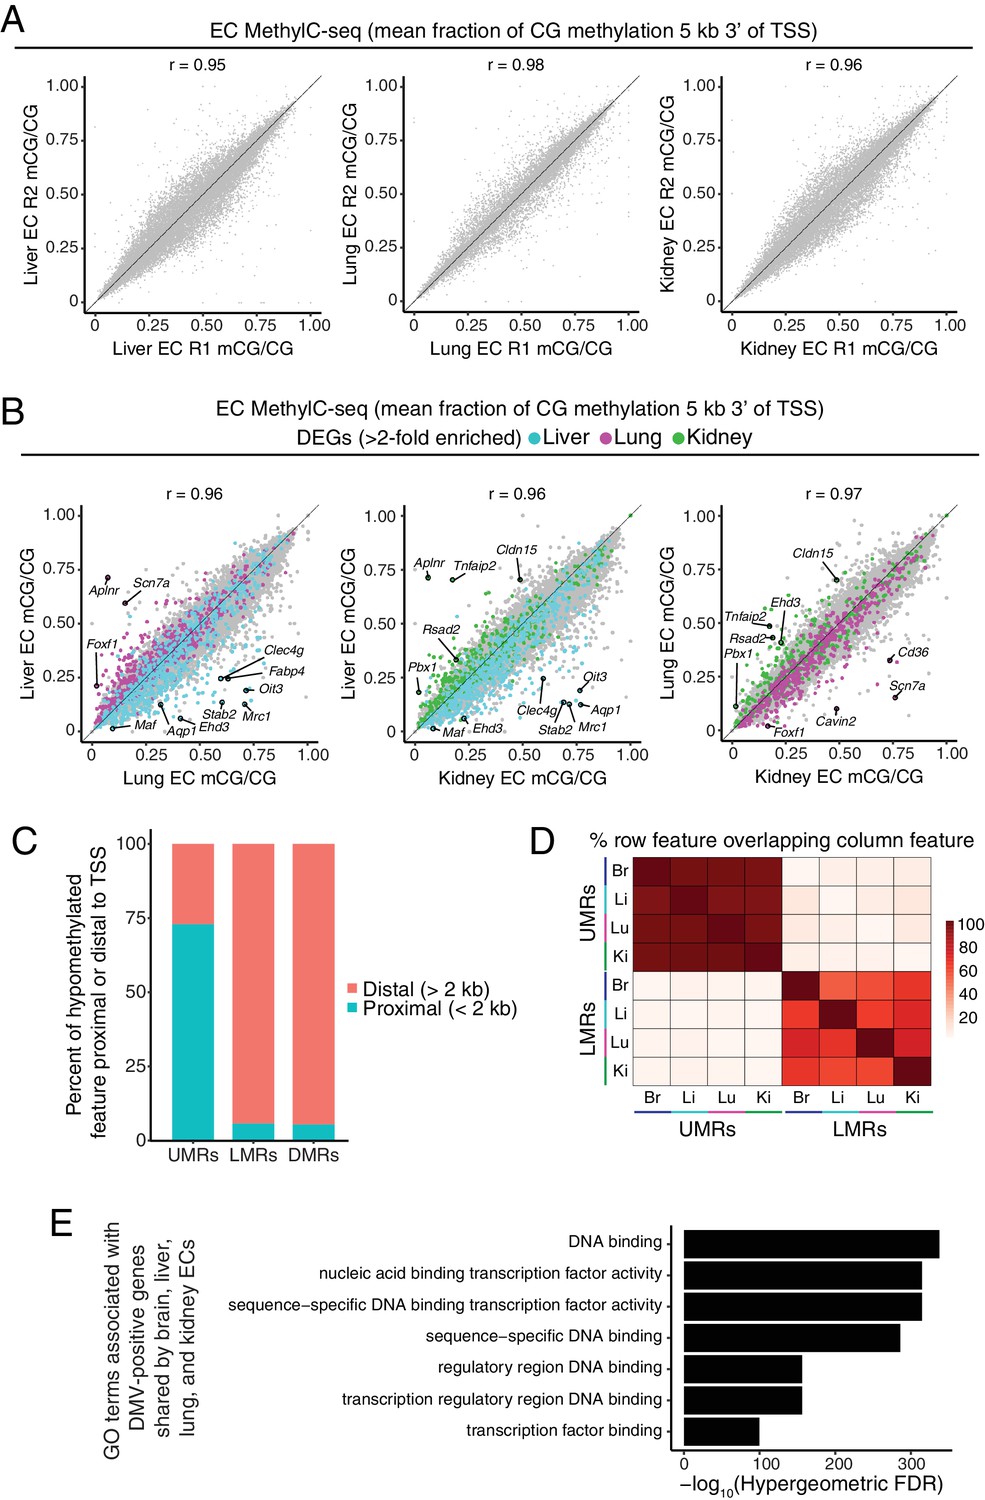
Distinct classes of hypomethylated features in ECs.
(A) Scatter plots comparing the mean fraction of CG methylation in a 5 kb window immediately 3’ of the TSS for protein-coding genes for each of the peripheral EC biological replicates. (B) Scatter plots comparing the mean fraction of CG methylation in a 5 kb window immediately 3’ of the TSS for protein-coding genes from liver versus lung, liver versus kidney, and lung versus kidney. Colored symbols indicate transcripts with FDR < 0.05 and enrichment >2 fold for the indicated tissue comparison. These plots show a positive correlation between EC-tissue-specific gene expression and tissue-specific hypo-methylation. (C) Barplot indicating the distribution of UMRs, LMRs, and DMRs in relation to gene TSSs. (D) Heatmap indicating percentage of overlap among UMRs and LMRs. There is more overlap between UMRs of different EC subtypes than between LMRs. (E) Gene ontology categories (McLean et al., 2010) related to TFs are strongly enriched for the genes that overlap DMVs shared by all four EC subtypes.
Figure 2—figure supplement 2
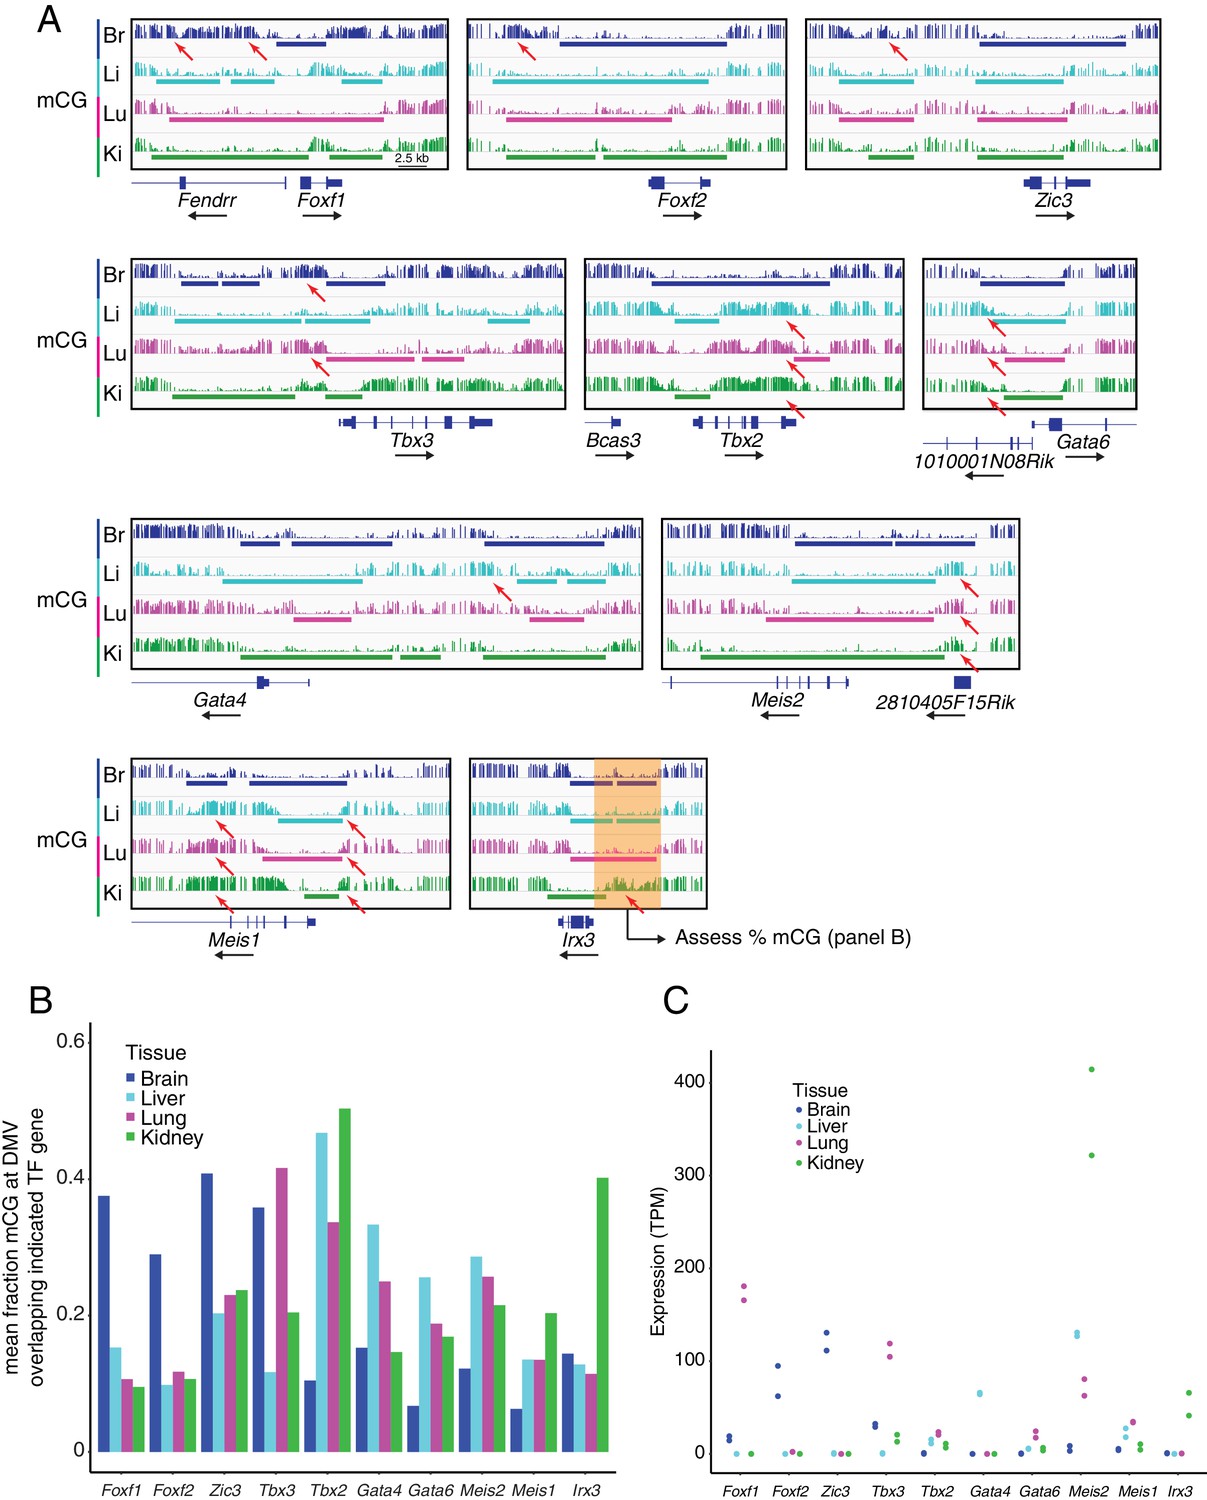
DMVs at differentially expressed TF genes exhibit differential methylation.
(A) Genome browser images showing CG methylation at differentially expressed TF genes. Colored bars indicate DMVs. Red arrows indicate illustrative examples of differential hypermethylation. (B) Barplot indicating the mean fraction of CG methylation at DMVs overlapping the indicated TF genes. To compare the degree of methylation between EC subtypes at DMVs overlapping differentially expressed TF genes, we applied the following steps: (1) within each EC subtype, all DMVs in a 20 kb window 5’ to the TSS of the gene of interest were joined into a single contiguous block, (2) overlapping DMVs between EC subtypes were merged to generate a genomic interval that spanned the greatest extent of all the DMVs, (3) within the merged interval, the fraction mCG methylation was calculated for each EC subtype. This scheme is illustrated by the translucent orange box shown at the Irx3 locus in (A). (C) Expression levels (TPMs) based on RNA-seq for the TF genes shown in (B). Values for independent replicates are shown.
Figure 3 with 1 supplement
In ECs, patterns of methylation and gene expression at HOX gene clusters correlate with anterior/posterior position.
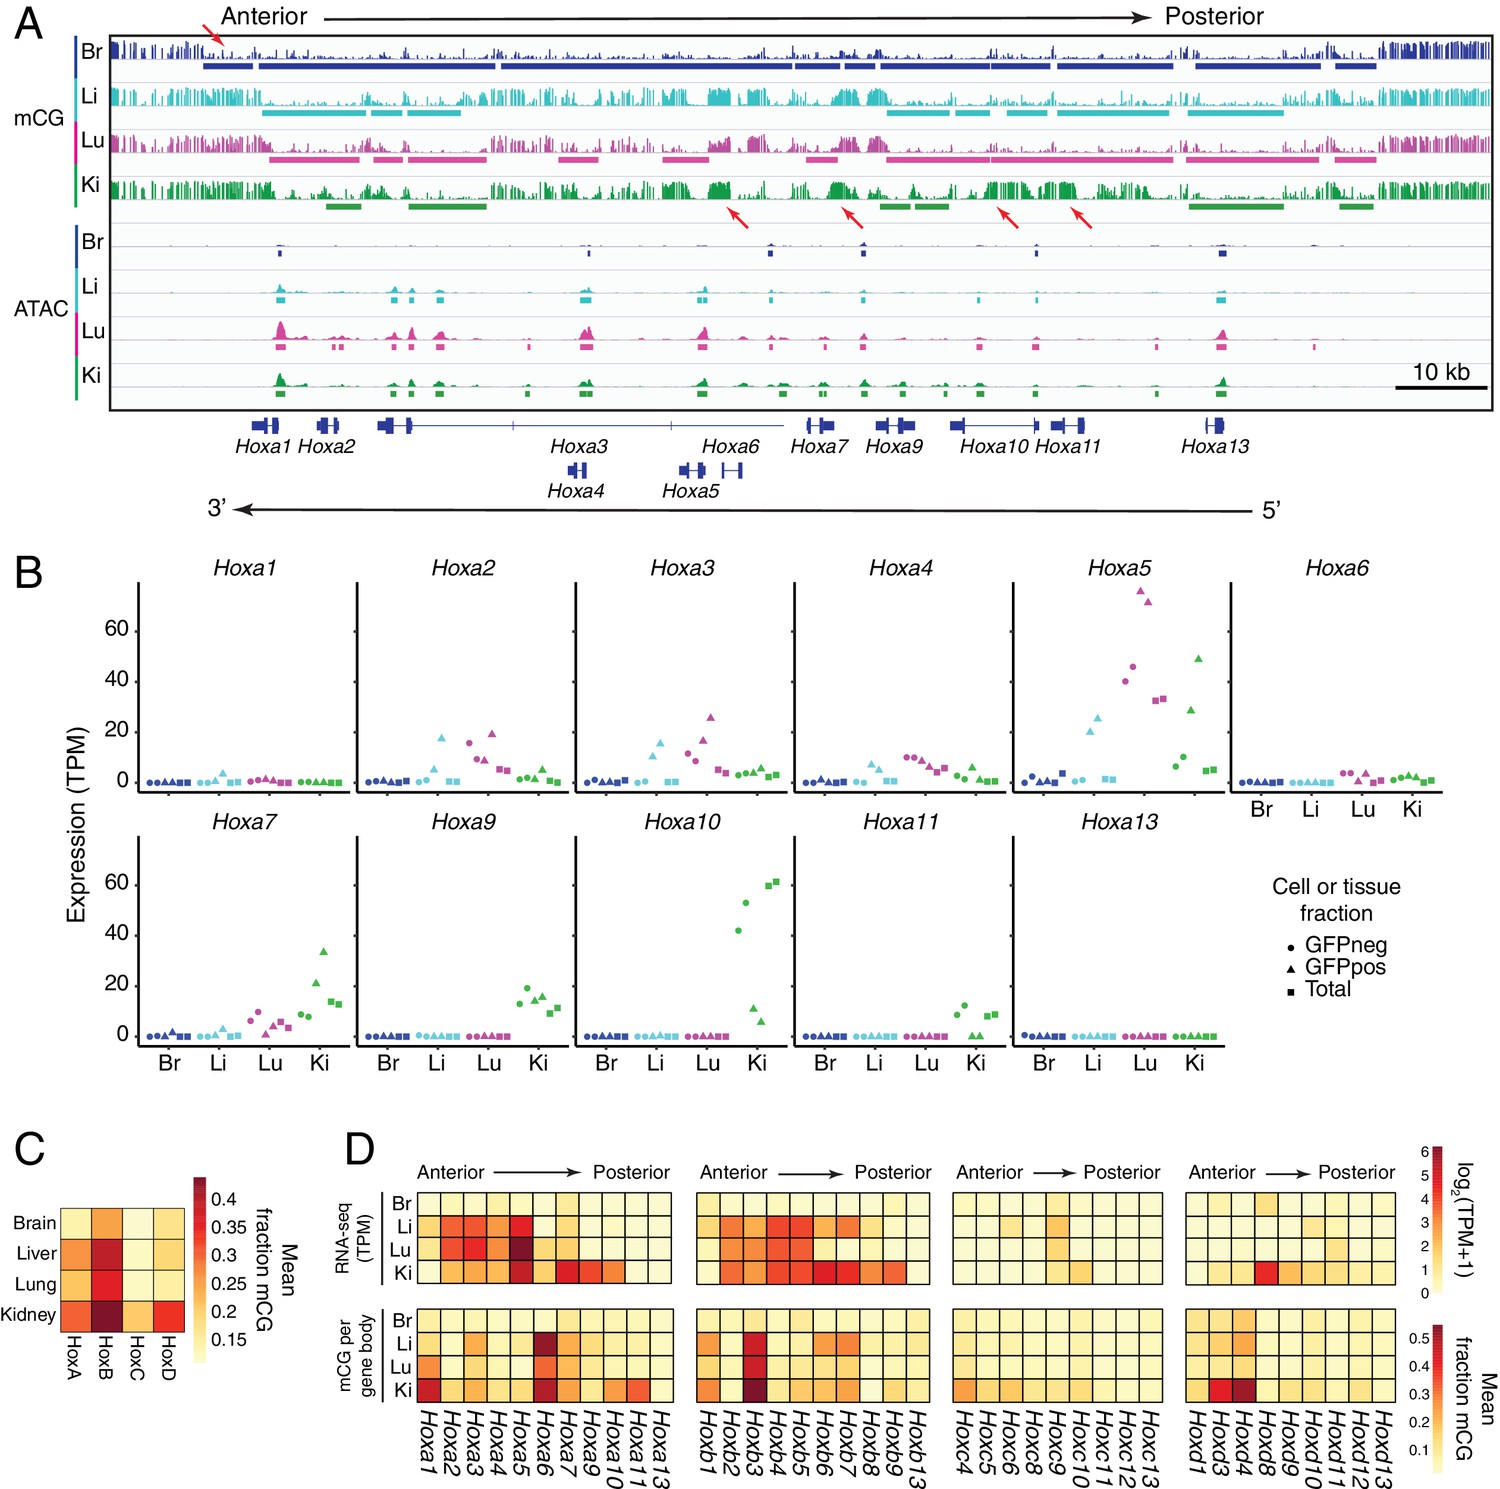
(A) Genome browser image showing CG methylation (top) and accessible chromatin (bottom) at the HOX-A gene cluster. HOX genes in this cluster are expressed in an anterior-posterior gradient corresponding to their position in the cluster, with genes near the 3’ end of the cluster expressed more anteriorly and genes near the 5’ end expressed more posteriorly. The degree of EC methylation is: brain <liver ~ lung<kidney. The degree of EC accessible chromatin is: brain <liver < lung~kidney. Colored bars indicate DMVs or ATAC-seq peaks. Red arrows pointing down indicate illustrative examples of differential hypomethylation. Red arrows pointing up indicate illustrative examples of differential hypermethylation. (B) Expression levels (TPMs) based on RNA-seq for each gene in the HOX-A cluster. (C) Heatmap depicting mean fraction of methylated CG across each HOX cluster for each EC subtype. (D) Heatmaps depicting log2(TPM +1) or mean fraction of methylated CG in the gene body for genes within each of the four HOX clusters.
Figure 3—figure supplement 1
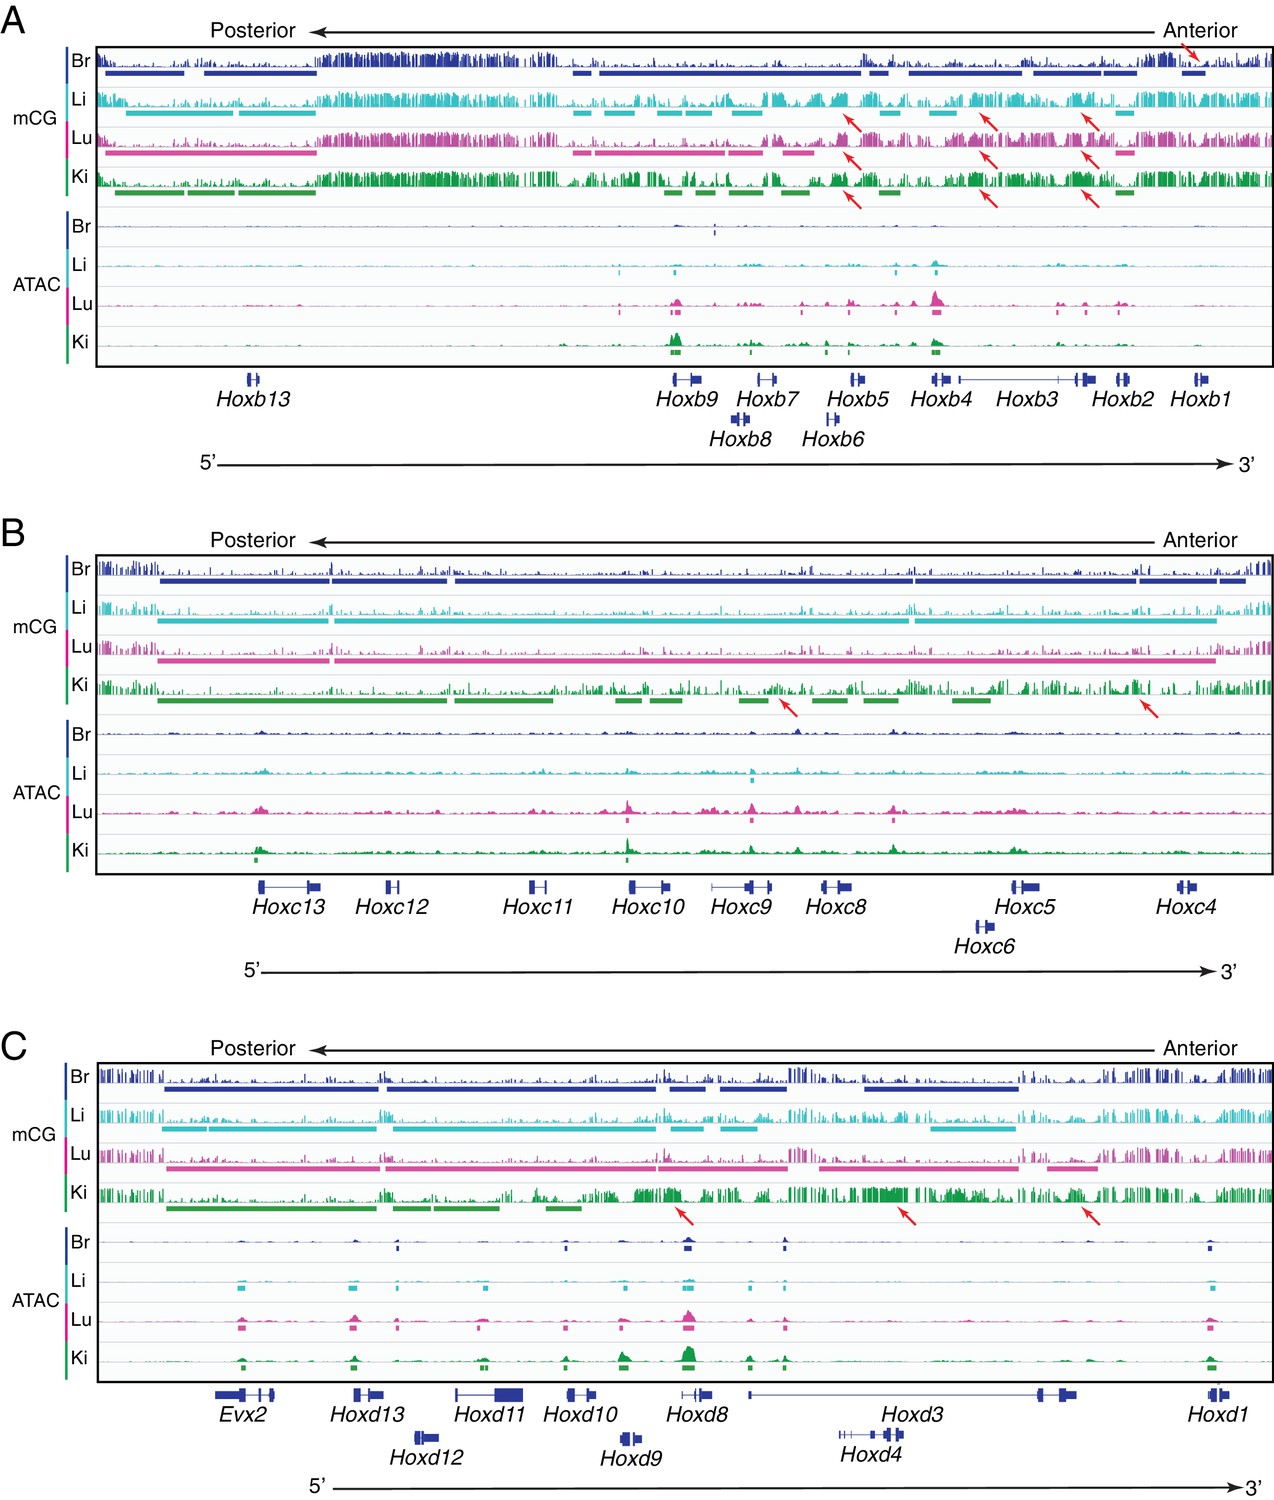
Methylation patterns and accessible chromatin at HOX-B, HOX-C, and HOX-D clusters in ECs.
Genome browser images showing CG methylation (top) and accessible chromatin (bottom) at the (A) HOX-B gene cluster, the (B) HOX-C gene cluster, and the (C) HOX-D gene cluster. HOX genes in each cluster are expressed in an anterior-posterior gradient corresponding to their position in the cluster, with genes near the 3’ end of the cluster expressed more anteriorly and genes near the 5’ end expressed more posteriorly. Colored bars indicate DMVs or ATAC-seq peaks. Red arrows pointing down indicate illustrative examples of differential hypomethylation. Red arrows pointing up indicate illustrative examples of differential hypermethylation.
Figure 4 with 4 supplements
Accessible chromatin and hypomethylated regions reveal candidate EC regulatory elements.
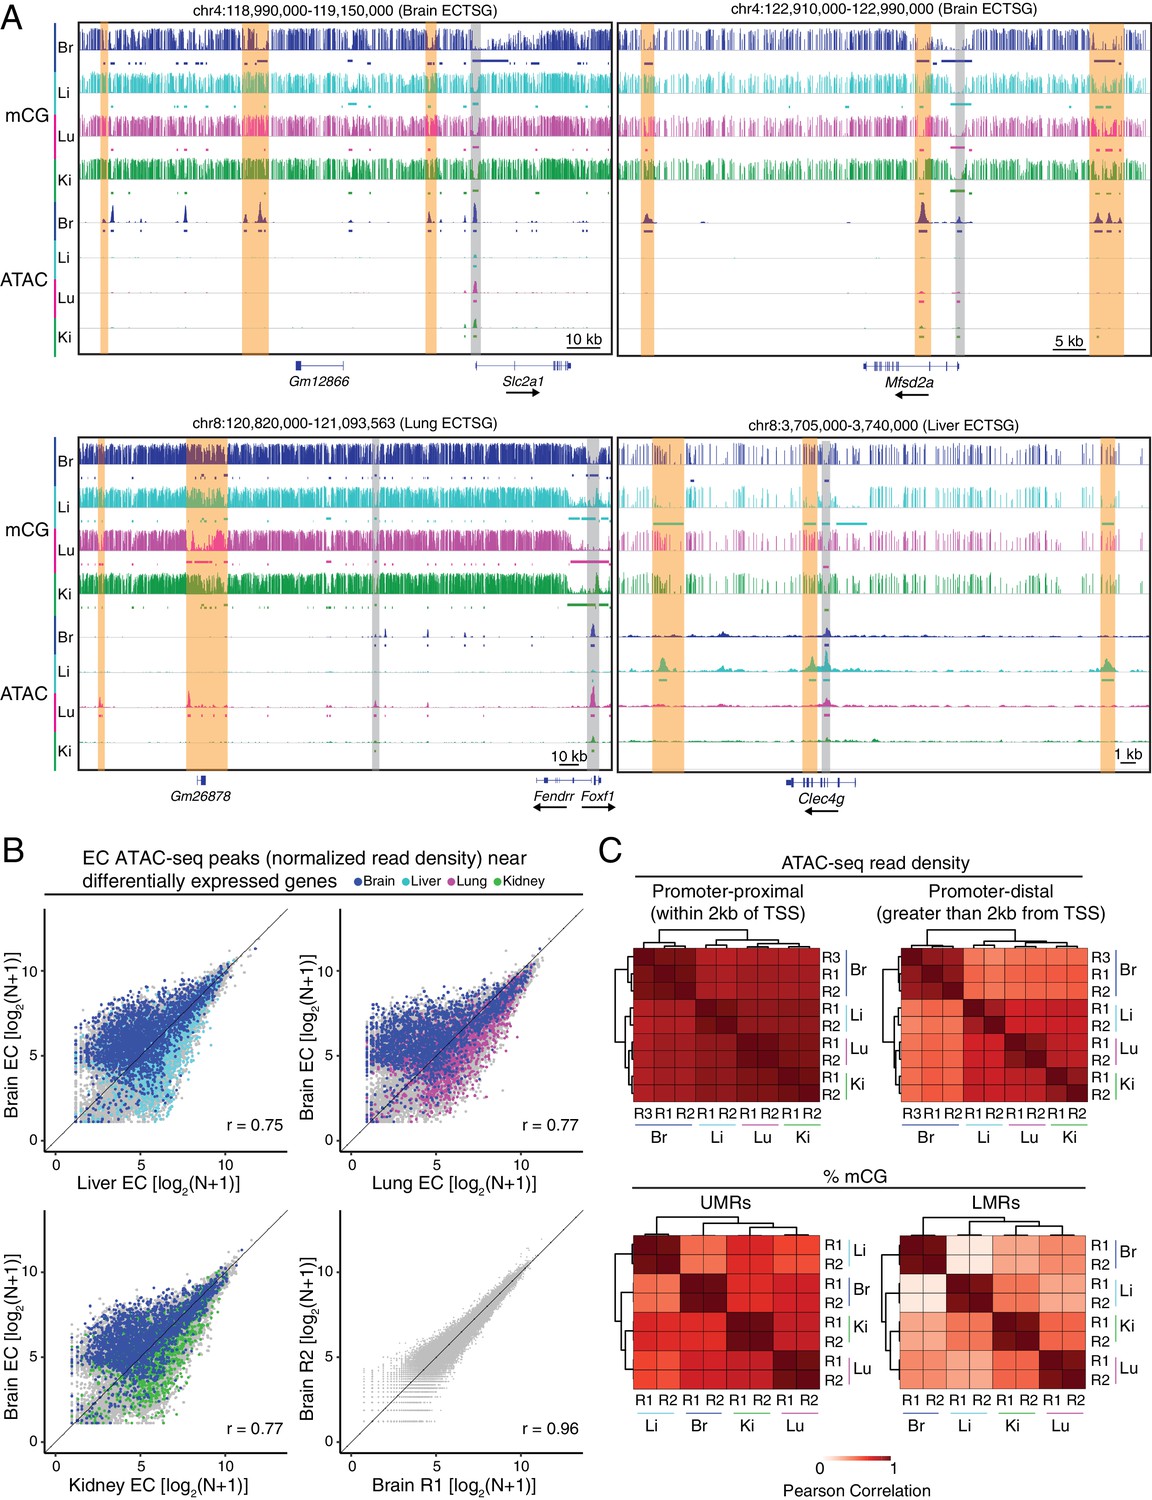
(A) Genome browser images showing CG methylation (top) and accessible chromatin (bottom) around ECTSGs. Colored bars under mCG tracks mark UMRs (upper row) and LMRs (lower row). For accessible chromatin, histograms of ATAC-seq reads are shown. Colored bars under ATAC tracks indicate the called ATAC-seq peaks. Vertical orange bars highlight co-localizing cell-type-specific open chromatin and differentially hypomethylated DNA. Vertical gray bars highlight shared regions of open chromatin in at least three EC subtypes. The ATAC-seq reads shown here represent the full range of ATAC-seq fragment sizes. (B) Scatter plots of normalized ATAC-seq read density (N) within ATAC-seq peaks called from <100 bp fragments. Values shown are log2(N + 1). Colored symbols correspond to peaks for which the closest annotated TSS is a differentially expressed EC-enriched gene from the indicated tissue. Lower right, comparison between two brain EC ATAC-seq biological replicates. (C) Pairwise Pearson correlation heatmaps for ATAC-seq read density within ATAC-seq peaks at promoter-proximal (<2 kb from TSS; upper left) or promoter-distal (>2 kb from TSS; upper right) and percent CG methylation in UMRs (lower left) and LMRs (lower right).
Figure 4—figure supplement 1
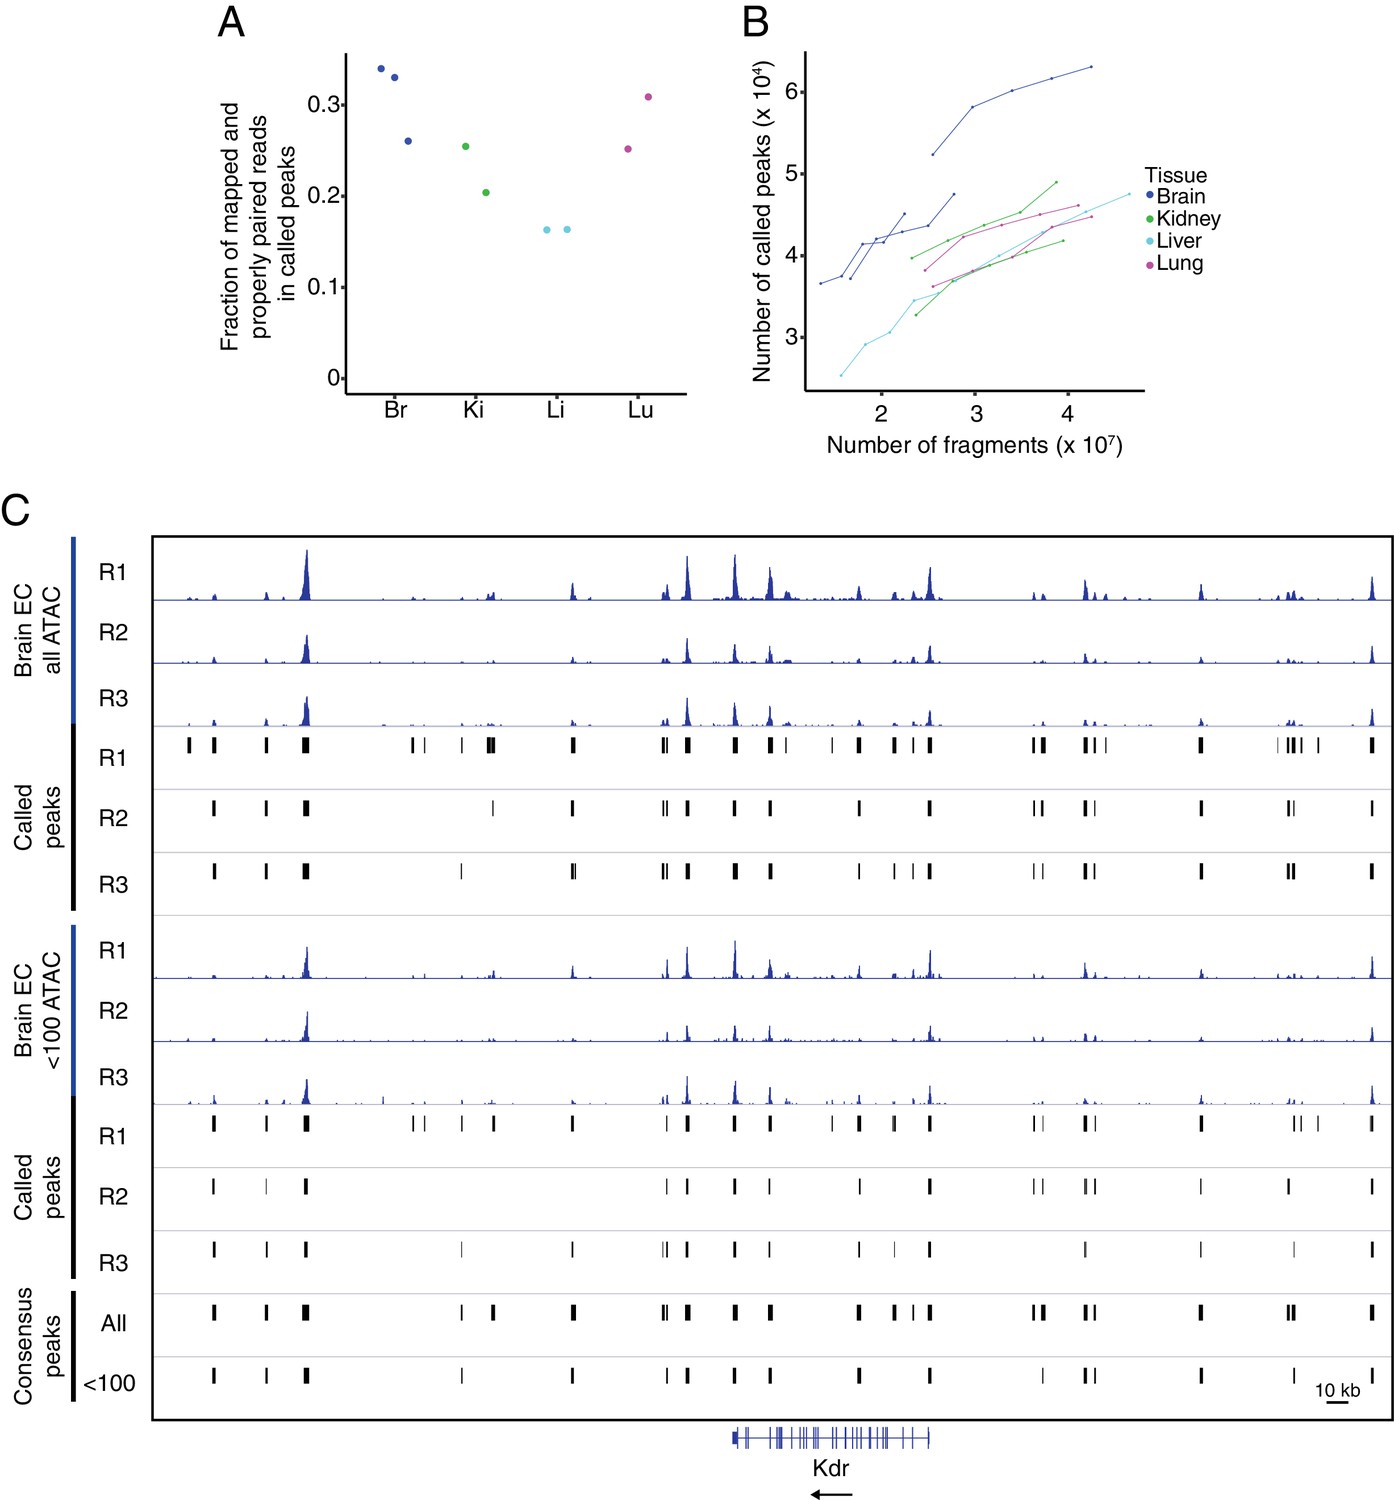
Quality control for ATAC-seq.
(A) The fraction of mapped and properly paired reads within called peaks for each ATAC-seq replicate. (B) Peak saturation analysis for each ATAC-seq replicate. From the total number of mapped and properly paired reads, the indicated number was subsampled from each replicate and peaks were called on each subset using the standard peak calling parameters. The plot shows the number of called peaks as a function of the absolute number of fragments. (C) Genome browser image of accessible chromatin for the three brain EC replicates. Top six tracks show histograms of all ATAC-seq fragments along with the corresponding called peaks. The next six tracks show histograms using <100 bp ATAC-seq fragments along with the corresponding called peaks. The bottom two tracks show consensus called peaks using the full range of ATAC-seq fragment lengths or <100 bp ATAC-seq fragments.
Figure 4—figure supplement 2
EC subtype differences in distal epigenetic features.
(A) Expression levels (TPMs) based on RNA-seq for the genes shown in Figure 4A. (B) Heatmap depicting the percent of <100 bp ATAC-seq peaks (APs) that overlap between EC subtypes. Many of the regions of accessible chromatin overlap more than one EC subtype. ‘All APs’ refers to all ATAC-seq peaks identified in the indicated sample. ‘All differential APs’ refers to differential ATAC-seq peaks identified in the indicated sample versus any of the other three EC subtypes. ‘ECTSAPs’ refers to ATAC-seq peaks present in the indicated EC subtype but absent from the other three EC subtypes. (C) Heatmap depicting the percentage of each epigenetic feature (rows) that is found within 100 kb of ECTSGs. Tissue-specific EC candidate CREs are significantly enriched within 100 kb of ECTSGs from the same EC subtype relative to the other EC subtypes. Black stars indicate statistical significance at q < 1×10⁻⁵. ‘All hypo-DMRs’ refers to hypomethylated DMRs identified in the indicated sample versus any of the other three EC subtypes. ‘ECTS-hypo-DMRs’ refers to hypomethylated DMRs identified in the indicated samples versus all of the other three EC subtypes. (D) Heatmap depicting the percentage of either promoter-proximal or promoter-distal ATAC-seq peaks (APs) that overlap between EC subtypes. EC subtypes share more regions of accessible chromatin associated with promoters than regions of accessible chromatin that are distal to TSSs. (E) Pairwise Pearson correlation heatmaps for ATAC-seq read density at UMRs and LMRs (left pair) and percent CG methylation in promoter-proximal (<2 kb from TSS; right pair, left panel) or promoter-distal (>2 kb from TSS; right pair, right panel) ATAC-seq peaks.
Figure 4—figure supplement 3
Differentially accessible chromatin between peripheral ECs.
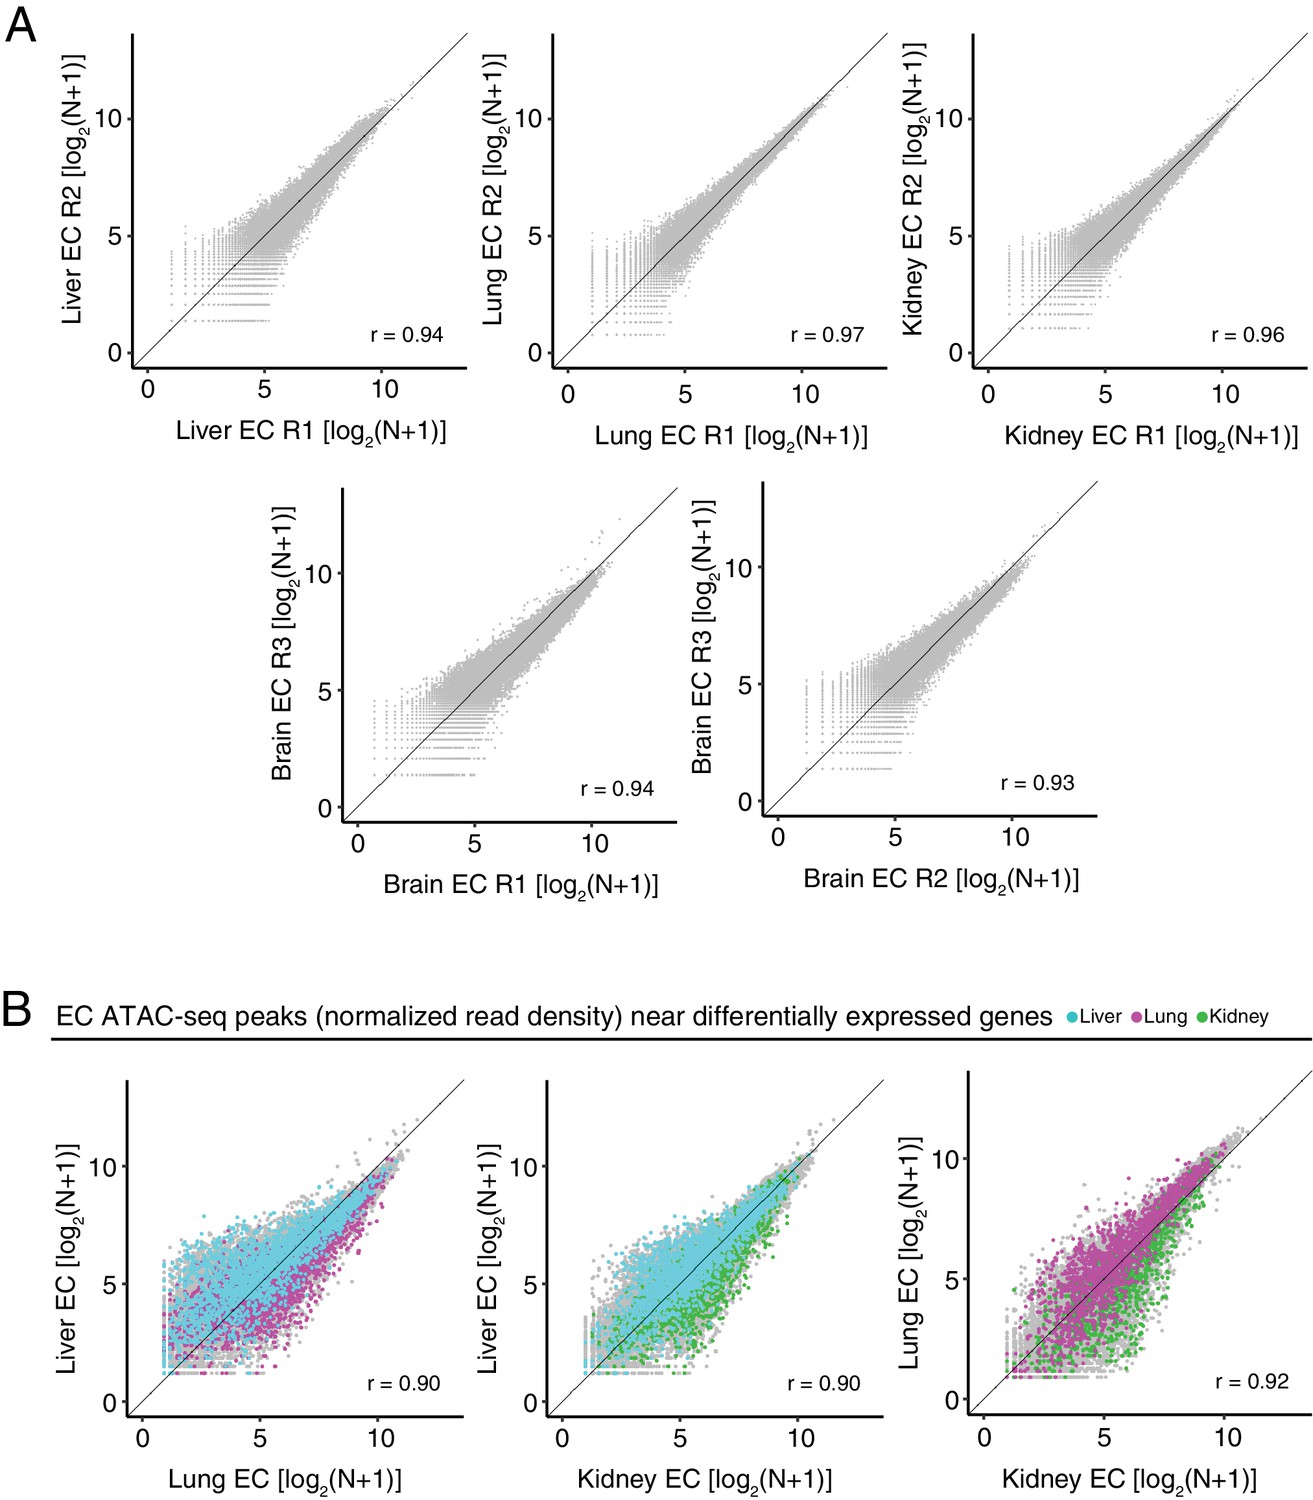
(A) Scatter plots of normalized ATAC-seq read density (N) within ATAC-seq peaks called from <100 bp fragments between biological replicates. (B) Scatter plots of normalized ATAC-seq read density (N) within ATAC-seq peaks called from <100 bp fragments for liver ECs versus lung ECs, liver ECs versus kidney ECs, and lung ECs versus kidney ECs. Colored symbols correspond to peaks for which the closest annotated TSS is a differentially expressed EC-enriched gene from the indicated EC subtype. Values shown are log2(N + 1).
Figure 4—figure supplement 4
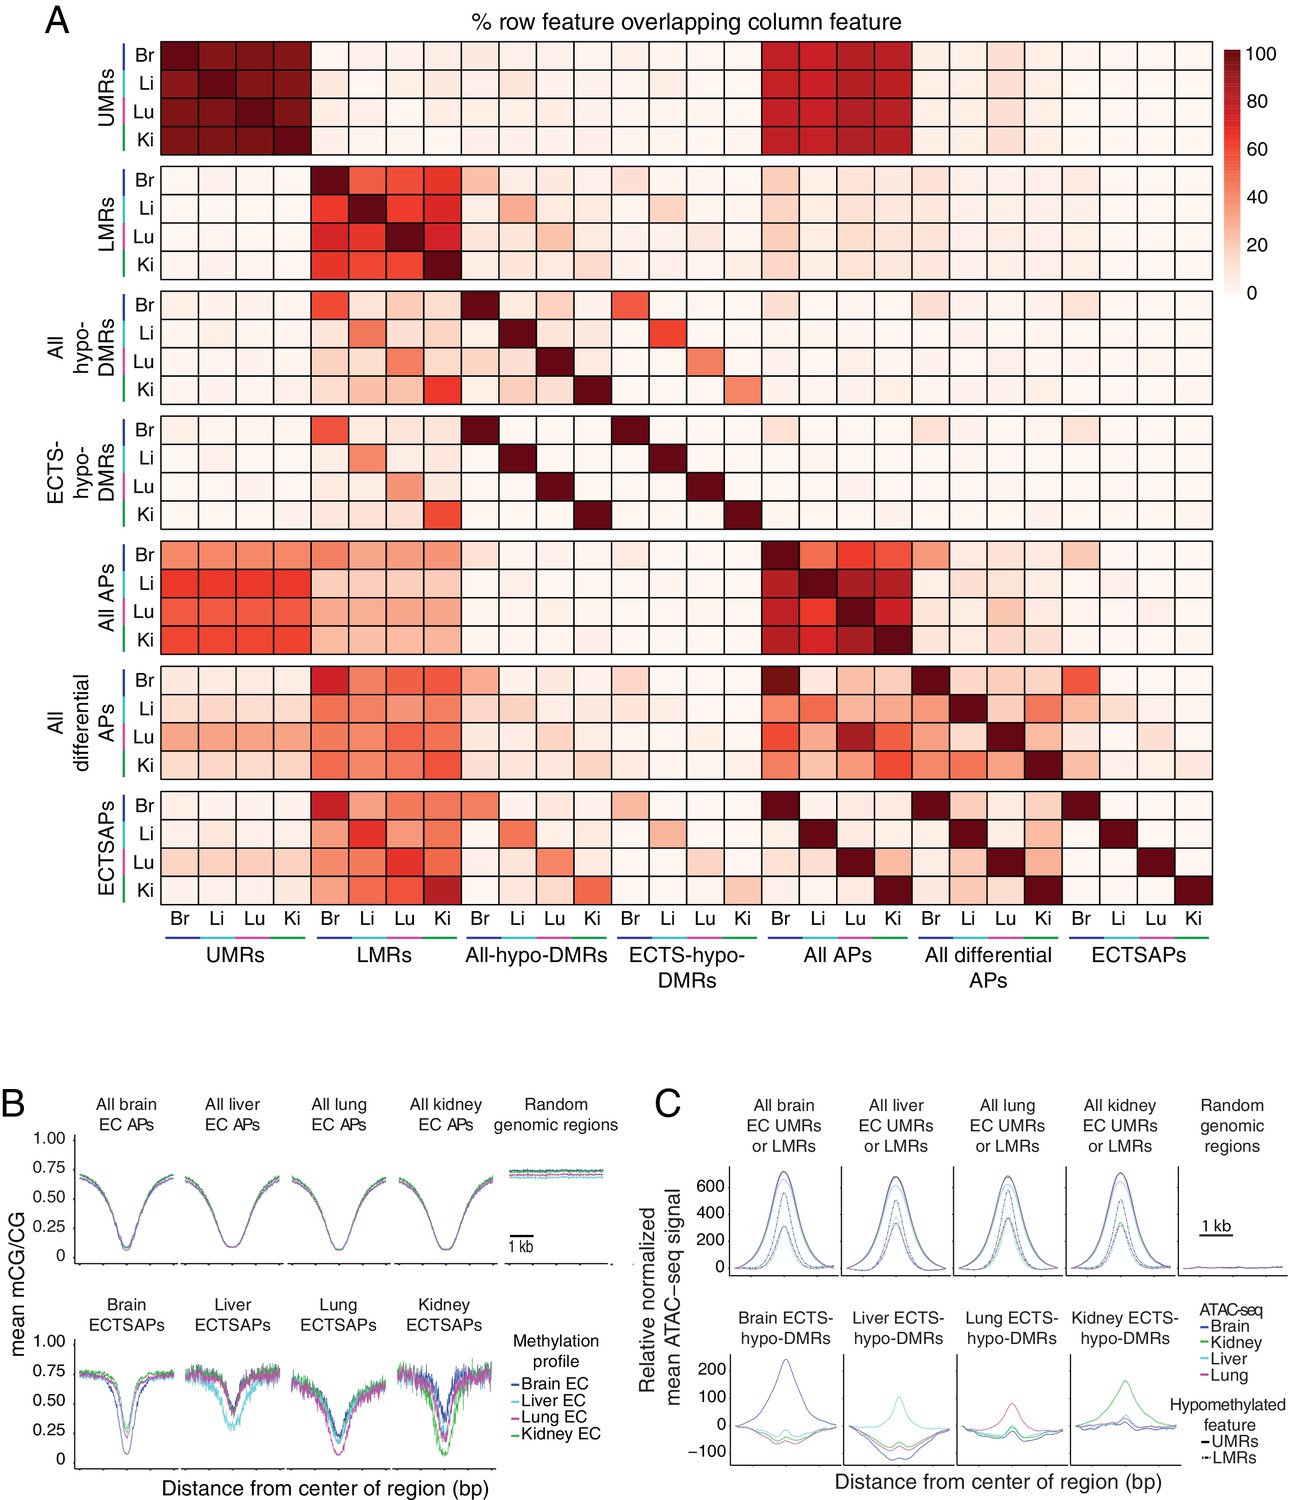
Relationship between accessible and hypomethylated regions of the EC genome.
(A) Heatmap depicting the percentage of various epigenetic features that overlap between EC subtypes. More UMRs are shared between EC subtypes than LMRs. A larger fraction of UMRs are accessible compared to LMRs. ~ 50% of ATAC-seq peaks (APs) overlap either a UMR or an LMR. Differential ATAC-seq peaks exhibit a higher overlap with LMRs compared to UMRs. (B) Line plots showing lower mean methylation at ATAC-seq peaks (APs) compared to random size-matched genomic regions. (C) Line plots showing higher upper quartile normalized mean ATAC-seq signal at UMRs, LMRs, and ECTS-hypo-DMRs compared to random-size matched genomic regions. Each line has been translated vertically so that the value at position −1500 bp is 0.
Figure 5 with 2 supplements
Motif enrichment analysis identifies candidate TF regulators of tissue-specific EC development and function.
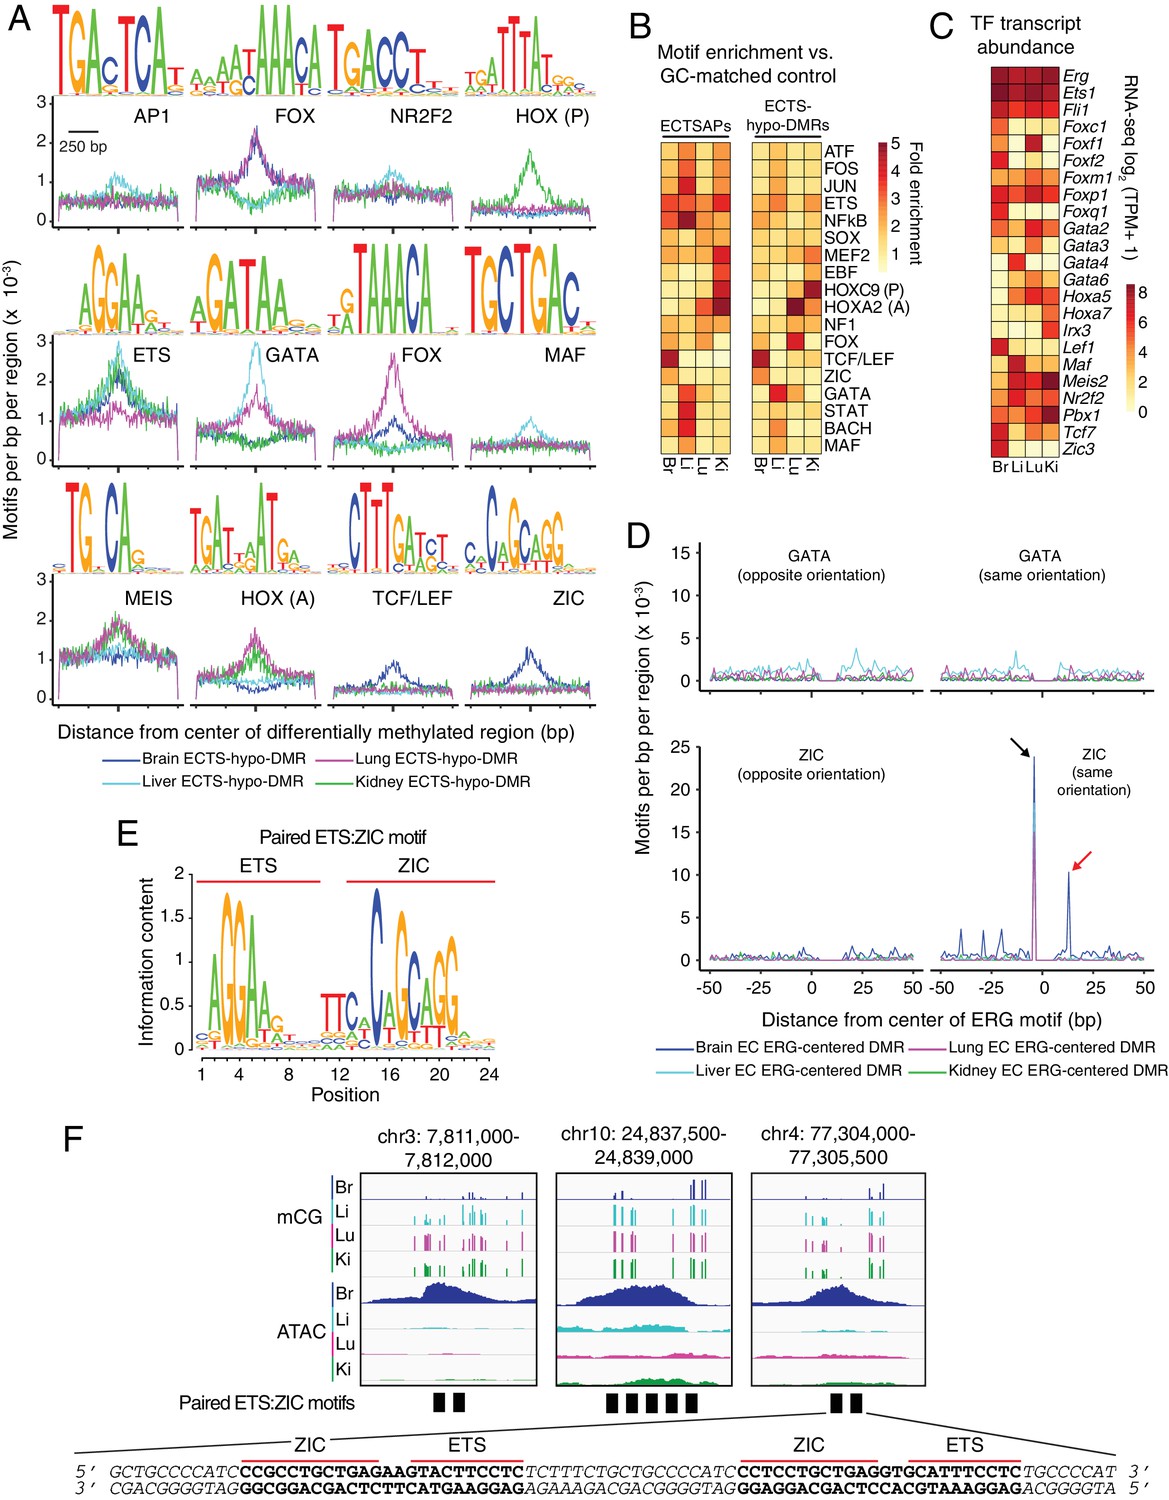
(A) HOMER-identified enriched motifs in ECTS-hypo-DMRs. Frequency of the indicated motif as a function of distance from the center of ECTS-hypo-DMRs. Shown above each individual plot is the position weight matrix (PWM) of the enriched nucleotide sequence. The TF family that most closely matches the motif is indicated below the PWM. (B) Heatmap showing the fold enrichment for the indicated TF motifs (% ECTSAPs or ECTS-hypo-DMRs containing the motif divided by % GC-matched background genomic regions containing the motif). Representative members of TF families that exhibited a significant enrichment (FDR < 0.001) are shown. (C) Heatmap showing TPMs for the four EC subtypes for a subset of TFs with the motifs shown in (A). Values shown are log2(TPM +1). (D) ECTS-hypo-DMRs were centered on the motif for ERG, a member of the ETS family, and the frequencies of the indicated motifs were plotted as a function of distance from the ERG motif with a bin size of 1 bp. Black arrow: the ZIC motif ends with the sequence AGG and the ERG motif begins with the sequence AGG, thereby generating a frequency spike in all four EC subtypes at position −5 bp that represents the overlap of the two sites. Red arrow: the frequency spike for the ZIC motif at +11 bp is only present in one orientation and only in brain ECTS-hypo-DMRs centered on the ERG motif. (E) PWM for the consensus sequence of the paired ETS:ZIC motif. (F) Representative instances of the paired ETS:ZIC motif from brain ECTS-hypo-DMRs. Each instance is represented by a black rectangle. The bottom strand of the sequence in (F) matches the consensus sequence shown in (E).
Figure 5—figure supplement 1

Candidate TF regulators of EC gene expression.
(A) HOMER-identified enriched motifs in EC-only LMRs and ATAC-seq peaks shared between all four EC subtypes. Frequency of the indicated motif as a function of distance from the center of these LMRs (top) or these ATAC-seq peaks (APs) (bottom). Shown above each individual plot is the position weight matrix (PWM) of the enriched nucleotide sequence. The TF family that most closely matches the motif is indicated below the PWM. (B) Heatmap depicting the percentage of ECTS-hypo-DMRs within 100 kb of ECTSGs that contain the indicated motif. Motifs that are enriched in ECTS-hypo-DMRs (Figure 5A) are also enriched in ECTS-hypo-DMRs within 100 kb of ECTSGs. Black stars indicate statistical significance at p<1×10⁻⁵. (C) Heatmap depicting the percentage of ECTSAPs within 100 kb of ECTSGs that contain the indicated motif. Black stars indicate statistical significance at p<1×10⁻⁵. (D) ECTS-hypo-DMRs were centered on the motif for ERG, a member of the ETS family, and the frequencies of the indicated motifs were plotted as a function of distance from the ERG motif with a bin size of 1 bp. Red arrows: frequency spikes for FOX and HOX motifs are only seen in ECTS-hypo-DMRs centered on the ERG motif in lung ECs and kidney ECs, respectively. Black arrows: the sequence AGG in the TCF/LEF and ERG motifs overlap, thereby generating a frequency spike in all four EC subtypes. (E) Heatmap depicting the percentage of ECTS-hypo-DMRs or ECTSAPs that contain the paired ETS:ZIC motif. Brain EC candidate CREs show the greatest enrichment for the paired ETS:ZIC motif relative to the other three EC subtypes. Black stars indicate statistical significance at p<1×10⁻⁵.
Figure 5—figure supplement 2
TF binding motifs in candidate CREs near ECTSGs.
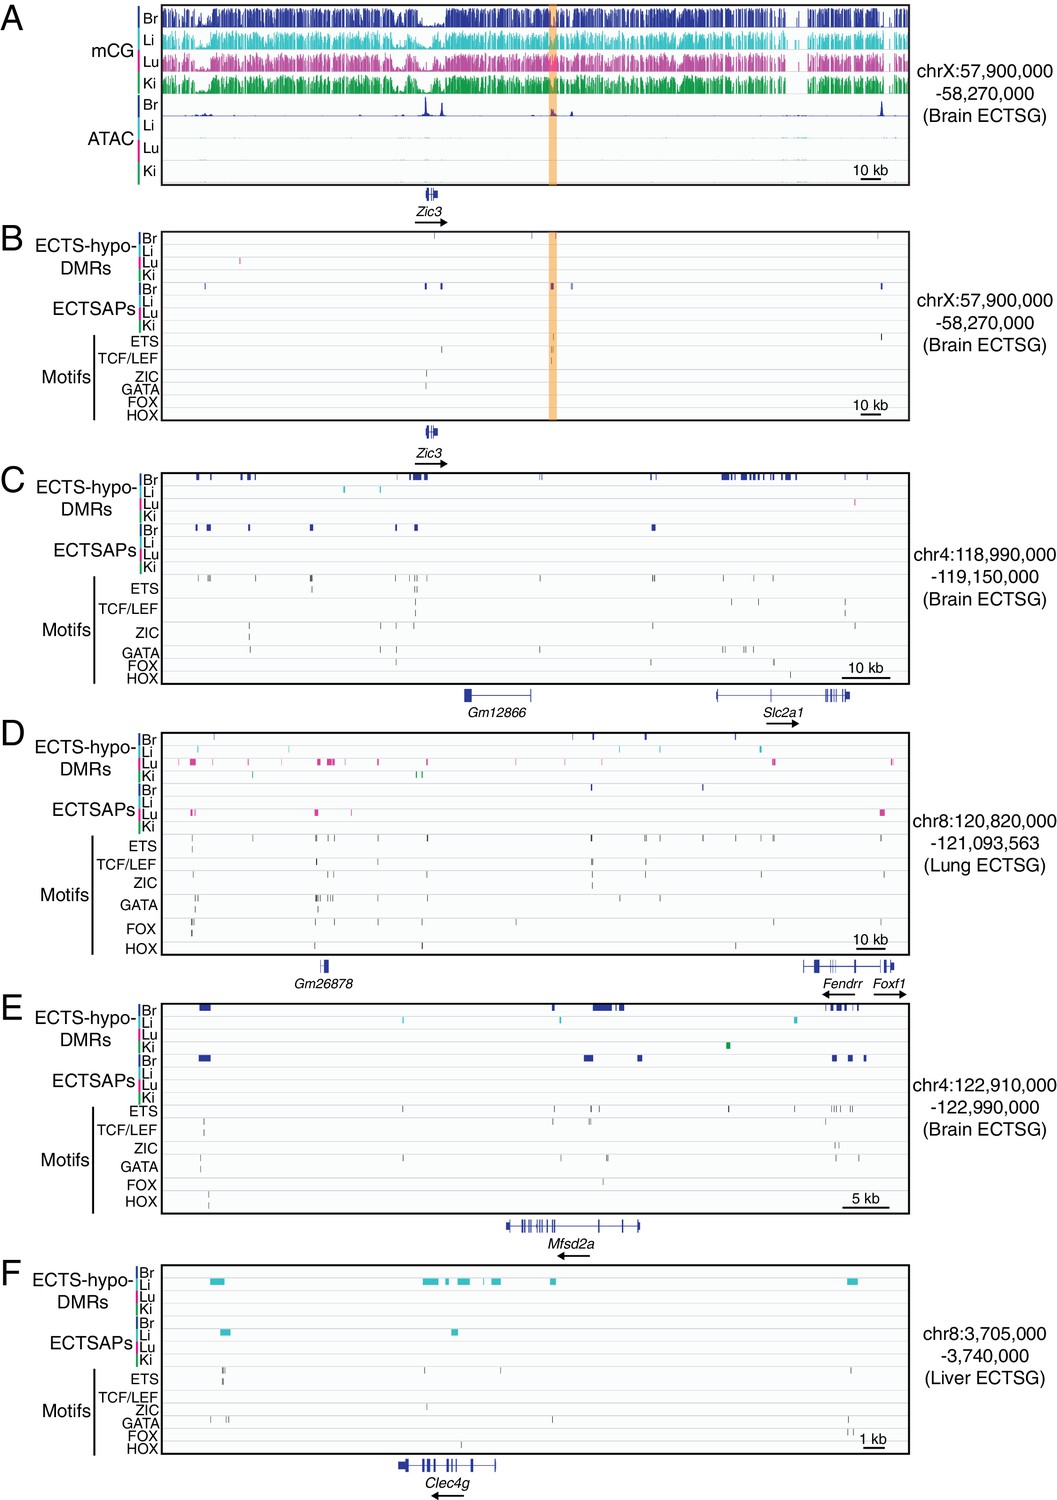
(A) Genome browser images showing CG methylation (top) and accessible chromatin (bottom) around Zic3, a brain EC-specific TF. (B–F) Genome browser images showing (from top to bottom): ECTS-hypo-DMRs (colored bars; four tracks), ECTSAPs (colored bars; four tracks), and locations of six TF motifs in the regions encompassed by ECTS-hypo-DMRs or ECTSAPs (thin vertical black lines). The genomic region in (B) corresponds to the region shown in (A), and the genomic regions in (C–F) correspond to the regions shown in Figure 4A. The patterns of EC expression are: (A,B) Zic3 – brain ECs; (C) Slc2a1 – brain ECs; (D) Foxf1 - lung and brain ECs; Fendrr – lung ECs; (E) Msfd2a – brain ECs; and (F) Clec4g – liver ECs.
Figure 6 with 2 supplements
Canonical Wnt signaling in CNS but not peripheral ECs at E13.5.
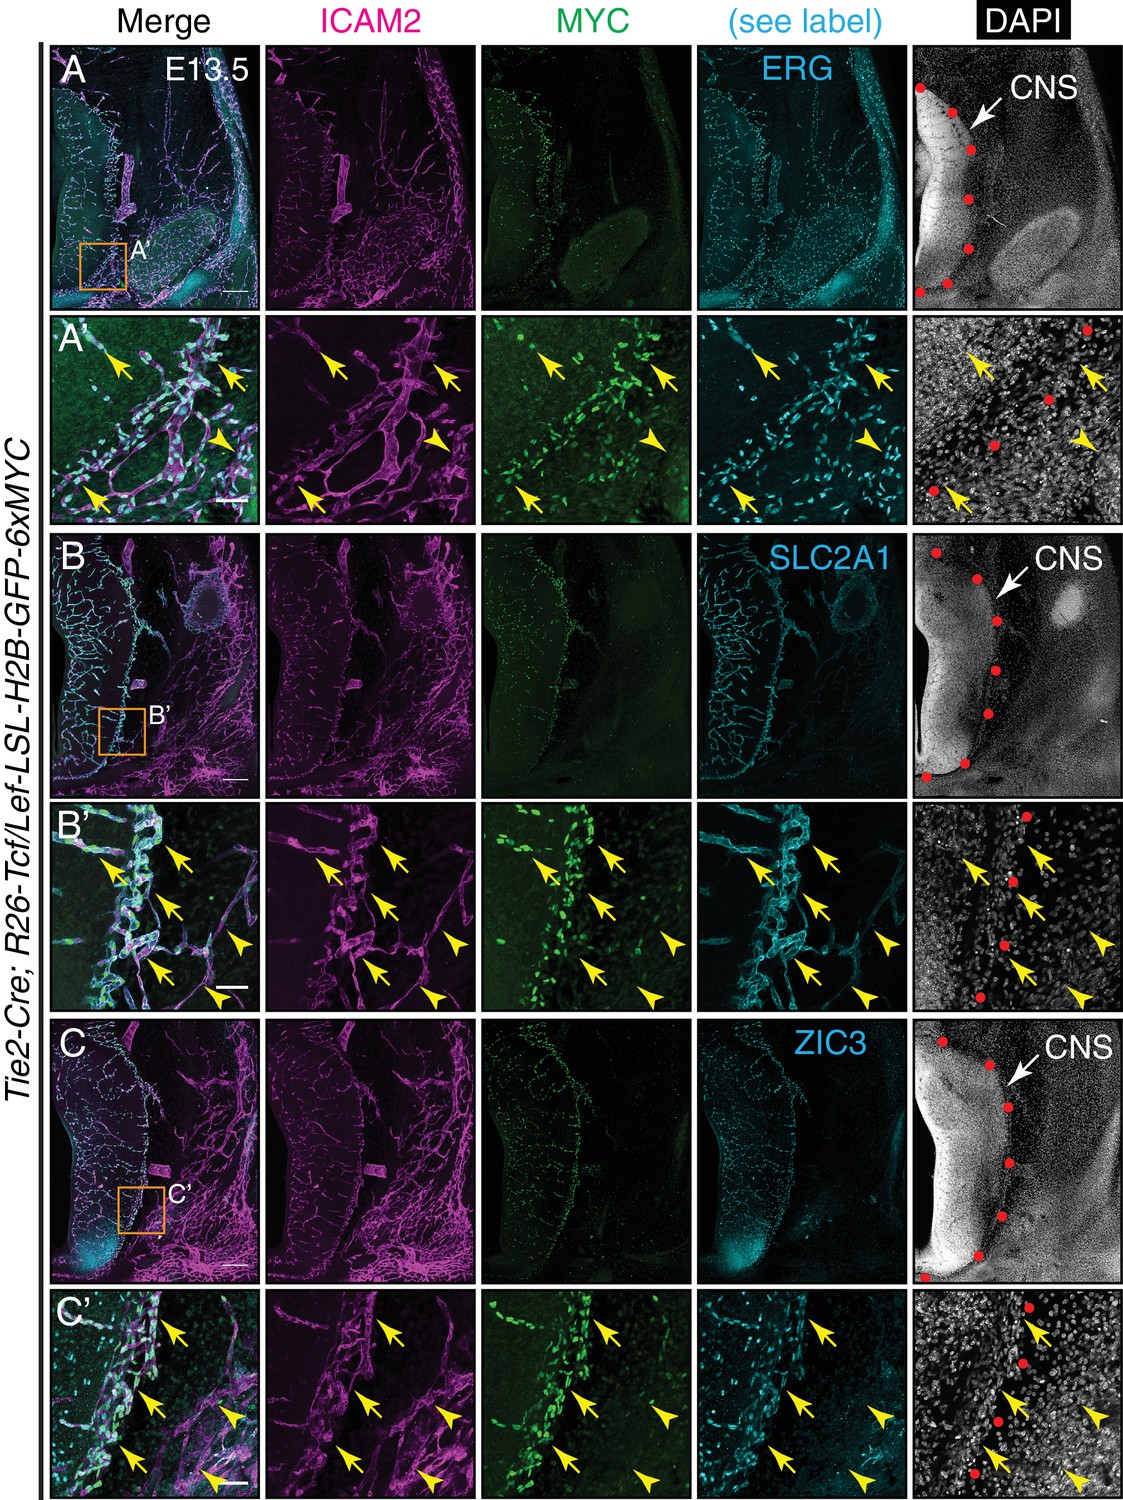
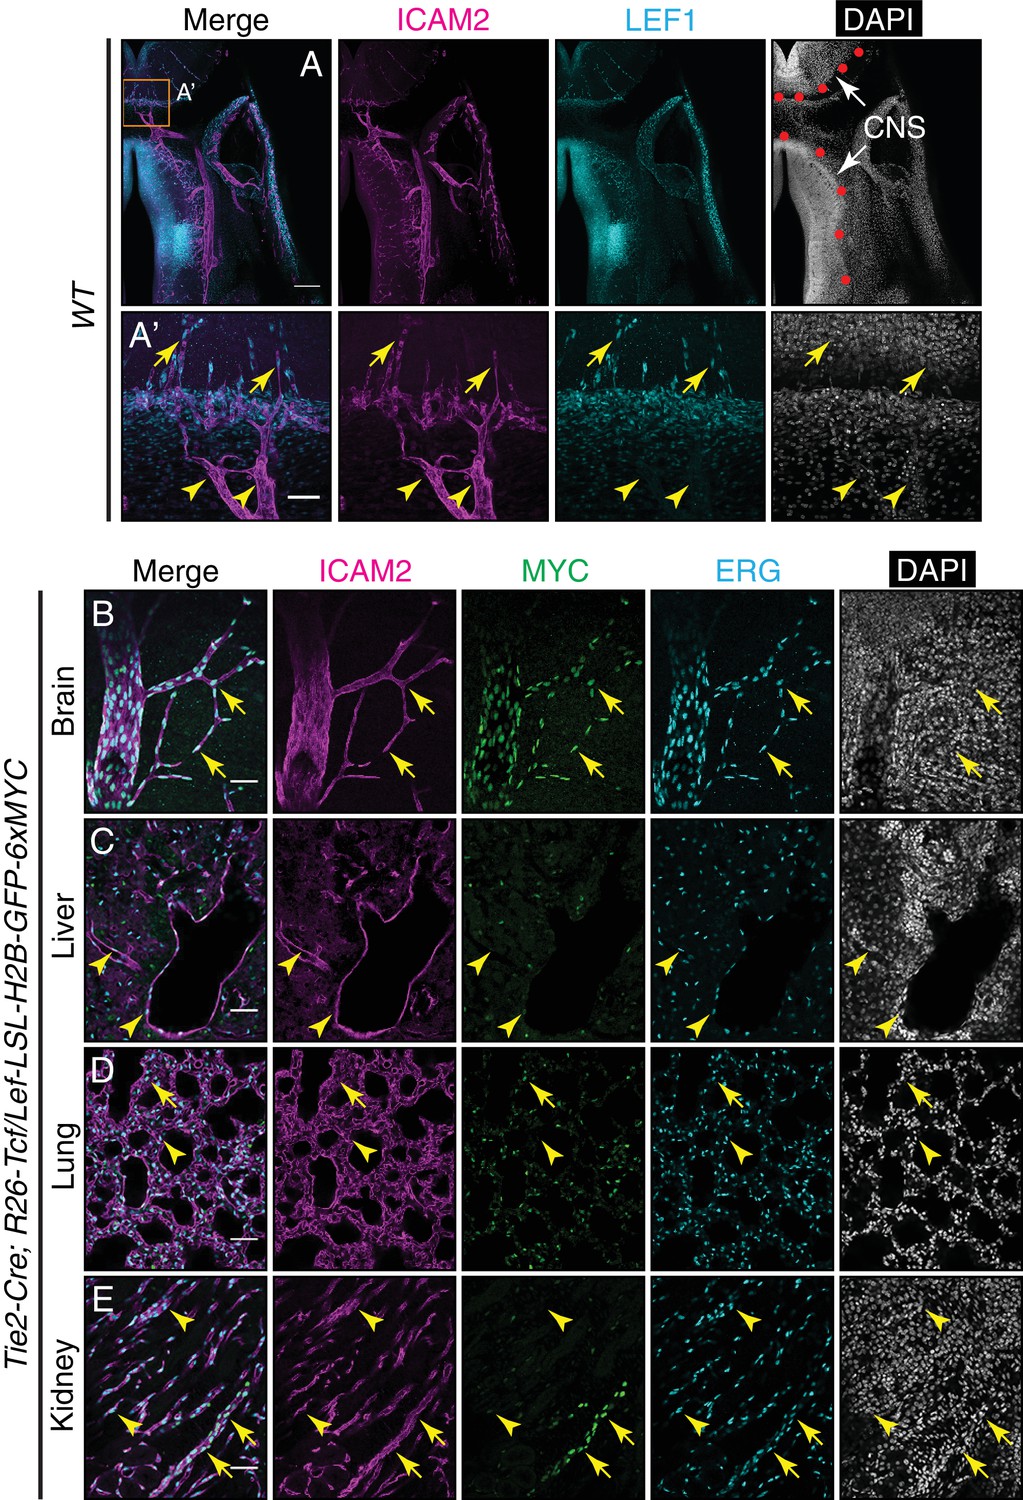
(A–C) Coronal sections of E13.5 Tie2-Cre;R26-Tcf/Lef-LSL-H2B-GFP-6xMYC embryos near the cephalic flexure. The markers are: ICAM2 (pan-EC membrane protein), MYC (the canonical Wnt reporter), ERG (pan-EC TF), SLC2A1 (the glucose transporter GLUT1; a BBB marker), ZIC3, and DAPI. (A’–C’) Higher magnification of the boxed regions in (A–C). The boundary between CNS and peripheral tissue is marked on the DAPI image with red circles. The nuclear MYC signal reveals canonical Wnt signaling in CNS ECs (yellow arrows) but not in peripheral ECs (yellow arrowheads). ZIC3 is present in CNS ECs (yellow arrows) but not in peripheral ECs (yellow arrowheads), and in developing neurons in the ventral CNS. Scale bars in A, B, and C: 200 um. Scale bars in A’, B’, and C’: 50 um.
Figure 6—figure supplement 1
Quantification of immunostaining in Figure 6.
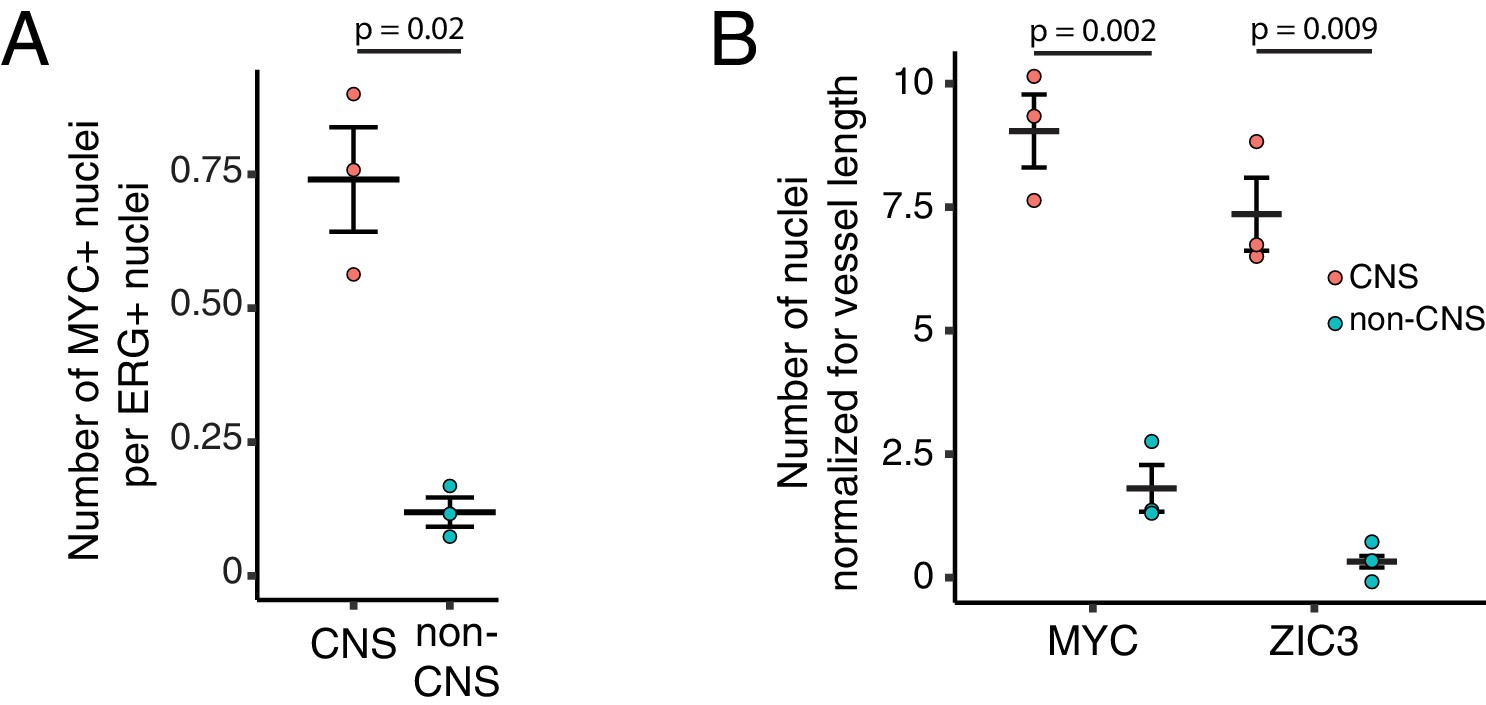
(A) Quantification of Figure 6A. The values shown are the ratio of MYC +nuclei (i.e. Wnt reporter+) to ERG + nuclei. (B) Quantification of Figure 6C. The values shown are the number of either MYC +or ZIC3 +nuclei normalized for vessel length. For (A) and (B), each dot represents the quantification of a region (410 um high x 355 um wide) from the image shown in either Figure 6A or Figure 6C, within the CNS or outside of the CNS (i.e. non-CNS). For each plot, standard error of the mean is shown. p-Values are calculated with Student’s t-test.
Figure 6—figure supplement 2
LEF1 in ECs in the E13.5 CNS, and canonical Wnt signaling in the P7 brain, liver, lung, and kidney.
(A) Coronal sections of E13.5 Tie2-Cre;R26-Tcf/Lef-LSL-H2B-GFP-6xMYC embryos near the cephalic flexure, immunostained for the indicated markers: ICAM2, MYC, LEF1, and DAPI. (A’) Higher magnification of the boxed region in (A). The boundary between CNS and peripheral tissues is marked on the DAPI image with red circles. The nuclear MYC signal reveals canonical Wnt signaling in CNS ECs (yellow arrows) but not in peripheral ECs (yellow arrowheads). LEF1 is present in CNS ECs (yellow arrows) but not in peripheral ECs (yellow arrowheads). LEF1 is also present in developing neurons in the ventral CNS. Scale bar in A: 200 um. Scale bar in A’: 50 um. (B–E) Sections of P7 Tie2-Cre;R26-Tcf/Lef-LSL-H2B-GFP-6xMYC brain (B), liver (C), lung (D), and kidney (E). Immunostaining as in Figure 6. The nuclear MYC signal reveals canonical Wnt signaling uniformly in CNS ECs and in a subset of renal vessels (yellow arrows). LEF1 levels are below the limit of detection in all or nearly all ECs in liver and lung and in the majority of ECs in the kidney. The sparse MYC-positive nuclei in liver and lung correspond to non-ECs, most likely tissue macrophages, based on the specificity of the Tie2-Cre transgene (yellow arrowheads). Scale bar in (B–E): 50 um.
Figure 7 with 1 supplement

Single-cell RNA-seq of P7 brain ECs reveals intra-tissue heterogeneity.
(A) t-SNE plot of 3946 P7 brain ECs showing six clusters corresponding to tip cells, and mitotic, venous, capillary-venous (Capillary-V), capillary-arterial (Capillary-A), and arterial ECs. (B) The t-SNE plot from (A) showing expression of three marker genes with enriched expression for each EC cluster. Cells with no RNA-seq reads are shown in light blue; darker blue represents greater number of reads. (C) Heatmap showing scaled expression (z-scores) for the 25 most enriched marker genes for each EC cluster. Supplementary file 8 lists the genes plotted in (C). Rows represent genes and columns represent cells.
Figure 7—figure supplement 1
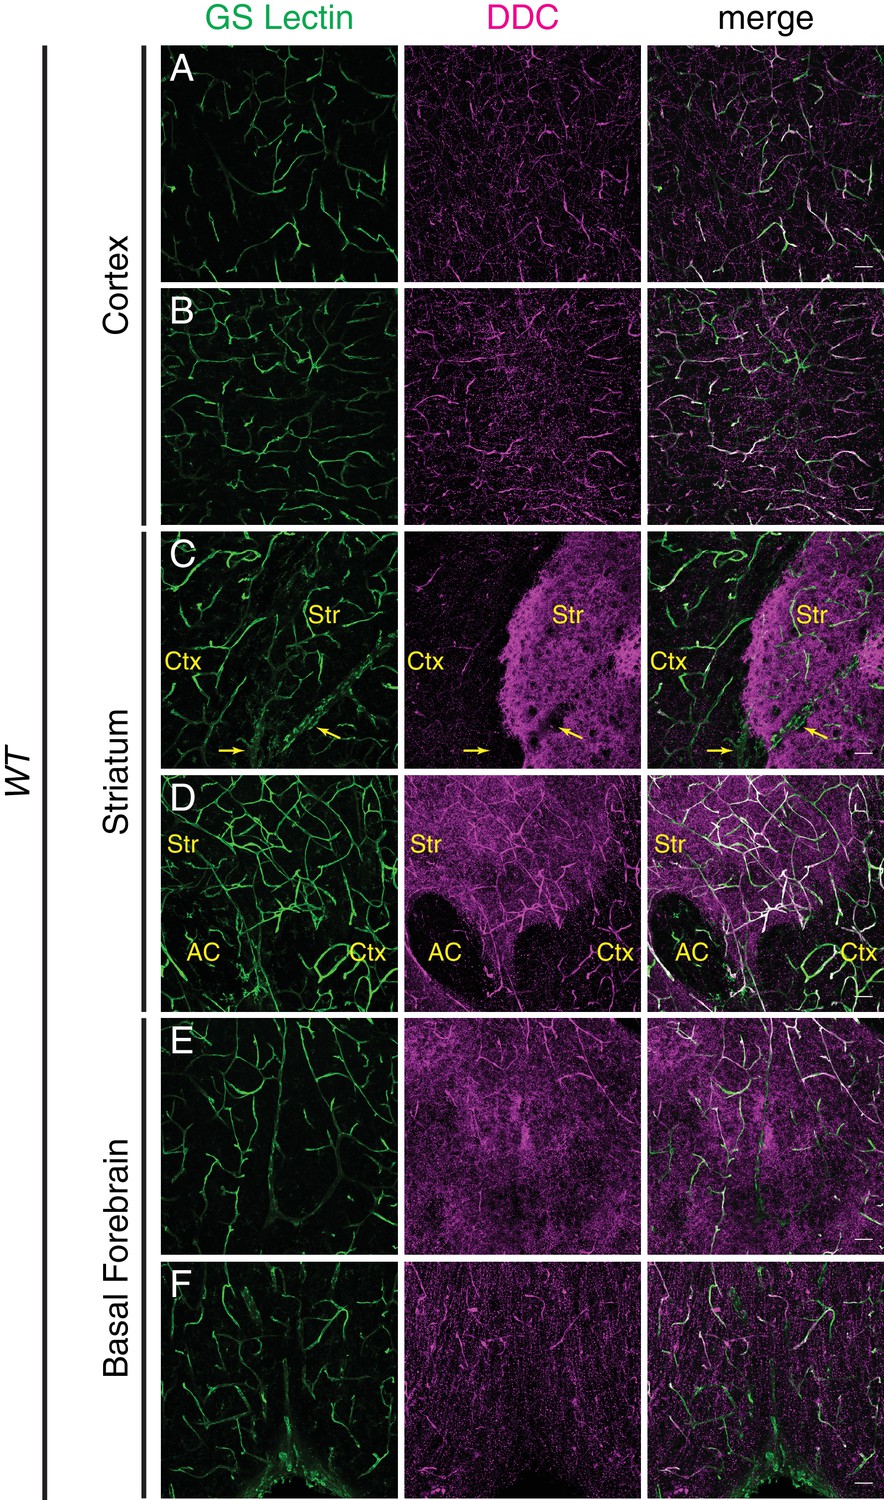
DOPA decarboxylase is expressed non-uniformly in the CNS vasculature.
(A–F) Coronal section of a P7 C57BL/6 brain stained for either GS lectin (green) to mark blood vessels or DOPA decarboxylase (DDC; magenta). Rightmost column shows merged images. Images are from the same brain section and correspond to cortex (A and B), striatum (C and D), and basal forebrain (E and F). DDC immunoreactivity is observed in blood vessels and in axon terminals, and in the latter it appears as distinct puncta in the cortex or more concentrated staining in the striatum. Yellow arrows in (C) indicate a large vein. Str, striatum; Ctx, cortex; AC, anterior commissure; Scale bar: 50 um.
Figure 8
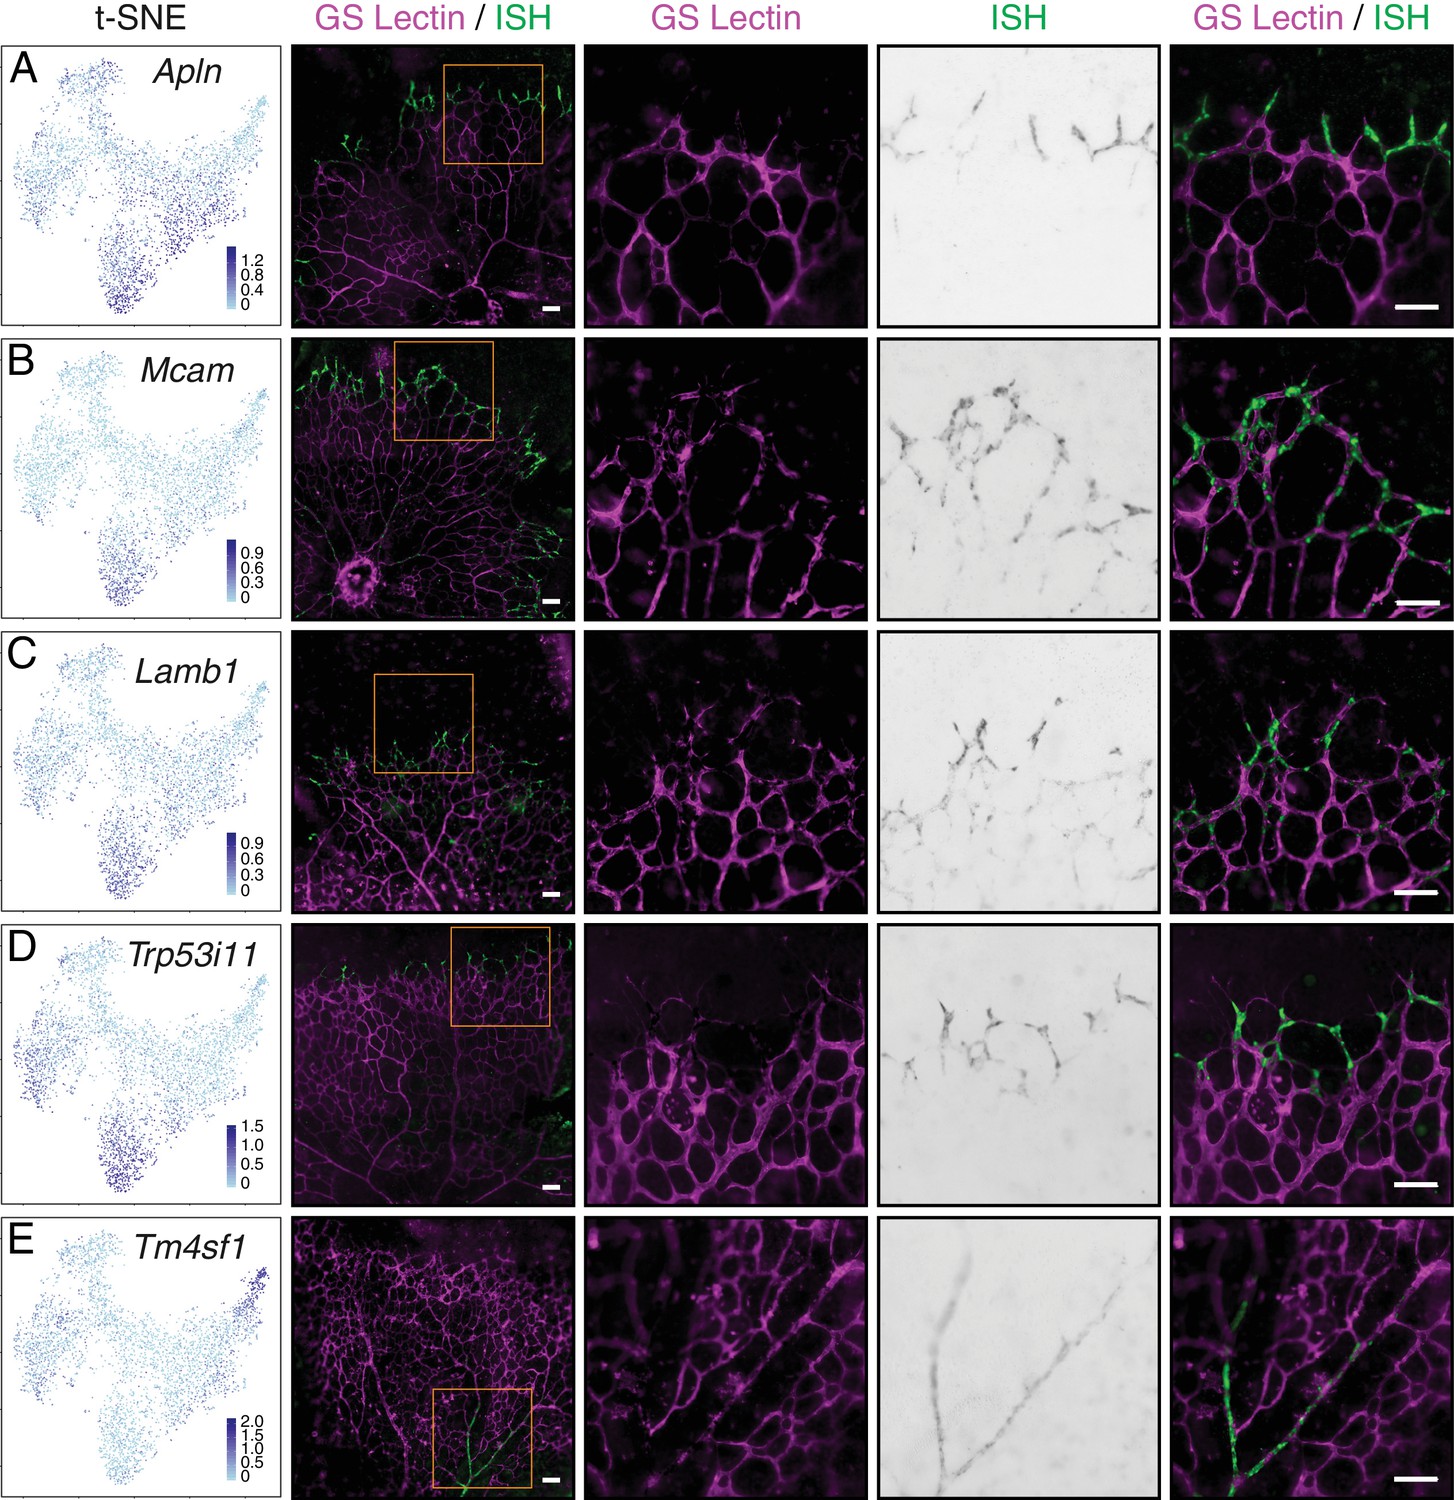
Single-cell RNA-seq of P7 brain ECs identifies novel tip cell markers.
(A–E) Whole mount retina in situ hybridization (ISH) for known tip cell marker Apln (A); novel tip cell markers Mcam (B), Lamb1 (C), and Trp53i11 (D); and a novel arterial marker Tm4sf1 (E). The first two columns, from left to right, are the t-SNE plot from Figure 7A showing expression of each marker gene and a low-magnification merged image of flatmount retina with blood vessels marked by GS Lectin (magenta) and ISH signal (green). The third to fifth columns showed the boxed region in column two at higher magnification, with separate signals (columns three and four) and the merged signals (column five). All scale bars are 50 um.
Figure 9 with 1 supplement

Cell trajectory analysis of brain ECs based on single-cell RNA-seq.
(A) Plot showing the position of cells in each EC cluster on the constructed cell trajectory. (B) Summary of the two branch points (labeled ‘1’ and ‘2’) in the cell trajectory analysis. M, mitotic; V, venous; A, arterial; T, tip cells. Examples of markers that show differential expression as cells diverge from branch points 1 and 2. Cells with no RNA-seq reads are shown in light blue; dark blue represents greater number of reads. Hey1 is enriched in arterial and tip cells (i.e. the products of the right side of branchpoint 1); Nr2f2 is enriched in venous ECs; Fbln2 is enriched in arterial ECs; and Plaur is enriched in tip cells.
Figure 9—figure supplement 1

Brain ECs exhibit heterogeneous expression of cyclin-dependent kinase inhibitors, components of TGF-beta signaling, and components of CXCR4 signaling.
(A) t-SNE plot from Figure 7A showing expression of several interesting genes. Cyclin-dependent kinase inhibitor Cdkn1a was enriched in mitotic cells, tip cells and capillary-A ECs, Cdkn1c was enriched in artery and vein ECs. Smad6 and Smad7 were enriched in the capillary-A and arterial EC clusters. Tgfb2 was widely expressed and Ltbp4 expression was concentrated in the arterial cluster. Cxcr4 was expressed in tip cells, capillary-A ECs, and arterial ECs. Cxcl12 was expressed in arterial ECs. (B) Cell trajectory analysis of genes shown in (A).
Tables
Table 1
Abbreviations used throughout the text
https://doi.org/10.7554/eLife.36187.010| Abbreviation | Definition |
|---|---|
| ATAC | Assay for Transposase Accessible Chromatin |
| BBB | Blood-brain barrier |
| CRE | Cis-regulatory element |
| DEG | Differentially expressed gene |
| DMR | Differentially methylated region |
| DMV | DNA methylation valley (UMR > 3 kb) |
| EC | Endothelial cell |
| ECTS-hypo-DMR | Endothelial cell tissue-specific hypo-DMR |
| ECTSAP | Endothelial cell tissue-specific ATAC-seq peak |
| ECTSG | Endothelial cell tissue-specific gene |
| GO | Gene ontology |
| LMR | Low-methylated region (hypomethylated, CG-poor) |
| PCA | Principal component analysis |
| scRNA-seq | Single-cell RNA-seq |
| TF | Transcription factor |
| TSS | Transcription start site |
| UMR | Unmethylated region (hypomethylated, CG-rich) |
Key resources table
| Reagent type (species) or resource | Designation | Source or reference | Identifiers | Additional information |
|---|---|---|---|---|
| Genetic reagent (Mus musculus; Male) | Tie2-GFP | The Jackson Laboratory | Stock No: 003658; RRID:IMSR_JAX:003658 | |
| Genetic reagent (M. musculus; Male) | Tie2-Cre | The Jackson Laboratory | Stock No: 008863 | |
| Genetic reagent (M. musculus; Male) | R26-Tcf/Lef-LSL- H2B-GFP-6xMYC | PMID: 28803732 | ||
| Antibody | anti-CD11b BV421 (rat monoclonal) | Biolegends | Cat No: 101235; RRID:AB_10897942 | 1:1000 |
| Antibody | anti-ICAM2 (rat monoclonal) | BD Biosciences | Cat No: 553326 | 1:300 |
| Antibody | anti-6xMYC (chicken polyclonal) | PMID: 24411735 | 1:10000 | |
| Antibody | anti-GLUT1 (rabbit polyclonal) | Thermo Fisher Scientific | RB-9052 | 1:500 |
| Antibody | anti-ERG (rabbit polyclonal) | Cell Signaling | A7L1G | 1:500 |
| Antibody | anti-dopa decarboxylase (goat polyclonal) | R and D Systems | AF3564 | 1:500 |
| Antibody | anti-ZIC3 (rabbit polyclonal) | PMID: 23217714 | 1:50 | |
| Other | Alexa Fluor 594-conjugated GS Lectin | Thermo Fisher Scientific | L21416 | 1:200 |
| Peptide, recombinant protein | Tn5 transposase | Illumina | FC-121–1030 | |
| Commercial assay or kit | Worthington Papain Dissociation Kit | Worthington Biochemical Corporation | LK003160 | |
| Commercial assay or kit | Rneasy Micro Plus Kit | Qiagen | 74034 | |
| Commercial assay or kit | Dneasy Blood and Tissue Kit | Qiagen | 69504 | |
| Commercial assay or kit | MinElute GelExtraction Kit | Qiagen | 28604 | |
| Commercial assay or kit | Agencourt AMPure XP beads | Beckman Coulter | A63880 | |
| Commercial assay or kit | EZ DNA Methylation-Direct Kit | Zymo | D5021 | |
| Software, algorithm | RSEM | PMID: 21816040 | RRID:SCR_013027 | |
| Software, algorithm | DESeq2 | PMID: 25516281 | RRID:SCR_015687 | |
| Software, algorithm | Bowtie2 | PMID: 22388286 | ||
| Software, algorithm | MACS2 | PMID: 18798982 | ||
| Software, algorithm | DiffBind | PMID: 22217937 | RRID:SCR_012918 | |
| Software, algorithm | deepTools | PMID: 27079975 | ||
| Software, algorithm | HOMER | PMID: 20513432 | ||
| Software, algorithm | Monocle | PMID: 24658644 | ||
| Software, algorithm | Methylpy | PMID: 26030523 | ||
| Software, algorithm | BEDTools | PMID: 20110278 | RRID:SCR_006646 |
Additional files
-
Supplementary file 1
Characteristics of each sequencing sample.
(A) RNA-seq. (B) ATAC-seq. (C) MethylC-seq
- https://doi.org/10.7554/eLife.36187.029
-
Supplementary file 2
Gene expression data.
(A-C) Transcript abundances in raw expected read counts (A), cross-sample normalized read counts (B), and TPMs (C). (D) List of EC-enriched transcripts. (E) List of all differentially expressed genes between one or more pairs of EC subtypes. (F) List of ECTSGs
- https://doi.org/10.7554/eLife.36187.030
-
Supplementary file 3
Gene ontology (GO) enrichment analysis
(A) GO enrichment analysis of brain ECTSGs. (B) GO enrichment analysis of liver ECTSGs. (C) GO enrichment analysis of lung ECTSGs. (D) GO enrichment analysis of kidney ECTSGs.
- https://doi.org/10.7554/eLife.36187.031
-
Supplementary file 4
Hypomethylated features in each EC subtype
(A-D) UMRs for each EC subtype. (E-H) LMRs for each EC subtype. (I-L) DMRs for each EC subtype. (I’-L’) ECTS-hypo-DMRs for each EC subtype. (M-P) DMVs for each EC subtype. (Q-T) ECTS-large hypo-DMRs for each EC subtype. (U) LMRs found only in ECs relative to photoreceptors and cortical neurons. (V) LMRs from (U) that are shared between EC subtypes
- https://doi.org/10.7554/eLife.36187.032
-
Supplementary file 5
Numbers underlying heatmaps shown throughout figures.
- https://doi.org/10.7554/eLife.36187.033
-
Supplementary file 6
Accessible chromatin peaks in each EC subtype.
(A-D) ATAC-seq peaks for each EC subtype called using the full range of ATAC-seq fragment lengths. (E-H) ATAC-seq peaks for each EC subtype called using <100 nt ATAC-seq fragments. (I-L) Differential ATAC-seq peaks (<100 nt) for each EC subtype. (I’-L’) ECTSAPs (<100 nt) for each EC subtype. (M) ATAC-seq peaks (<100 nt) found only in ECs relative to photoreceptors and cortical neurons. (N) ATAC-seq peaks from (M) that are shared between EC subtypes.
- https://doi.org/10.7554/eLife.36187.034
-
Supplementary file 7
HOMER motif files used in this study.
(A) HOMER motif files for enriched k-mers identified in ECTS-hypo-DMRs and ECTSAPs. (B) HOMER motif file used for representative member of TF families. (C) HOMER motif file used for paired ETS:ZIC motif.
- https://doi.org/10.7554/eLife.36187.035
-
Supplementary file 8
Top 25 genes for each single-cell RNA-seq cluster.
(A) Arterial cluster markers. (B) Capillary-A cluster markers. (C) Capillary-V cluster markers. (D) Mitotic cluster markers. (E) Tip cell cluster markers. (F) Venous cluster markers.
- https://doi.org/10.7554/eLife.36187.036
-
Transparent reporting form
- https://doi.org/10.7554/eLife.36187.037
Download links
A two-part list of links to download the article, or parts of the article, in various formats.
Downloads (link to download the article as PDF)
Open citations (links to open the citations from this article in various online reference manager services)
Cite this article (links to download the citations from this article in formats compatible with various reference manager tools)
Transcriptional and epigenomic landscapes of CNS and non-CNS vascular endothelial cells
eLife 7:e36187.
https://doi.org/10.7554/eLife.36187


