Nuclear pore heterogeneity influences HIV-1 infection and the antiviral activity of MX2
- The Rockefeller University, United States
- University of Colorado School of Medicine, United States
- Howard Hughes Medical Institute, United States
- Aaron Diamond AIDS Research Center, United States
Figures
Figure 1 with 3 supplements
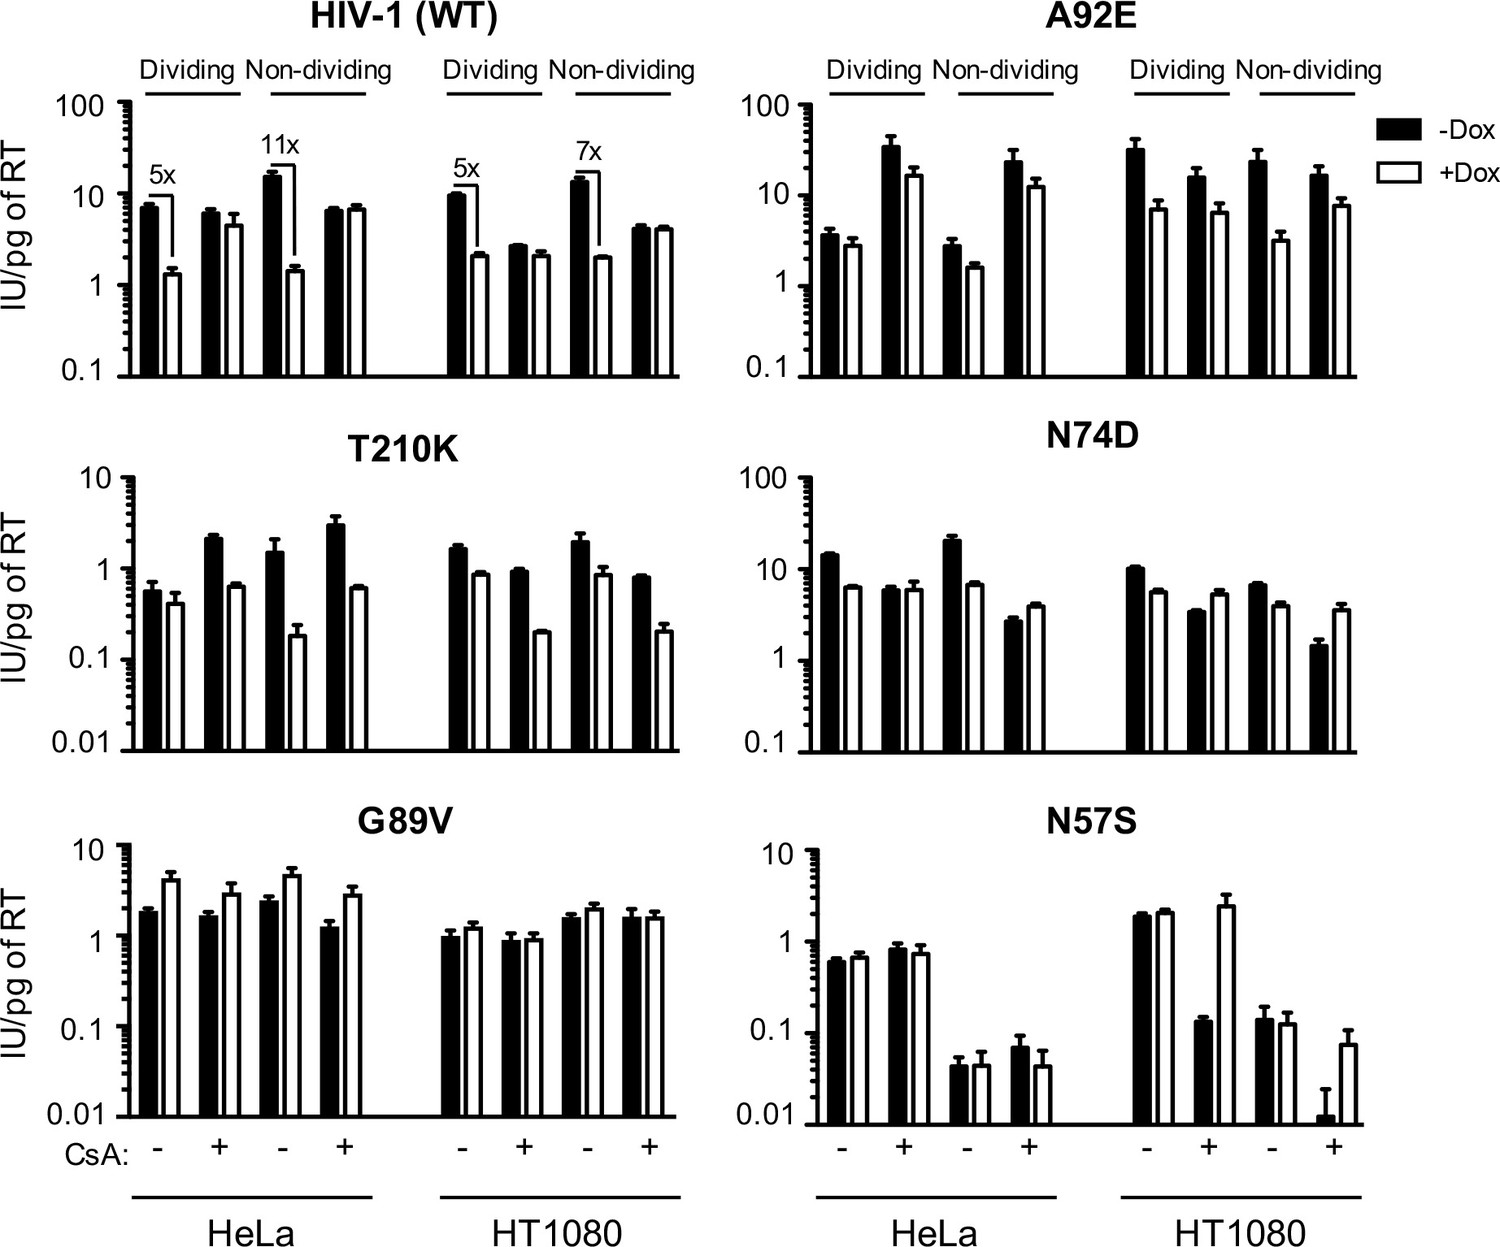
MX2 sensitivity is affected by the viral CA, the cell-cycle, and CypA/CsA in a cell-type dependent manner.
Wild-type (WT) or CA-mutant HIV-1-GFP reporter virus infection of dividing or non-dividing (aphidicolin treated) HeLa or HT1080 cells expressing doxycycline-inducible MX2 in the presence (white bars) or absence (black bars) of pretreatment with doxycycline (Dox) and the presence or absence of CsA. Titers are represented as mean +sem of infectious units per pg of reverse transcriptase (RT), n ≥ 3 technical replicates, representative of five independent experiments.
Figure 1—figure supplement 1
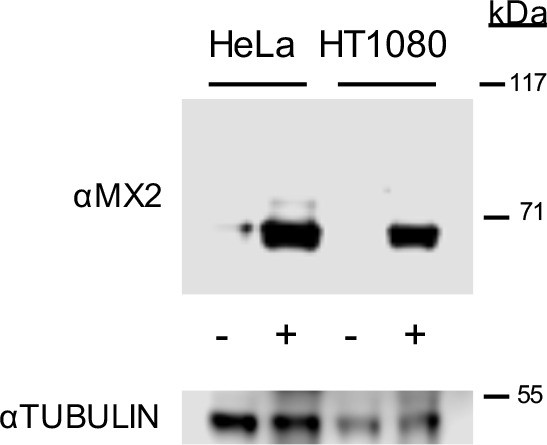
Western blot analysis of doxycycline inducible MX2 and tubulin loading control in HeLa and HT1080 cells.
https://doi.org/10.7554/eLife.35738.003
Figure 1—figure supplement 2
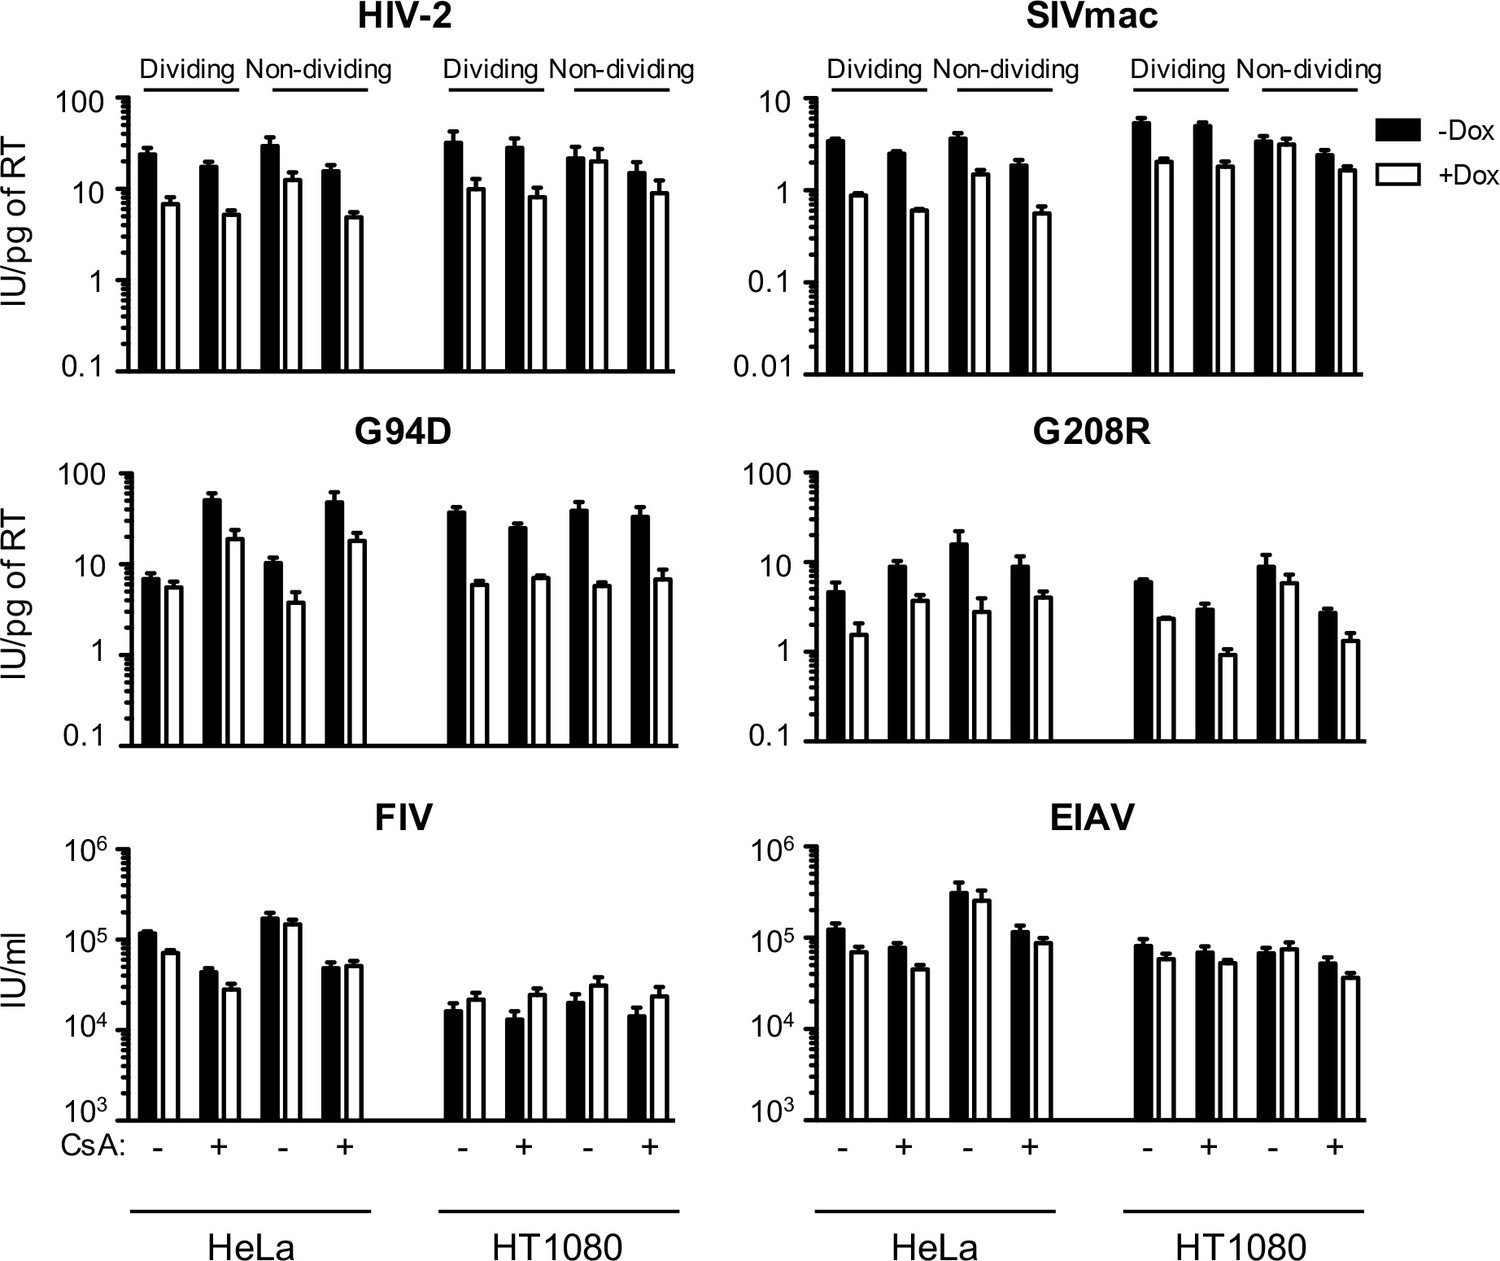
MX2 sensitivity is altered by the viral CA, the cell-cycle, and cyclophilin A in a cell-type dependent manner.
Infection of dividing or non-dividing (aphidicolin treated) HeLa or HT1080 cells expressing doxycycline-inducible MX2 in the presence (white bars) or absence (black bars) of pretreatment with doxycycline (Dox) and the presence or absence of CsA with various GFP reporter viruses. Titers are represented as mean +sem of infectious units per pg of reverse transcriptase (RT) or infectious units per ml (for FIV and EIAV), n ≥ 3 technical replicates, representative of five independent experiments. FIV, feline immunodeficiency virus; EIAV, equine infectious anemia virus.
Figure 1—figure supplement 3
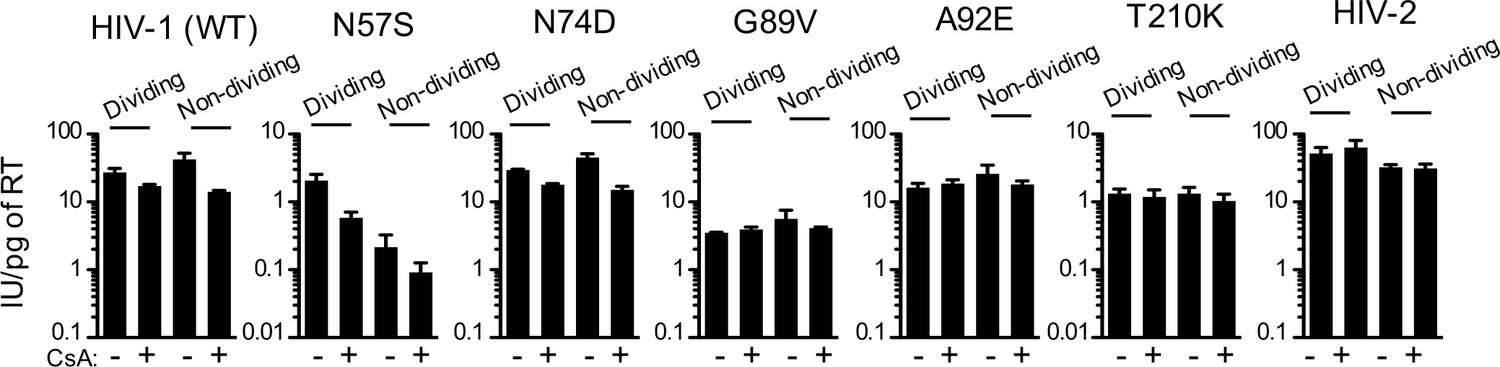
CsA sensitivity of HIV-1 CA mutants in HOS cells.
WT, CA-mutant HIV-1, or HIV-2-GFP reporter virus infection of dividing or non-dividing (aphidicolin treated) HOS cells expressing doxycycline-inducible MX2 in the presence or absence of CsA. Titers are represented as mean +sem of infectious units per pg of reverse transcriptase (RT), n = 3 technical replicates, representative of four independent experiments.
Figure 2 with 3 supplements
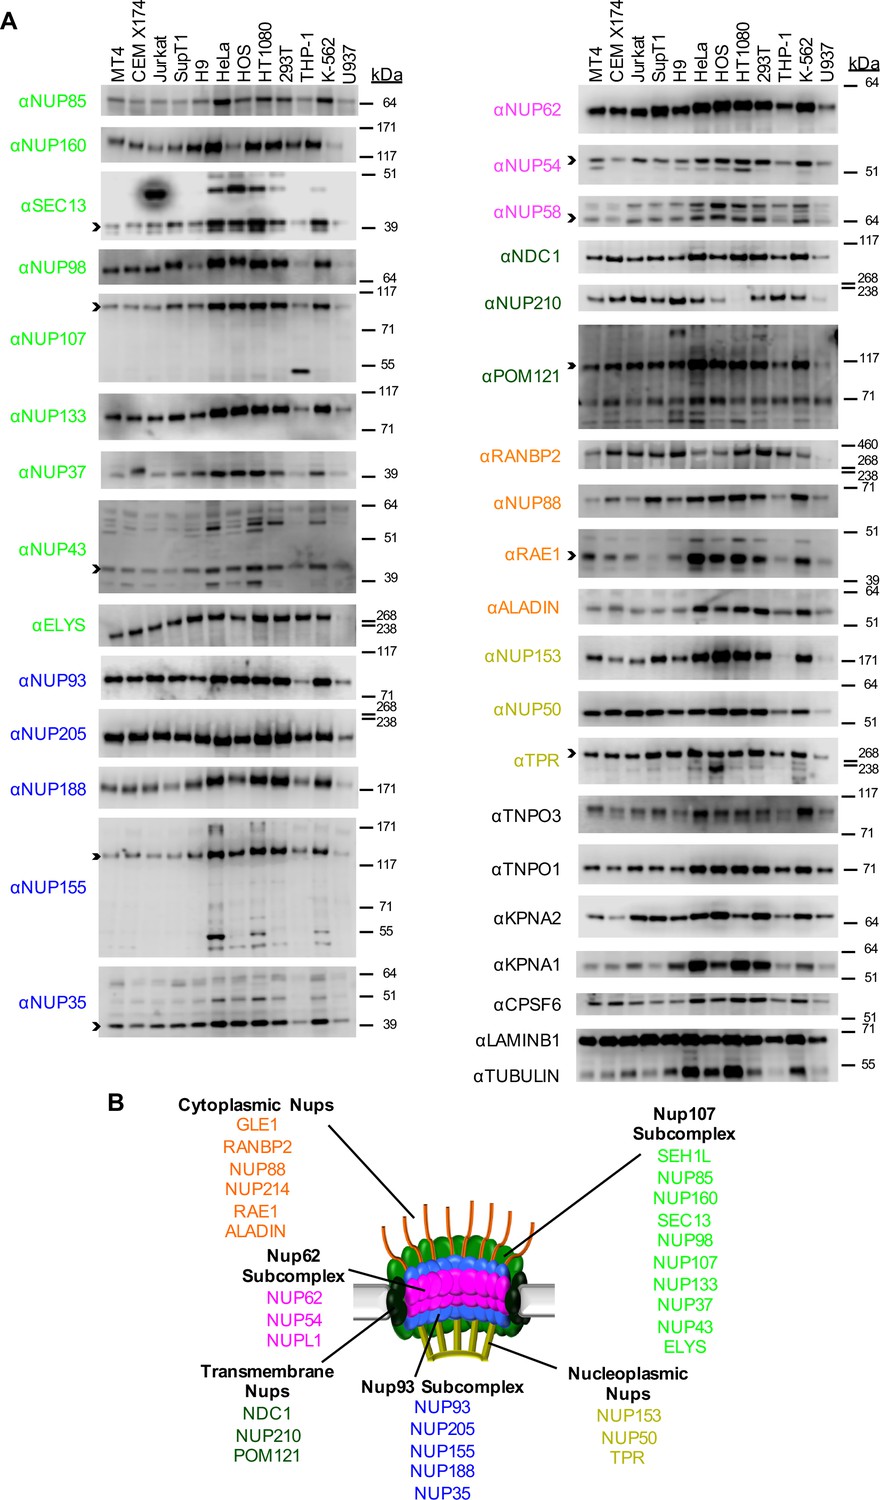
Nup and NTR expression in immortalized cell lines.
(A) Western blot analysis of expression of Nups (color-coded by subcomplex as indicated in panel B), selected NTRs, and CPSF6 in T cell (MT4, CEM X174, Jurkat, SupT1, H9), adherent cell (HeLa, HOS, HT1080, 293T), or monocytic cell (THP-1, K-562, U937) lines. Where with multiple bands were detected, arrowheads indicate the band whose migration most closely matched the predicted molecular weight of the Nup/NTR. The indicated bands were utilized for quantification in Figure 2—figure supplement 1, and correspond to the band highlighted in Figure 5. Each well was loaded with 10 μL of lysate containing 104 cells. Each blot represents one of at least three replicates produced from two or three separately generated cell lysates. (B) Schematic representation of the nuclear pore complex listing individual members of each subcomplex, color-coded to correspond to the labels for the western blot in panel (A).
Figure 2—figure supplement 1
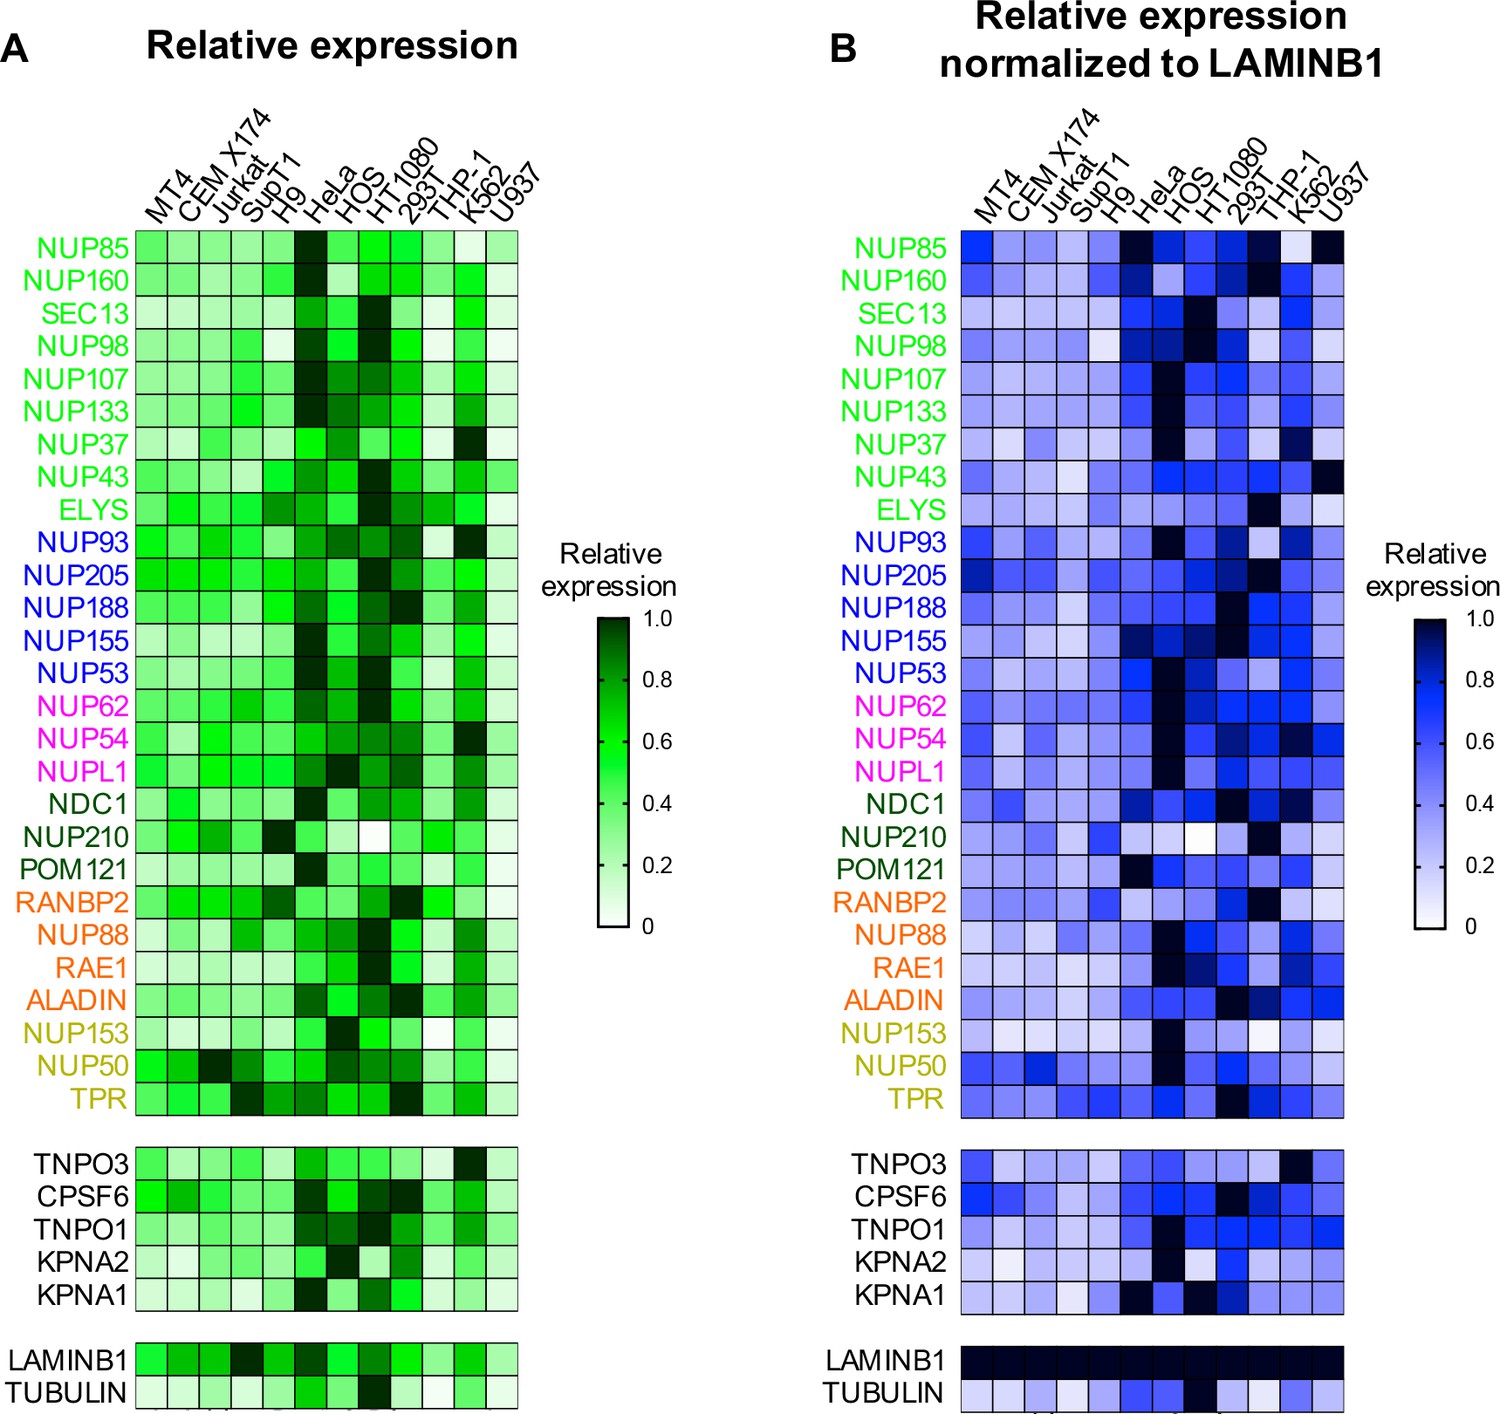
Nup and NTR expression in immortalized cell lines.
Heat map representing Nup, selected NTRs, and CPSF6 protein levels in T cell (MT4, CEM X174, Jurkat, SupT1, ) adherent cell (HeLa, HOS, HT1080, 293T), or monocytic cell (THP-1, K-562, U937) lines (color-coded by subcomplex as in Figure 2) from the individual blots shown in Figure 2 (n = 1). Heat maps are normalized for each protein such that the highest expressing cell line is assigned a value of 1.0 (black), while undetectable expression is assigned a zero value (white). (B) Heat map representing protein levels from the blots shown in Figure 2 normalized to LAMIN B1 expression (determined by dividing Nup/NTR expression by LAMIN B1 expression and assigning the maximum for each Nup/NTR a value of 1.0).
Figure 2—figure supplement 2
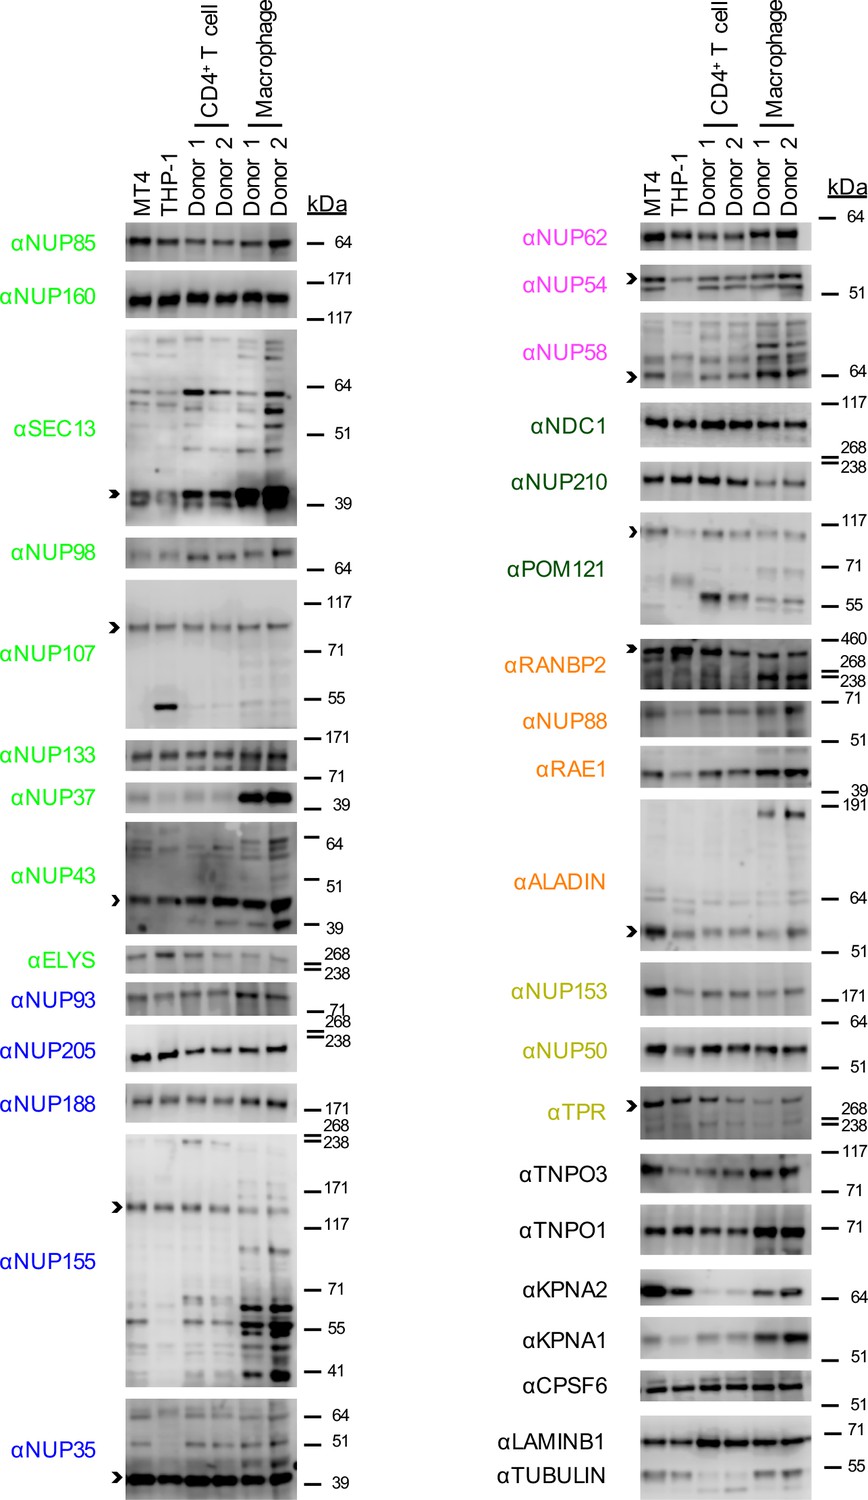
Nup and NTR expression in primary cells.
Western blot analysis of expression of Nups, selected NTRs, and CPSF6 in MT4, THP-1, primary CD4+ T cells, and macrophages from two donors (color coded by subcomplex as in Figure 2B). Arrowheads indicate the band whose migration most closely matched predicted molecular weight of the Nup/NTR. The indicated bands were utilized for quantification in Figure 2—figure supplement 2 and correspond to the band highlighted in Figure 5. Each blot represents one of at least two replicates.
Figure 2—figure supplement 3
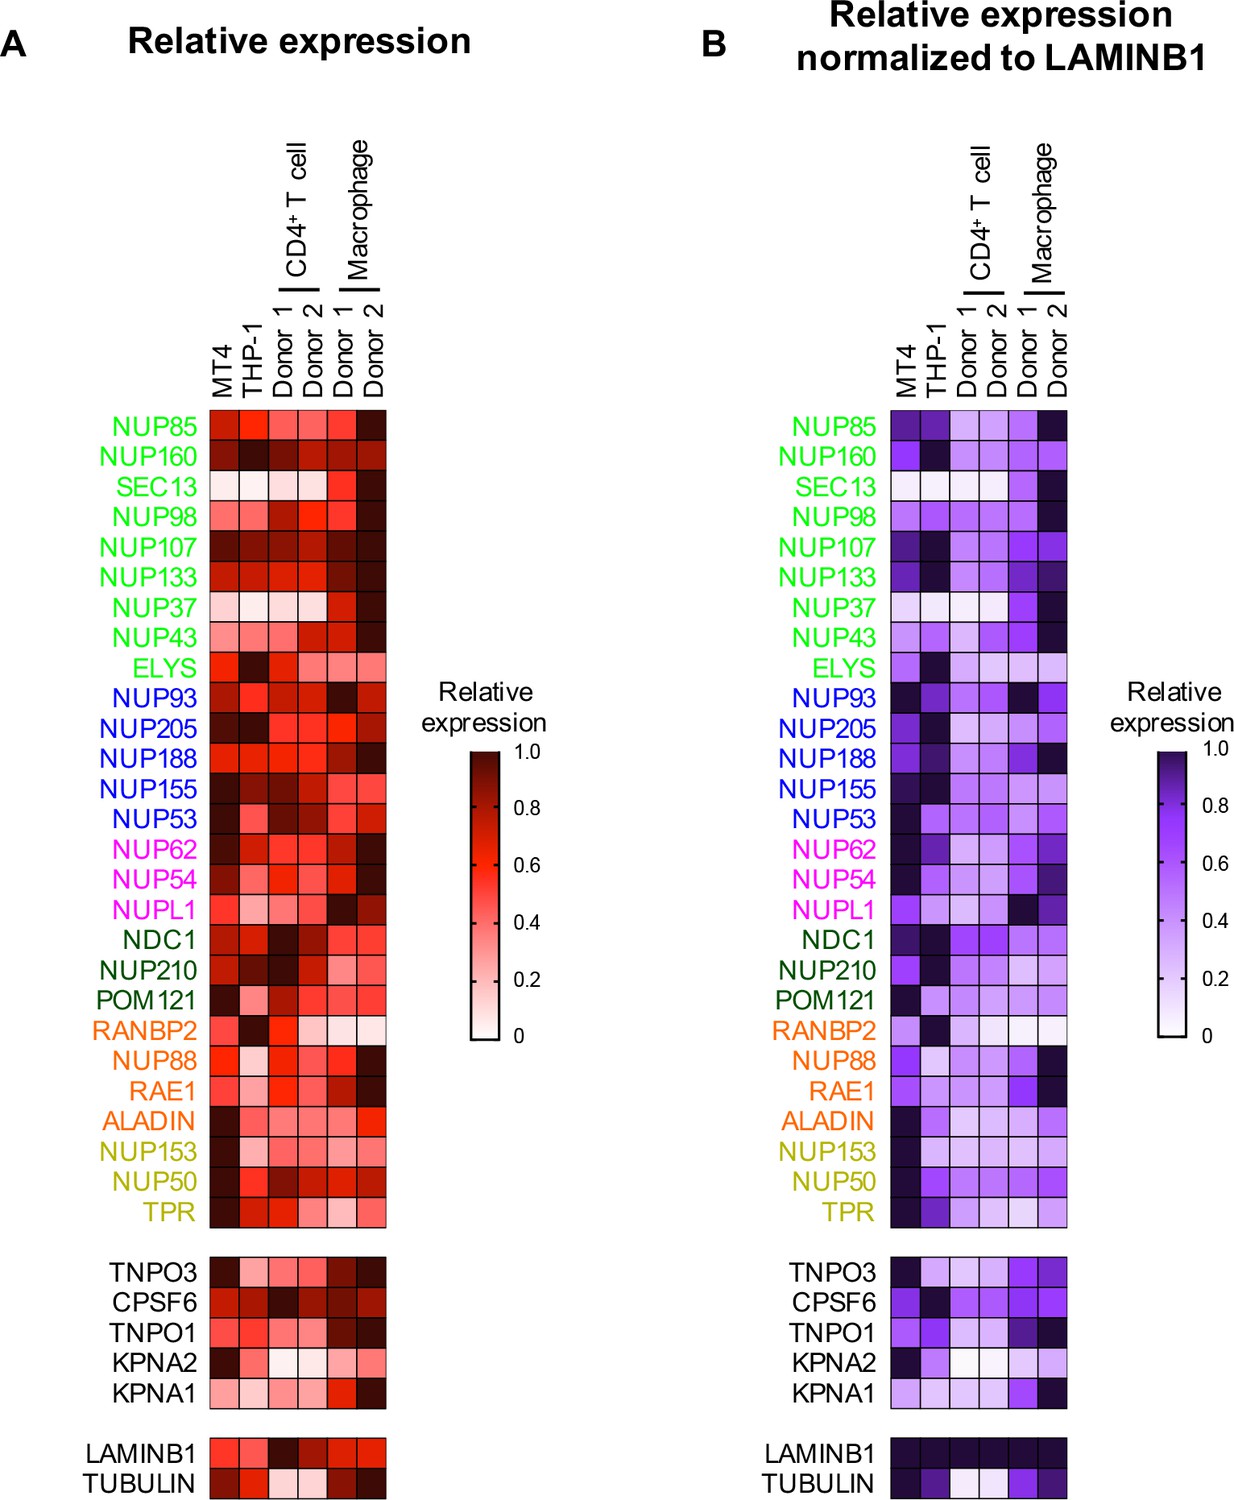
Nup and NTR expression in primary cells.
(A) Heat map representing Nup, selected NTRs, and CPSF6 protein levels in MT4, THP-1, primary CD4+ T cells, and macrophages from two donors (color coded by subcomplex as in Figure 2) from the individual blots shown in Figure 2—figure supplement 2 (n = 1). Heat maps are normalized for each protein such that the highest expressing cell line is assigned a value of 1.0 (black), while undetectable expression is assigned a zero value (white). (B) Heat map representing protein levels from the blots shown in Figure 2—figure supplement 2 normalized to LAMIN B1 expression (determined by dividing Nup/NTR expression by LAMIN B1 expression and assigning the maximum for each Nup/NTR a value of 1.0).
Figure 3 with 1 supplement
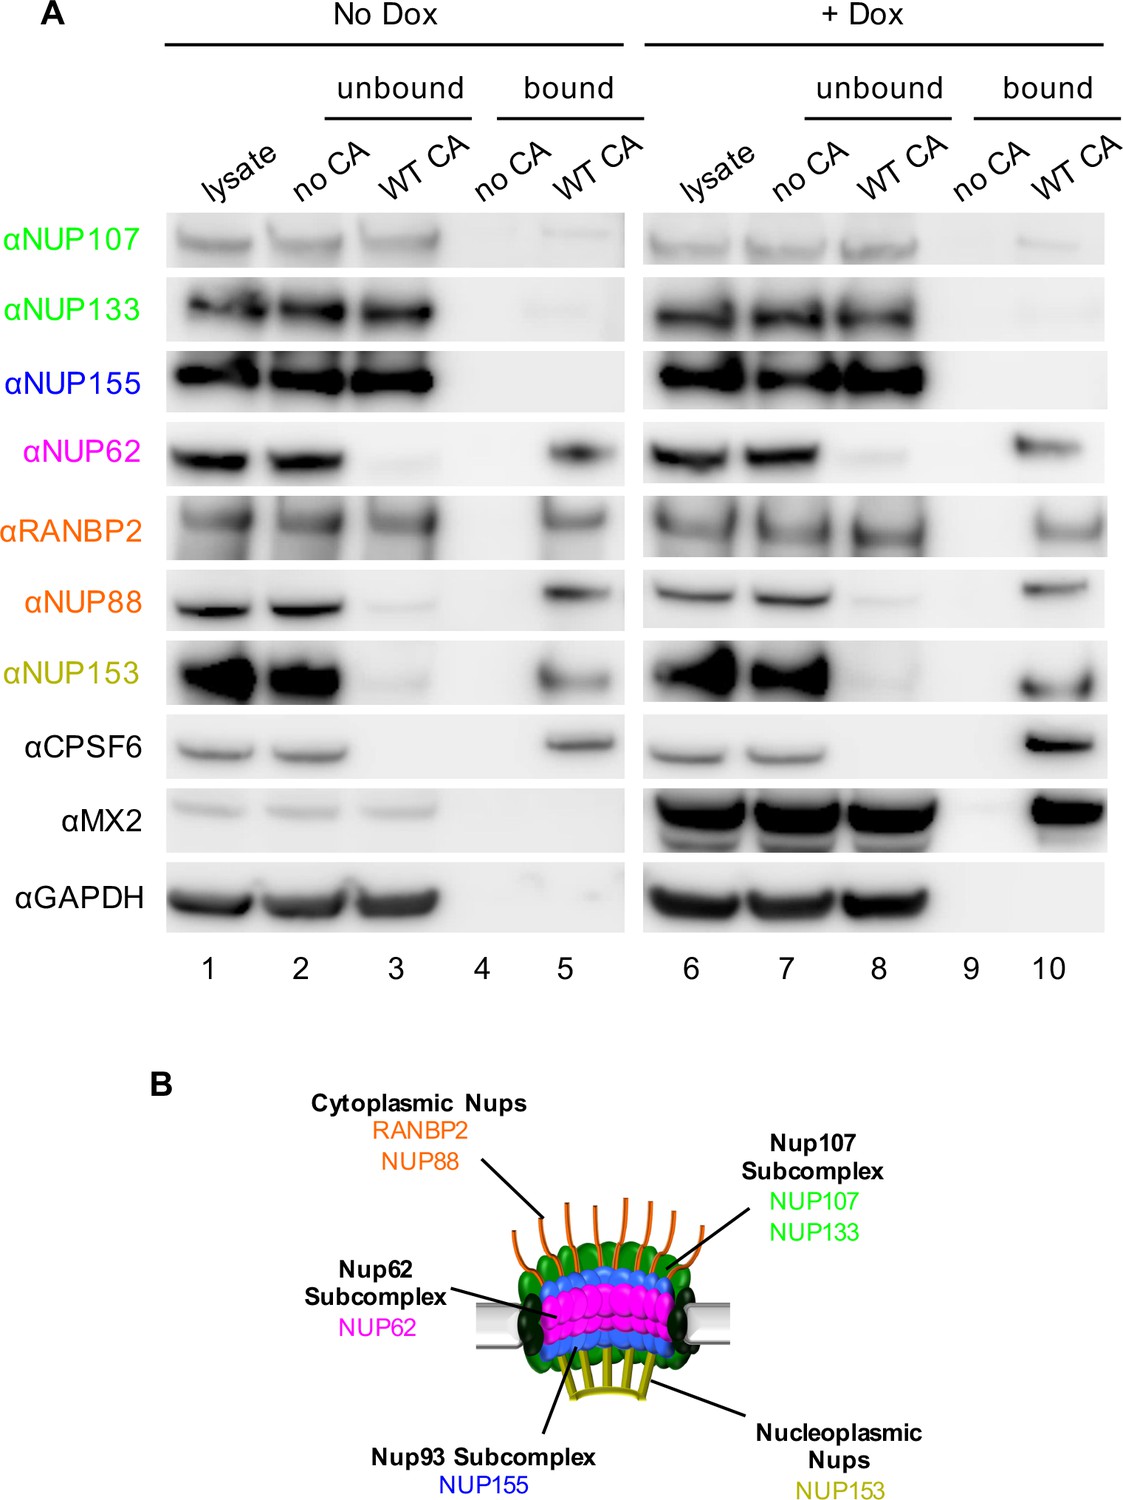
Interactions between CA tubes and cellular Nups.
(A) CA tubes were assembled in vitro and incubated with lysates of HeLa cells without (lanes 1–5) or with (lanes 6–10) Dox dependent expression of MX2. The reaction mixtures were subjected to centrifugation to separate pulled-down (or bound) fractions from supernatant (unbound) proteins. Lanes 1 and 6: cellular lysates; Lanes 2 and 7: supernatants from control experiments without CA tubes; Lanes 3 and 8: supernatants after incubating cellular lysates with CA tubes; Lanes 4 and 9: pulled-down fractions from control experiments in the absence of CA tubes; Lanes 5 and 10: proteins bound to CA tubes. Bands shown in each blot correspond to those indicated in Figure 2. Representative of two independent experiments. (B) Schematic representation of the nuclear pore complex listing individual members of each subcomplex tested in (A).
Figure 3—figure supplement 1

Specificity of CA binding assay.
(A) Coomassie stained SDS-PAGE image for pull-down experiments with in vitro assembled CA tubes and HeLa cell lysates. Lanes 1–10 correspond to those in Figure 3. In addition, molecular weight markers are shown. Representative of two independent experiments. (B) WT and N74D CA tubes were assembled in vitro and incubated with lysates of HeLa cells without (lanes 1–7) or with (lanes 9–15) Dox dependent expression of MX2. The reaction mixtures were subjected to centrifugation to separate pulled-down (or bound) fractions from supernatant (unbound) proteins. Lanes 1 and 9: cellular lysates; Lanes 2 and 10: supernatants from control experiments without CA tubes; Lanes 3 and 11: supernatants after incubating cellular lysates with WT CA tubes; Lanes 4 and 12: supernatants after incubating cellular lysates with N74D CA tubes; Lanes 5 and 13: pulled-down fractions from control experiments in the absence of CA tubes; Lanes 6 and 14: CPSF6 bound to WT CA tubes; Lanes 7 and 15: No CPSF6 bound to N74D CA tubes. Representative of two independent experiments.
Figure 4
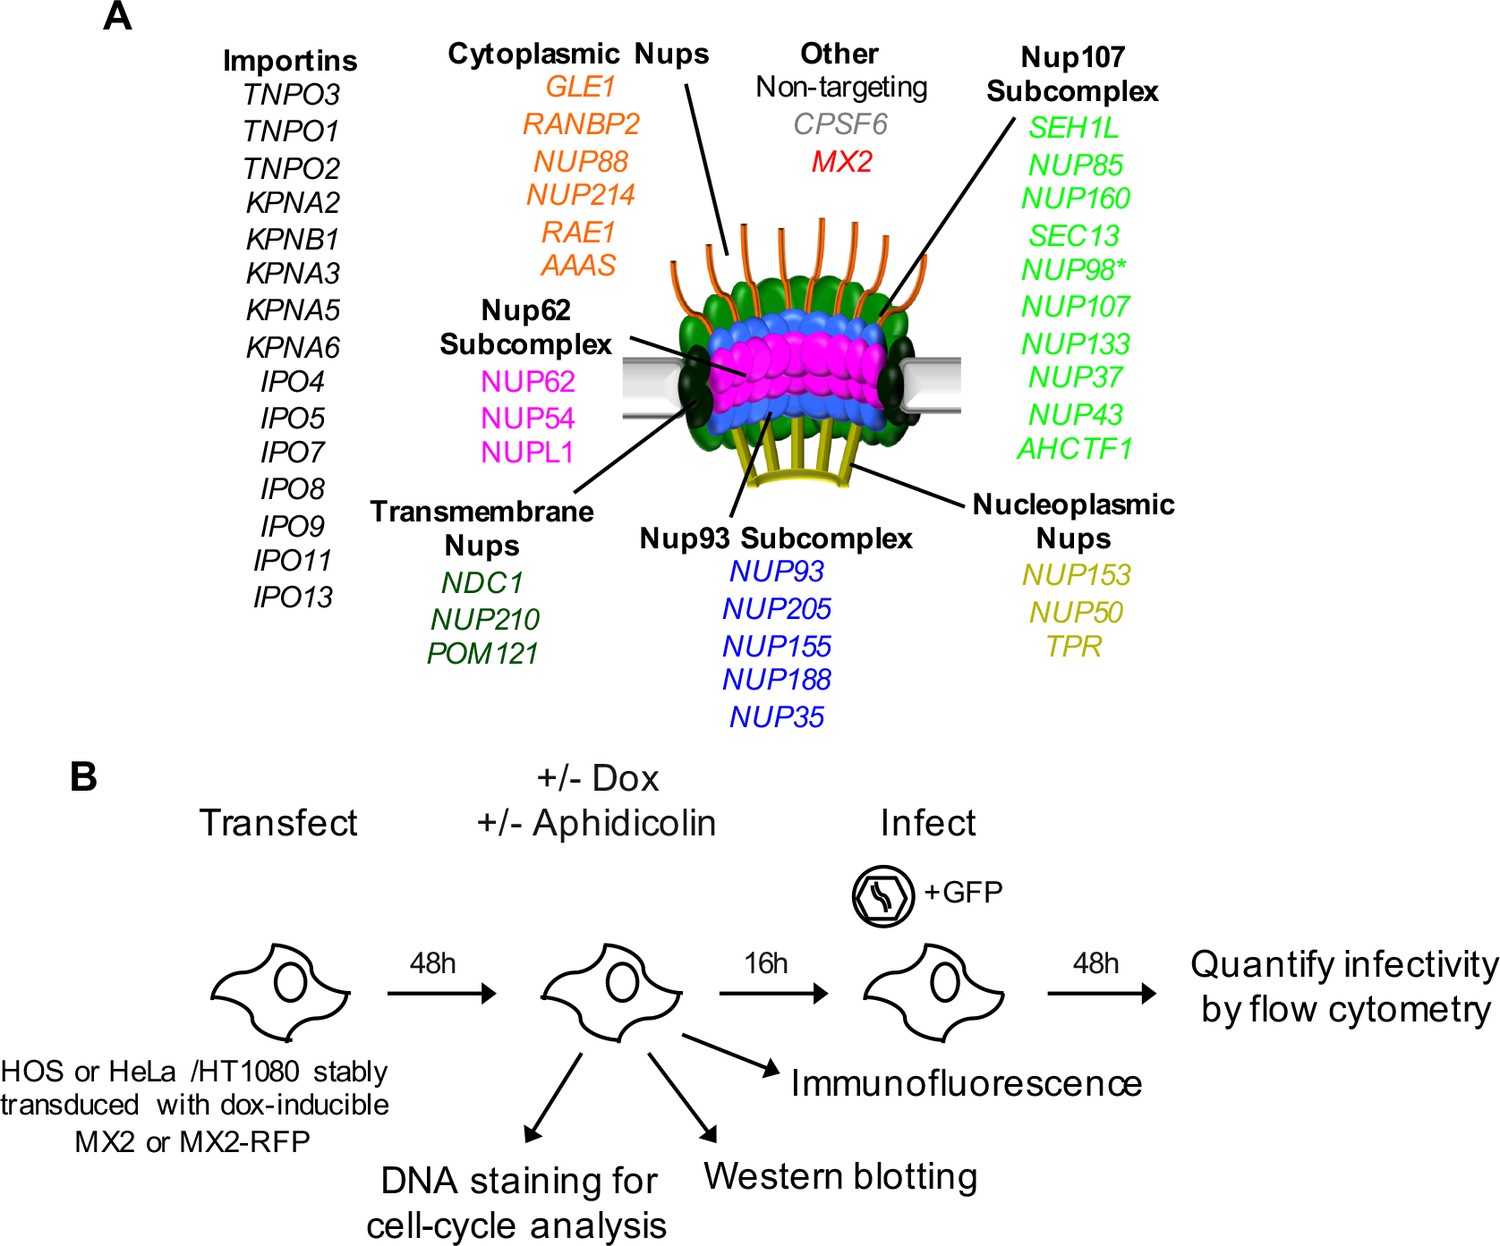
An siRNA-based knockdown approach to investigate the role of Nups and NTRs in MX2 localization and anti-viral activity.
(A) Schematic representation of the nuclear pore complex and genes included in siRNA library color coded by subcomplex. (*NUP98 is listed as a member of Nup107 subcomplex, however. NUP98 and NUP96 are produced following autoproteolytic cleavage of a polyprotein precursor (Fontoura et al., 1999; Rosenblum and Blobel, 1999), the siRNA used herein targets both Nups). Importins/nuclear transport receptors (NTRs) included in the siRNA library are listed in black. Also included, siRNA targeting MX2 or CPSF6 and a non-targeting control siRNA. (B) Experimental strategy to investigate the roles of Nups and NTRs involved in HIV-1 infection, MX2 subcellular localization, and anti-viral activity of MX2. For a detailed description, refer to the Materials and methods.
Figure 5 with 8 supplements
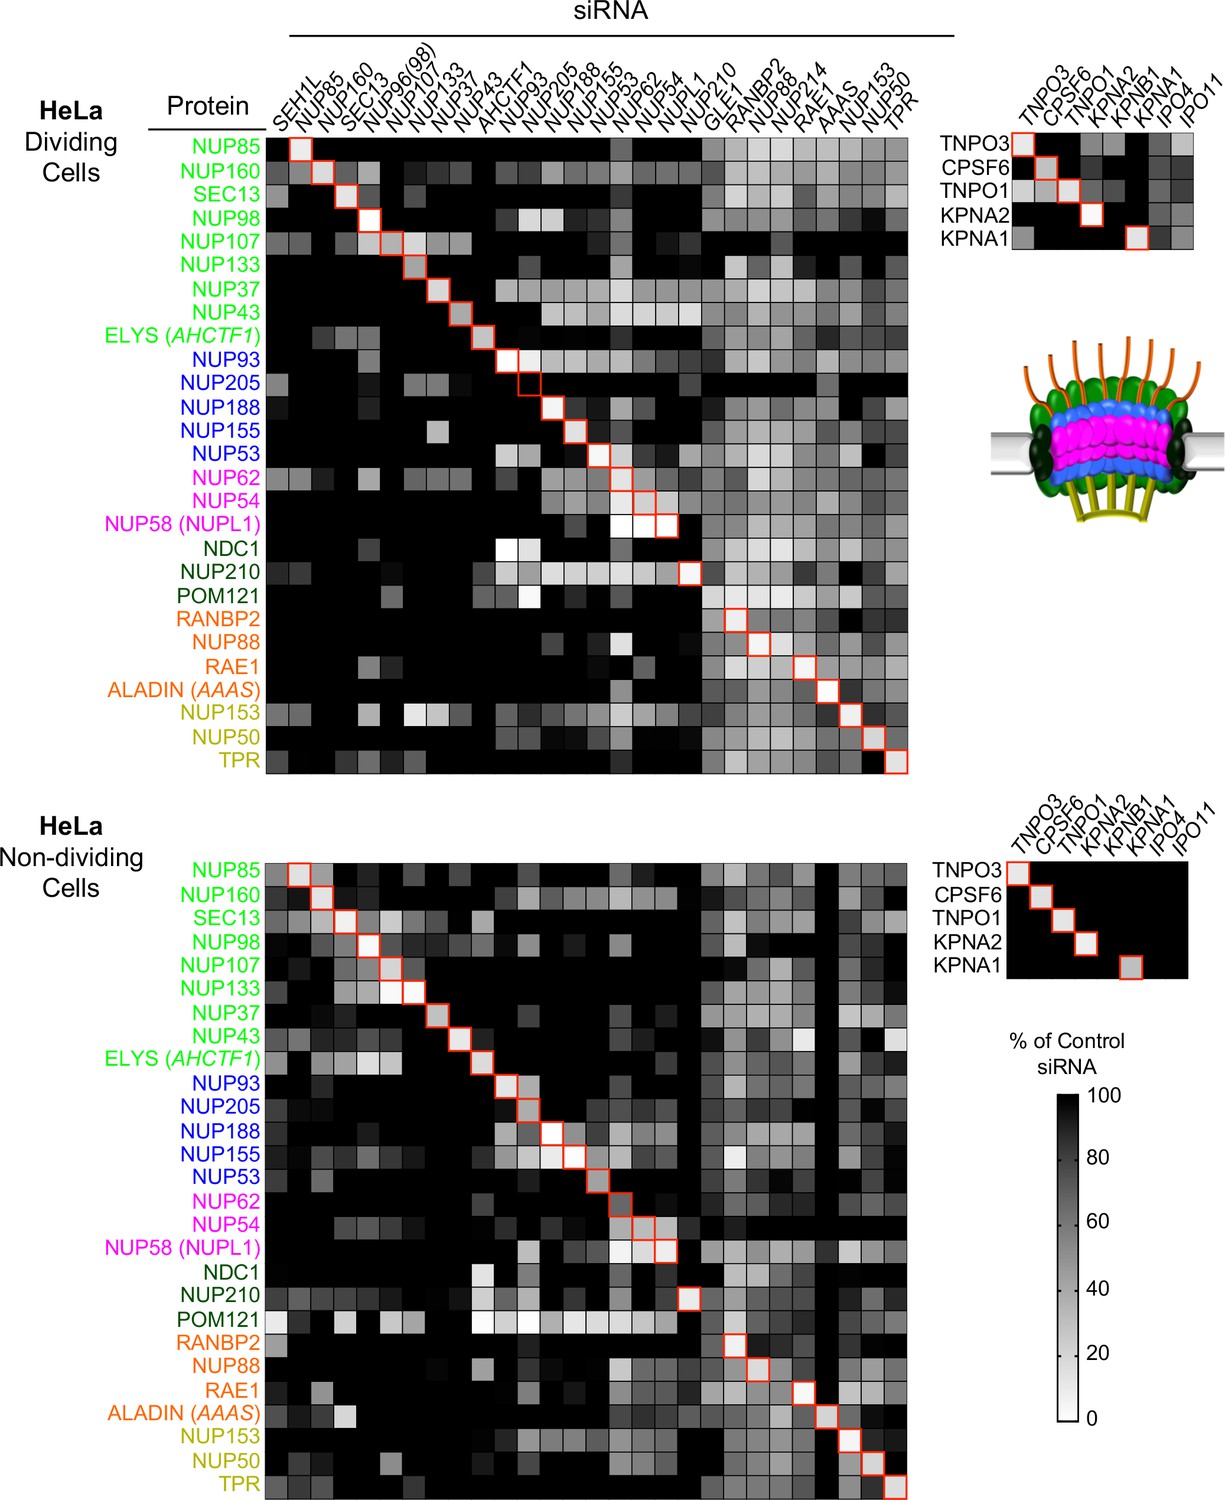
Efficient siRNA-mediated knockdown of Nups and pleiotropic effects of Nup depletion in HeLa cells.
Heat map representing Nup and NTR protein levels (color coded by subcomplex as in Figure 4A and according to the included schematic) in dividing (top) and non-dividing (bottom) HeLa cells 64 hr after transfection with the indicated siRNA. Protein levels are expressed as ratios of Nup/NTR expression:LAMIN B1 expression, based on the blots shown in Figure 5—figure supplement 3 and 4 normalized to control siRNA transfected cells that were assigned a value of 1.0 (black). Reduced expression is indicated in gray-white, with no detectable expression assigned a zero value (white). Red boxes highlight corresponding antibody-siRNA pairs.
Figure 5—figure supplement 1
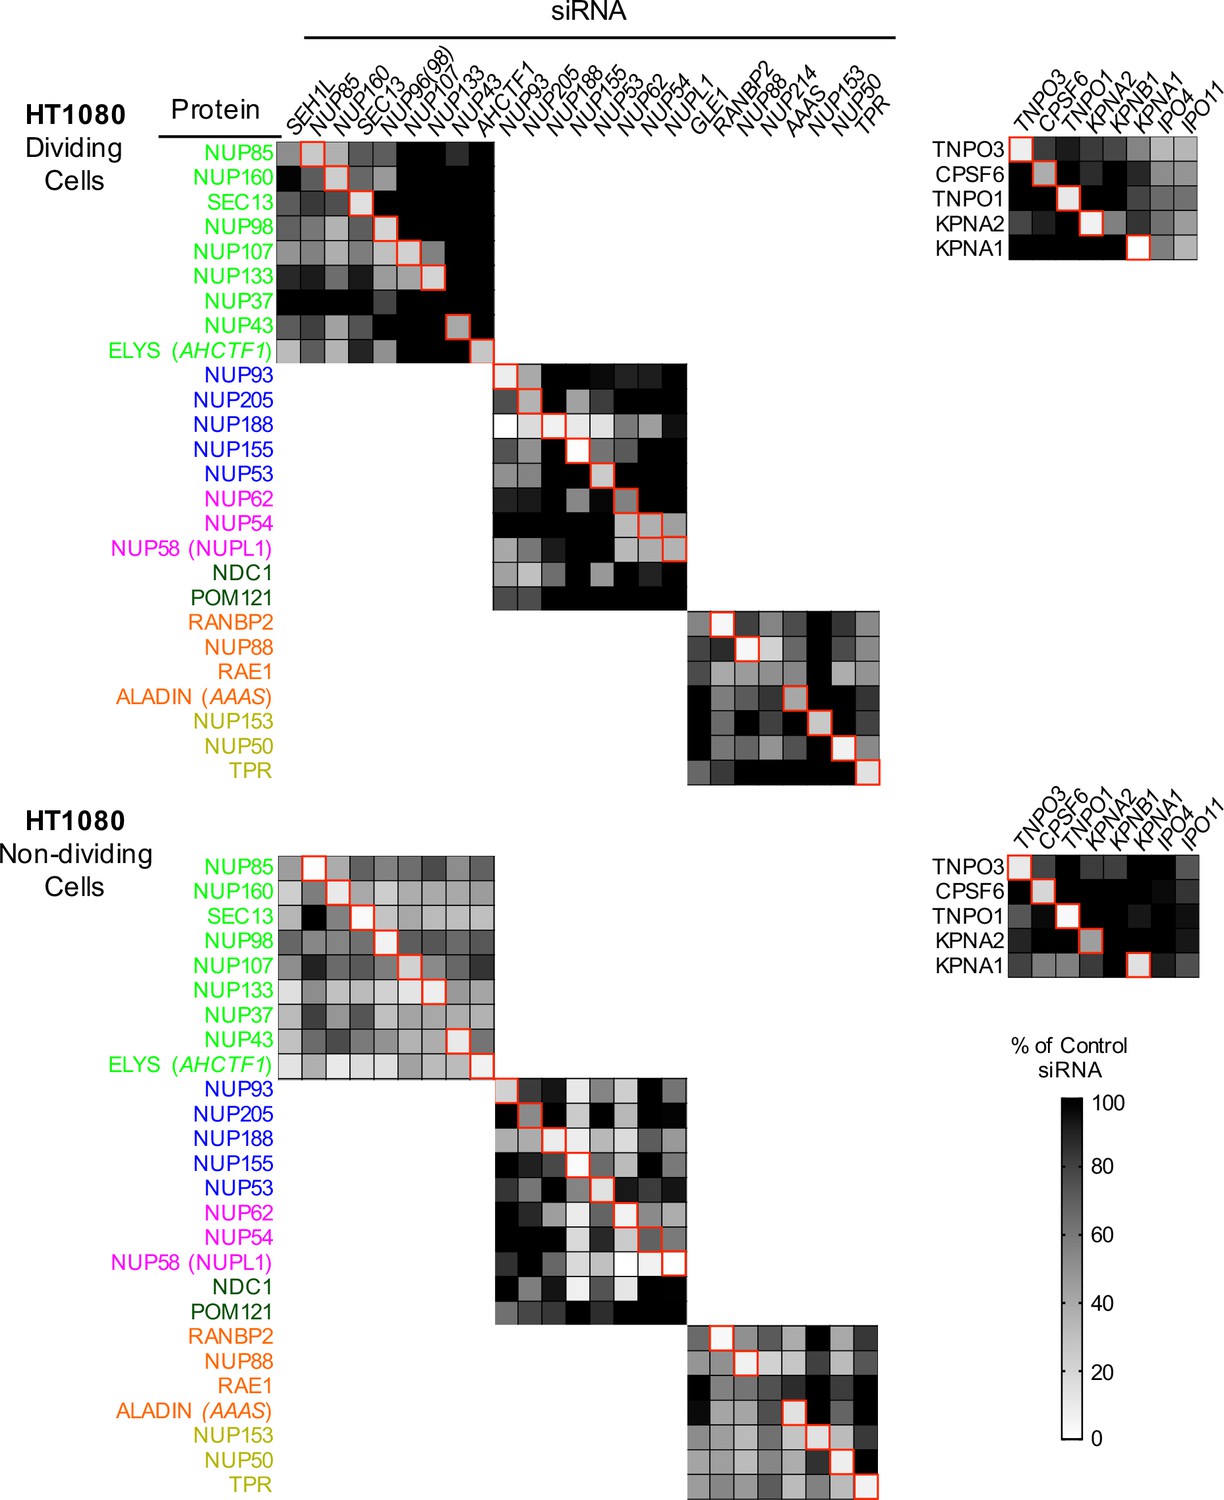
Efficient siRNA-mediated knockdown of Nups and pleiotropic effects of Nup depletion in HT1080 cells.
Heat map representing protein levels of Nups or NTRs (color coded by subcomplex as in Figure 4A) in dividing (top) and non-dividing (bottom) HT1080 cells 64 hr after transfection with the indicated siRNA. Protein levels are expressed as ratios of Nup/NTR expression:LAMIN B1 expression, based on the blots shown in Figure 5—figure supplement 5, normalized to control siRNA transfected cells that were assigned a value of 1.0 (black). Reduced expression is indicated in gray-white, with no detectable expression assigned a zero value (white). Red boxes highlight corresponding antibody-siRNA pairs.
Figure 5—figure supplement 2
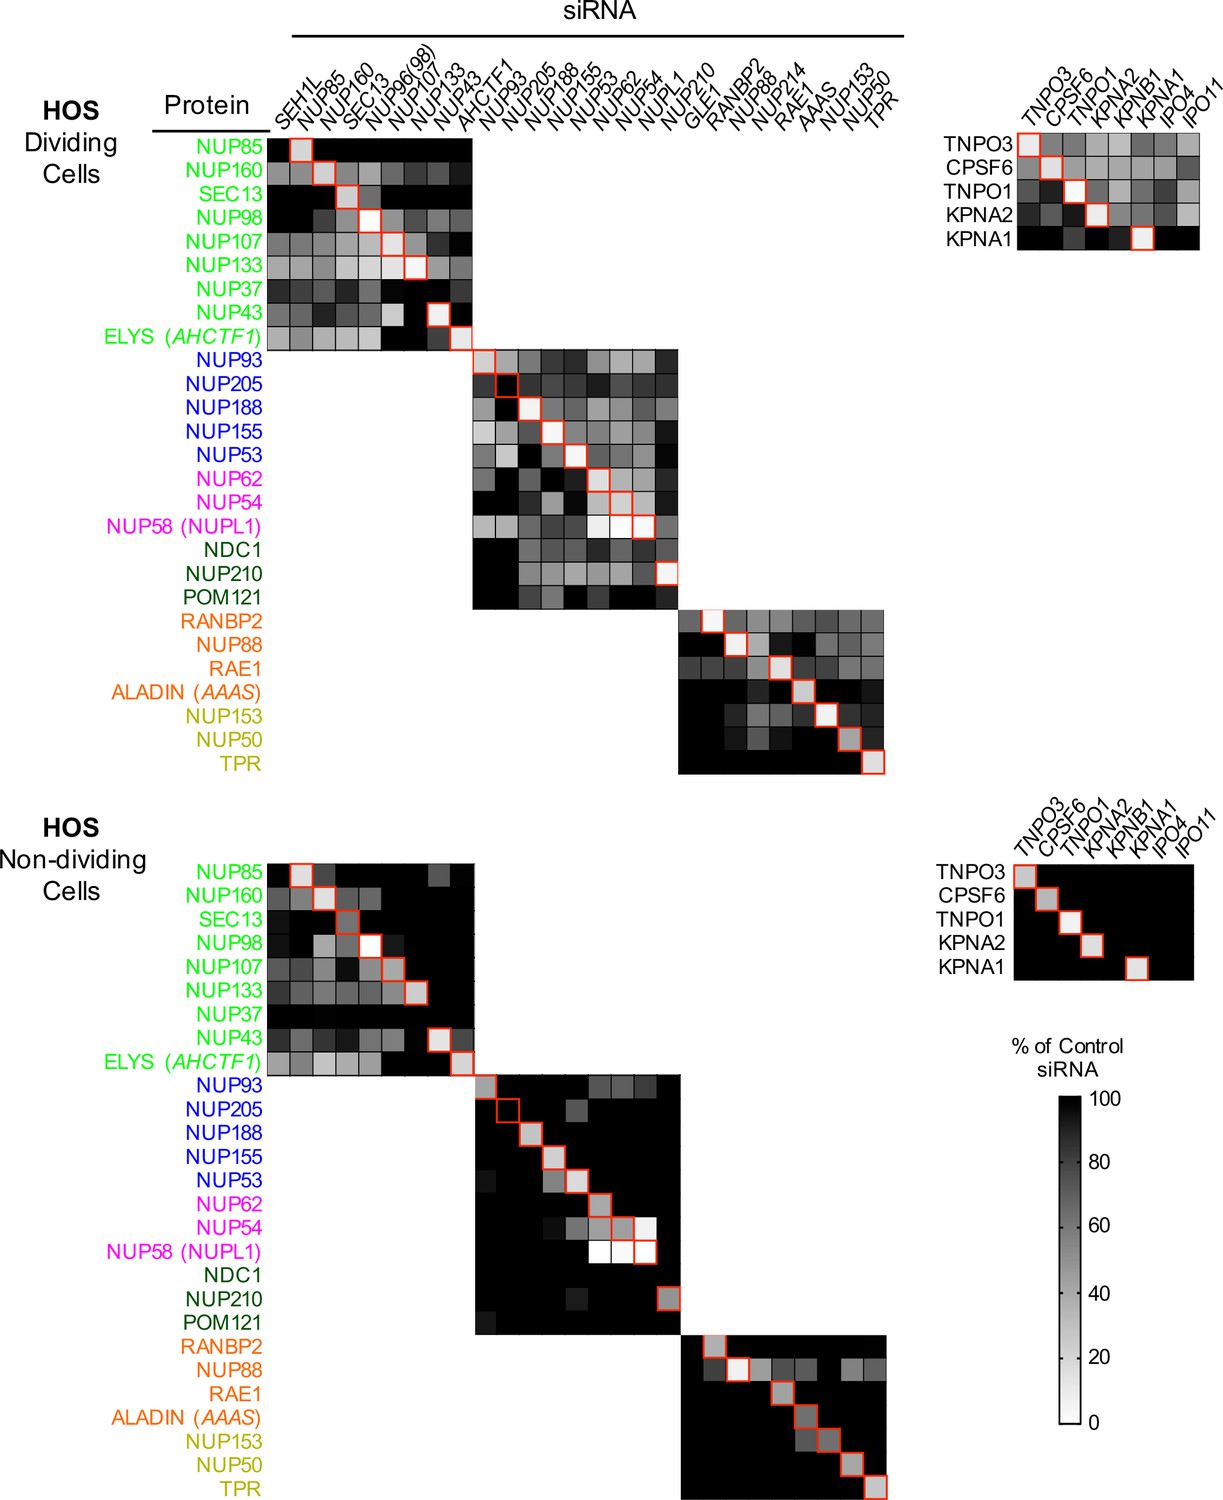
Efficient siRNA-mediated knockdown of Nups and pleiotropic effects of Nup depletion in HOS cells.
Heat map representing protein levels of Nups or NTRs (color coded by subcomplex as in Figure 4A) in dividing (top) and non-dividing (bottom) HOS cells 64 hr after transfection with the indicated siRNA. Protein levels are expressed as ratios of Nup/NTR expression:LAMIN B1 expression, based on the blots shown in Figure 5—figure supplement 6, normalized to control siRNA transfected cells that were assigned a value of 1.0 (black). Reduced expression is indicated in gray-white, with no detectable expression assigned a zero value (white). Red boxes highlight corresponding antibody-siRNA pairs.
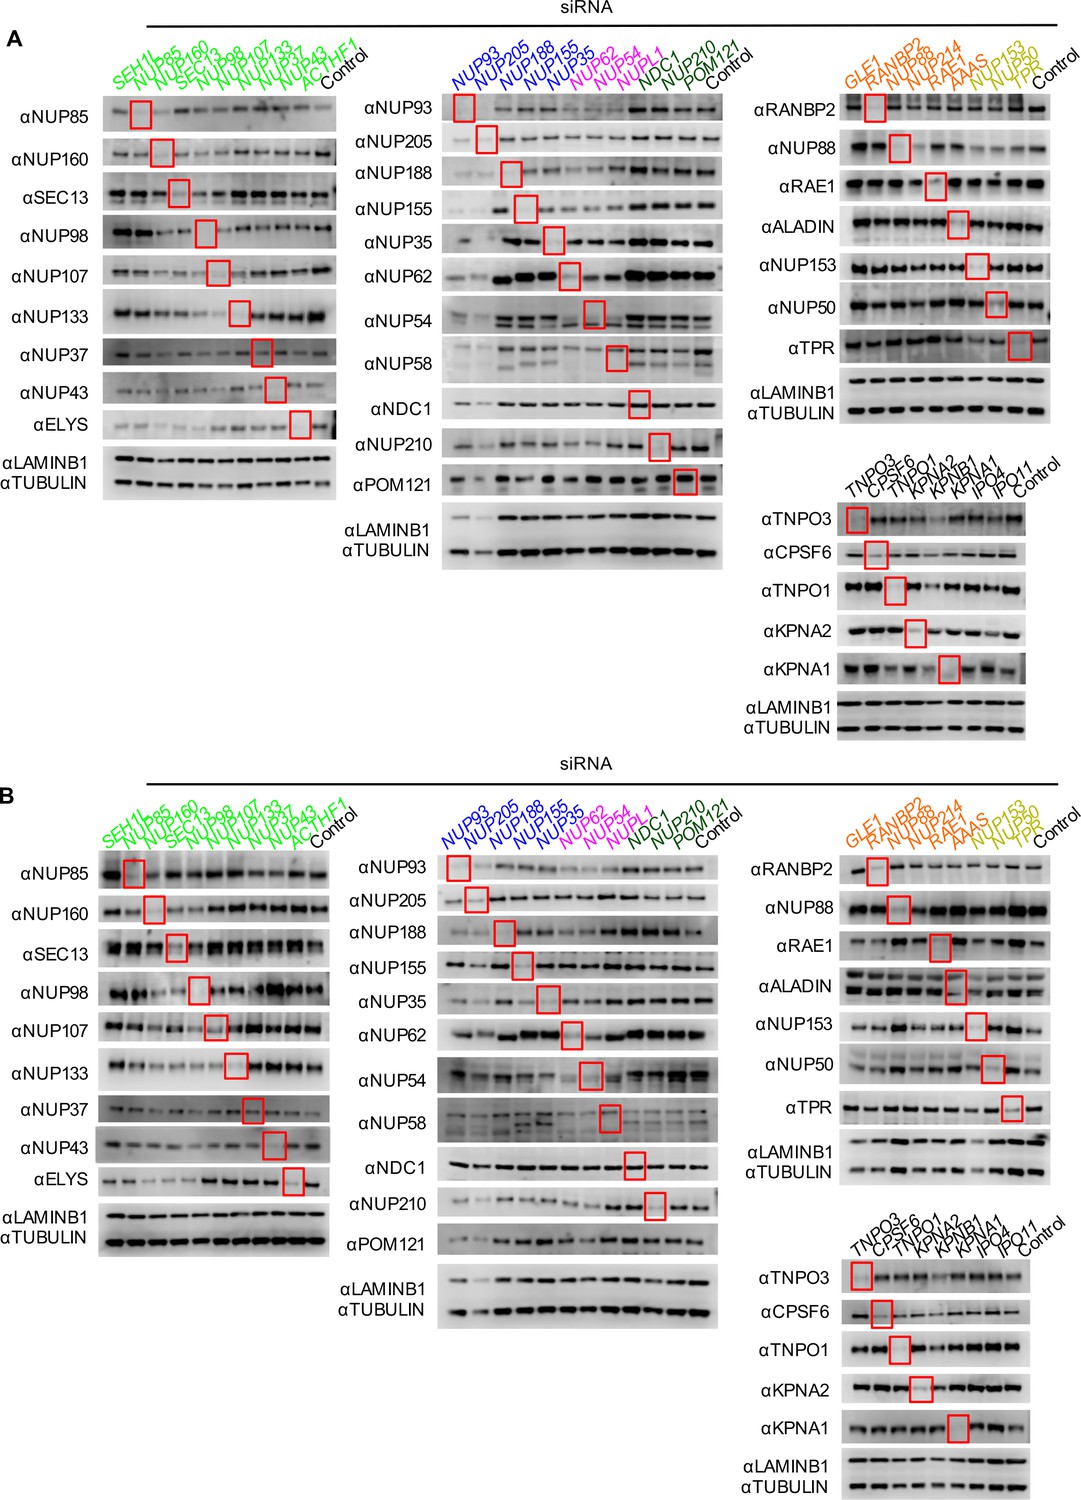
Figure 5—figure supplement 3
Knockdown of Nups and NTRs in dividing HeLa cells.
Western blot analysis of Nup and NTR expression levels in HeLa cells stably transduced with doxycycline-inducible MX2 64 hr after transfection with the indicated siRNA color coded by subcomplex as in Figure 4A. Red boxes highlight lanes for corresponding antibody-siRNA pairs. Bands for each Nup/NTR correspond to those indicated in Figure 2. Each blot was generated from an experiment in which the effect of siRNA knockdown on the subcellular localization of MX2 and Nups, as well as on WT HIV-1 infection was similar to that shown below. The complete array of blots was conducted once, although randomly selected blotting experiments carried out in triplicate (approximately 10), as well as infectivity data indicated both consistent levels of knockdown and pleiotropic effects across experiments.
Figure 5—figure supplement 4
Knockdown of Nups and NTRs in non-dividing HeLa cells.
Western blot analysis of Nup and NTR expression levels in growth arrested (aphidicolin treated) HeLa cells stably transduced with doxycycline-inducible MX2 64 hr after transfection with the indicated siRNA color coded by subcomplex as in Figure 4A. Red boxes highlight lanes for corresponding antibody-siRNA pairs. Bands for each Nup/NTR correspond to those indicated in Figure 2. Each blot is generated from an experiment in which the effect of siRNA knockdown on WT HIV-1 infection was similar to that shown in . The complete array of blots was conducted once, although randomly selected blotting experiments carried out in triplicate (approximately 10), as well as infectivity data indicated both consistent levels of knockdown and pleiotropic effects across experiments.
Figure 5—figure supplement 5
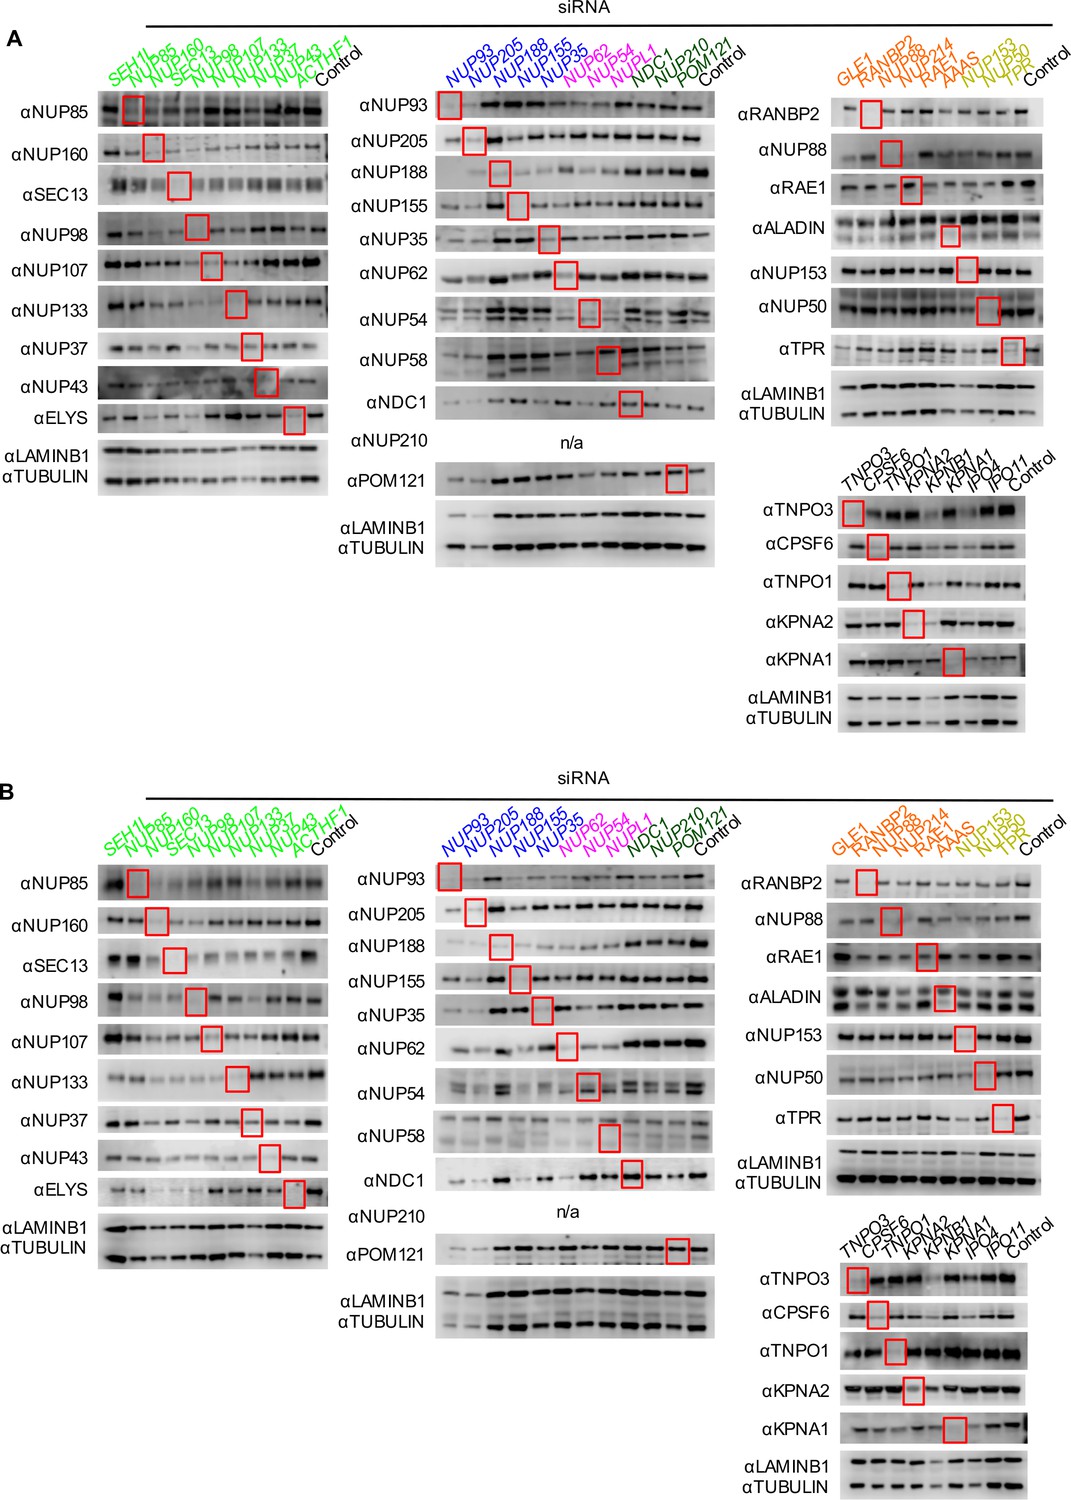
Knockdown of Nups and NTRs in HT1080 cells.
Western blot analysis of Nup and NTR expression levels in A) dividing and B) non-dividing (aphidicolin treated) HT1080 cells stably transduced with doxycycline-inducible MX2 64 hr after transfection with the indicated siRNA color coded by subcomplex as in Figure 4A. Red boxes highlight lanes for corresponding antibody-siRNA pairs. (n/a – not tested since HT1080 cells do not express NUP210, see Figure 2—figure supplement 1). Bands for each blot correspond to those indicated in Figure 2. Each blot was generated from an experiment in which the effect of siRNA knockdown on the subcellular localization of MX2 and Nups, as well as on WT HIV-1 infection was similar to that shown below. The complete array of blots was conducted once, although blotting experiments carried out in triplicate (approximately 5), as well as infectivity data indicated both consistent levels of knockdown and pleiotropic effects across experiments.
Figure 5—figure supplement 6
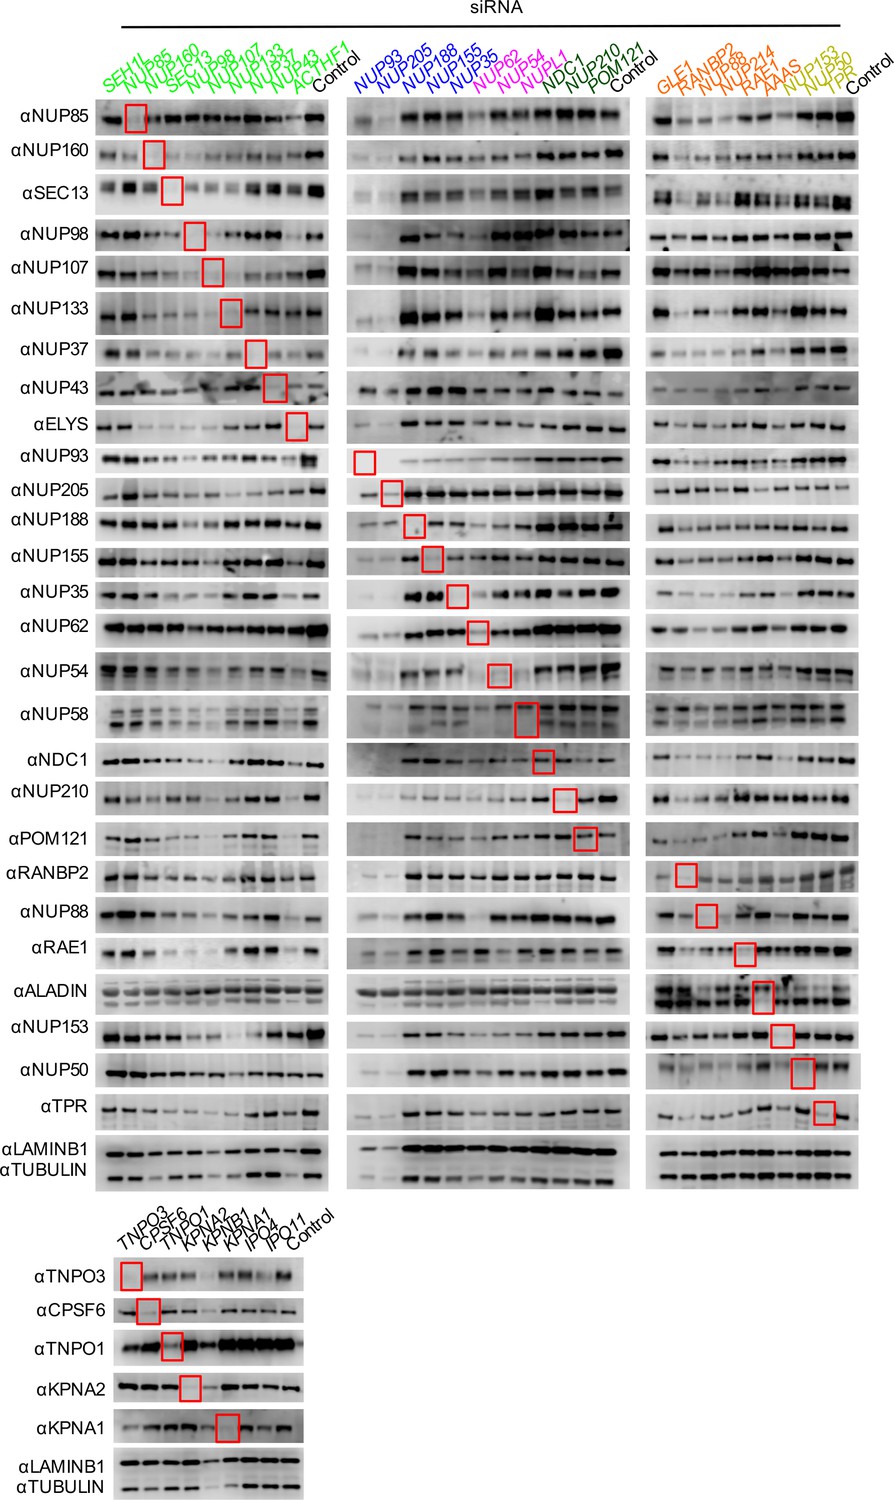
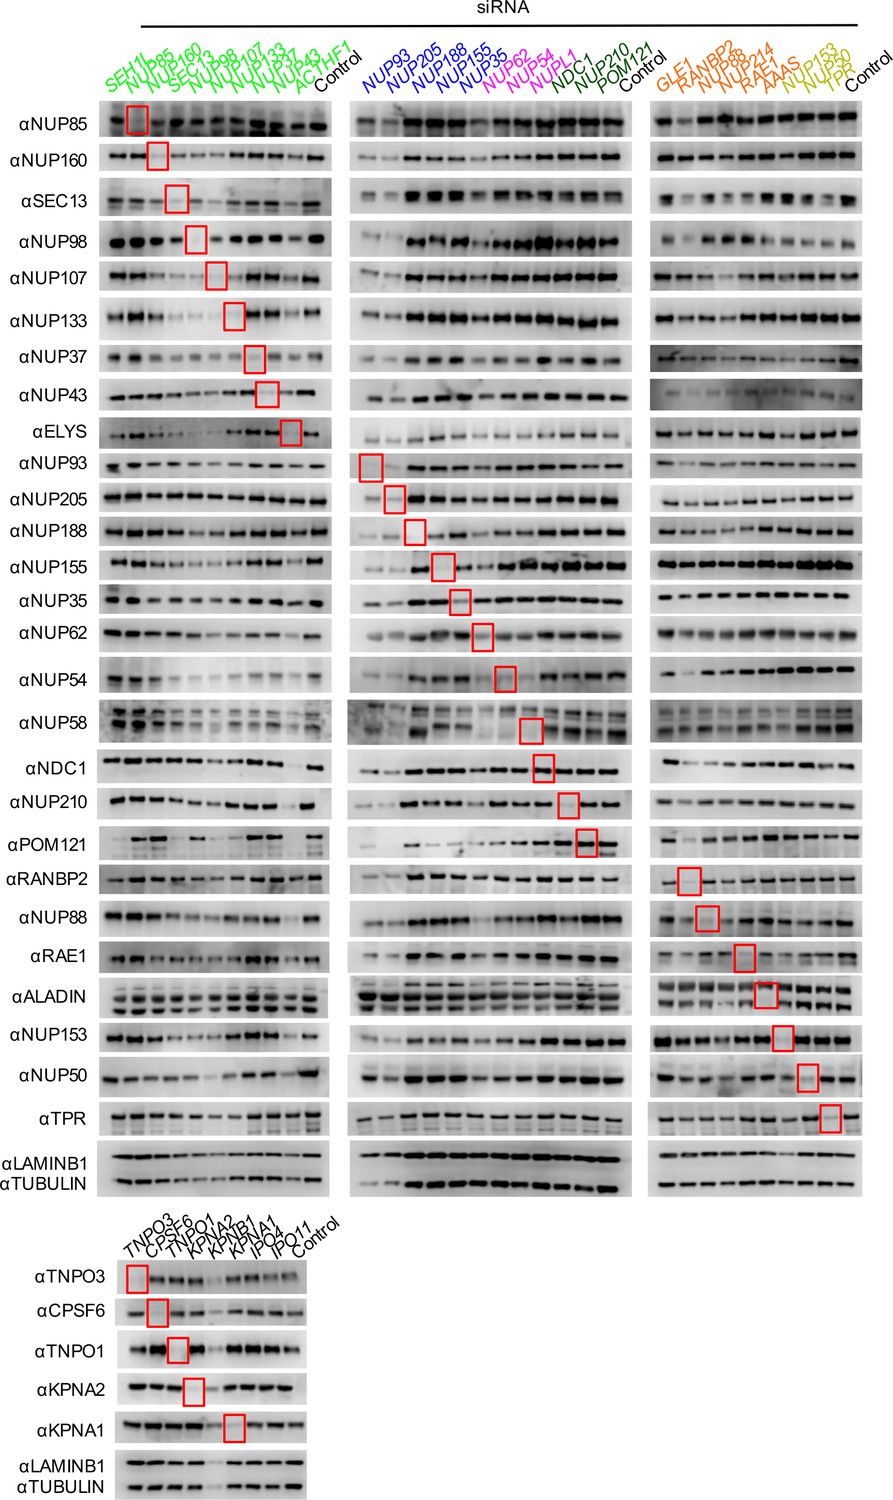
Knockdown of Nups and NTRs in HOS cells.
Western blot analysis of Nup and NTR expression levels in A) dividing and B) non-dividing (aphidicolin treated) HOS cells 64 hr after transfection with the indicated siRNA color coded by subcomplex as in Figure 4A. Red boxes highlight lanes for corresponding antibody-siRNA pairs. Bands for each blot correspond to those indicated in Figure 2. Each blot was generated from an experiment in which the effect of siRNA knockdown on WT HIV-1 infection was similar to that shown below. The complete array of blots was conducted once, although blotting experiments carried out in triplicate (approximately 5), as well as infectivity data indicated both consistent levels of knockdown and pleiotropic effects across experiments.
Figure 5—figure supplement 7
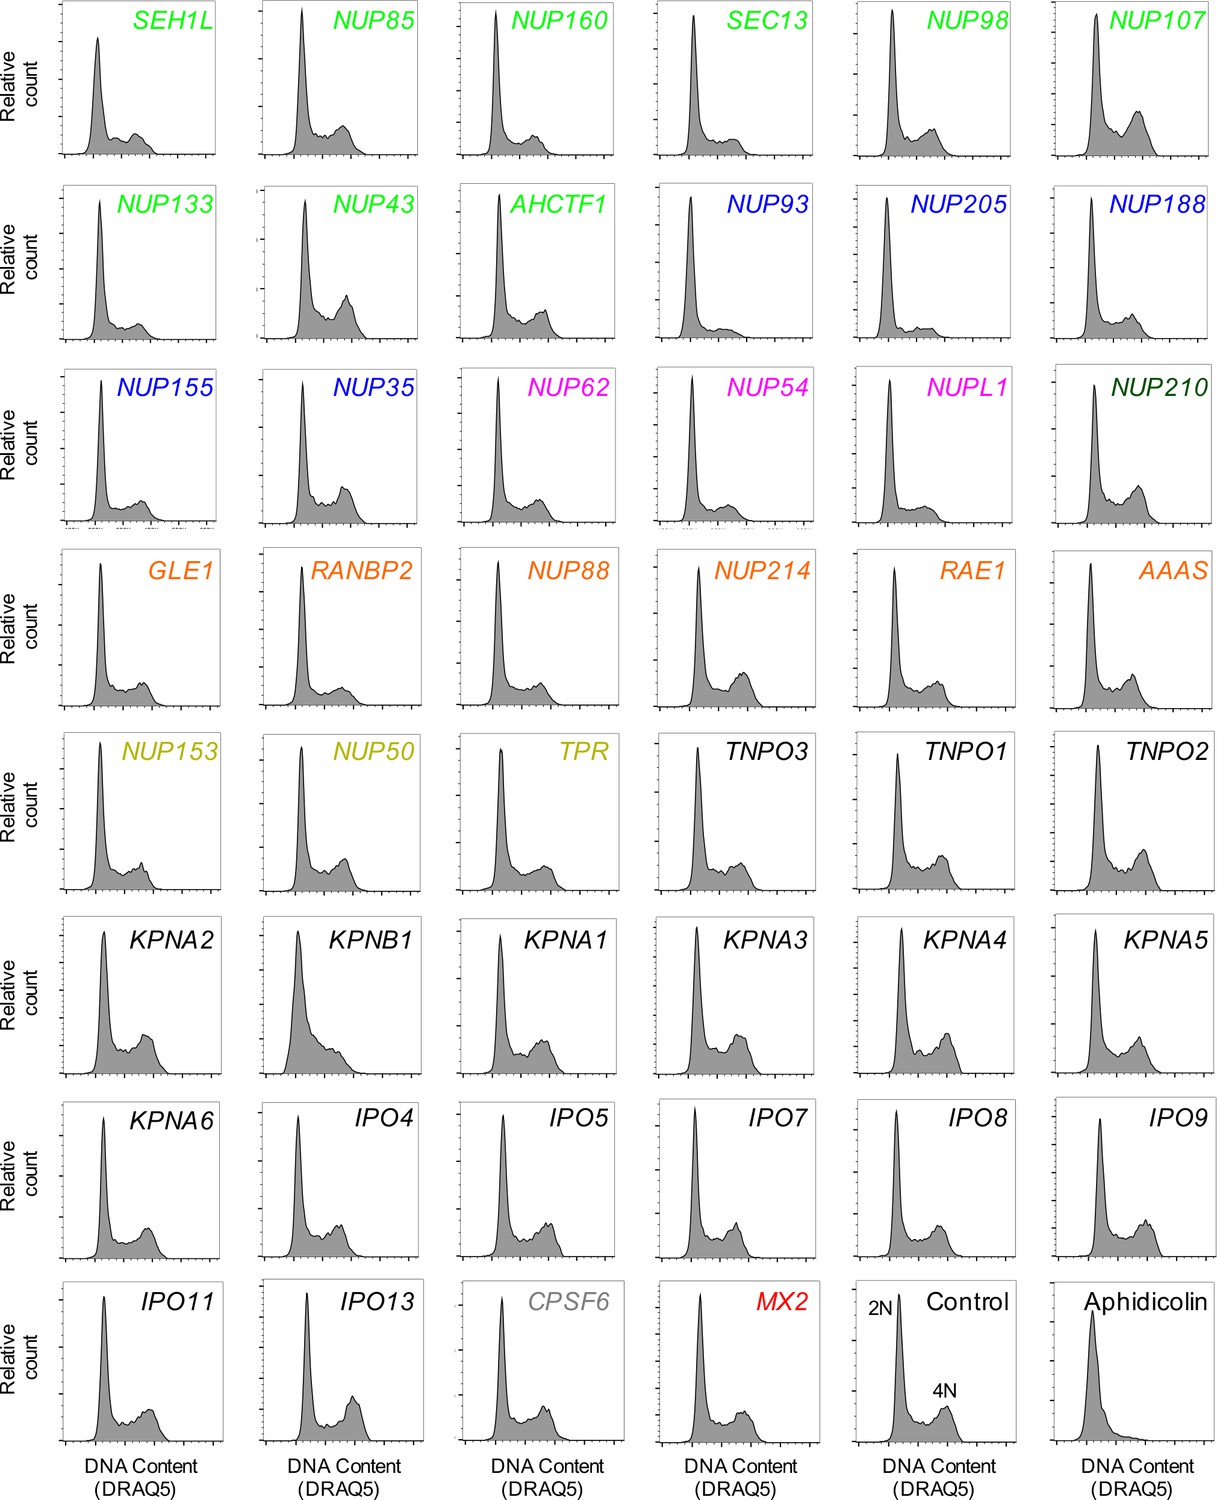
Cell-cycle profile of HOS cells following transfection with Nup/NTR targeting siRNA.
Cell-cycle profile of HOS cells 64 hr after transfection with the indicated siRNA or following aphidicolin treatment, color coded by subcomplex as in Figure 4A. DNA content was determined by flow cytometry following staining with the DNA dye DRAQ5. For each plot, 3000–12000 events were collected. Representative of two independent experiments. 2N and 4N DNA content are indicated for the Control siRNA transfected sample.
Figure 5—figure supplement 8
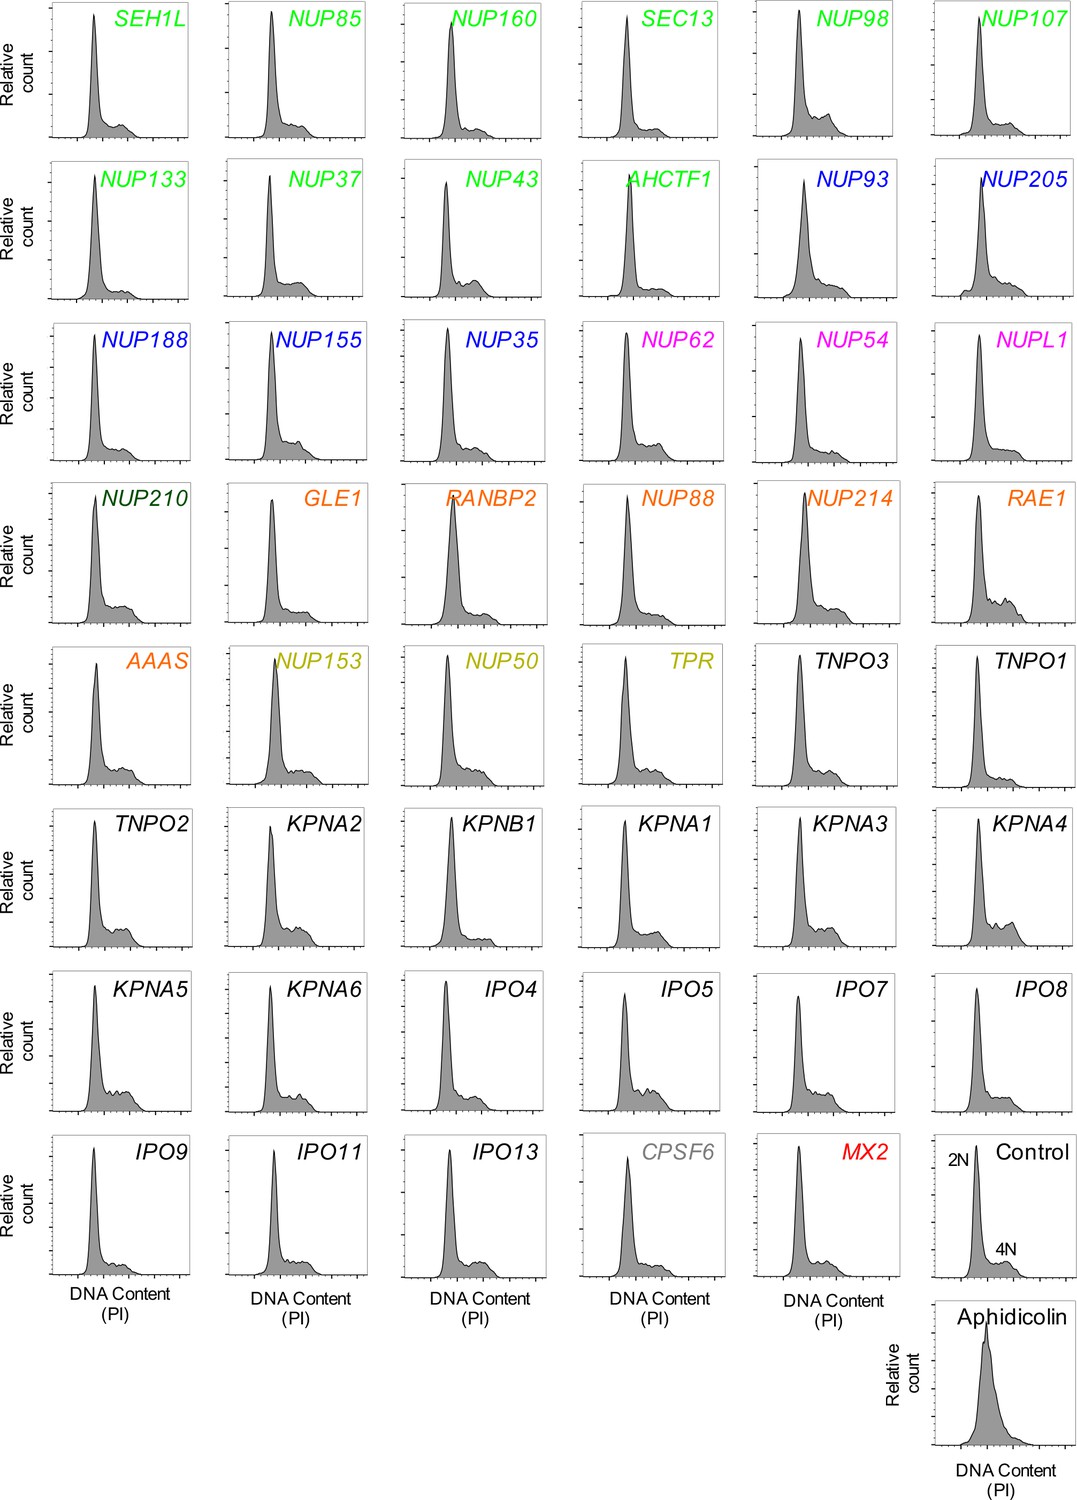
Cell-cycle profile of HeLa cells following transfection with Nup/NTR targeting siRNA.
Cell-cycle profile of HeLa cells 64 hr after transfection with the indicated siRNA or following aphidicolin treatment, color coded by subcomplex as in Figure 4A. DNA content was determined by flow cytometry following staining with the DNA dye propidium iodide (PI). For each plot, 3000–12000 events per sample were collected. Representative of two independent experiments. 2N and 4N DNA content are indicated for the Control siRNA transfected sample.
Figure 6 with 20 supplements
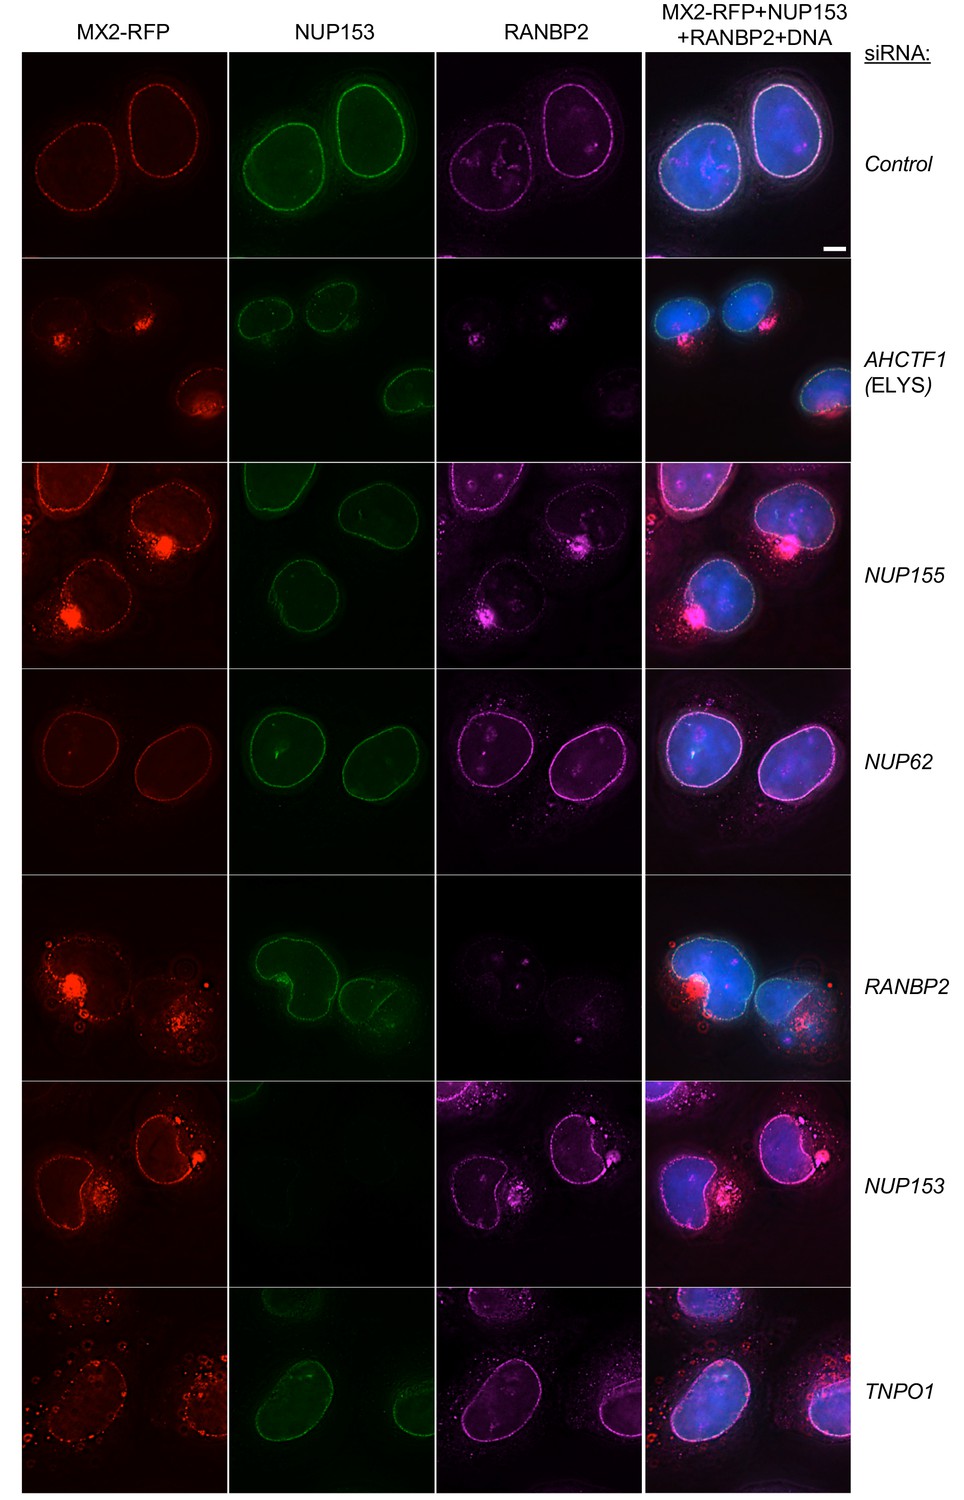
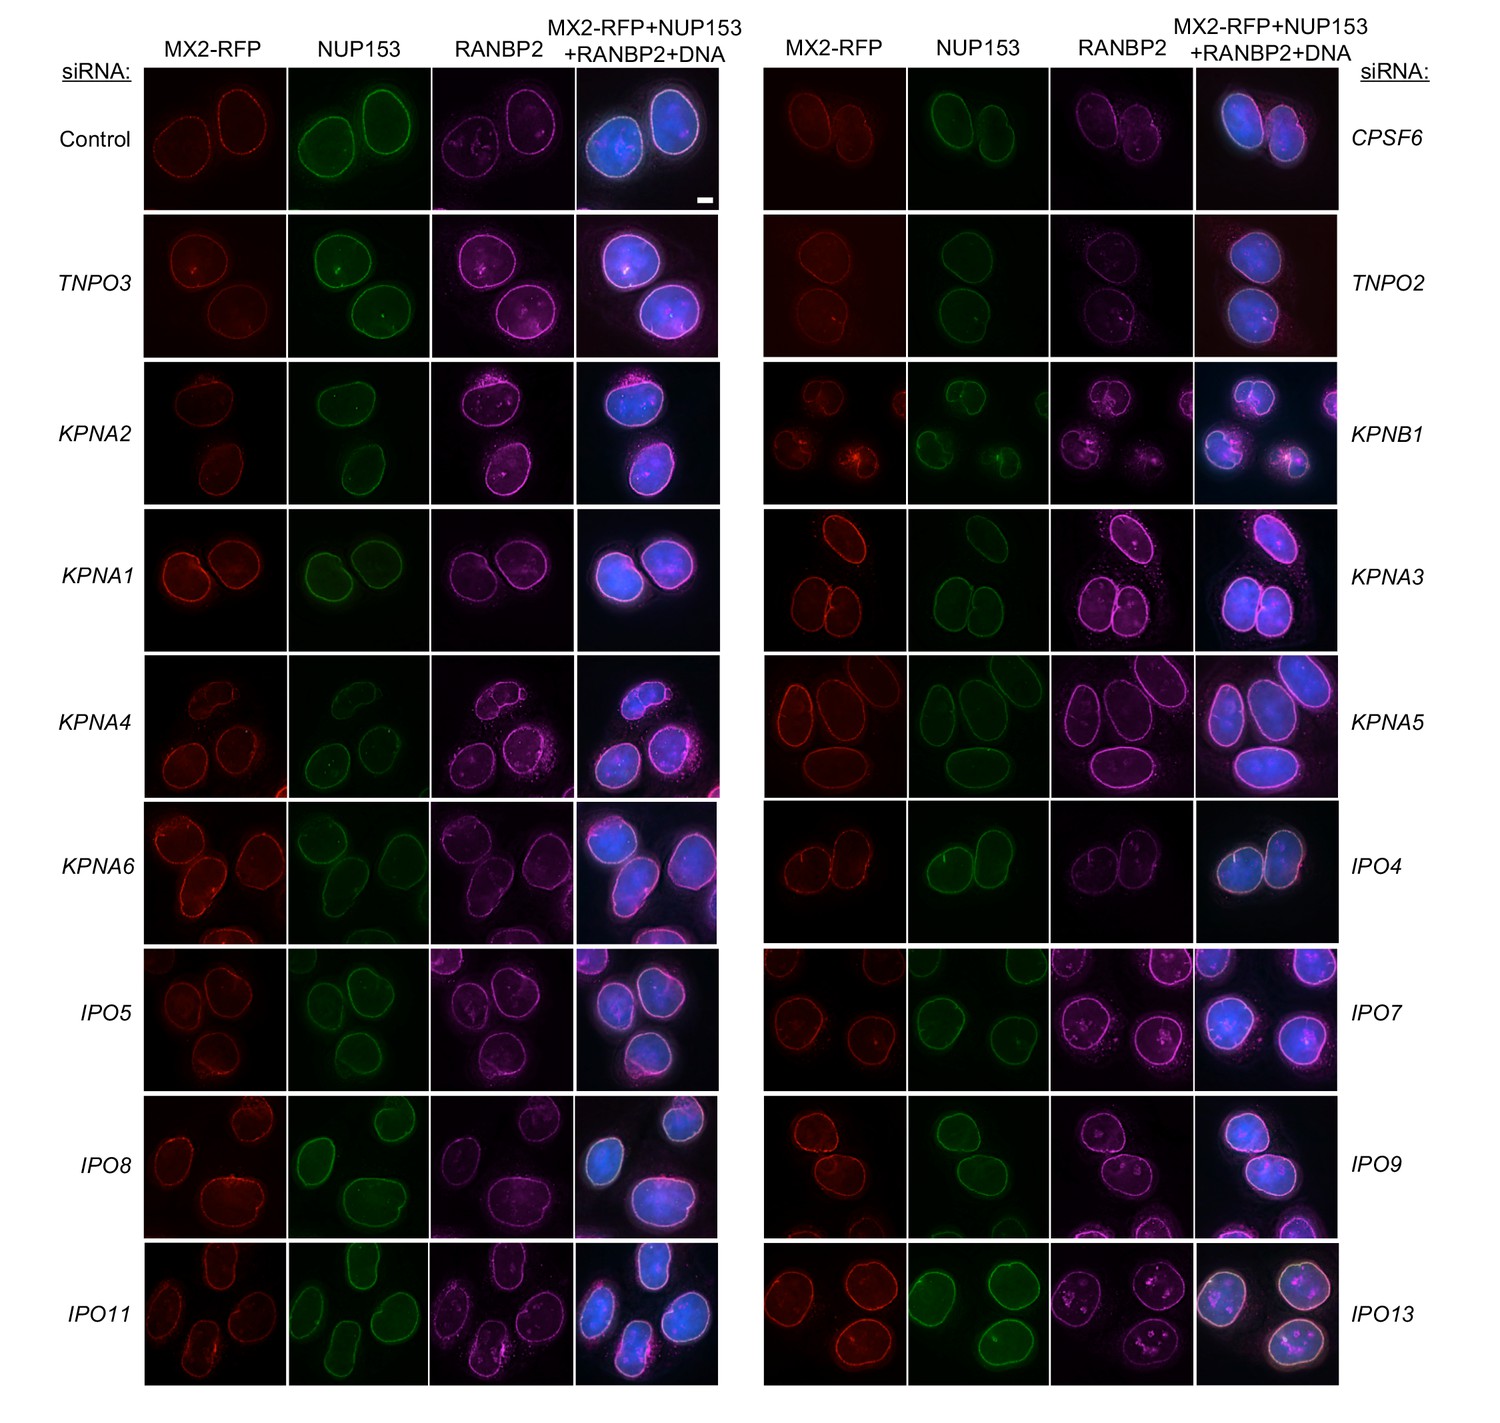
Effects of depleting individual Nups on NPC integrity and function, and MX2 localization.
Deconvolution microscopic images (single optical sections) of HeLa cells expressing MX2-RFP (red, stably transduced with a doxycycline inducible vector), immunoflourescently stained NUP153 (green), RANBP2 (purple), and Hoechst-stained DNA. Cells were fixed and stained 64 hr after transfection with the indicated siRNA. Optical sections are approximately through the center of the vertical dimension on the nucleus. Scale bar = 5 μm. Representative of two independent experiments, with at least three images acquired per experiment.
Figure 6—figure supplement 1
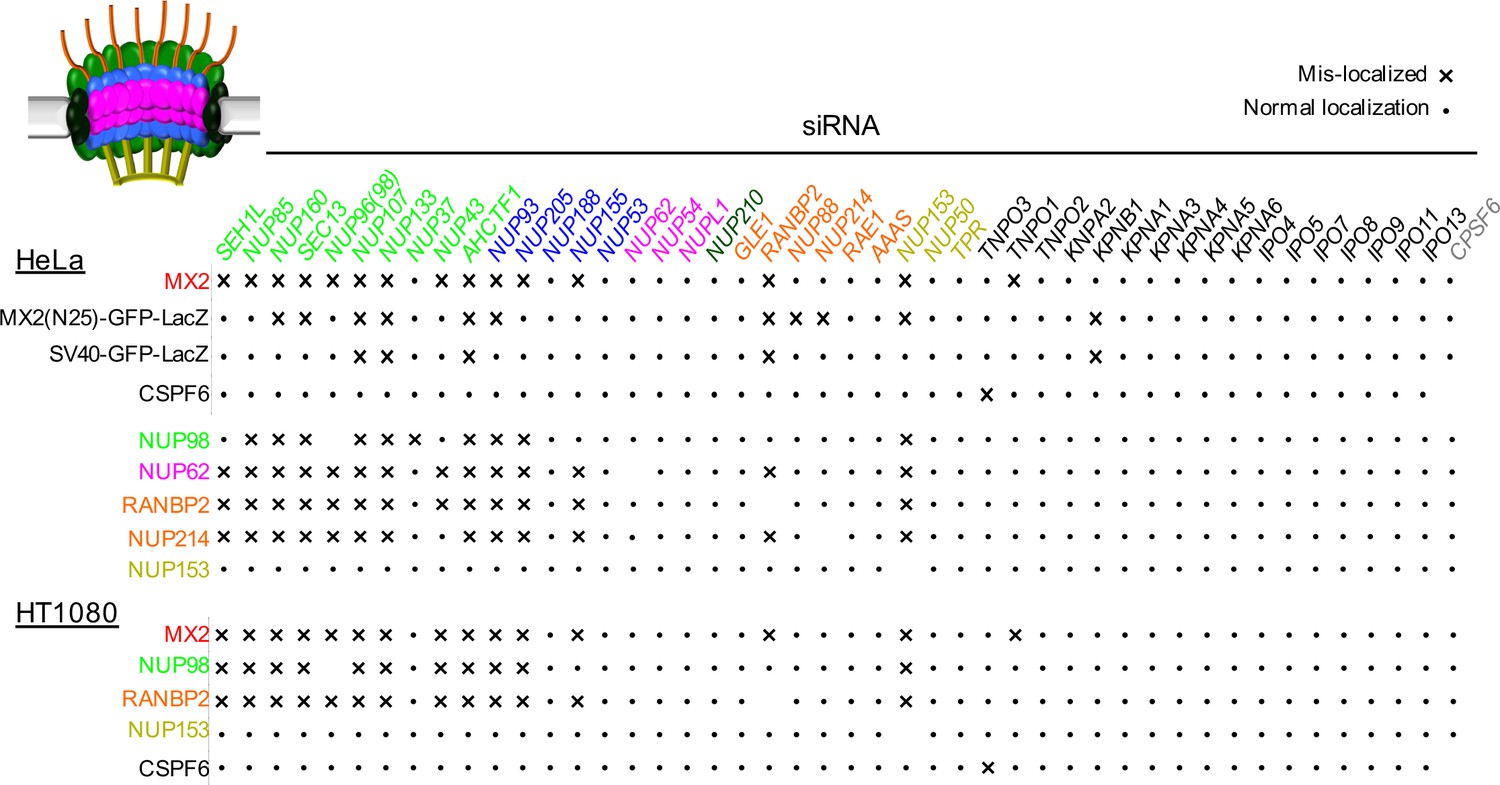
Effects of depleting individual Nups on NPC integrity and function, and MX2 localization.
Summary of the localization of Nups, MX2-RFP, CPSF6-RFP, or NLS-GFP-LacZ fusions upon siRNA transfection of HeLa or HT1080 cells shown in Figure 6, and Figure 6—figure supplements 1–18. Aberrant localization following siRNA transfection in ≥~80% of cells is indicated by an ‘x’ and normal localization is indicated by a dot.
Figure 6—figure supplement 2

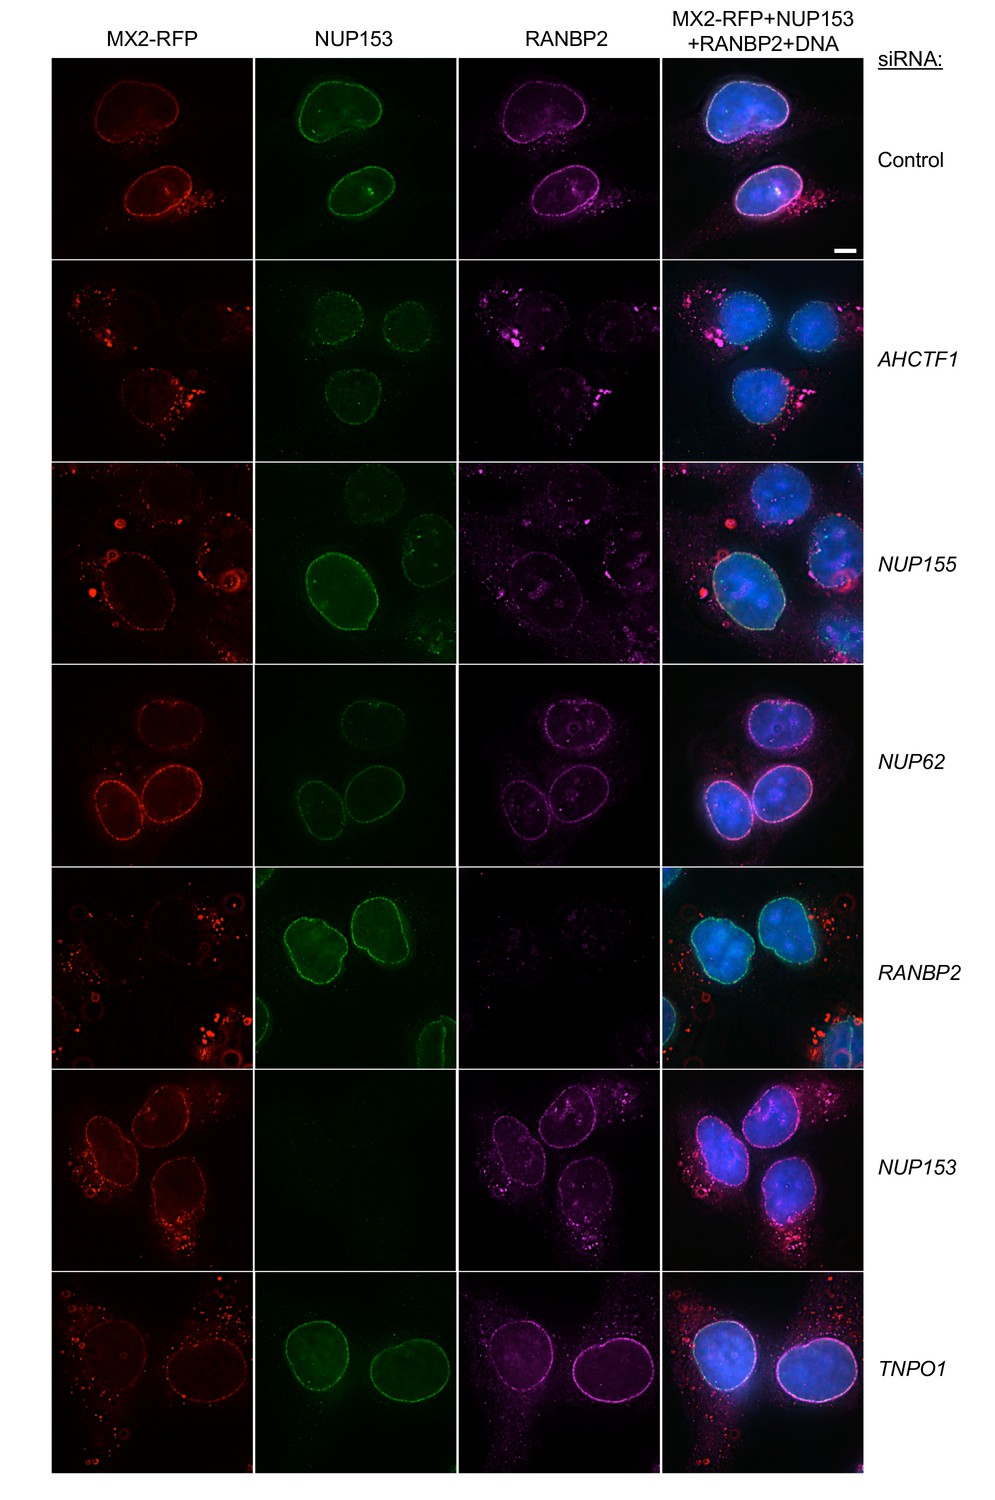
Localization of MX2, NUP153, and RANBP2 in HeLa cells following transfection with Nup/NTR targeting siRNA.
Deconvolution microscopic images (single optical sections) of HeLa cells expressing MX2-RFP (red, stably transduced with a doxycycline inducible vector), immunoflourescently stained NUP153 (green), RANBP2 (purple), and Hoescht-stained DNA. Cells were fixed and stained 64 hr after transfection with the indicated siRNA. Optical sections are approximately through the center of the vertical dimension on the nucleus. Scale bar = 5 μm. Representative of two independent experiments, with at least three images acquired per experiment.
Figure 6—figure supplement 3
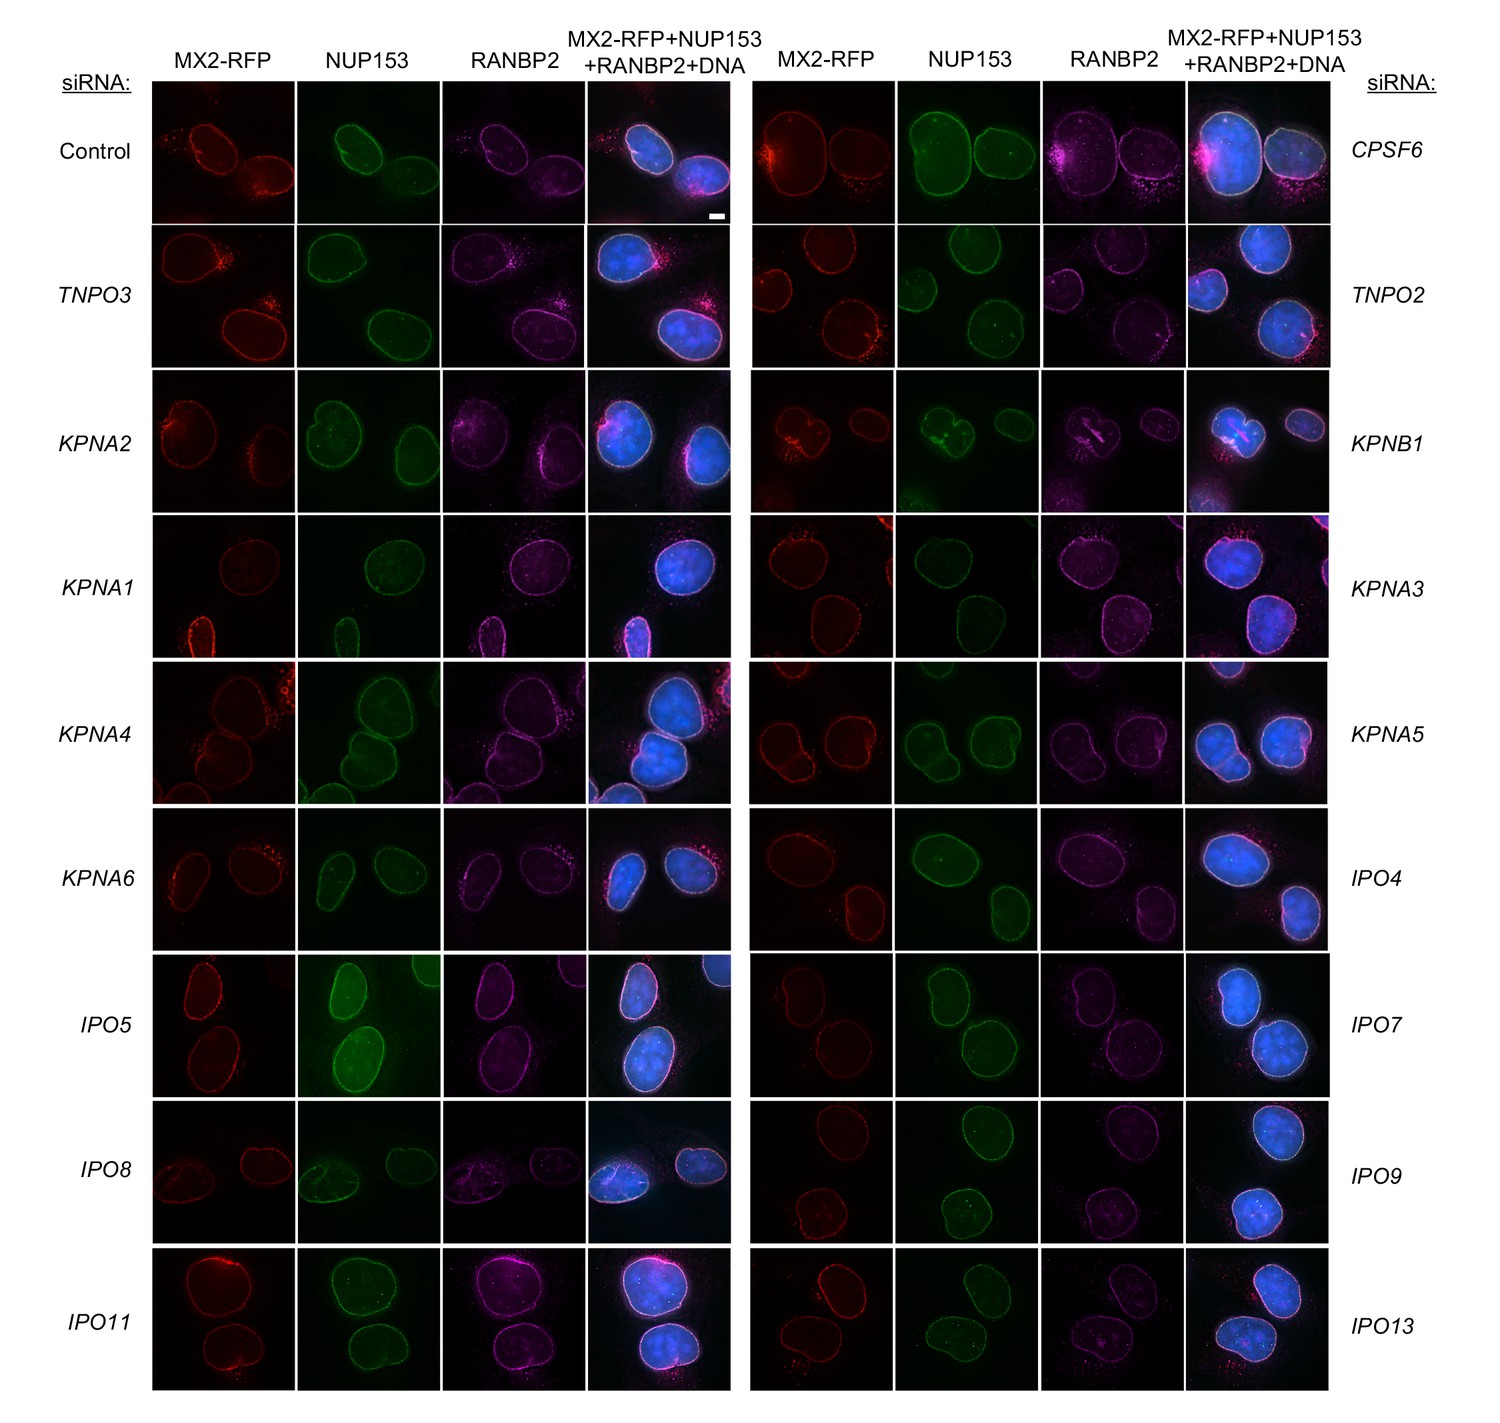
Localization of MX2, NUP153, and RANBP2 in HeLa cells following transfection with Nup/NTR targeting siRNA continued.
Deconvolution microscopic images (single optical sections) of HeLa cells expressing MX2-RFP (red, stably transduced with a doxycycline inducible vector), immunoflourescently stained NUP153 (green), RANBP2 (purple), and Hoescht-stained DNA. Cells were fixed and stained 64 hr after transfection with the indicated siRNA. Optical sections are approximately through the center of the vertical dimension on the nucleus. Scale bar = 5 μm. Representative of two independent experiments, with at least three images acquired per experiment.
Figure 6—figure supplement 4
Localization of MX2, NUP153, and RANBP2 in HT1080 cells following transfection with Nup/NTR targeting siRNA.
Deconvolution microscopic images (single optical sections) of HT1080 cells expressing MX2-RFP (red, stably transduced with a doxycycline inducible vector), immunoflourescently stained NUP153 (green), RANBP2 (purple), and Hoescht-stained DNA. Cells were fixed and stained 64 hr after transfection with the indicated siRNA. Optical sections are approximately through the center of the vertical dimension on the nucleus. Scale bar = 5 μm. Representative of two independent experiments, with at least three images acquired per experiment.
Figure 6—figure supplement 5

Localization of MX2, NUP153, and RANBP2 in HT1080 cells following transfection with Nup/NTR targeting siRNA continued.
Deconvolution microscopic images (single optical sections) of HT1080 cells expressing MX2-RFP (red, stably transduced with a doxycycline inducible vector), immunoflourescently stained NUP153 (green), RANBP2 (purple), and Hoescht-stained DNA. Cells were fixed and stained 64 hr after transfection with the indicated siRNA. Optical sections are approximately through the center of the vertical dimension on the nucleus. Scale bar = 5 μm. Representative of two independent experiments, with at least three images acquired per experiment.
Figure 6—figure supplement 6
Localization of MX2, NUP153, and RANBP2 in HT1080 cells following transfection with Nup/NTR targeting siRNA continued.
Deconvolution microscopic images (single optical sections) of HT1080 cells expressing MX2-RFP (red, stably transduced with a doxycycline inducible vector), immunoflourescently stained NUP153 (green), RANBP2 (purple), and Hoescht-stained DNA. Cells were fixed and stained 64 hr after transfection with the indicated siRNA. Optical sections are approximately through the center of the vertical dimension on the nucleus. Scale bar = 5 μm. Representative of two independent experiments, with at least three images acquired per experiment.
Figure 6—figure supplement 7
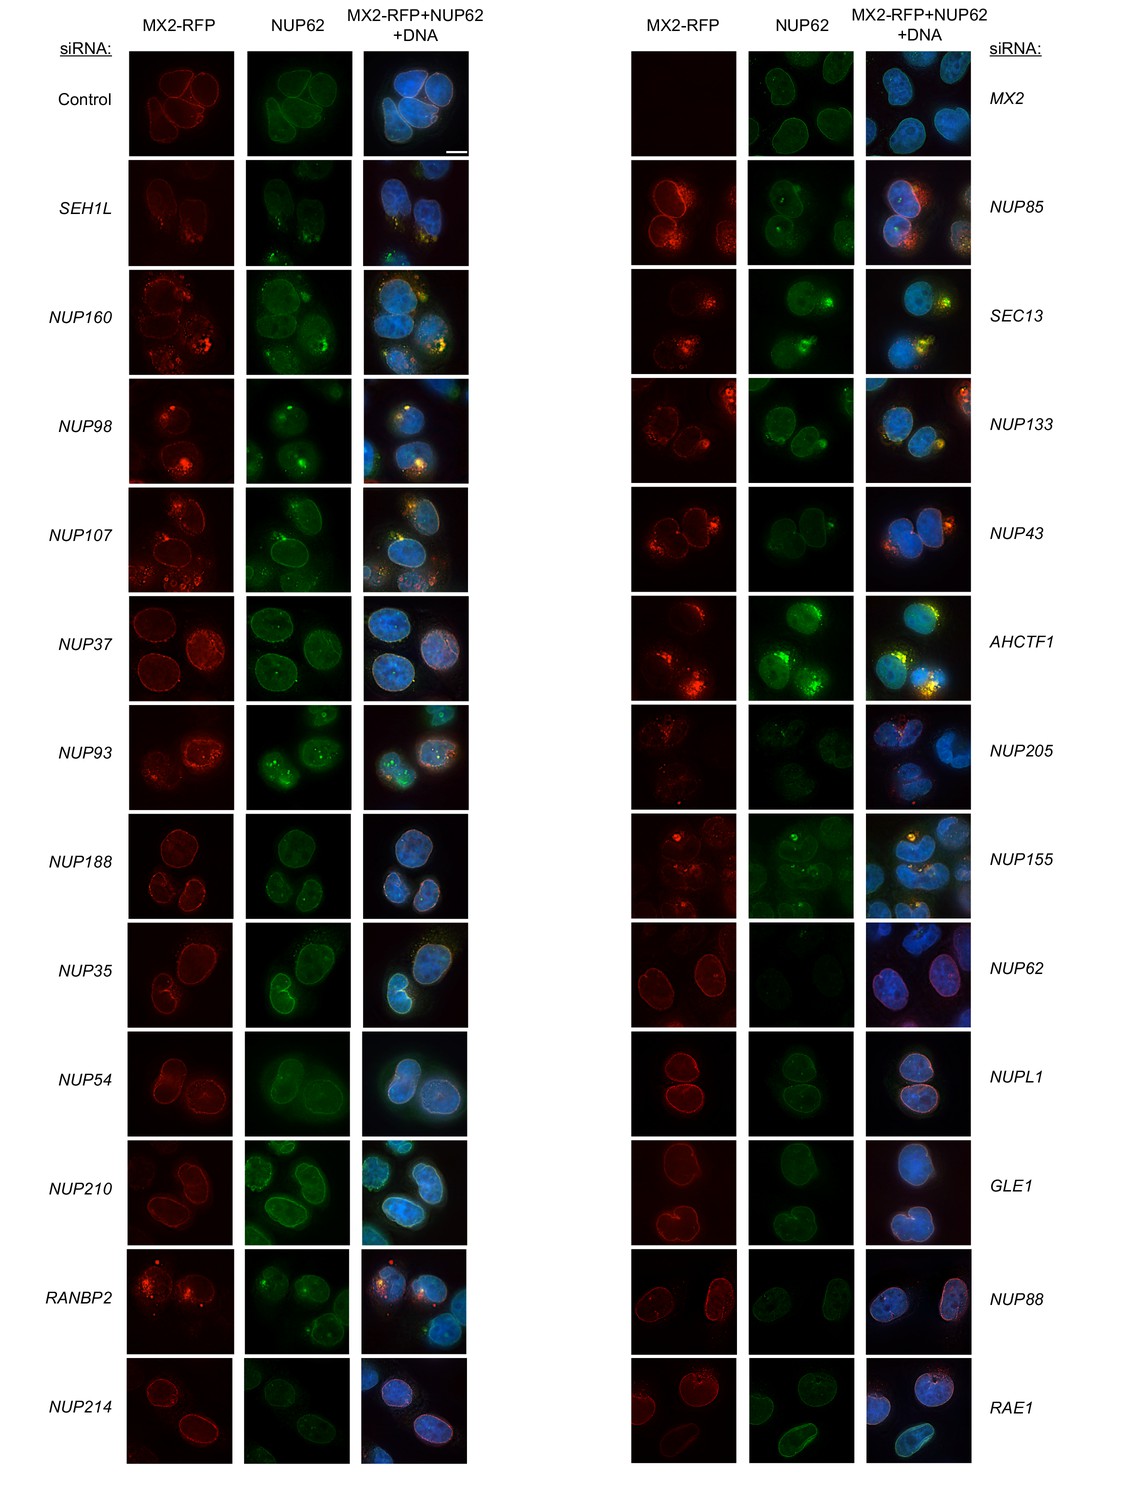
Localization of MX2 and NUP62 following transfection with Nup/NTR targeting siRNA.
Deconvolution microscopic images (single optical sections) of HeLa cells expressing MX2-RFP (red, stably transduced with a doxycycline inducible vector), immunoflourescently stained NUP62 (green), and Hoechst-stained DNA. Cells were fixed and stained 64 hr after transfection with the indicated siRNA. Optical sections are approximately through the center of the vertical dimension on the nucleus. Scale bar = 10 μm. Representative of two independent experiments, with at least three images acquired per experiment.
Figure 6—figure supplement 8
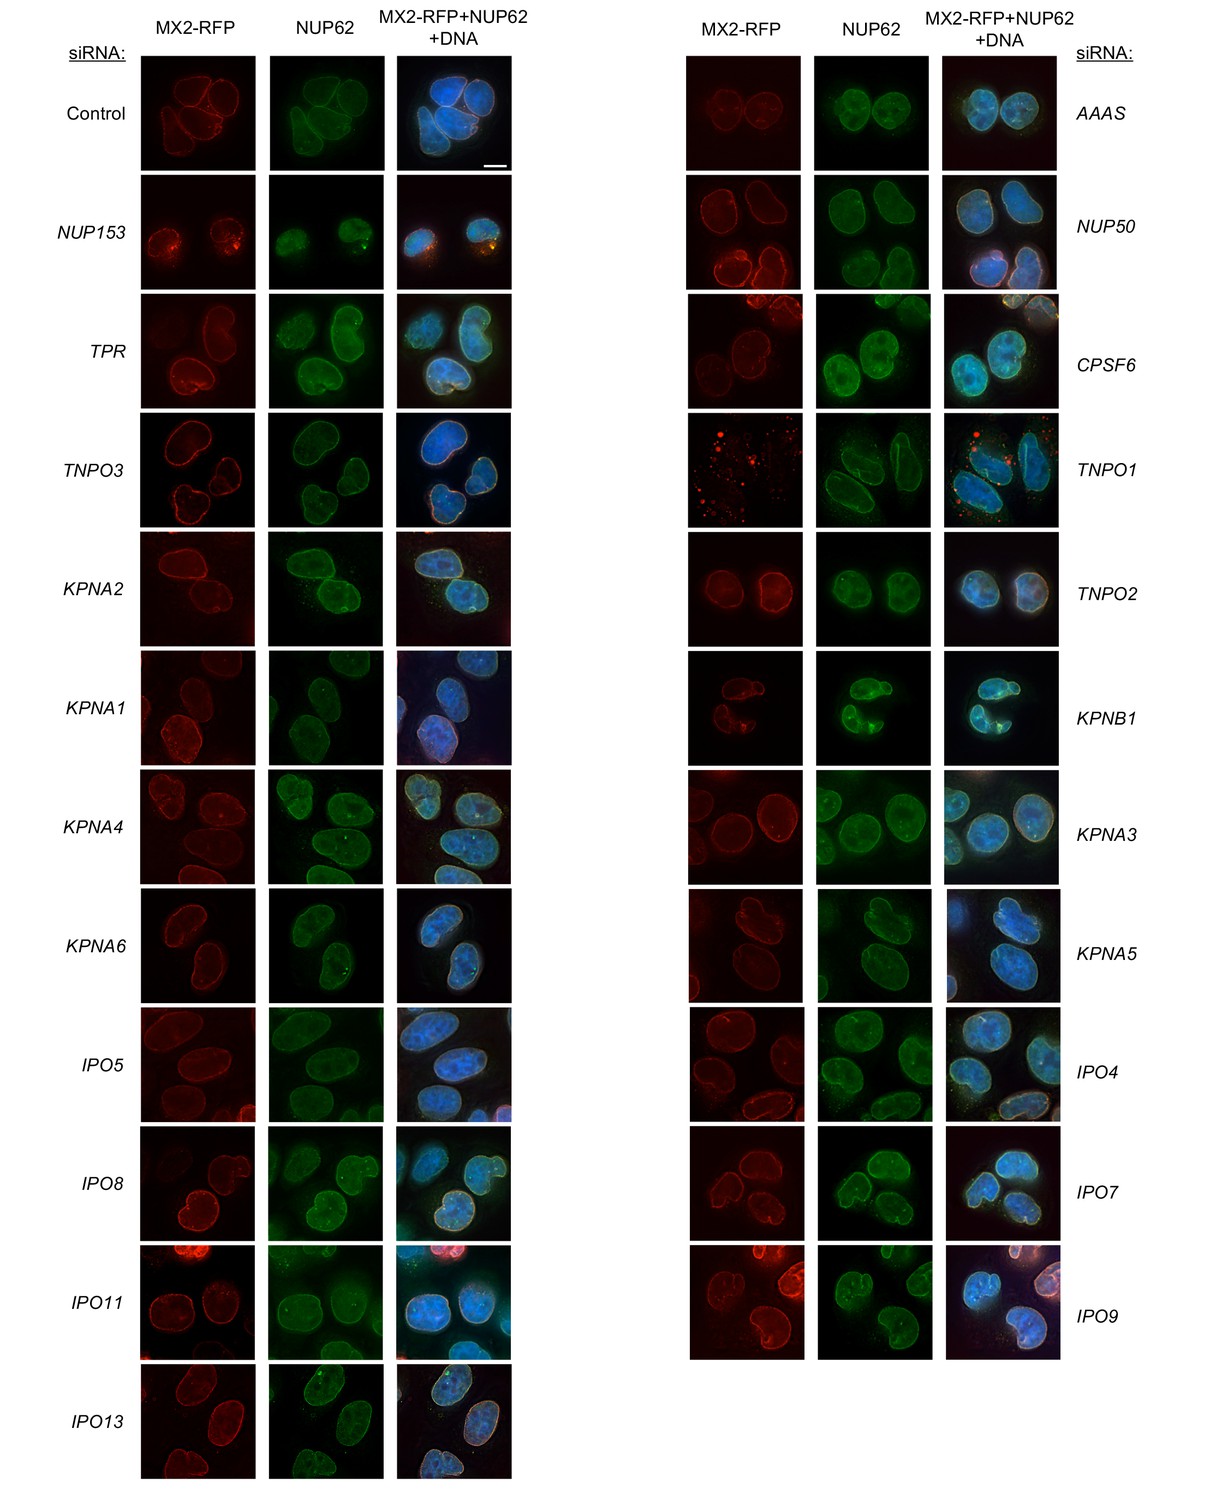
Localization of MX2 and NUP62 following transfection with Nup/NTR targeting siRNA continued.
Deconvolution microscopic images (single optical sections) of HeLa cells expressing MX2-RFP (red, stably transduced with a doxycycline inducible vector), immunoflourescently stained NUP62 (green), and Hoechst-stained DNA. Cells were fixed and stained 64 hr after transfection with the indicated siRNA. Optical sections are approximately through the center of the vertical dimension on the nucleus. Scale bar = 10 μm. Representative of two independent experiments, with at least three images acquired per experiment.
Figure 6—figure supplement 9
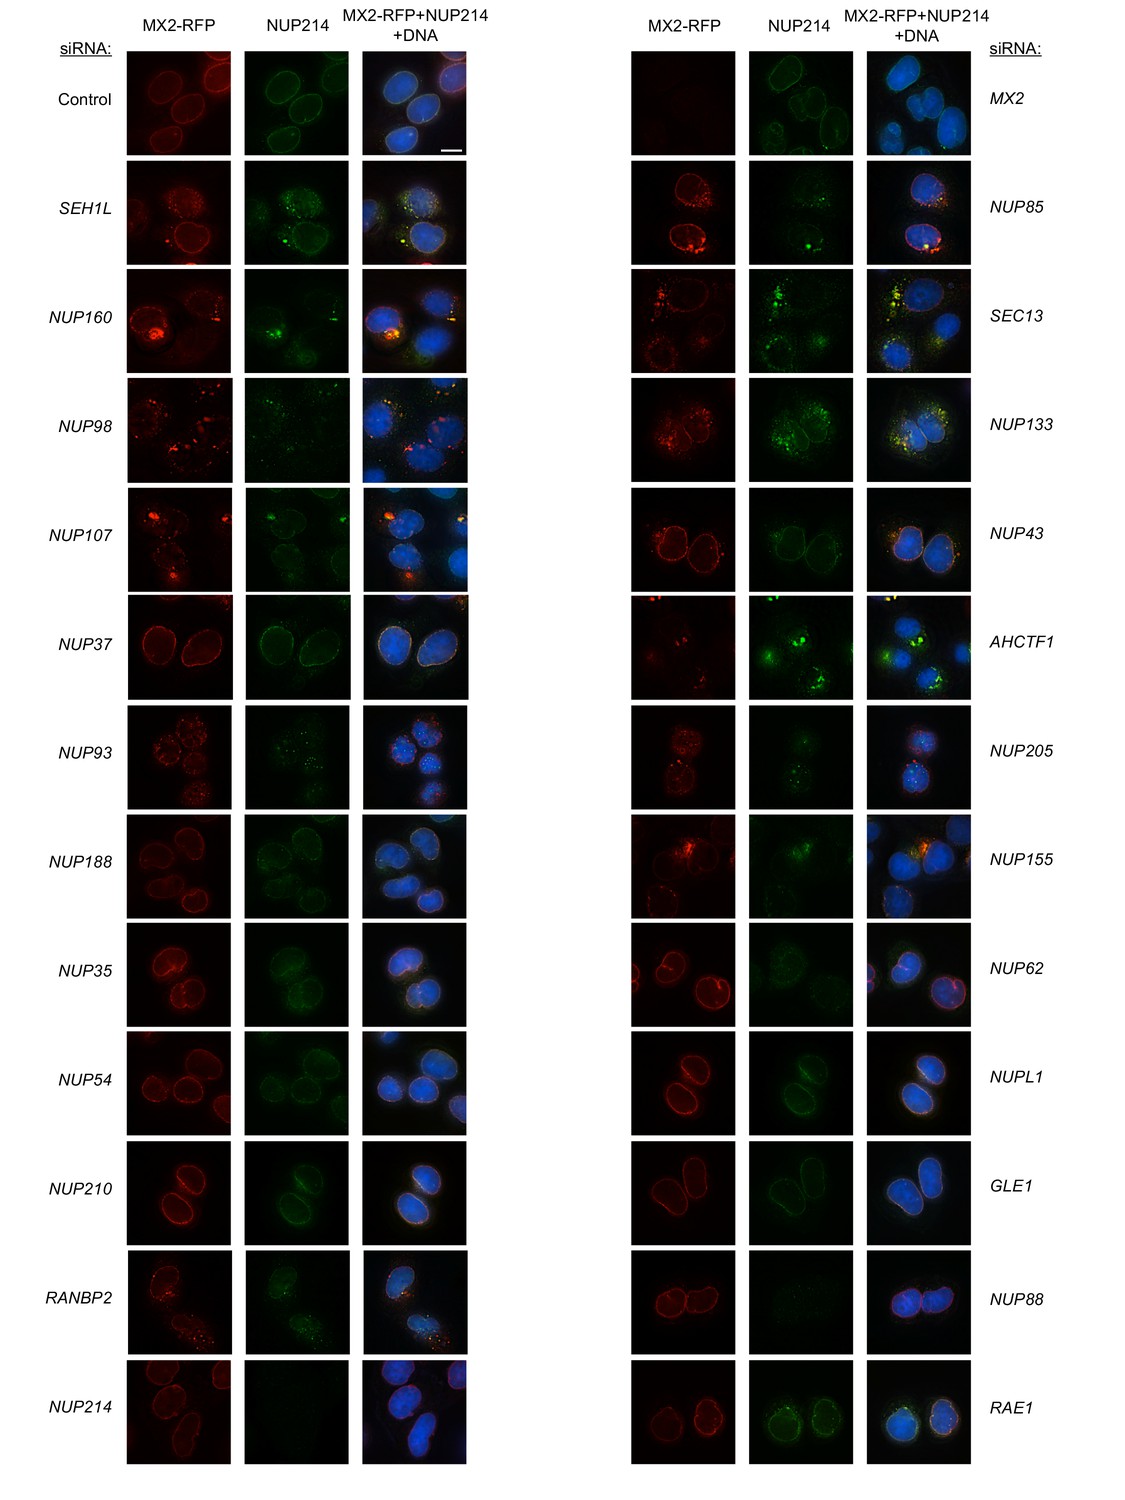
Localization of MX2 and NUP214 following transfection with Nup/NTR targeting siRNA.
Deconvolution microscopic images (single optical sections) of HeLa cells expressing MX2-RFP (red, stably transduced with a doxycycline inducible vector), immunoflourescently stained NUP214 (green), and Hoescht-stained DNA. Cells were fixed and stained 64 hr after transfection with the indicated siRNA. Optical sections are approximately through the center of the vertical dimension on the nucleus. Scale bar = 10 μm. Representative of two independent experiments, with at least three images acquired per experiment.
Figure 6—figure supplement 10
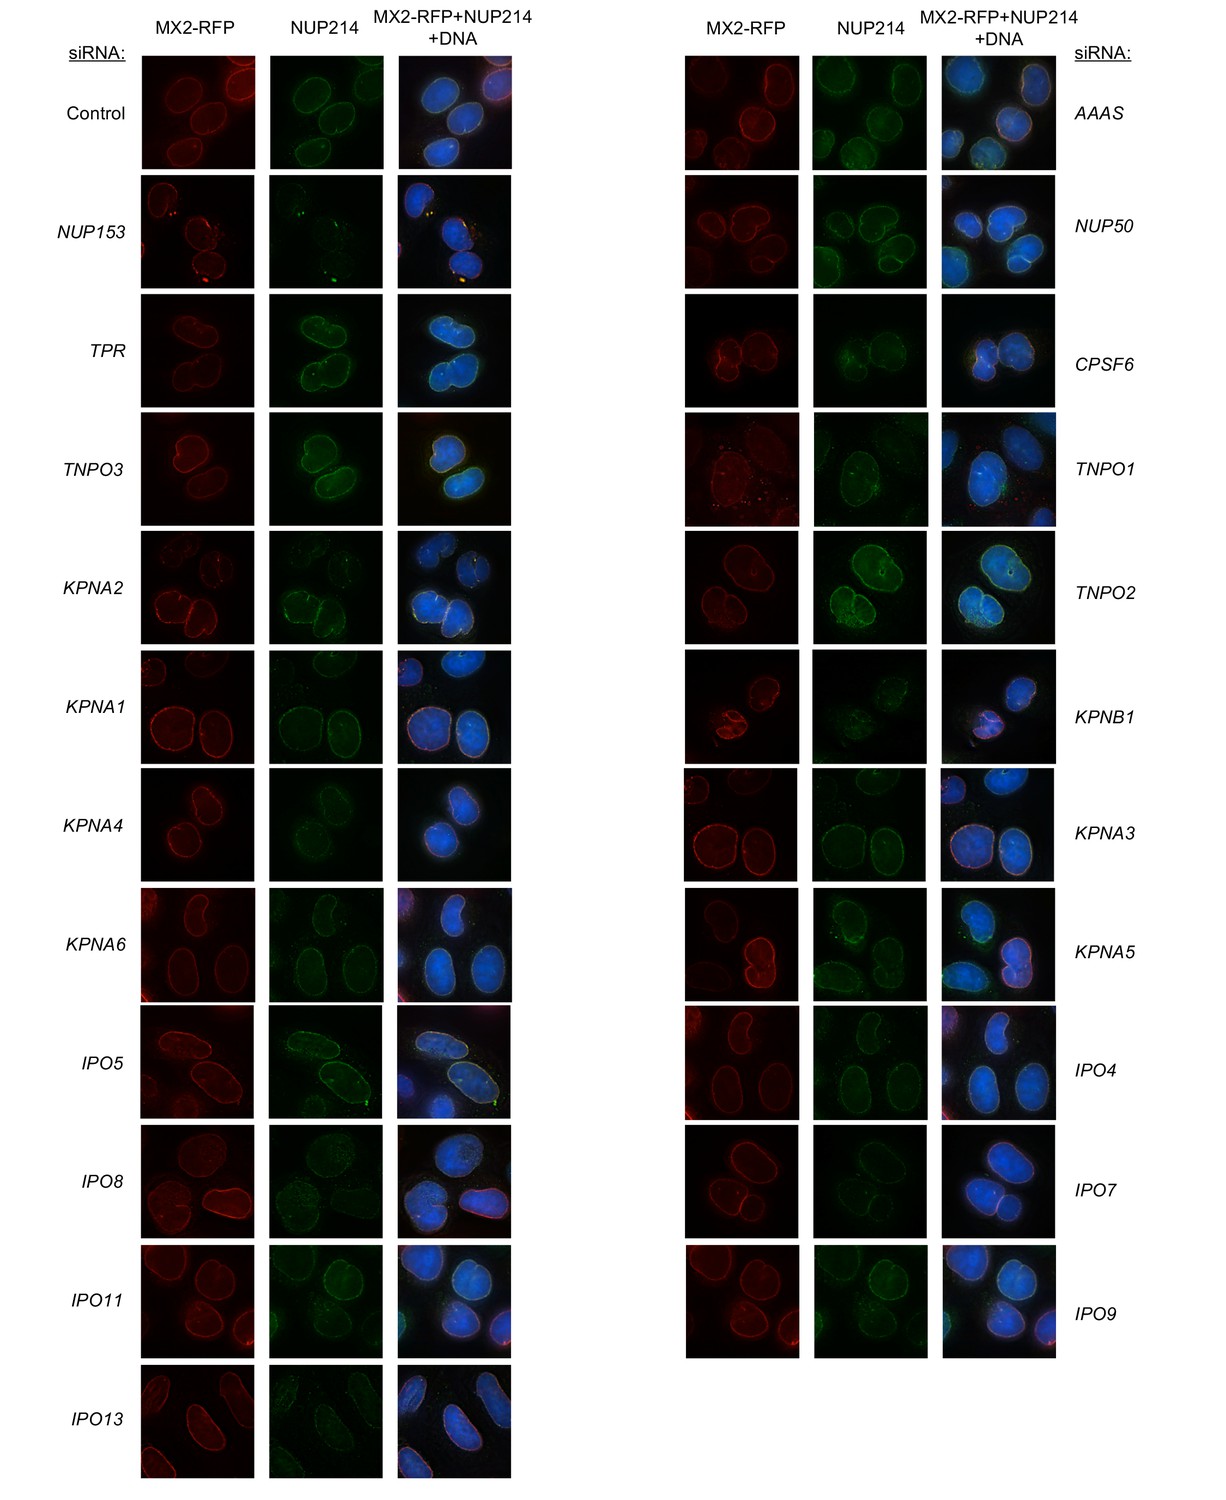
Localization of MX2 and NUP214 following transfection with Nup/NTR targeting siRNA continued.
Deconvolution microscopic images (single optical sections) of HeLa cells expressing MX2-RFP (red, stably transduced with a doxycycline inducible vector), immunoflourescently stained NUP214 (green), and Hoescht-stained DNA. Cells were fixed and stained 64 hr after transfection with the indicated siRNA. Optical sections are approximately through the center of the vertical dimension on the nucleus. Representative of two independent experiments, with at least three images acquired per experiment.
Figure 6—figure supplement 11
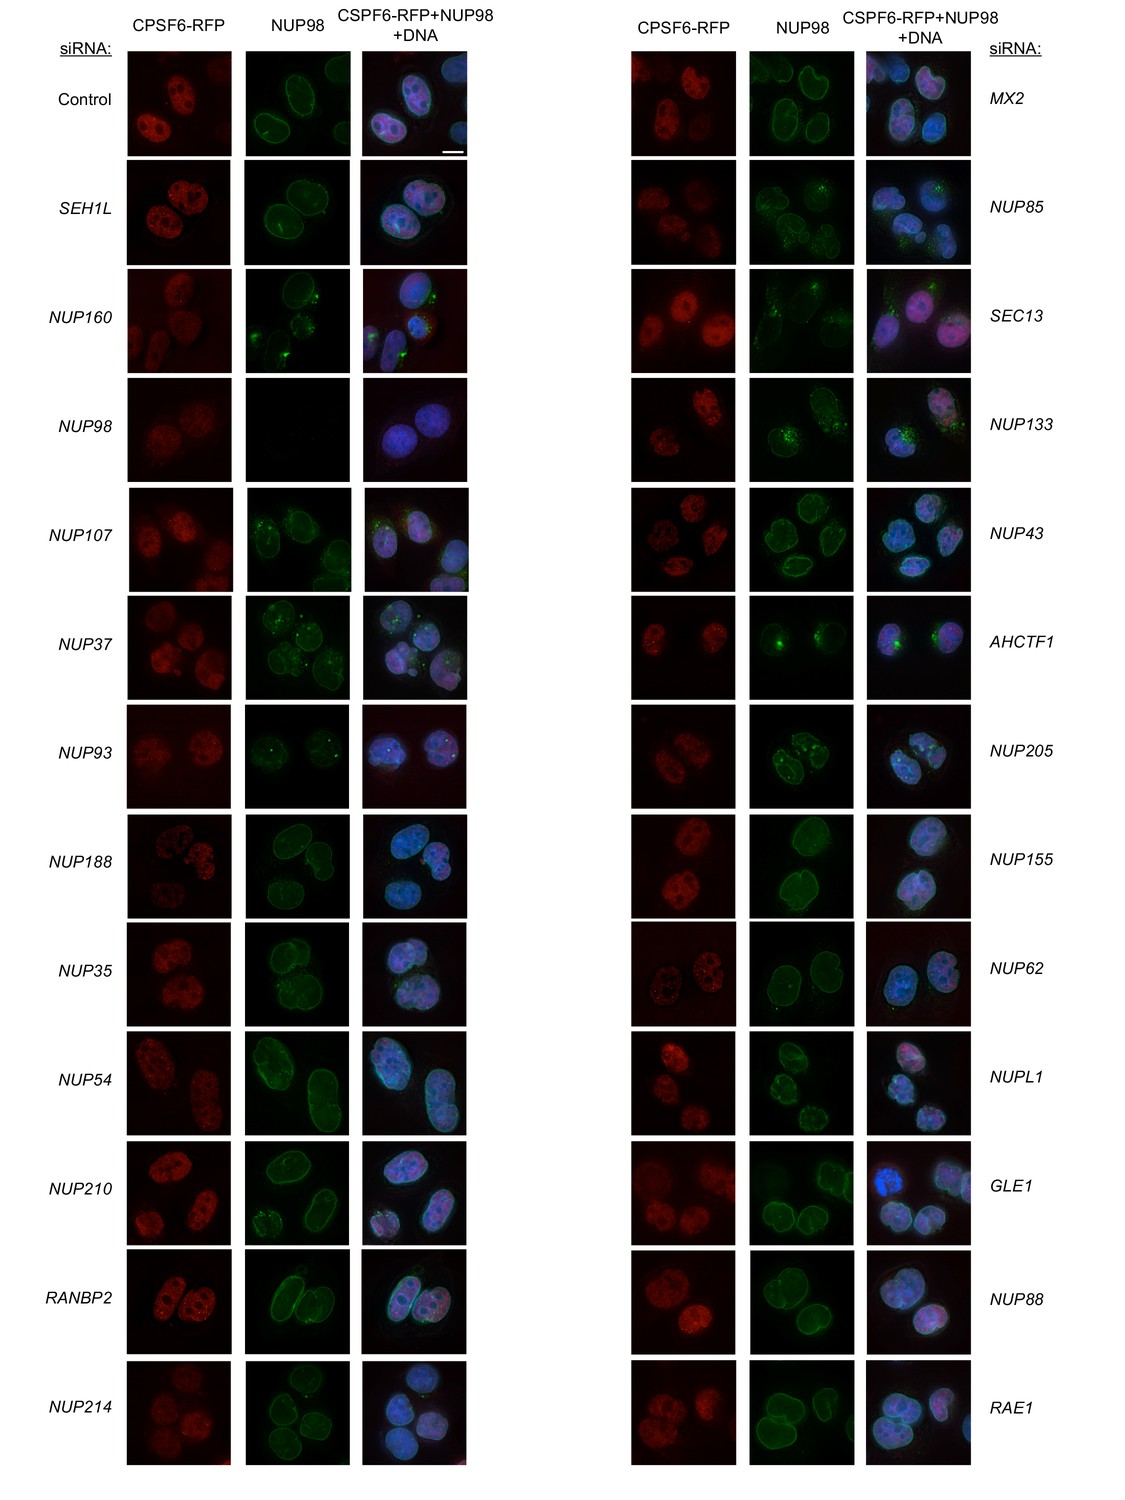
Localization of CPSF6 and NUP98 in HeLa cells following transfection with Nup/NTR targeting siRNA.
Deconvolution microscopic images (single optical sections) of HeLa cells expressing CPSF6-RFP (red, stably transduced with a doxycycline inducible vector), immunoflourescently stained NUP98 (green), and Hoescht-stained DNA. Cells were fixed and stained 64 hr after transfection with the indicated siRNA. Optical sections are approximately through the center of the vertical dimension on the nucleus. Scale bar = 10 μm. Representative of two independent experiments, with at least three images acquired per experiment.
Figure 6—figure supplement 12
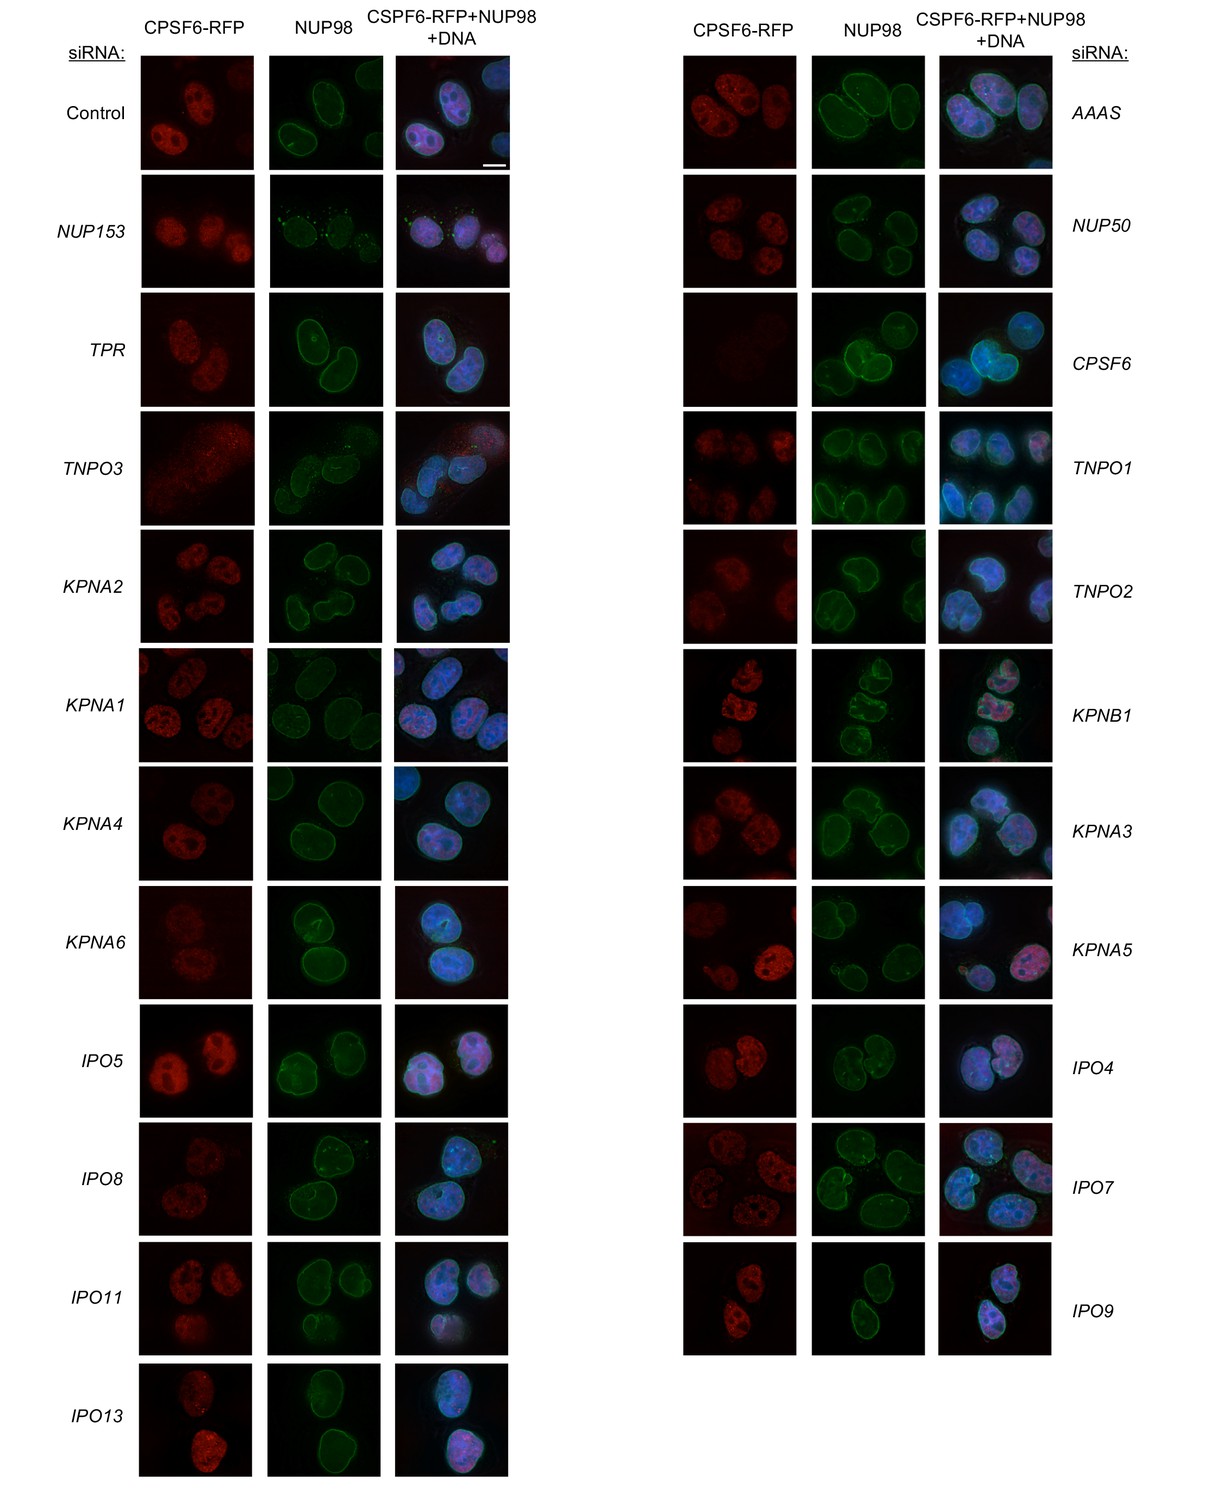
Localization of CPSF6 and NUP98 in HeLa cells following transfection with Nup/NTR targeting siRNA continued.
Deconvolution microscopic images (single optical sections) of HeLa cells expressing CPSF6-RFP (red, stably transduced with a doxycycline inducible vector), immunoflourescently stained NUP98 (green), and Hoescht-stained DNA. Cells were fixed and stained 64 hr after transfection with the indicated siRNA. Optical sections are approximately through the center of the vertical dimension on the nucleus. Scale bar = 10 μm. Representative of two independent experiments, with at least three images acquired per experiment.
Figure 6—figure supplement 13
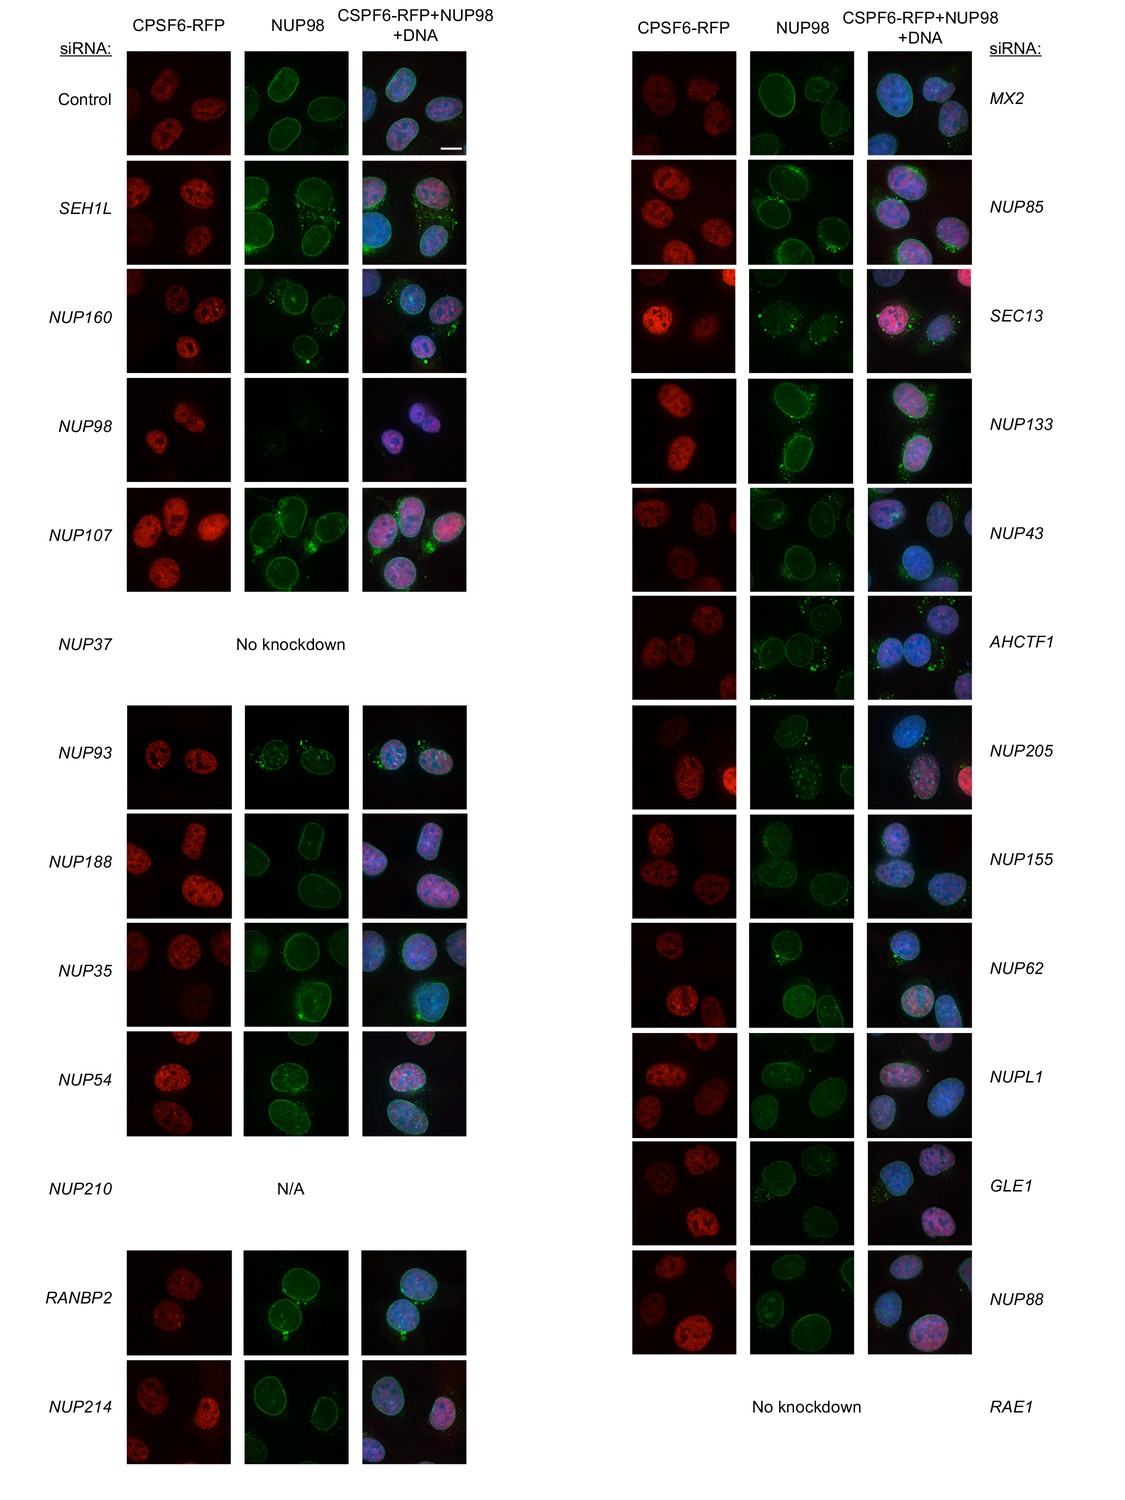
Localization of CPSF6 and NUP98 in HT1080 cells following transfection with Nup/NTR targeting siRNA.
Deconvolution microscopic images (single optical sections) of HT1080 cells expressing CPSF6-RFP (red, stably transduced with a doxycycline inducible vector), immunoflourescently stained NUP98 (green), and Hoescht-stained DNA. Cells were fixed and stained 64 hr after transfection with the indicated siRNA. Optical sections are approximately through the center of the vertical dimension on the nucleus. Scale bar = 10 μm. Representative of two independent experiments, with at least three images acquired per experiment.
Figure 6—figure supplement 14
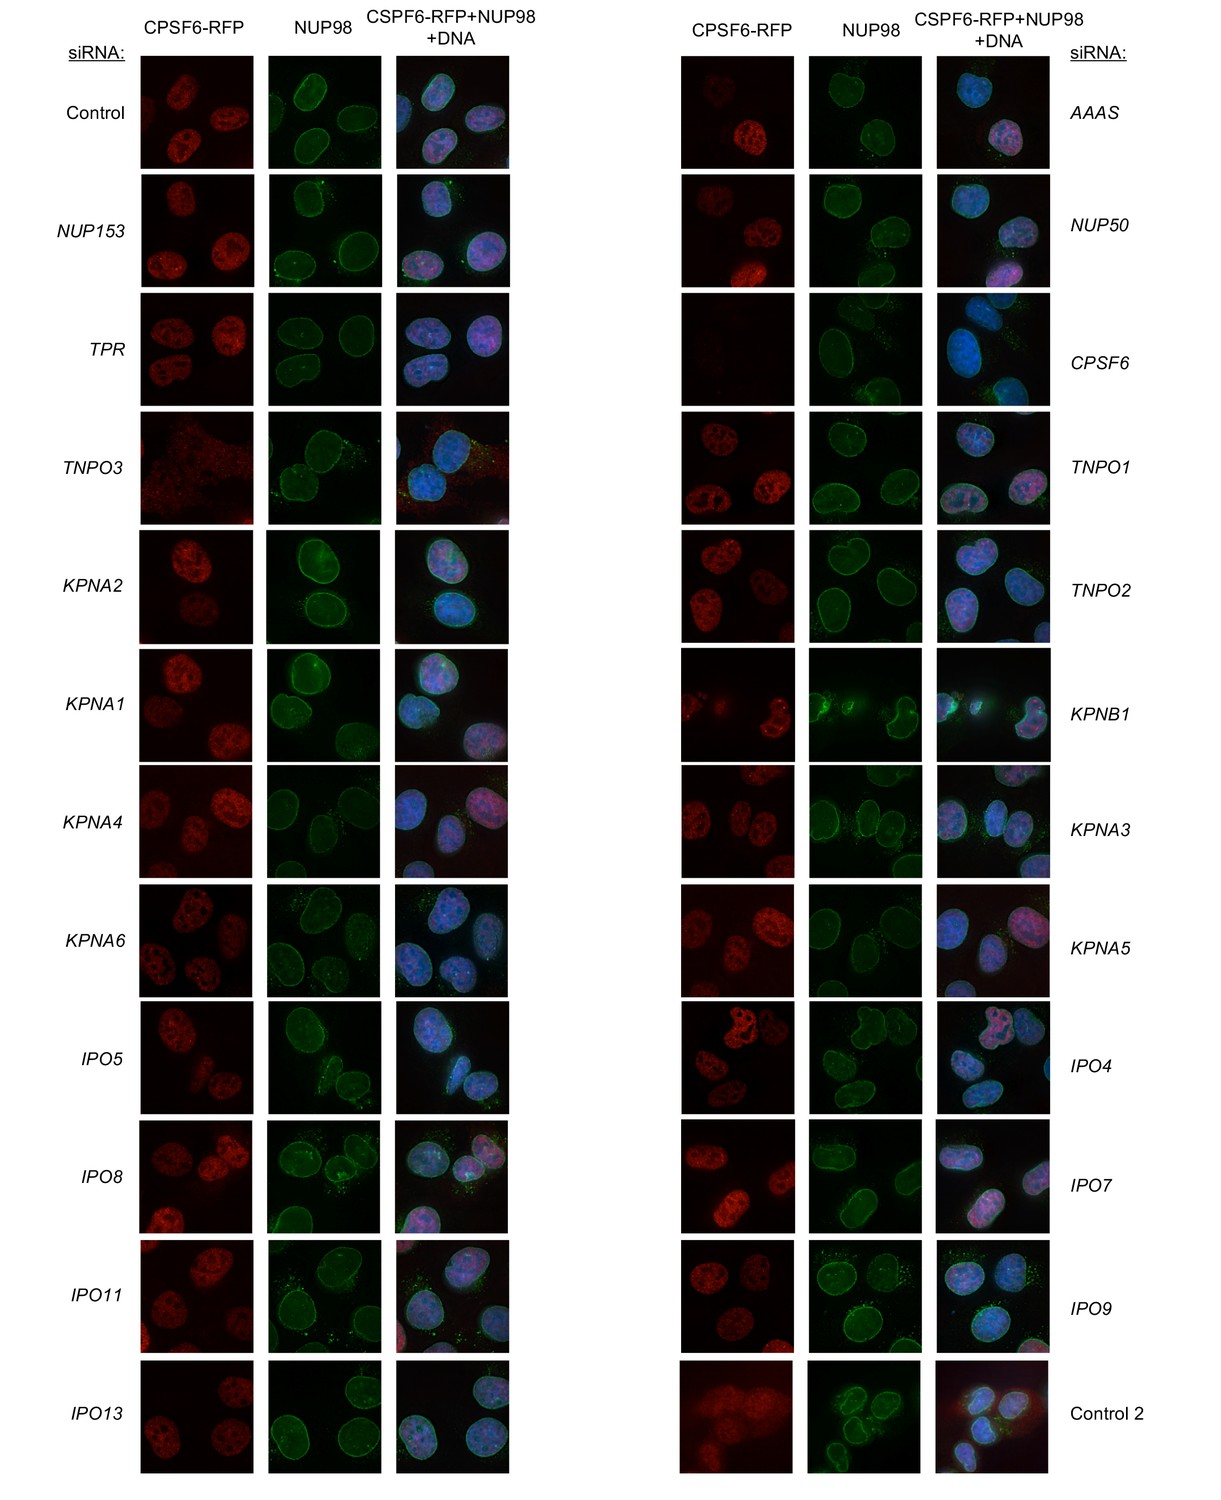
Localization of CPSF6 and NUP98 in HT1080 cells following transfection with Nup/NTR targeting siRNA continued.
Deconvolution microscopic images (single optical sections) of HT1080 cells expressing CPSF6-RFP (red, stably transduced with a doxycycline inducible vector), immunoflourescently stained NUP98 (green), and Hoescht-stained DNA. Cells were fixed and stained 64 hr after transfection with the indicated siRNA. Optical sections are approximately through the center of the vertical dimension on the nucleus. Representative of two independent experiments, with at least three images acquired per experiment.
Figure 6—figure supplement 15
Localization of SV40 NLS-GFP-LacZ following transfection with Nup/NTR targeting siRNA.
HeLa cells stably transduced with SV40 NLS-GFP-LacZ fusion protein (green) and doxycycline-inducible MX2-RFP in the absence of doxycycline fixed and stained with Hoescht 64 hr after transfection with the indicated siRNA. Representative of two independent experiments, with at least three images acquired per experiment.
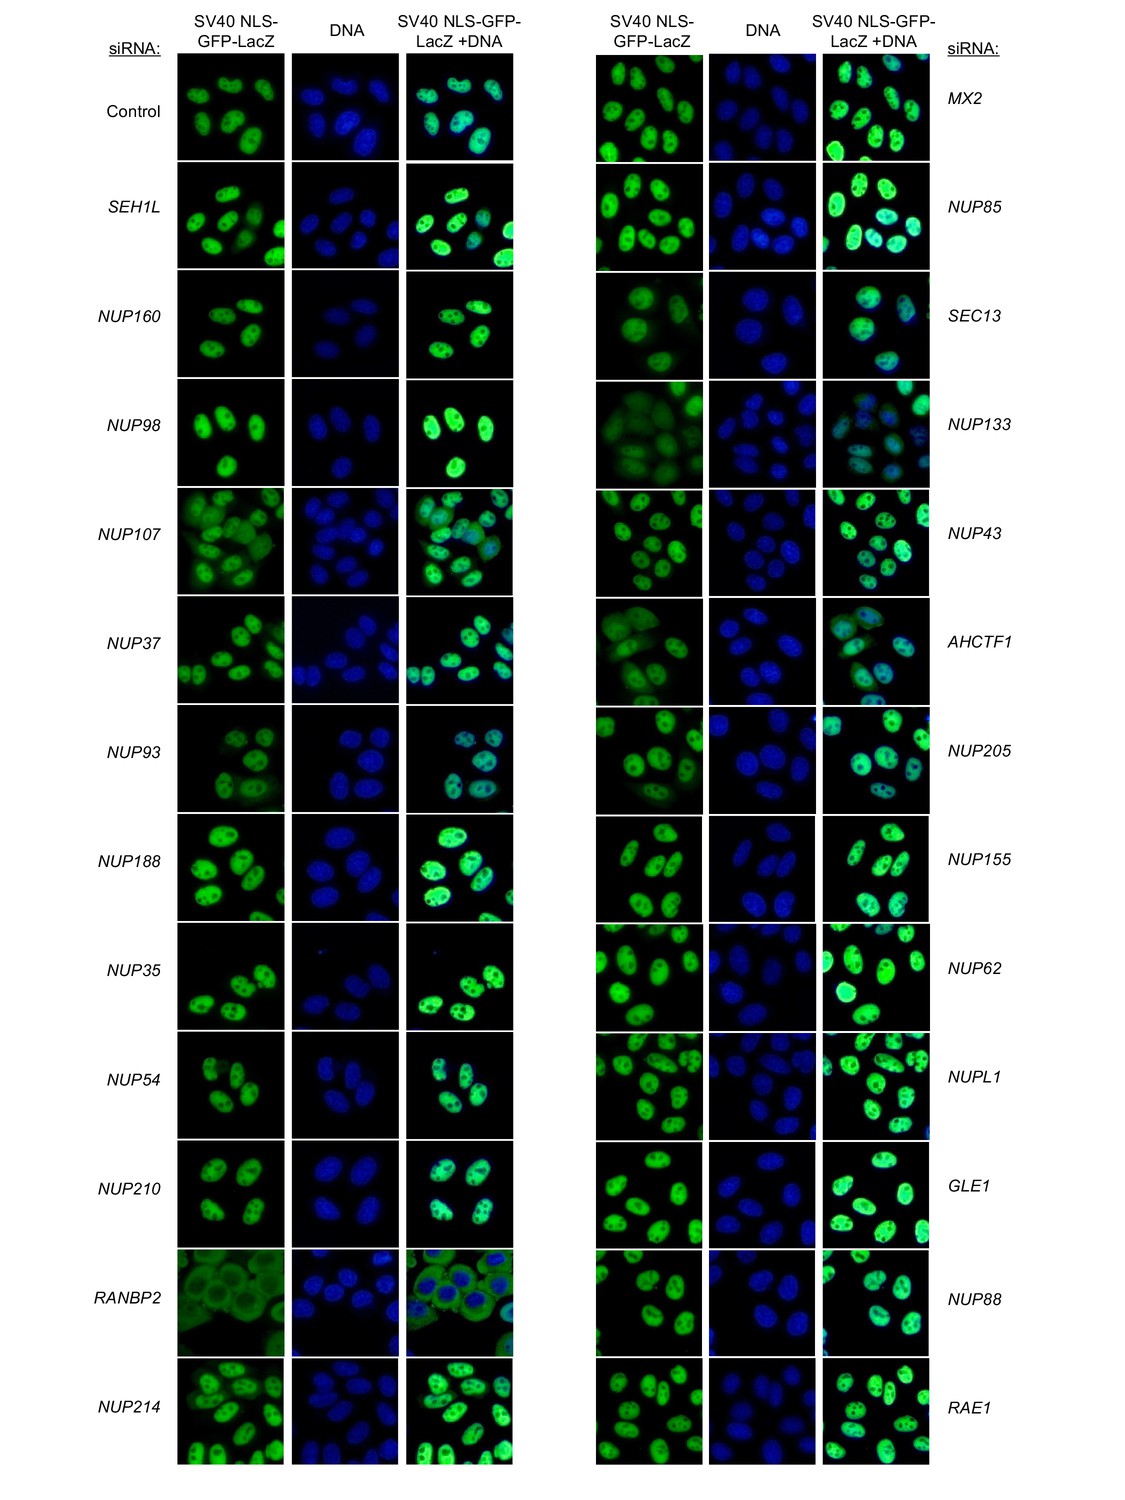
Figure 6—figure supplement 16
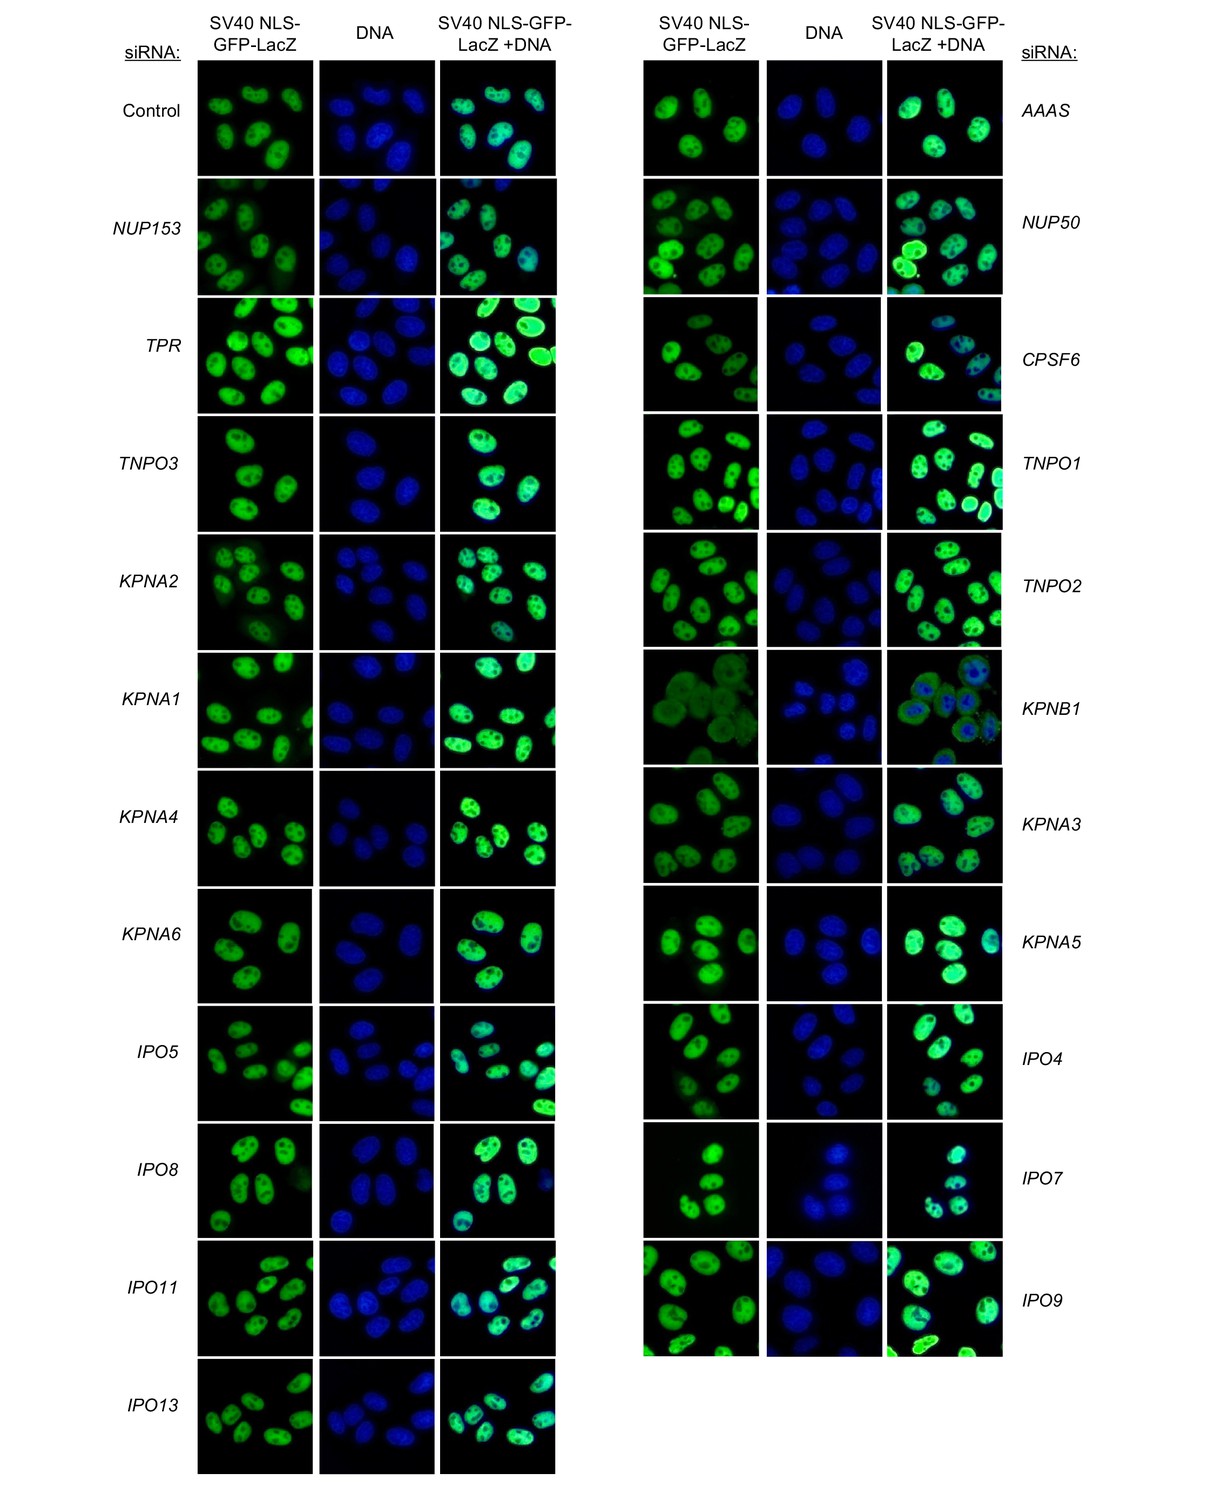
Localization of SV40 NLS-GFP-LacZ following transfection with Nup/NTR targeting siRNA continued.
HeLa cells stably transduced with SV40 NLS-GFP-LacZ fusion protein (green) and doxycycline-inducible MX2-RFP in the absence of doxycycline fixed and stained with Hoescht 64 hr after transfection with the indicated siRNA. Representative of two independent experiments, with at least three images acquired per experiment.
Figure 6—figure supplement 17
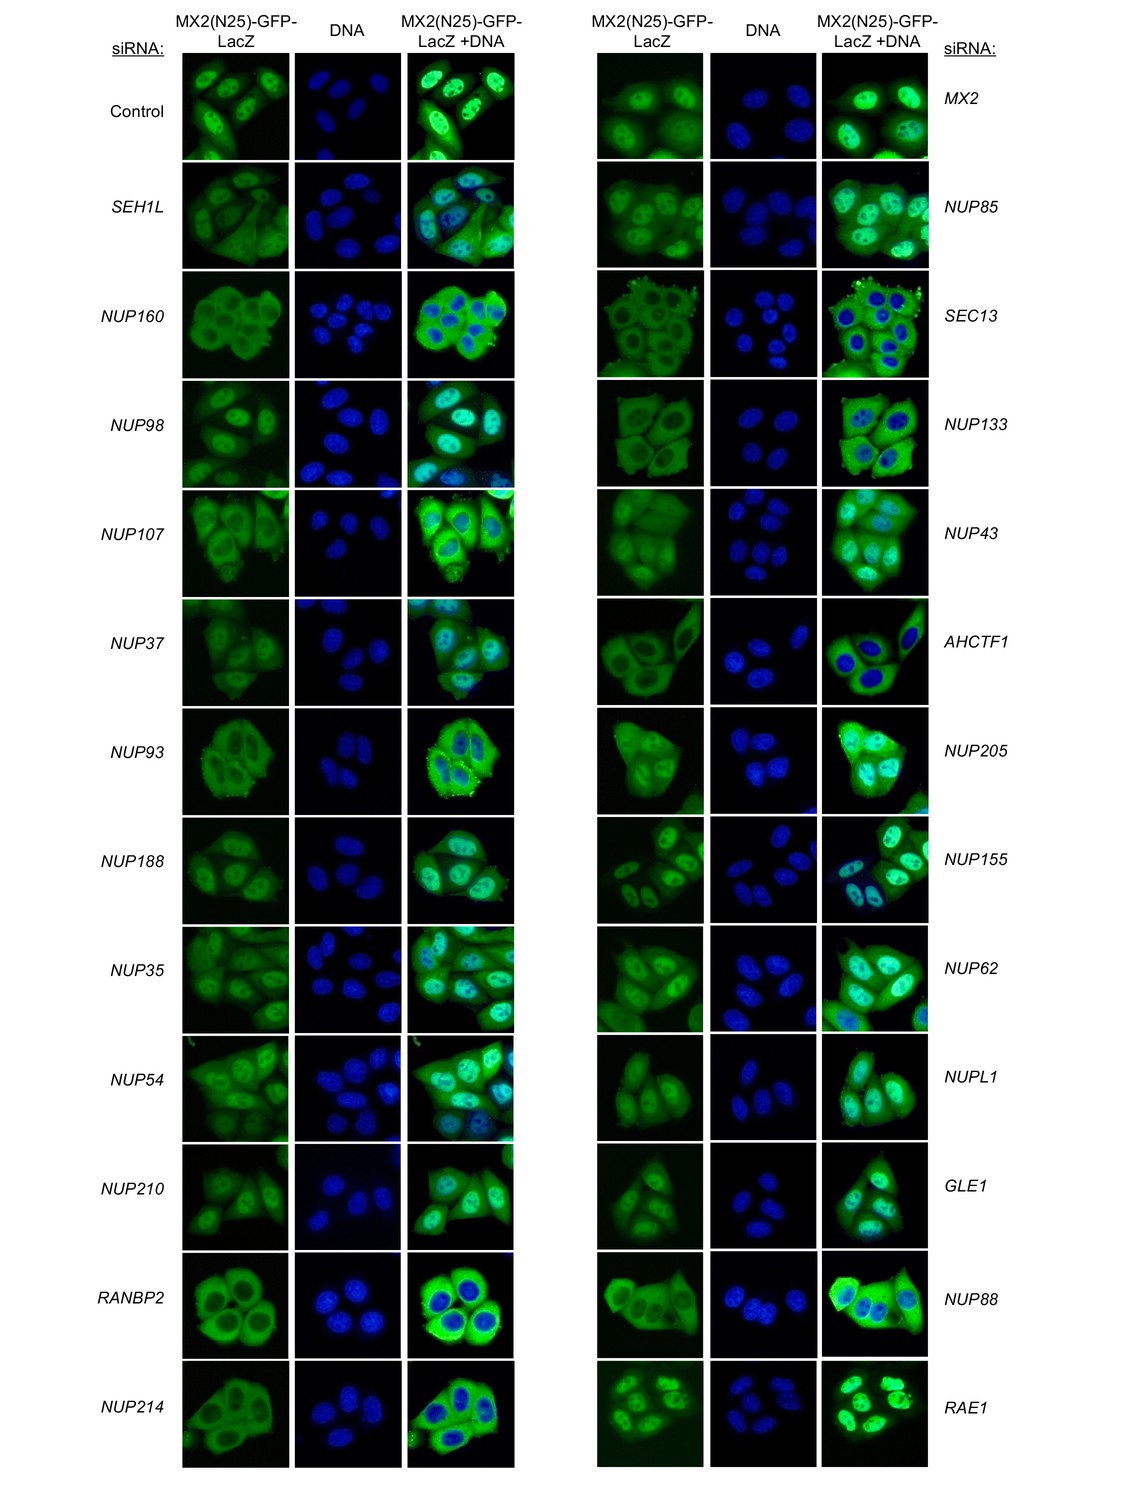
Localization of MX2(N25)-GFP-LacZ following transfection with Nup/NTR targeting siRNA.
HeLa cells stably transduced with MX2(N25)-GFP-LacZ fusion protein (green) and doxycycline-inducible MX2-RFP in the absence of doxycycline fixed and stained with Hoescht 64 hr after transfection with the indicated siRNA. Representative of two independent experiments, with at least three images acquired per experiment.
Figure 6—figure supplement 18
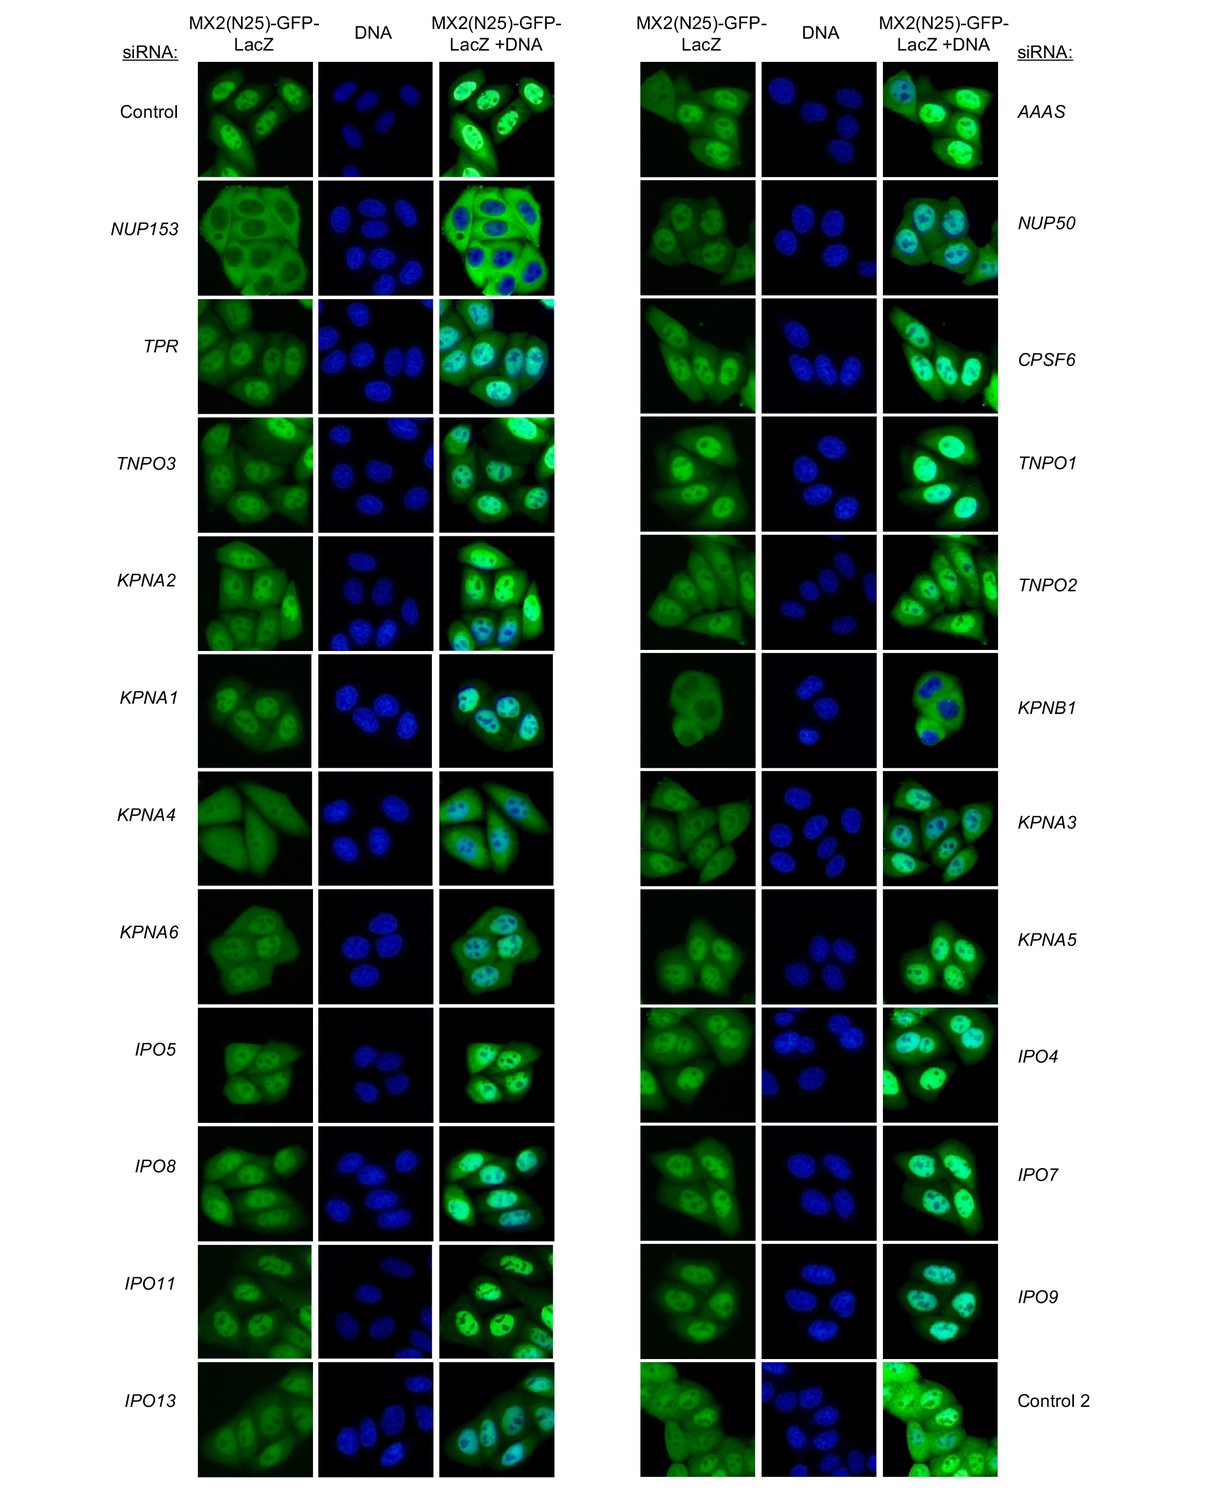
Localization of MX2(N25)-GFP-LacZ following transfection with Nup/NTR targeting siRNA continued.
HeLa cells stably transduced with MX2(N25)-GFP-LacZ fusion protein (green) and doxycycline-inducible MX2-RFP in the absence of doxycycline fixed and stained with Hoescht 64 hr after transfection with the indicated siRNA. Representative of two independent experiments, with at least three images acquired per experiment.
Figure 6—figure supplement 19
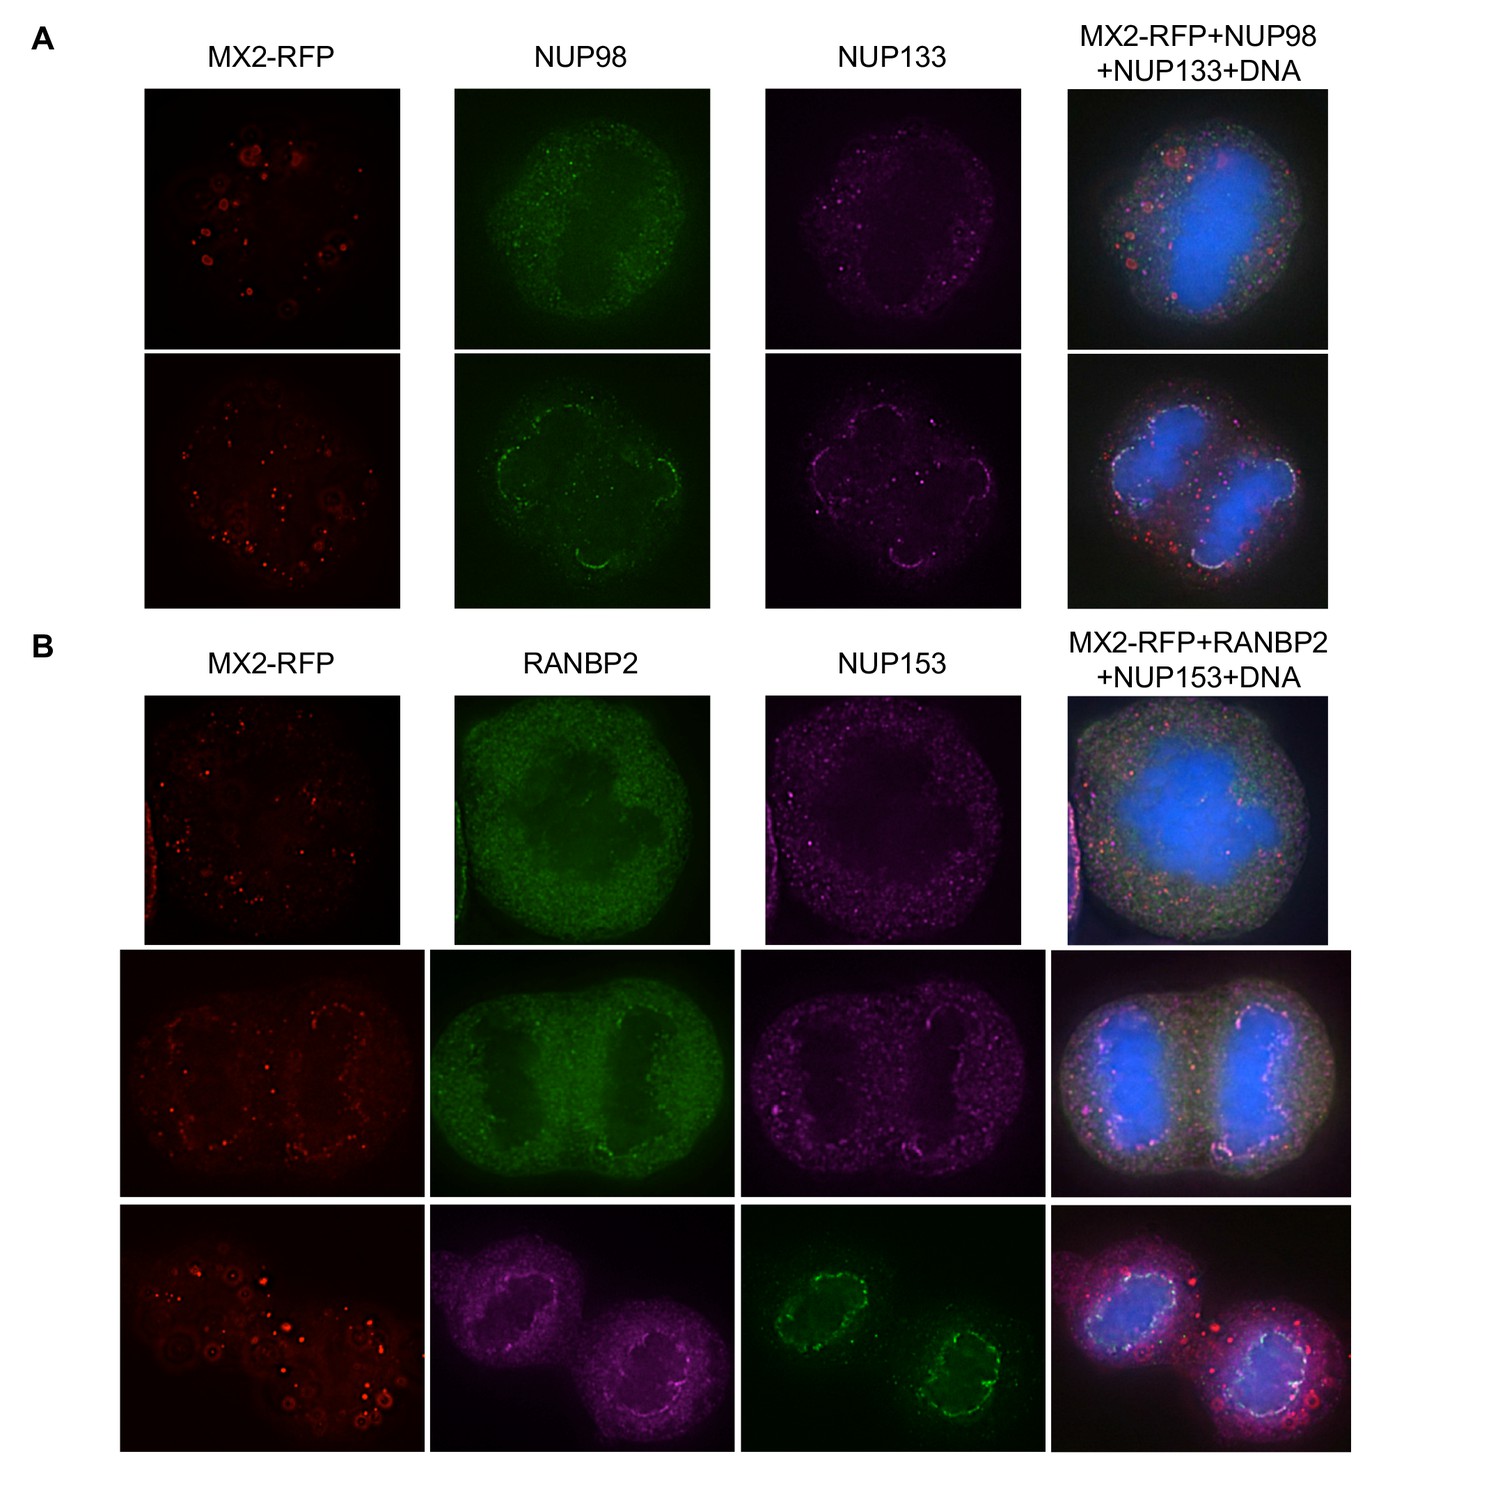
Localization of MX2 and Nups in mitotic HeLa cells.
Deconvolution microscopic images (single optical sections) of HeLa cells expressing MX2-RFP (red, stably transduced with a doxycycline inducible vector). Representative of three independent experiments, with at least three images acquired per experiment. (A) Immunoflourescently stained NUP98 (green), NUP133 (purple), and Hoescht-stained DNA. Top- early- mitotic cell with condensed chromatin; bottom- late-mitotic cell with separating chromosomes. (B) Immunoflourescently stained RANBP2 (top, middle-green; bottom-purple), NUP153 (top, middle-purple; bottom-green), and Hoescht-stained DNA. Top- early- mitotic cell with condensed chromatin; middle and bottom- late-mitotic cells with separating chromosomes.
Figure 6—figure supplement 20

Localization of MX2 and Nups in mitotic HT1080 cells.
Deconvolution microscopic images (single optical sections) of HT1080 cells expressing MX2-RFP (red, stably transduced with a doxycycline inducible vector). Representative of three independent experiments, with at least three images acquired per experiment. (A) Immunoflourescently stained NUP98 (green), NUP133 (purple), and Hoescht-stained DNA. Top- early- mitotic cell with condensed chromatin; bottom- late-mitotic cell with separating chromosomes. (B) Immunoflourescently stained RANBP2 (top-green; middle, bottom-purple), NUP153 (top-purple; middle, bottom-green), and Hoescht-stained DNA. Cells in anaphase through telophase/cytokinesis from top to bottom.
Figure 7 with 3 supplements
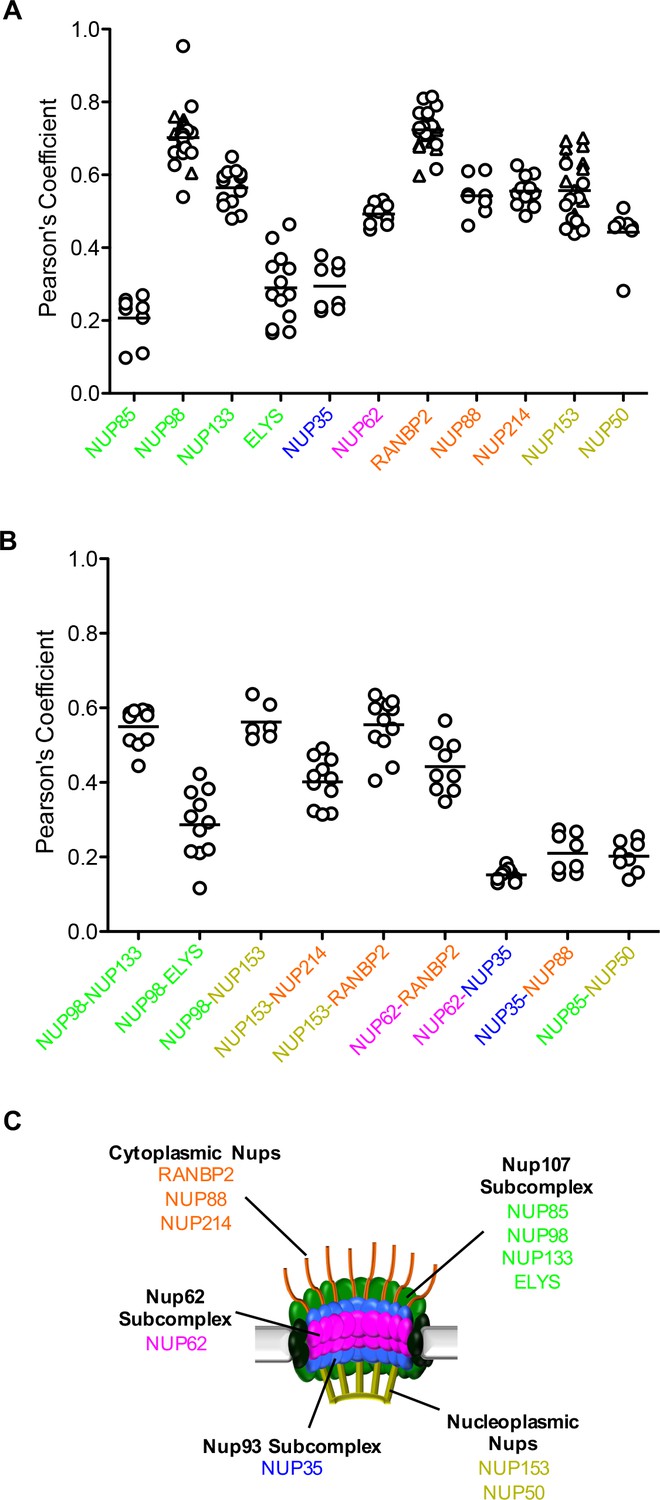
Localization of MX2 and Nups.
(A) Pearson’s coefficient for co-localization of MX2 with indicated Nups and (B) Nups with one another of deconvolution microscopic images of HeLa cells expressing MX2-RFP and immunoflourescently stained with Nups (color coded as in Figure 4A). Each data point represents an individual cell and the horizontal bar is the mean (n ≥ 6). For NUP98, RANBP2, and NUP153, triangles and circles in A) represent cells stained with secondary antibodies coupled to different flourophores (AlexaFlour-488 and AlexaFlour-647).
Figure 7—figure supplement 1
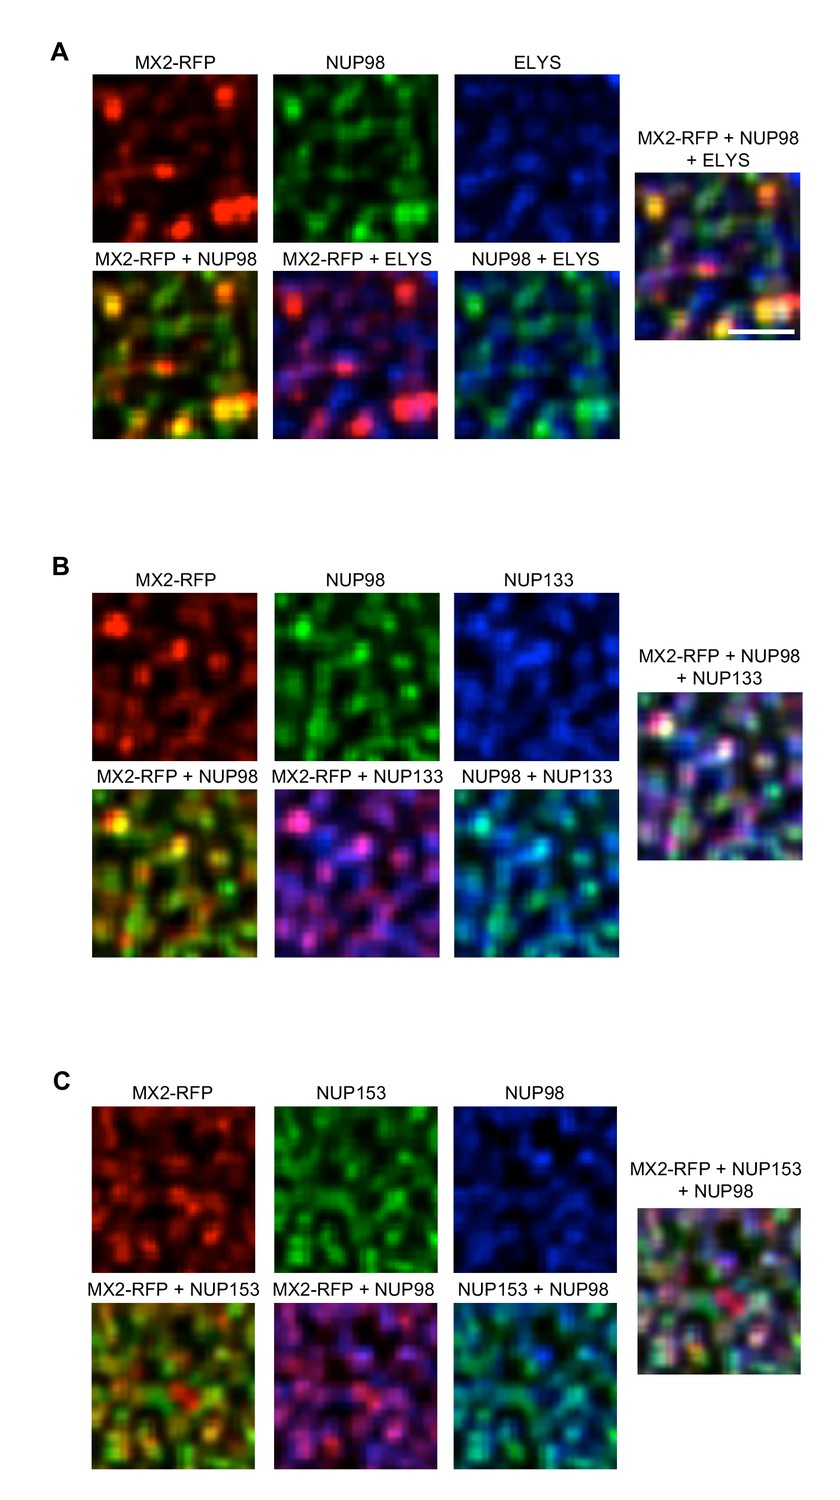
Localization of MX2 and Nups.
Deconvolution microscopic images (single optical sections approximately coincident with the dorsal surface of the nucleus) of HeLa cells expressing MX2-RFP (red, stably transduced with a doxycycline inducible vector). Immunoflourescently stained (A) NUP98 (green), ELYS (blue); (B) NUP98 (green), NUP133 (blue); (C) NUP153 (green), NUP98 (blue). Green pseudocolored images were stained with AlexaFlour-488 secondary, blue pseudocolored images were stained with AlexaFlour-647 secondary. Scale bar = 10 μM. Representative of three independent experiments, with at least four images acquired per experiment.
Figure 7—figure supplement 2
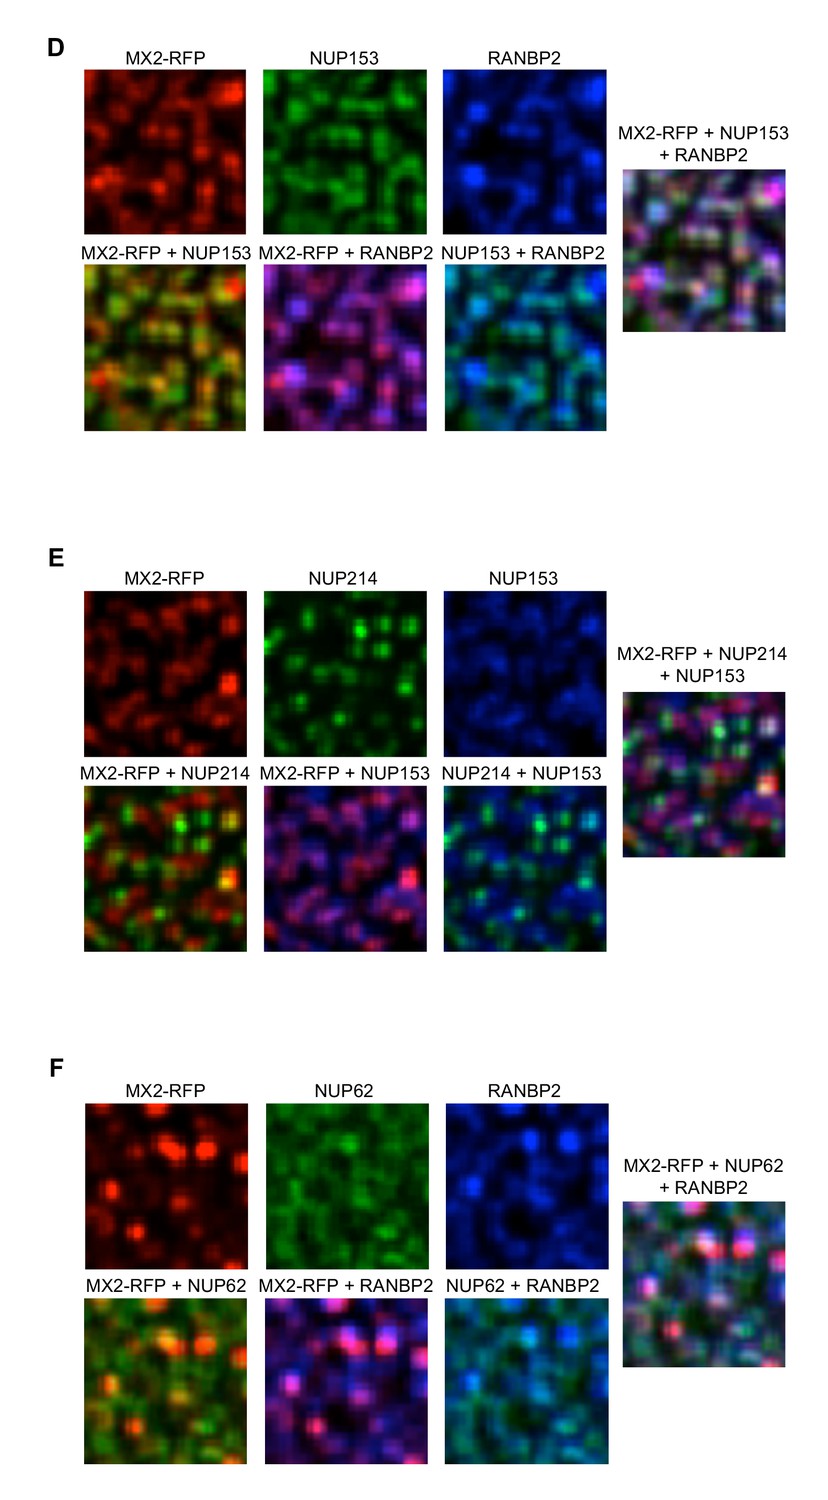
Localization of MX2 and Nups.
Deconvolution microscopic images (single optical sections approximately coincident with the dorsal surface of the nucleus) of HeLa cells expressing MX2-RFP (red, stably transduced with a doxycycline inducible vector). Immunoflourescently stained (D) stained NUP153 (green), RANBP2 (blue); (E) NUP214 (green), NUP153 (blue); (F) NUP62 (green), RANBP2 (blue). Green pseudocolored images were stained with AlexaFlour-488 secondary (or NUP62-FITC conjugated primary), blue pseudocolored images were stained with AlexaFlour-647 secondary. Scale bar = 10 μM. Representative of three independent experiments, with at least four images acquired per experiment.
Figure 7—figure supplement 3
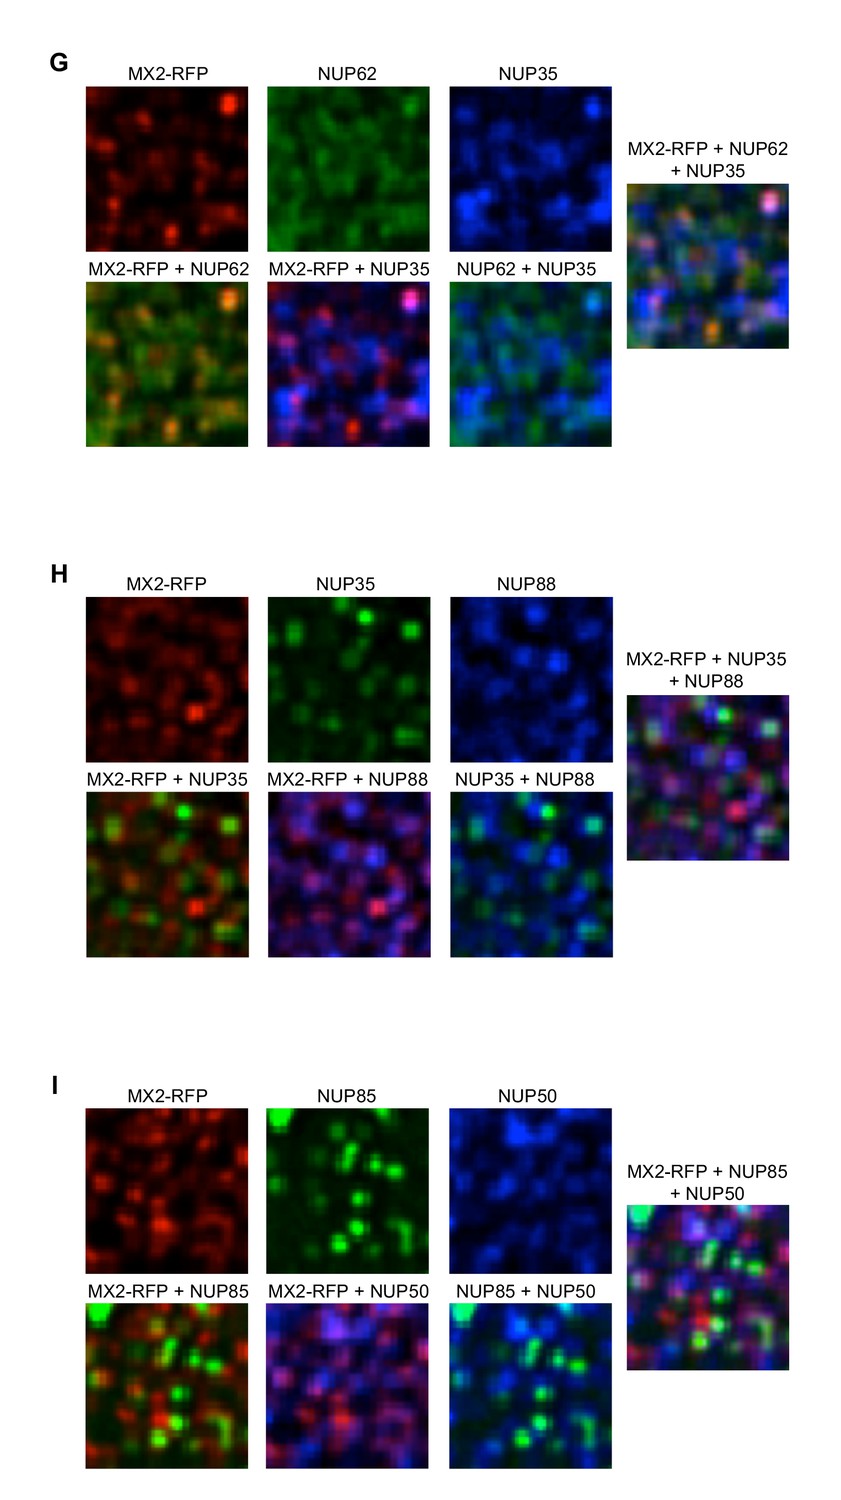
Localization of MX2 and Nups.
Deconvolution microscopic images (single optical sections approximately coincident with the dorsal surface of the nucleus) of HeLa cells expressing MX2-RFP (red, stably transduced with a doxycycline inducible vector). Immunoflourescently stained (G) NUP62 (green), NUP35 (blue); (H) NUP35 (green), NUP88 (blue); (I) NUP85 (green), NUP50 (blue). Green pseudocolored images were stained with AlexaFlour-488 secondary (or NUP62-FITC conjugated primary), blue pseudocolored images were stained with AlexaFlour-647 secondary. Scale bar = 10 μM. Representative of three independent experiments, with at least four images acquired per experiment.
Figure 8 with 5 supplements

Effect of Nup and NTR depletion on HIV-1 infection and antiviral activity of MX2.
(A) Infectivity of HIV-1 GFP reporter virus in dividing (top) and non-dividing (bottom) HeLa cells stably transduced with doxycycline-inducible MX2 in the presence (open circles) or absence (filled circles) of doxycycline 64 hr after transfection with siRNA (color coded by subcomplex as in Figure 4A). Middle, summary of localization of MX2 from immunoflouresence images in Figure 6. Aberrant localization following siRNA transfection in ≥~80% of cells is indicated by an ‘x’ and normal localization is indicated by a dot. Titers are mean ±sem, n = 3 technical replicates, representative of four independent experiments. (B) Infectivity of HIV-1 GFP reporter virus in dividing (top) and non-dividing (bottom) HT1080 cells stably transduced with doxycycline-inducible MX2 in the presence (open triangles) or absence (filled triangles) of doxycycline. Cells were infected 64 hr after transfection with siRNA (color coded by subcomplex as in Figure 4A). Middle, summary of localization of MX2 from immunoflouresence images in Figure 6. Aberrant MX2 localization following siRNA transfection in ≥~80% of cells is indicated by an ‘x’ and normal localization is indicated by a dot. Titers are mean ±sem, n = 3 technical replicates, representative of three independent experiments. n/a – not included due to insufficient knockdown (NUP37, RAE1) or not expressed (NUP210). (C) Schematic representation of the nuclear pore complex and target genes included in siRNA library color coded by subcomplex, as in Figure 4A.
Figure 8—figure supplement 1
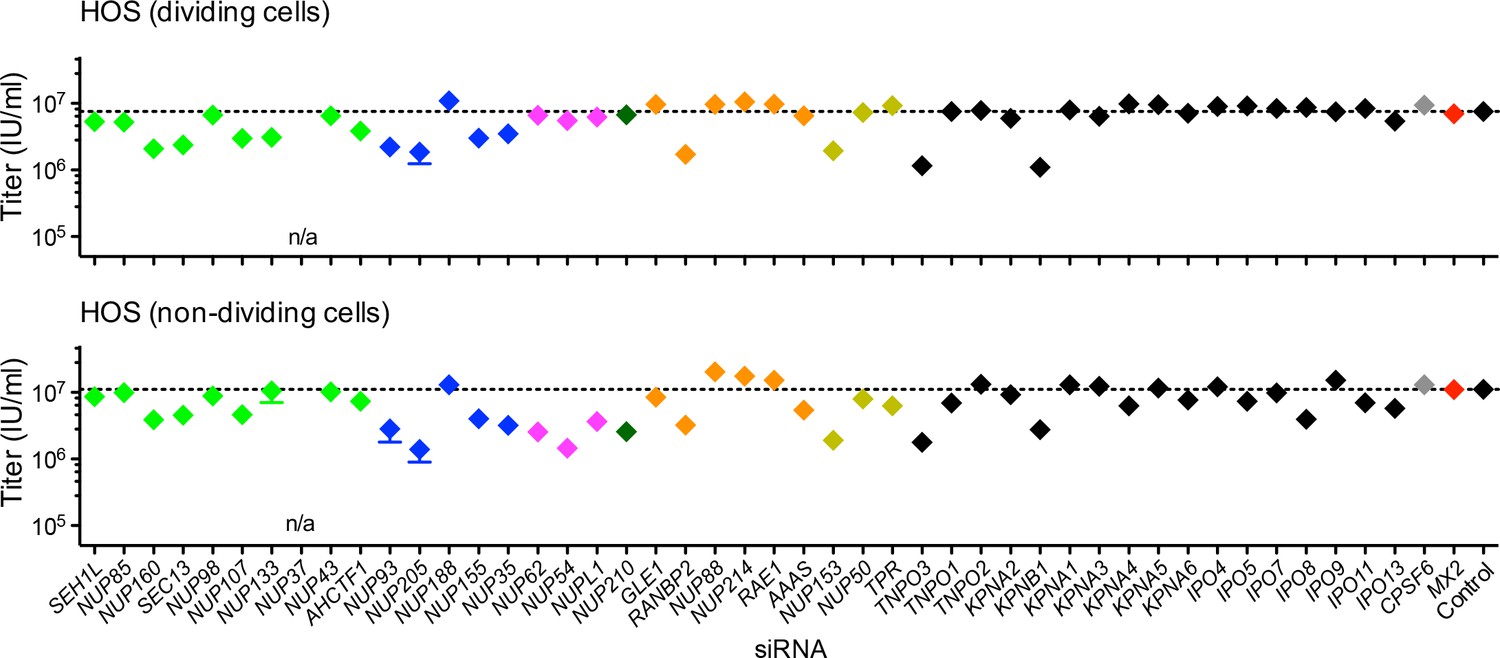
Effect of Nup and NTR depletion on HIV-1 infection in HOS cells.
(A) Infectivity of HIV-1 GFP reporter virus in dividing (top) and non-dividing (bottom) HOS cells 64 hr after transfection with siRNA (color coded by subcomplex as in Figure 4A). Titers are mean ±sem, n = 3 technical replicates, representative of three independent experiments.
Figure 8—figure supplement 2
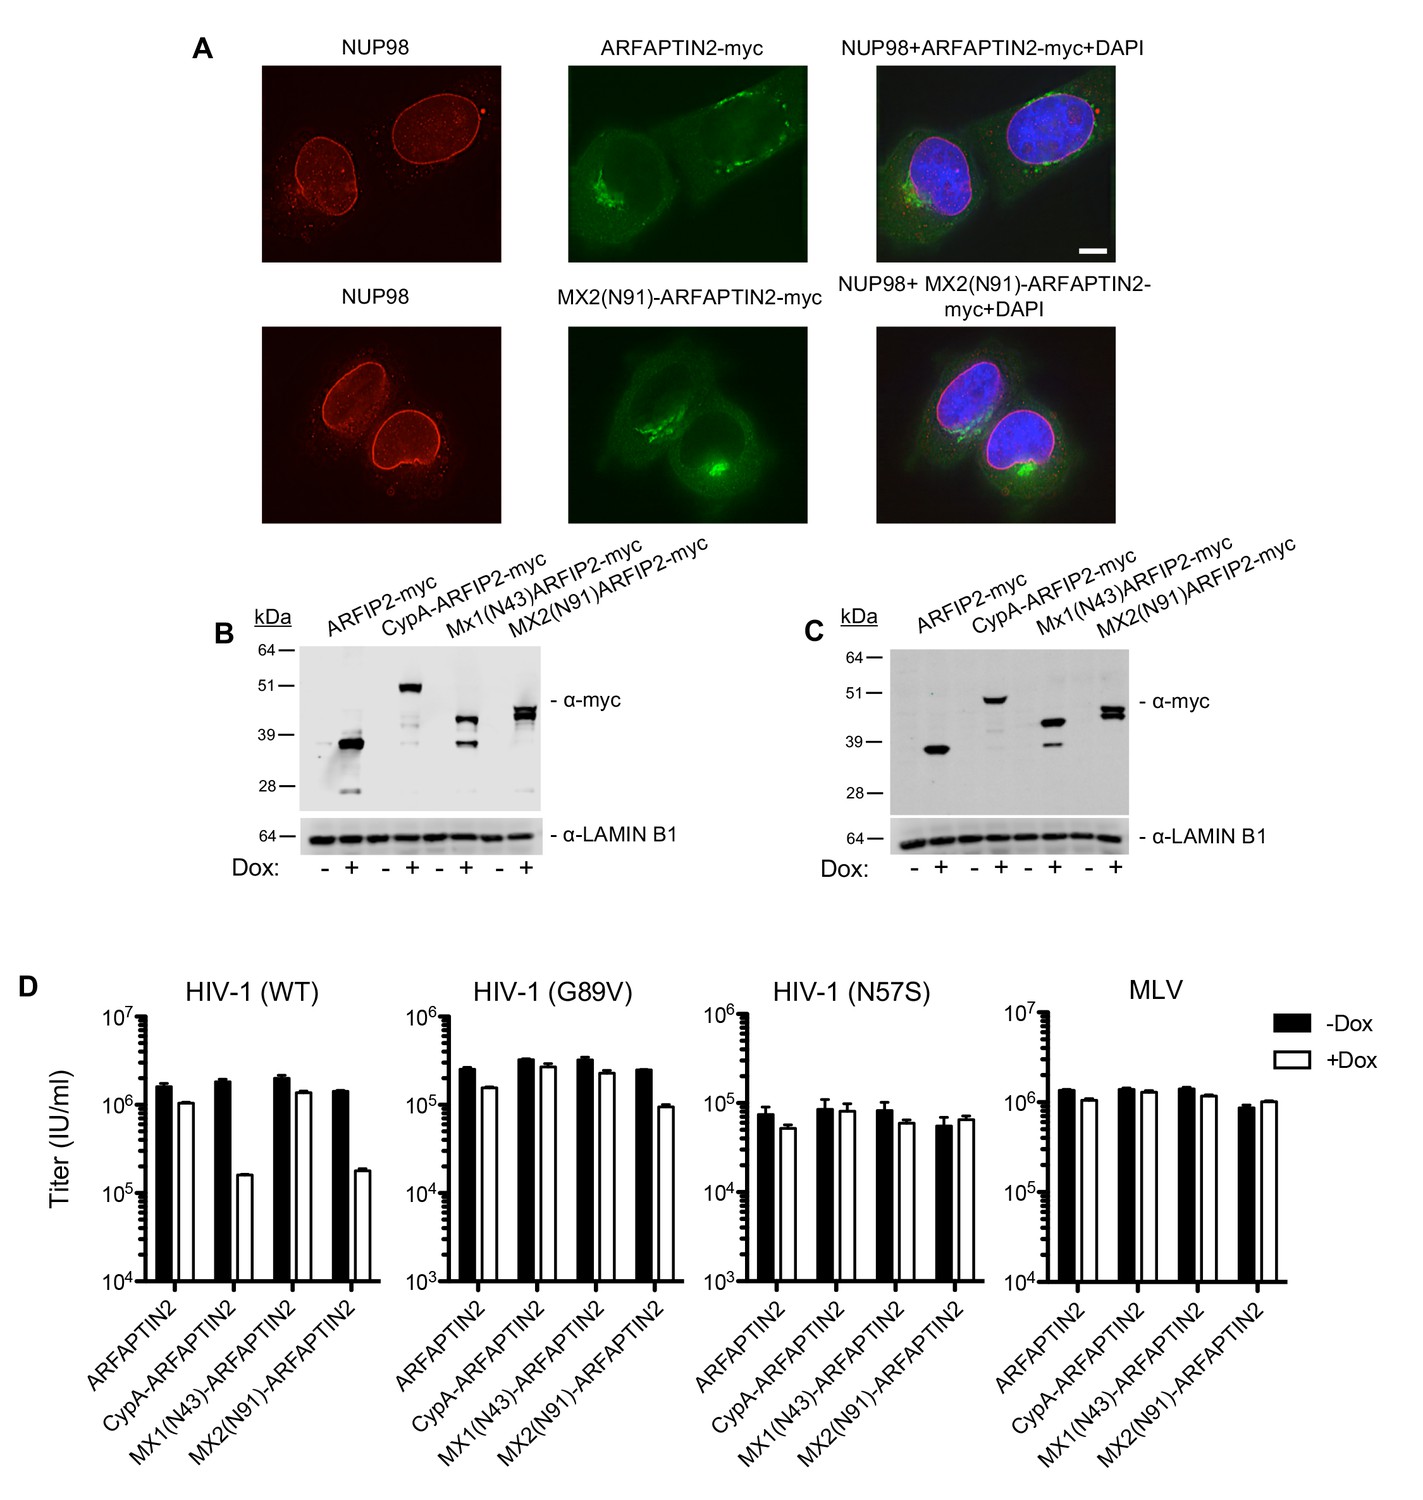
The amino-terminal domain of MX2 fused to a heterologous protein exhibits antiviral activity but with altered Nup requirements.
(A) Deconvolution microscopic images (single optical sections) of immunoflourescently stained myc-tagged ARFAPTIN2 or MX2(N91)-ARFAPTIN2 fusion proteins (green), NUP98 (red), and DAPI-stained DNA. Optical sections are approximately through the center of the vertical dimension on the nucleus. Scale bar = 5 μm. (B–C) Western blot analysis of ARFAPTIN2 fusion protein expression (α-myc and α-LAMIN B1) in B) HeLa or C) HT1080 cells in the presence or absence of doxycycline. (D) Infection of HeLa cells stably transduced with doxycycline-inducible ARFAPTIN2 myc-tagged fusion proteins with various GFP reporter viruses in the presence (white bars) or absence (black bars) of doxycycline. Titers are mean ± sem, n = 3 technical replicates, representative of three independent experiments.
Figure 8—figure supplement 3
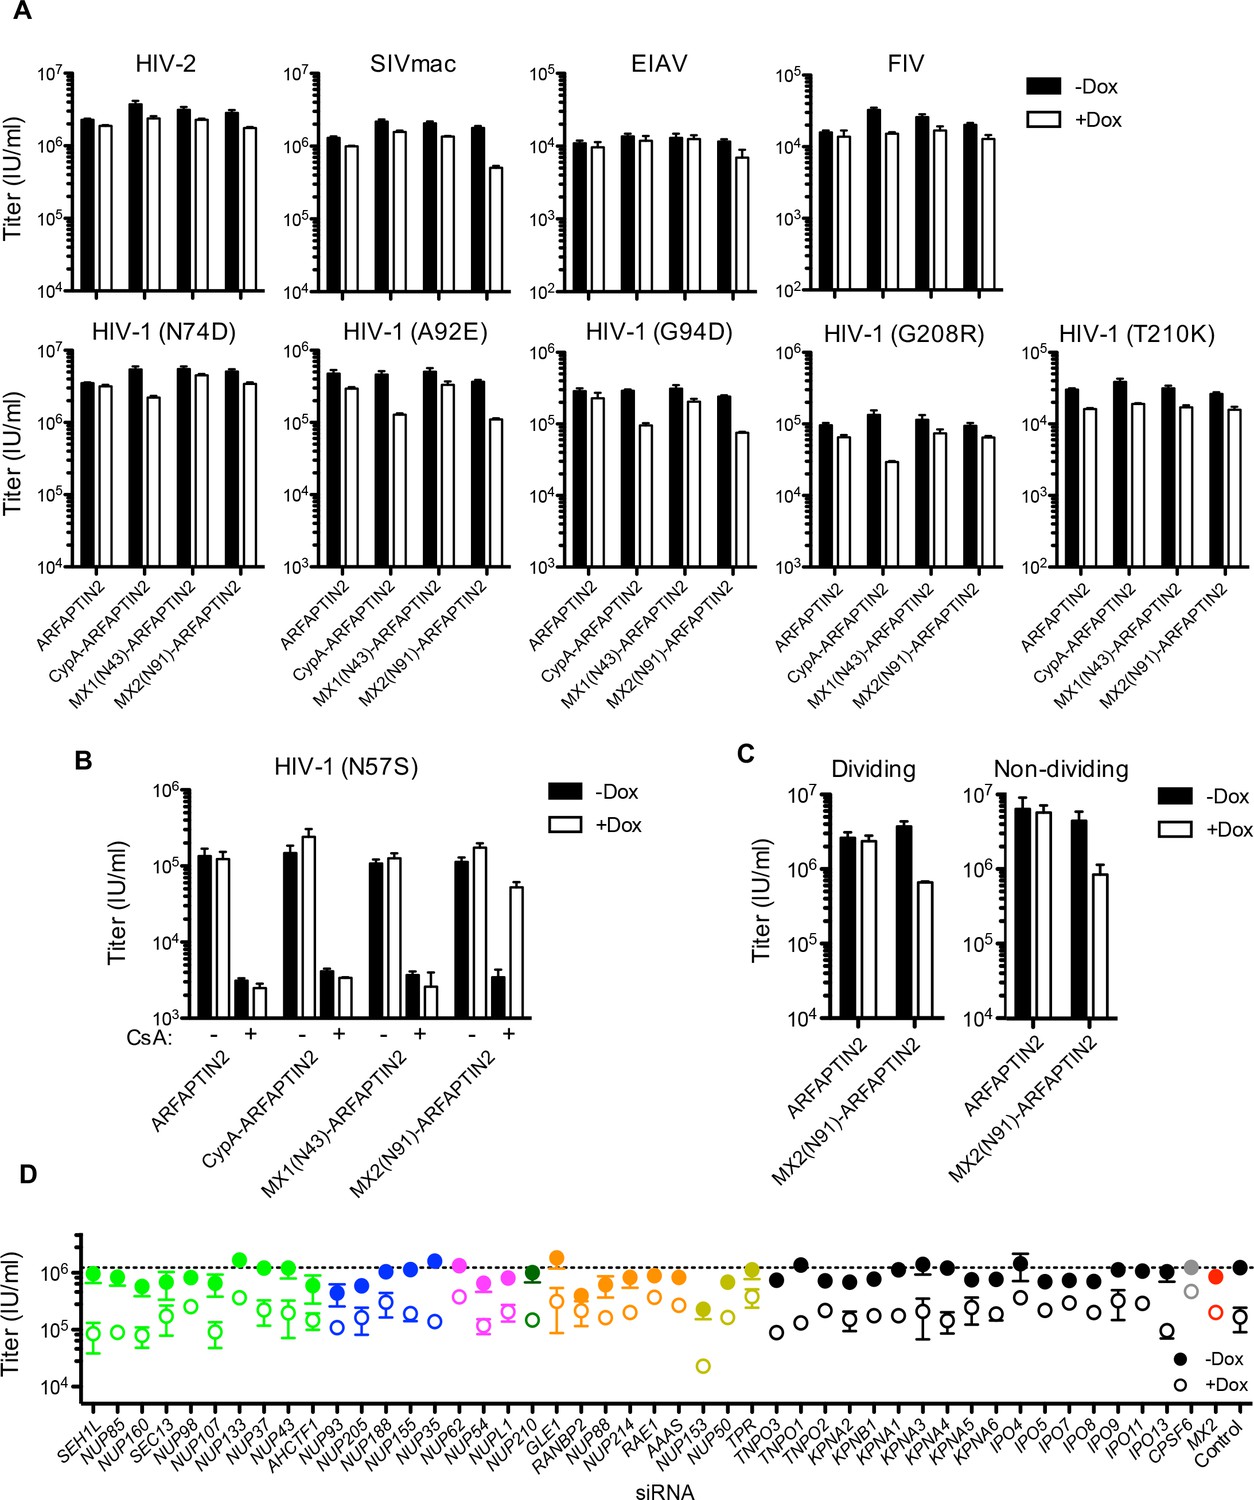
Effect of ARFAPTIN2 fusion protein expression on lentivirus and HIV-1 CA mutant infection.
(A) Infection of HeLa cells stably transduced with doxycycline-inducible arfaptin2 myc-tagged fusion proteins with various GFP reporter viruses in the presence (white bars) or absence (black bars) of doxycycline. Titers are mean ± sem, n = 3 technical replicates, representative of three independent experiments. (B) Infectivity of HIV-1 N57S mutant GFP reporter virus in HT1080 cells stably transduced with arfaptin2 fusion proteins in the presence (white bars) or absence (black bars) of doxycycline and the presence or absence of CsA. Titers are mean ± sem, n = 3 technical replicates, representative of three independent experiments. (C) Infectivity of HIV-1-GFP reporter virus in dividing or non-dividing (aphidicolin treated) HeLa cells stably transduced with doxycycline-inducible arfaptin2 or MX2(N91)-arfaptin2 in the presence (open circles) or absence (filled circles) of doxycycline. Titers are mean ± sem, n = 3 technical replicates and are representative of three independent experiments. (D) Infectivity of HIV-1 GFP reporter virus in growth arrested (aphidicolin treated) HeLa cells stably transduced with doxycycline-inducible MX2(N91)-ARFAPTIN2 in the presence (open circles) or absence (filled circles) of doxycycline. Cells were infected 64 hr after transfection with siRNA (color coded by subcomplex as in Figure 4A). Titers are mean ± sem, n = 3 technical replicates, representative of three independent experiments.
Figure 8—figure supplement 4
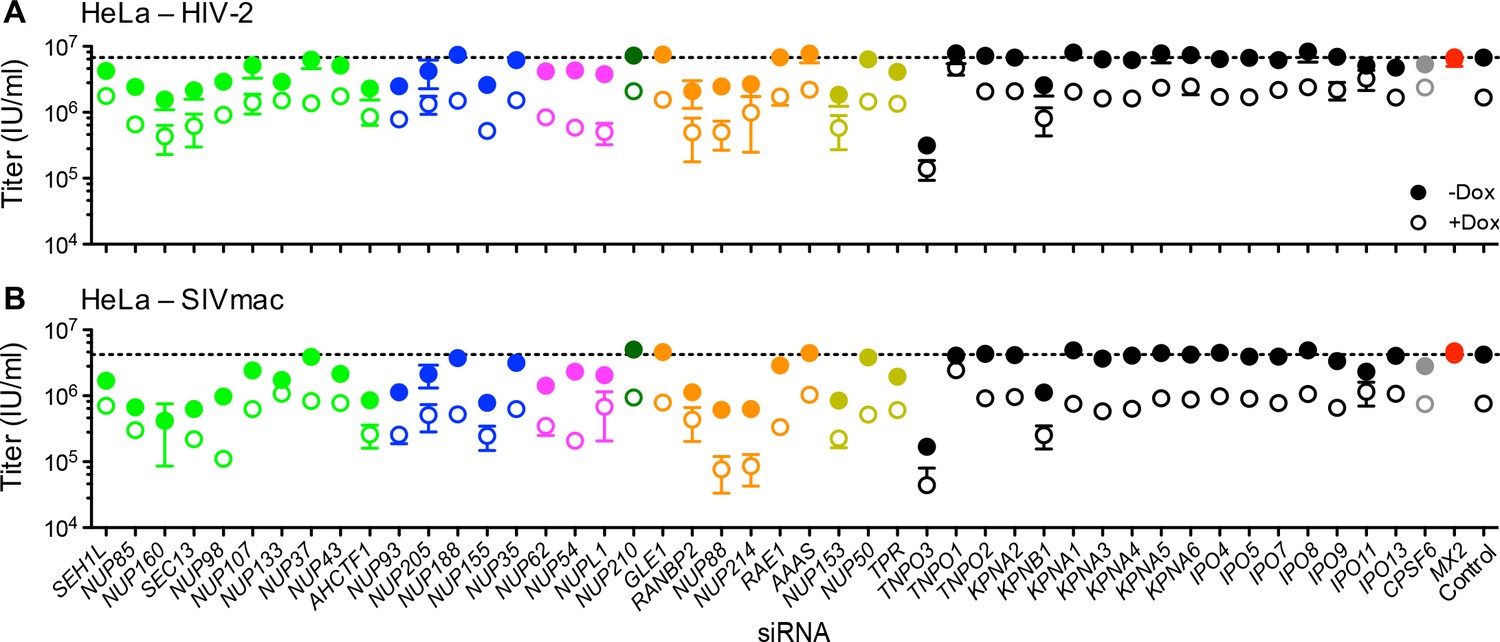
Effect of Nup and NTR depletion on primate lentivirus infection and MX2 sensitivity.
Infectivity of (A) HIV-2 or (B) SIVmac GFP reporter virus in HeLa cells stably transduced with doxycycline-inducible MX2 in the presence (open circles) or absence (filled circles) of doxycycline. Cells were infected 64 hr after transfection with siRNA (color coded by subcomplex as in Figure 4A). Titers are mean ± sem, n = 3 technical replicates, representative of three independent experiments.
Figure 8—figure supplement 5
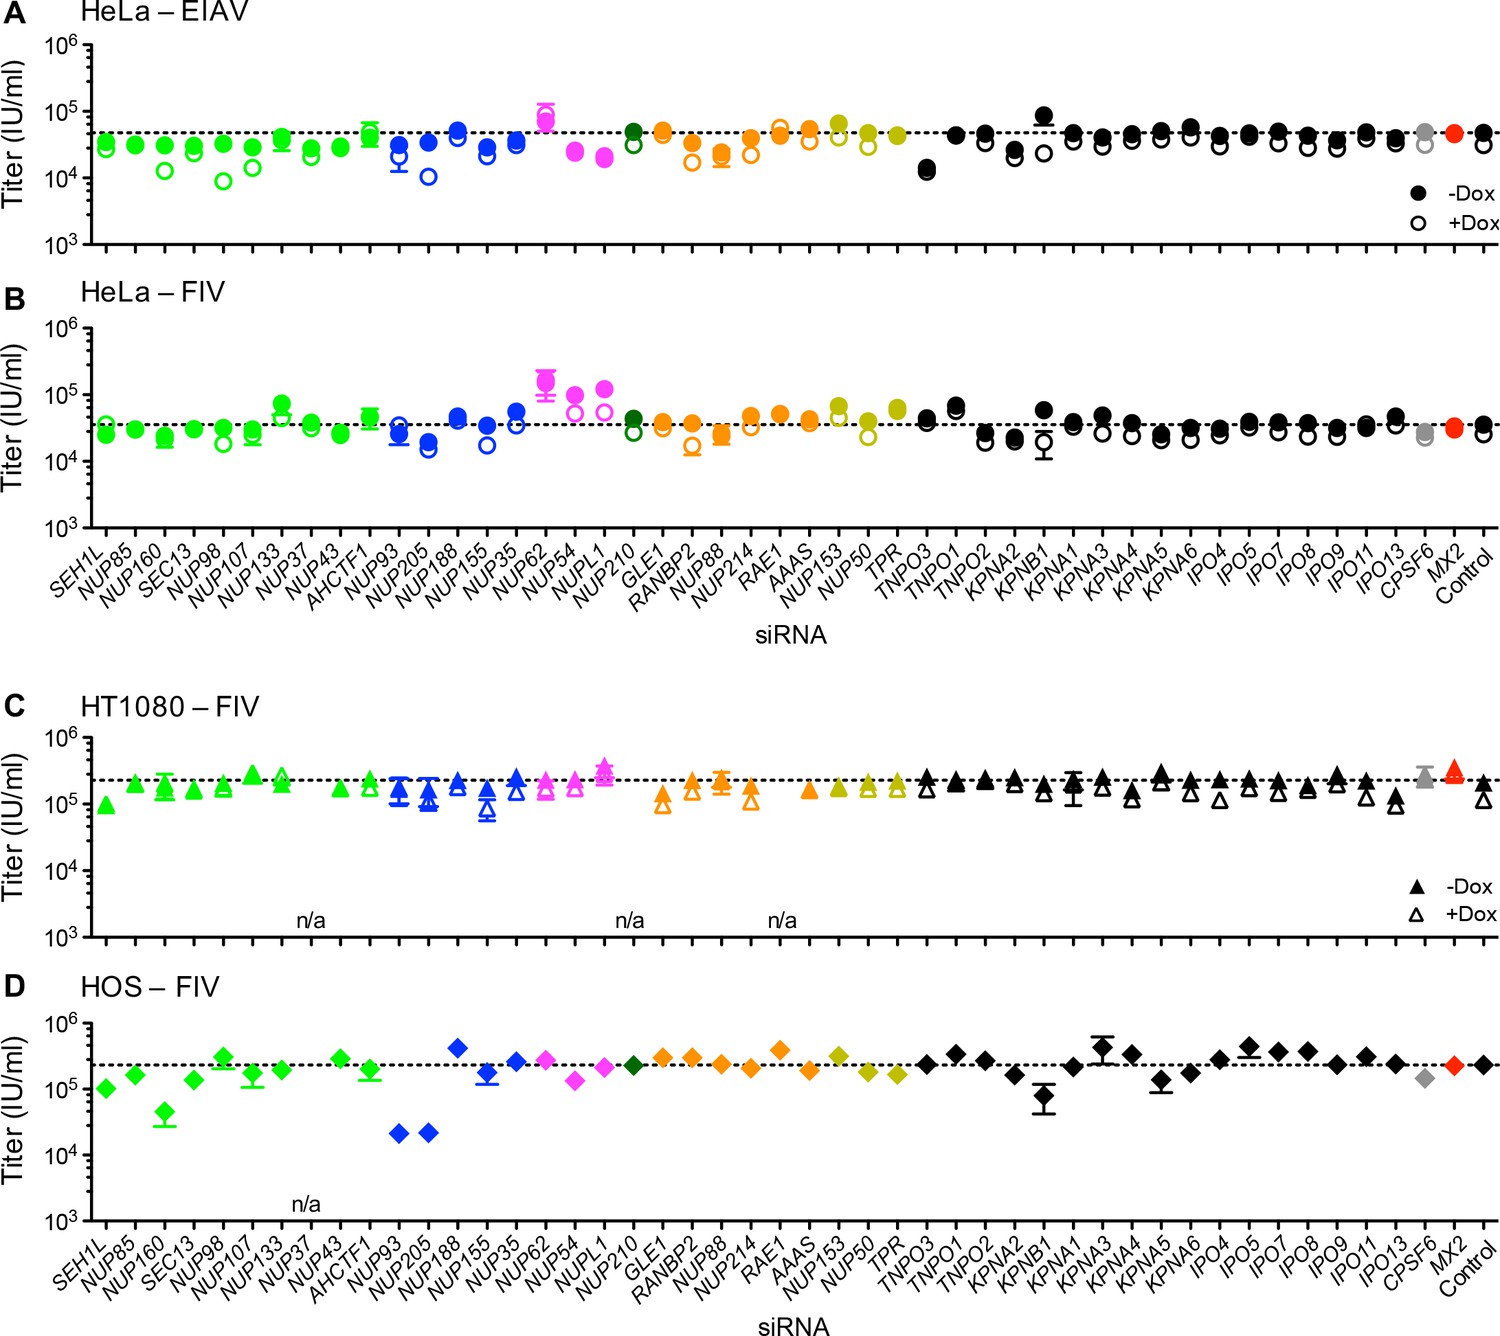
Effect of Nup and NTR depletion on non-primate lentivirus infection and MX2 sensitivity.
Infectivity of (A) EIAV or (B-D) FIV GFP reporter virus in (A-B) HeLa or (C) HT1080 cells stably transduced with doxycycline-inducible MX2 in the presence (open symbols) or absence (filled symbols) of doxycycline, or (D) HOS cells. Cells were infected 64 hr after transfection with siRNA (color coded by subcomplex as in Figure 4A). Titers are mean ± sem, n = 3 technical replicates, representative of three independent experiments. n/a – not included due to insufficient knockdown (NUP37, RAE1) or not expressed (NUP210).
Figure 9 with 1 supplement
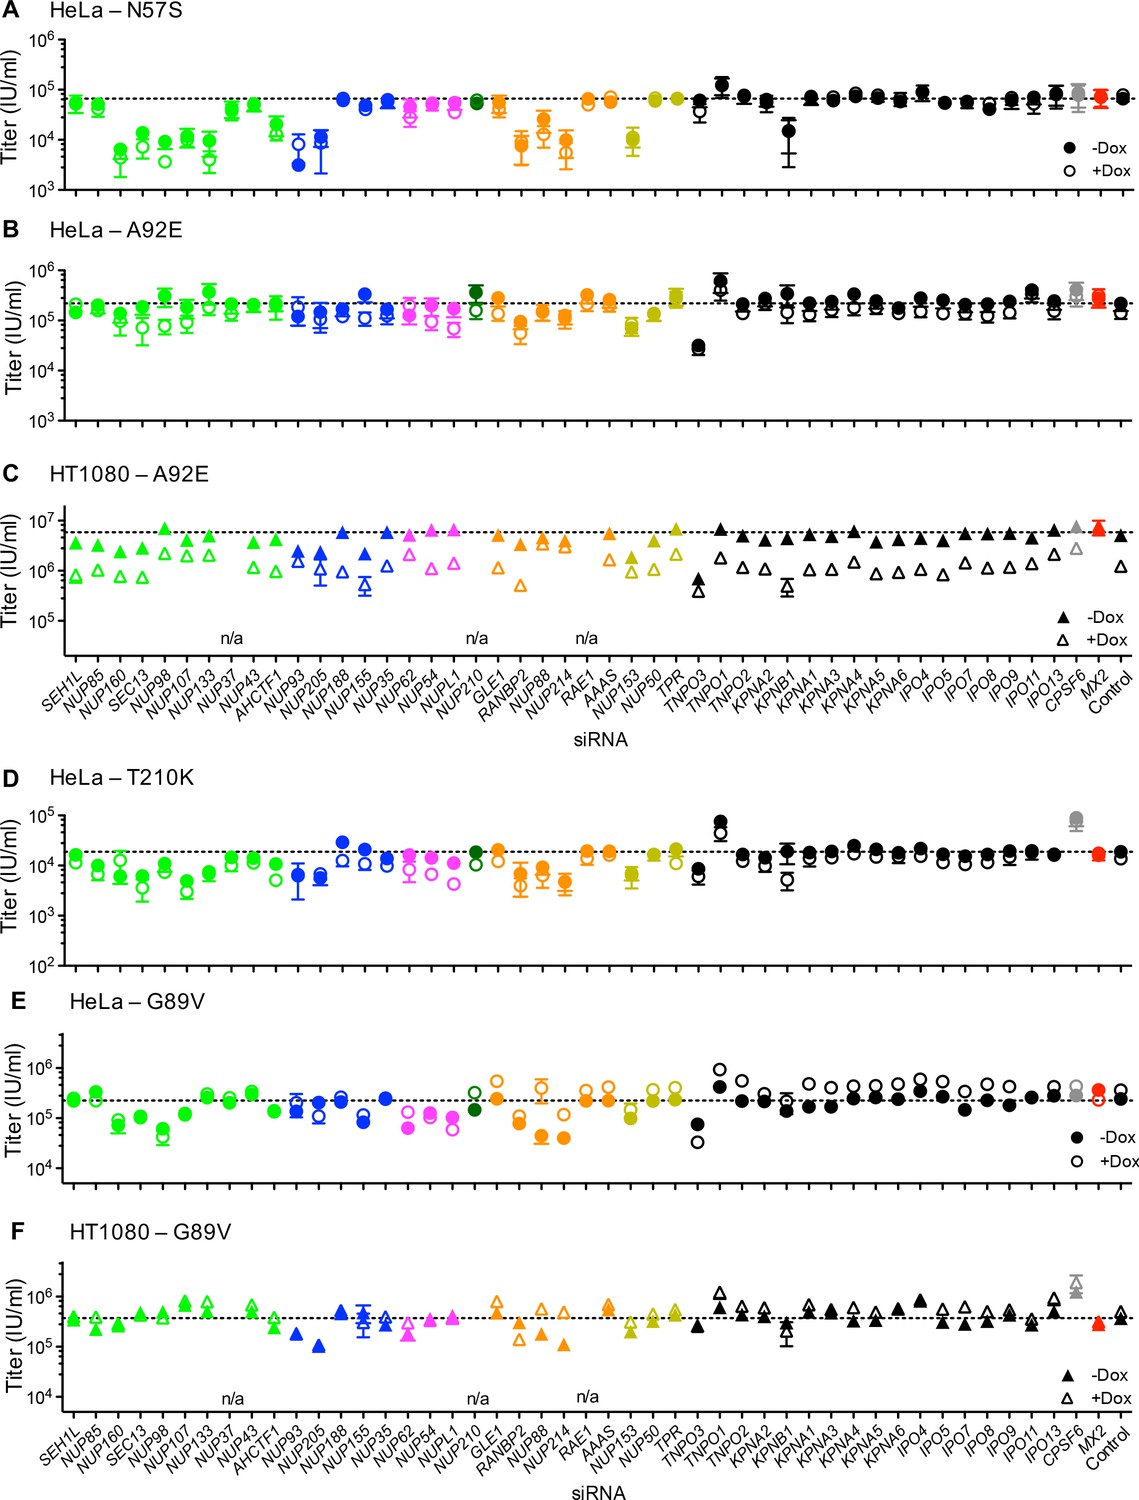
Effect of Nup and NTR depletion on HIV-1 CA mutant infection and MX2 sensitivity.
Infectivity of HIV-1 CA mutant GFP reporter viruses in HeLa or HT1080 cells stably transduced with doxycycline-inducible MX2 in the presence (open symbols) or absence (filled symbols) of doxycycline, 64 hr after transfection with siRNA (color coded by subcomplex as in Figure 4A). Titers are mean ± sem, n ≥ 3 technical replicates, representative of three independent experiments. n/a – not included due to insufficient knockdown (NUP37, RAE1) or not expressed (NUP210).
Figure 9—figure supplement 1

Effect of Nup and NTR depletion on HIV-1 CA mutant infection and MX2 sensitivity.
Infectivity of HIV-1 CA mutant GFP reporter viruses in HOS cells or HT1080 cells stably transduced with doxycycline-inducible MX2 in the presence (open symbols) or absence (filled symbols) of doxycycline. Cells were infected 64 hr after transfection with siRNA (color coded by subcomplex as in Figure 4A). Titers are mean ± sem, n = 3 technical replicates, representative of three independent experiments. n/a – not included due to insufficient knockdown (NUP37, RAE1) or not expressed (NUP210).
Figure 10
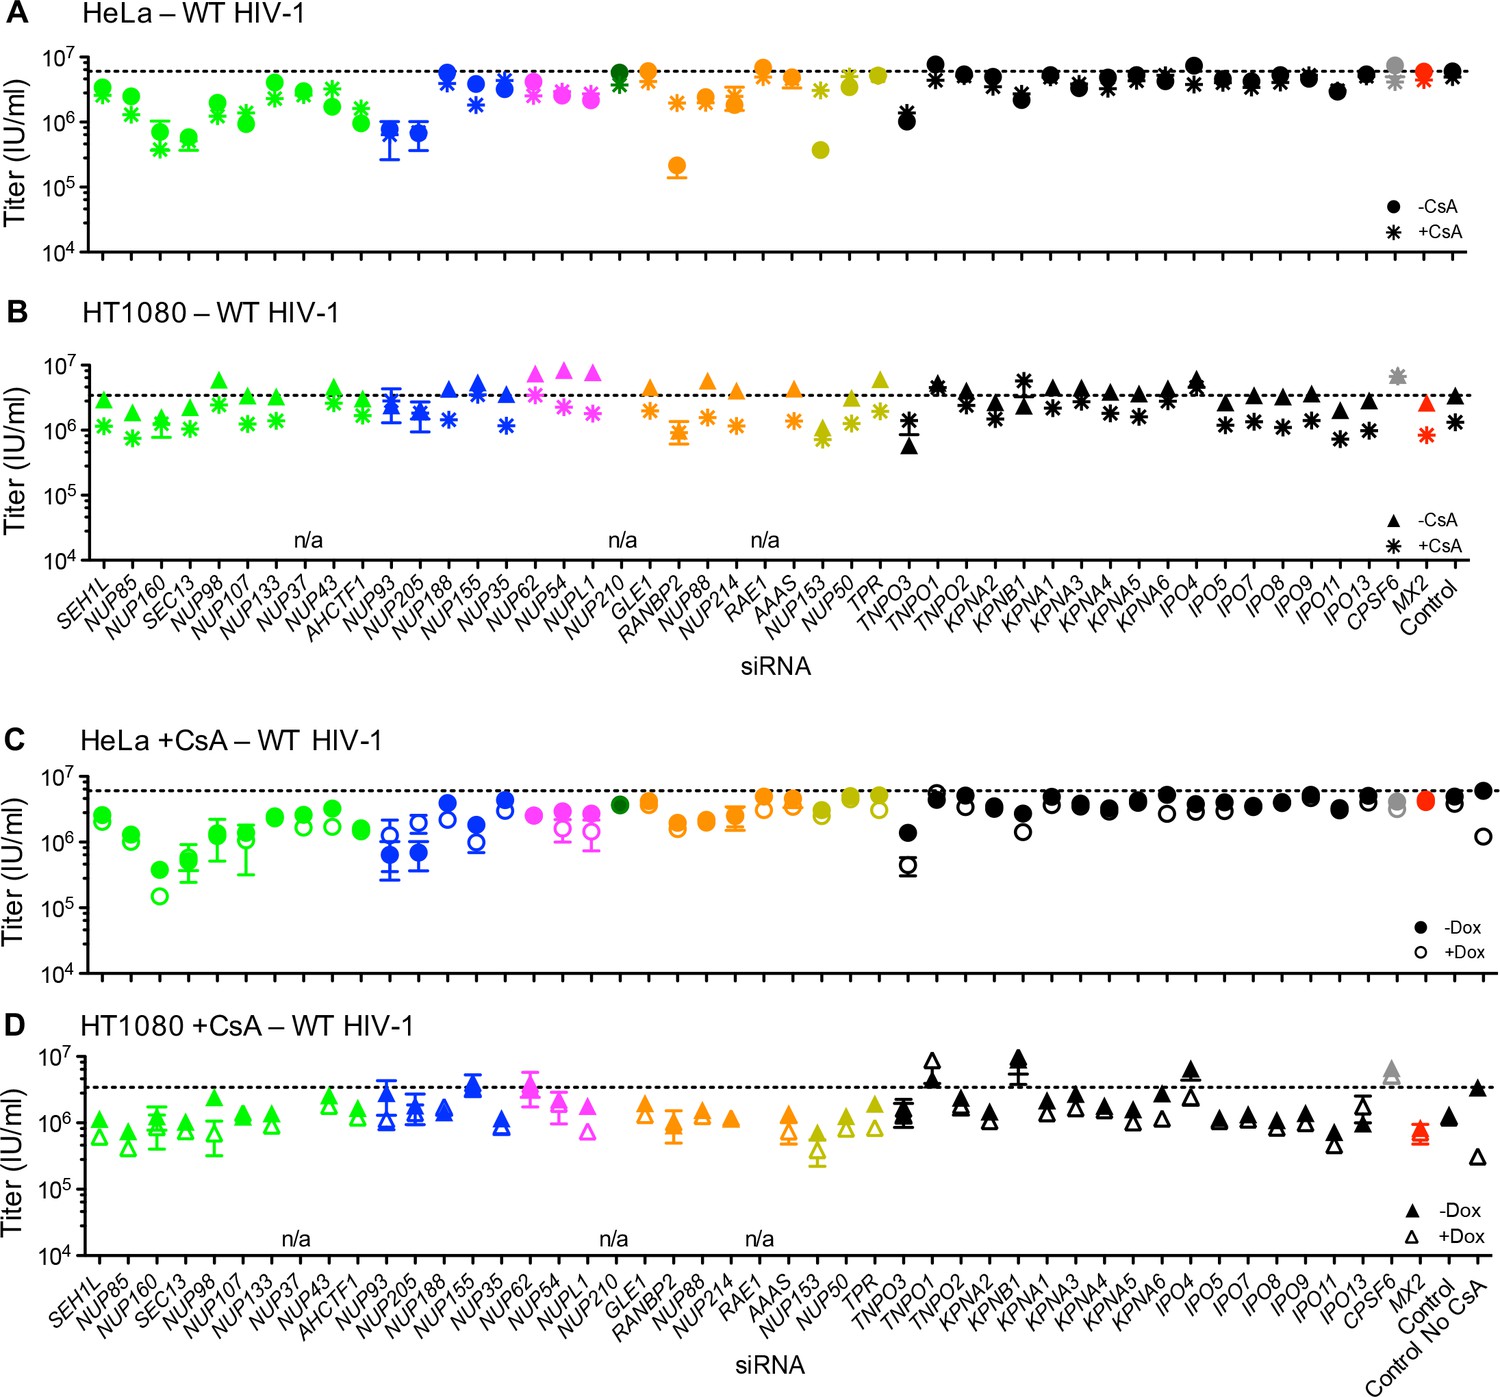
Effect of Nup and NTR depletion on HIV-1 infection and MX2 sensitivity in the presence of CsA.
(A–B) Infectivity of HIV-1 GFP reporter virus in HeLa or HT1080 cells stably transduced with doxycycline-inducible MX2 in the absence of doxycycline and in the presence (asterisks) or absence (circles, HeLa or triangles, HT1080) of CsA. Cells were infected 64 hr after transfection with siRNA (color coded by subcomplex as in Figure 4A). (C–D) Infectivity of HIV-1 GFP reporter virus in HeLa or HT1080 cells stably transduced with doxycycline-inducible MX2 in the presence of CsA and in the presence (open symbols) or absence (filled symbols) of doxycycline. Cells were infected 64 hr after transfection with siRNA (color coded by subcomplex as in Figure 4A). Titers are mean ± sem, n = 3 technical replicates, representative of three independent experiments. n/a – not included due to insufficient knockdown (NUP37, RAE1) or not expressed (NUP210).
Figure 11
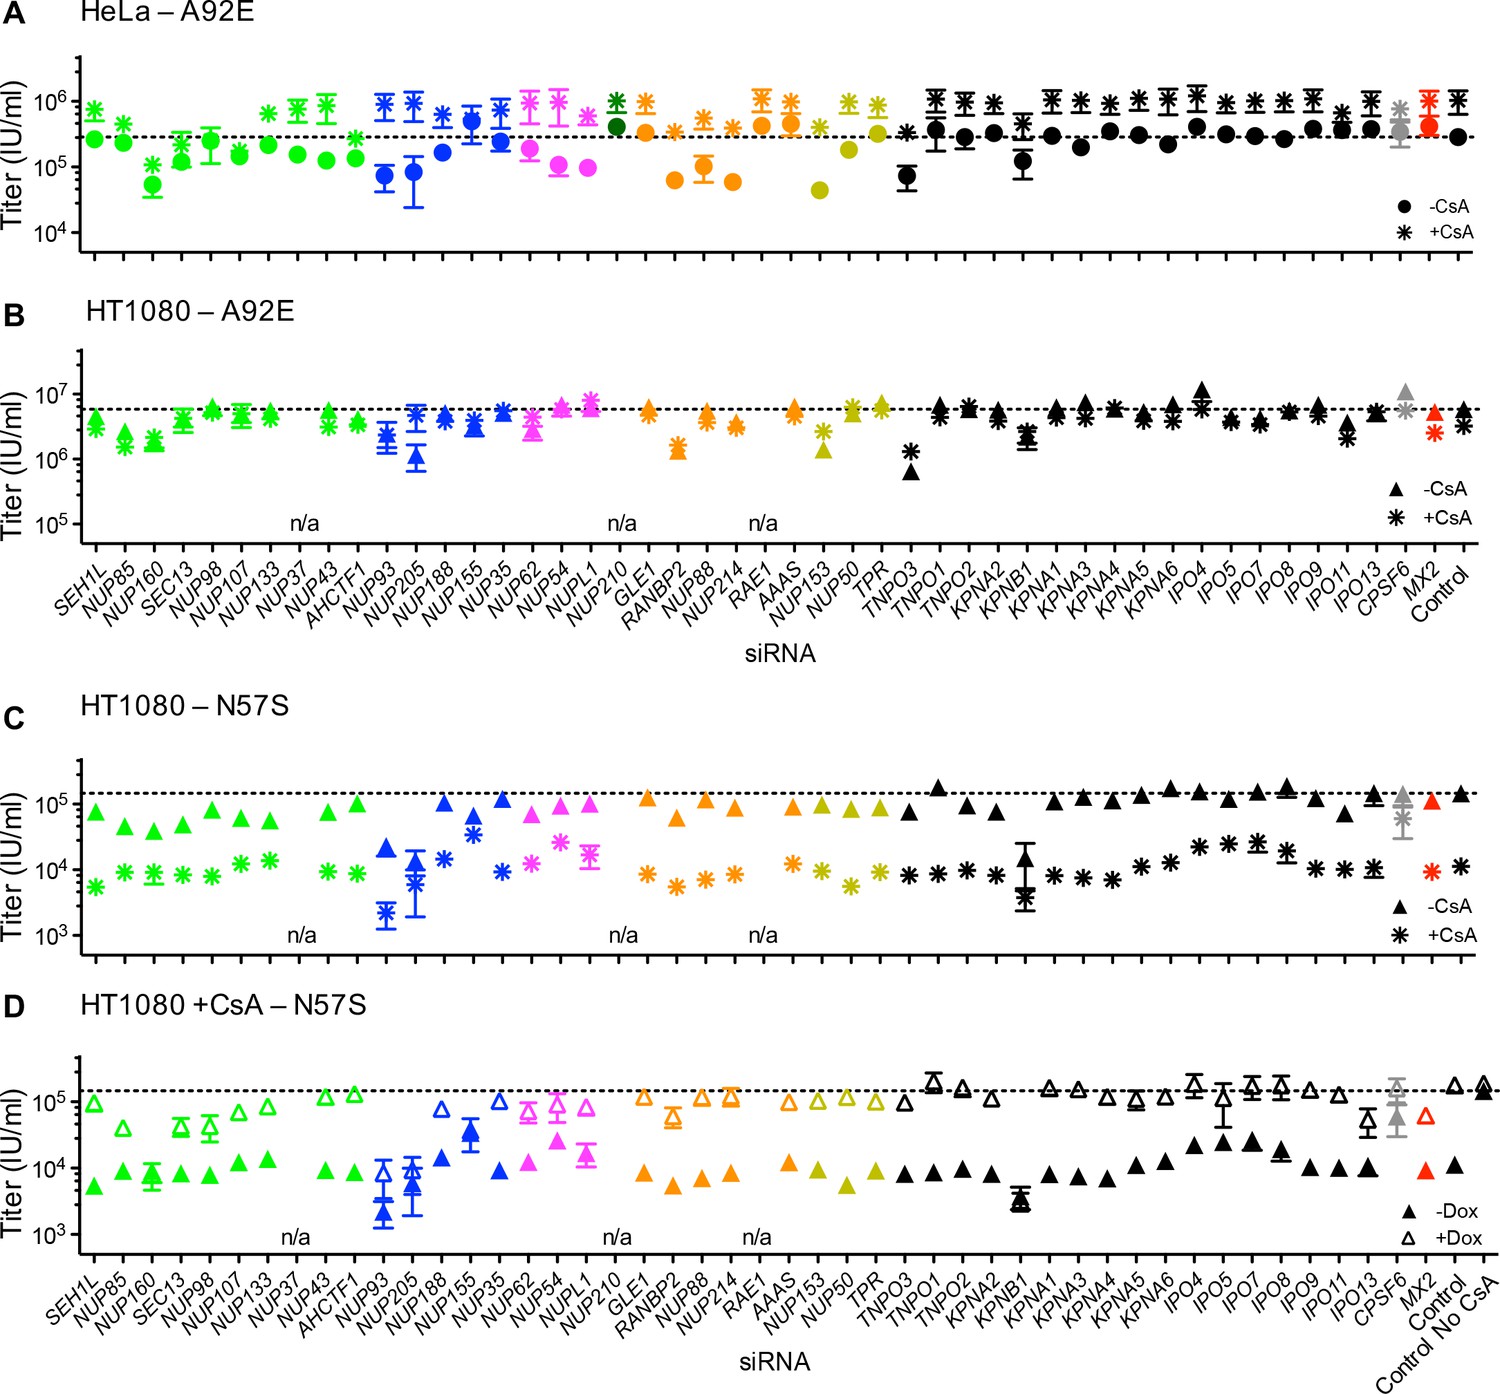
Effect of Nup and NTR depletion on HIV-1 A92E and N57S CA mutant infection in the presence of CsA.
(A–C) Infectivity of HIV-1 A92E or N57S GFP reporter viruses in HeLa or HT1080 cells stably transduced with doxycycline-inducible MX2 in the absence of doxycycline and in the presence (asterisks) or absence (circles, HeLa or triangles, HT1080) of 5 μM CsA. Cells were infected 64 hr after transfection with siRNA (color coded by subcomplex as in Figure 4A). X-axis legend for A-B is below graph B, x-axis legend for C-D is below graph D. (D) Infectivity of HIV-1 N57S GFP reporter virus in HT1080 cells stably transduced with doxycycline-inducible MX2 in the presence of CsA and in the presence (open symbols) or absence (filled symbols) of doxycycline. Cells were infected 64 hr after transfection with siRNA (color coded by subcomplex as in Figure 4A). Titers are mean ± sem, n = 3 technical replicates, representative of three independent experiments. n/a – not included due to insufficient knockdown (NUP37, RAE1) or not expressed (NUP210).
Figure 12

MX2 can inhibit nuclear transport of nonviral cargos in an import pathway dependent manner.
(A) HeLa cells stably transduced with vectors expressing the indicated NLS-GFP-LacZ fusion protein (green) and doxycycline-inducible MX2-RFP, were untreated or treated with doxycycline to induce MX2-RFP prior to being fixed and stained with Hoechst. Representative of three independent experiments, with at least three images acquired per experiment. (B) Schematic representing NLS-GFP-LacZ fusion location in the presence or absence of MX2-RFP (indicated in red).
Tables
Table 1
Nuclear localization signals fused to GFP-LacZ
https://doi.org/10.7554/eLife.35738.058| Parent protein | NLS-type | Reference(s) | Cloning method |
|---|---|---|---|
| SV40 Large T Antigen | Monopartite class 1 | (Mattaj and Englmeier, 1998) | oligonucleotide annealing |
| C-MYC | Monopartite class 2 | (Kosugi et al., 2009) | oligonucleotide annealing |
| DDX21 | Monopartite class 3 | (Kosugi et al., 2009) | oligonucleotide annealing |
| Nucleoplasmin | Bipartite | (Mattaj and Englmeier, 1998) | oligonucleotide annealing |
| HNRNP K (KNS) | n/a | (Michael et al., 1997) | PCR amplification |
| HTLV-1 Rex | n/a | (Siomi et al., 1988; Slamon et al., 1988) | oligonucleotide annealing |
| MX2 | n/a | (Melén et al., 1996) | PCR amplification |
Table 2
ON-TARGET SMARTpool siRNA utilized in this investigation
https://doi.org/10.7554/eLife.35738.059| Gene symbol | Gene ID |
|---|---|
| AAAS | 8086 |
| AHCTF1 | 25909 |
| CPSF6 | 11052 |
| GLE1 | 2733 |
| IPO11 | 51194 |
| IPO13 | 9670 |
| IPO4 | 79711 |
| IPO5 | 3843 |
| IPO7 | 10527 |
| IPO8 | 10526 |
| IPO9 | 55705 |
| KPNA1 | 3836 |
| KPNA2 | 3838 |
| KPNA3 | 3839 |
| KPNA4 | 3840 |
| KPNA5 | 3841 |
| KPNA6 | 23633 |
| KPNB1 | 3837 |
| MX2 | 4600 |
| NDC1 | 55706 |
| NUP107 | 57122 |
| NUP133 | 55746 |
| NUP153 | 9972 |
| NUP155 | 9631 |
| NUP160 | 23279 |
| NUP188 | 23511 |
| NUP205 | 23165 |
| NUP210 | 23225 |
| NUP214 | 8021 |
| NUP35 | 129401 |
| NUP37 | 79023 |
| NUP43 | 348995 |
| NUP50 | 10762 |
| NUP54 | 53371 |
| NUP62 | 23636 |
| NUP85 | 79902 |
| NUP88 | 4927 |
| NUP93 | 9688 |
| NUP98 | 4928 |
| NUPL1 | 9818 |
| POM121 | 9883 |
| RAE1 | 8480 |
| RANBP2 | 5903 |
| SEC13 | 6396 |
| SEH1L | 81929 |
| TNPO1 | 3842 |
| TNPO2 | 30000 |
| TNPO3 | 23534 |
| TPR | 7175 |
Table 3
Antibodies utilized in this investigation
https://doi.org/10.7554/eLife.35738.060| Reactivity | Species | Company | Catalog number |
|---|---|---|---|
| ALADIN | rabbit | Novus Biologicals | NBP2-21596 |
| CPSF6 | rabbit | ProteinTech | 15489–1-AP |
| CPSF6 | rabbit | Abcam | ab175237 |
| ELYS | mouse | Abcam | ab53540 |
| GAPDH | mouse | Santa Cruz | sc-32233 |
| KPNA1 | rabbit | ProteinTech | 18137–1-AP |
| KPNA2 | rabbit | Abcam | ab84440 |
| LAMIN B1 | rabbit | Abcam | ab133741 |
| MX2 | rabbit | Novus Biologicals | NBP1-8108 |
| MYCtag | mouse | Millipore | 05–724 |
| NDC1 | rabbit | Novus Biologicals | NBP1-91603 |
| NUP107 | rabbit | Abcam | ab73290 |
| NUP133 | mouse | Santa Cruz | 376763 |
| NUP153 | mouse | Abcam | ab24700 |
| NUP155 | rabbit | Abcam | ab157104 |
| NUP160 | rabbit | Abcam | ab74147 |
| NUP188 | rabbit | Abcam | ab86601 |
| NUP205 | rabbit | Abcam | ab157090 |
| NUP210 | rabbit | Novus Biologicals | NB100-93336 |
| NUP214 | rabbit | Bethyl Labs | IHC-00103 |
| NUP35 | rabbit | Bethyl Labs | A301-781A |
| NUP37 | rabbit | Abcam | ab201161 |
| NUP43 | rabbit | Bethyl Labs | A303-976A |
| NUP50 | rabbit | Bethyl Labs | A301-783A |
| NUP54 | rabbit | ProteinTech | 16232–1 AP |
| NUP62 | mouse | BD Biosciences | 610498 |
| NUP62 | mouse FITC-conjugated | BD Biosciences | 611962 |
| NUP85 | mouse | Santa Cruz | 376111 |
| NUP88 | mouse | BD Biosciences | 611896 |
| NUP93 | mouse | Abcam | ab53750 |
| NUP98 | rabbit | Cell Signaling | C39A3 |
| NUPL1 | rabbit | ProteinTech | 19907–1-AP |
| HIV-1 p24 | mouse | NIH AIDS Reagent Program | 182-H12-5C |
| POM121 | rabbit | Abcam | ab190015 |
| POM121 | rabbit | ProteinTech | 15645–1-AP |
| RAE1 | rabbit | Abcam | ab124783 |
| RANBP2 | rabbit | Abcam | ab64276 |
| SEC13 | rabbit | ProteinTech | 15397 |
| TNPO1 | mouse | Sigma-Aldrich | WH0003842M1 |
| TNPO3 | mouse | Abcam | ab54353 |
| TPR | rabbit | Abcam | wh000717m1 |
| TUBULIN | mouse | Sigma-Aldrich | T6074 |
Additional files
-
Supplementary File 1
Statistical analyses.
Tab 1. Figure 1 statistics. P values generated from two-tailed paired t tests for data represented in Figure 1. Tab 2. Nup and NTR knockdown statistics 1. P values generated from two-tailed paired t tests for data represented in Figures 8–11, addressing significance within experiments. Tab 3. Nup and NTR knockdown statistics 2. P values generated from two-tailed unpaired t tests for data represented in Figures 8–11, addressing significance between experiments. Tab 4. Figure 8 additional statistics. P values generated from two-tailed paired t tests for data represented in Figure 8—figure supplements 2D and 3A–C.
- https://doi.org/10.7554/eLife.35738.061
-
Transparent reporting form
- https://doi.org/10.7554/eLife.35738.062
Download links
A two-part list of links to download the article, or parts of the article, in various formats.
Downloads (link to download the article as PDF)
Open citations (links to open the citations from this article in various online reference manager services)
Cite this article (links to download the citations from this article in formats compatible with various reference manager tools)
Nuclear pore heterogeneity influences HIV-1 infection and the antiviral activity of MX2
eLife 7:e35738.
https://doi.org/10.7554/eLife.35738


