Cytokine receptor-Eb1 interaction couples cell polarity and fate during asymmetric cell division
- University of Michigan, United States
Figures
Figure 1 with 1 supplement
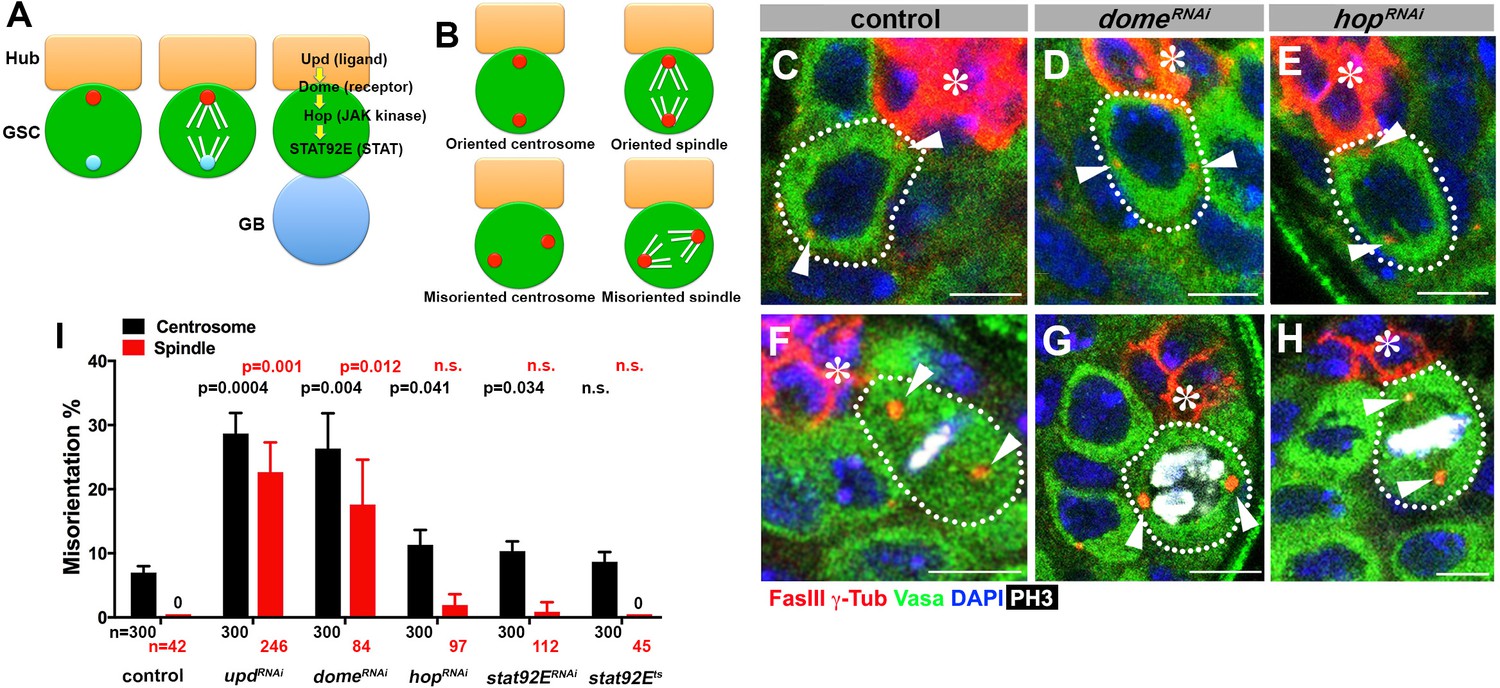
upd and dome regulate centrosome/spindle orientation independent of the self-renewal pathway.
(A) Asymmetric GSC divisions. Stereotypical positioning of mother (red circle) and daughter (blue circle) centrosomes leads to spindle orientation that places the gonialblast (GB) away from the hub. (B) The definition of oriented/misoriented centrosomes/spindles. (C–E) Examples of centrosome orientation in control (C), nos-gal4ΔVP16, gal80ts > UAS-domeRNAi (4 d after RNAi induction) (D), and nos-gal4ΔVP16, gal80ts > UAS-hopRNAi (4 d after RNAi induction) (E) GSCs (indicated by a white dotted line). Asterisk indicates the hub. Arrowheads indicate centrosomes. Green: Vasa (germ cells). Red: Fas III (hub cells) and γ-Tubulin (centrosome). Blue: DAPI. Bar: 5 µm. (F–H) Examples of spindles in control (F), nos-gal4ΔVP16, gal80ts > UAS-domeRNAi (4 d after RNAi induction) (G), and nos-gal4ΔVP16, gal80ts > UAS-hopRNAi (4 d after RNAi induction) (H) GSCs (indicated by a white dotted line). Arrowheads indicate spindle poles. Green: Vasa. Red: Fas III and γ-Tubulin. White: Thr 3-phosphorylated histone H3 (PH3) (mitotic chromosomes). Blue: DAPI. Bar: 5 µm. (I) Summary of GSC centrosome/spindle misorientation in the indicated genotypes. P value comparing control and the indicated genotypes was calculated using two-tailed Student’s t-test. Error bars indicate the standard deviation. N = GSC number scored for centrosome orientation or N = mitotic GSC number scored for spindle orientation.
Figure 1—figure supplement 1
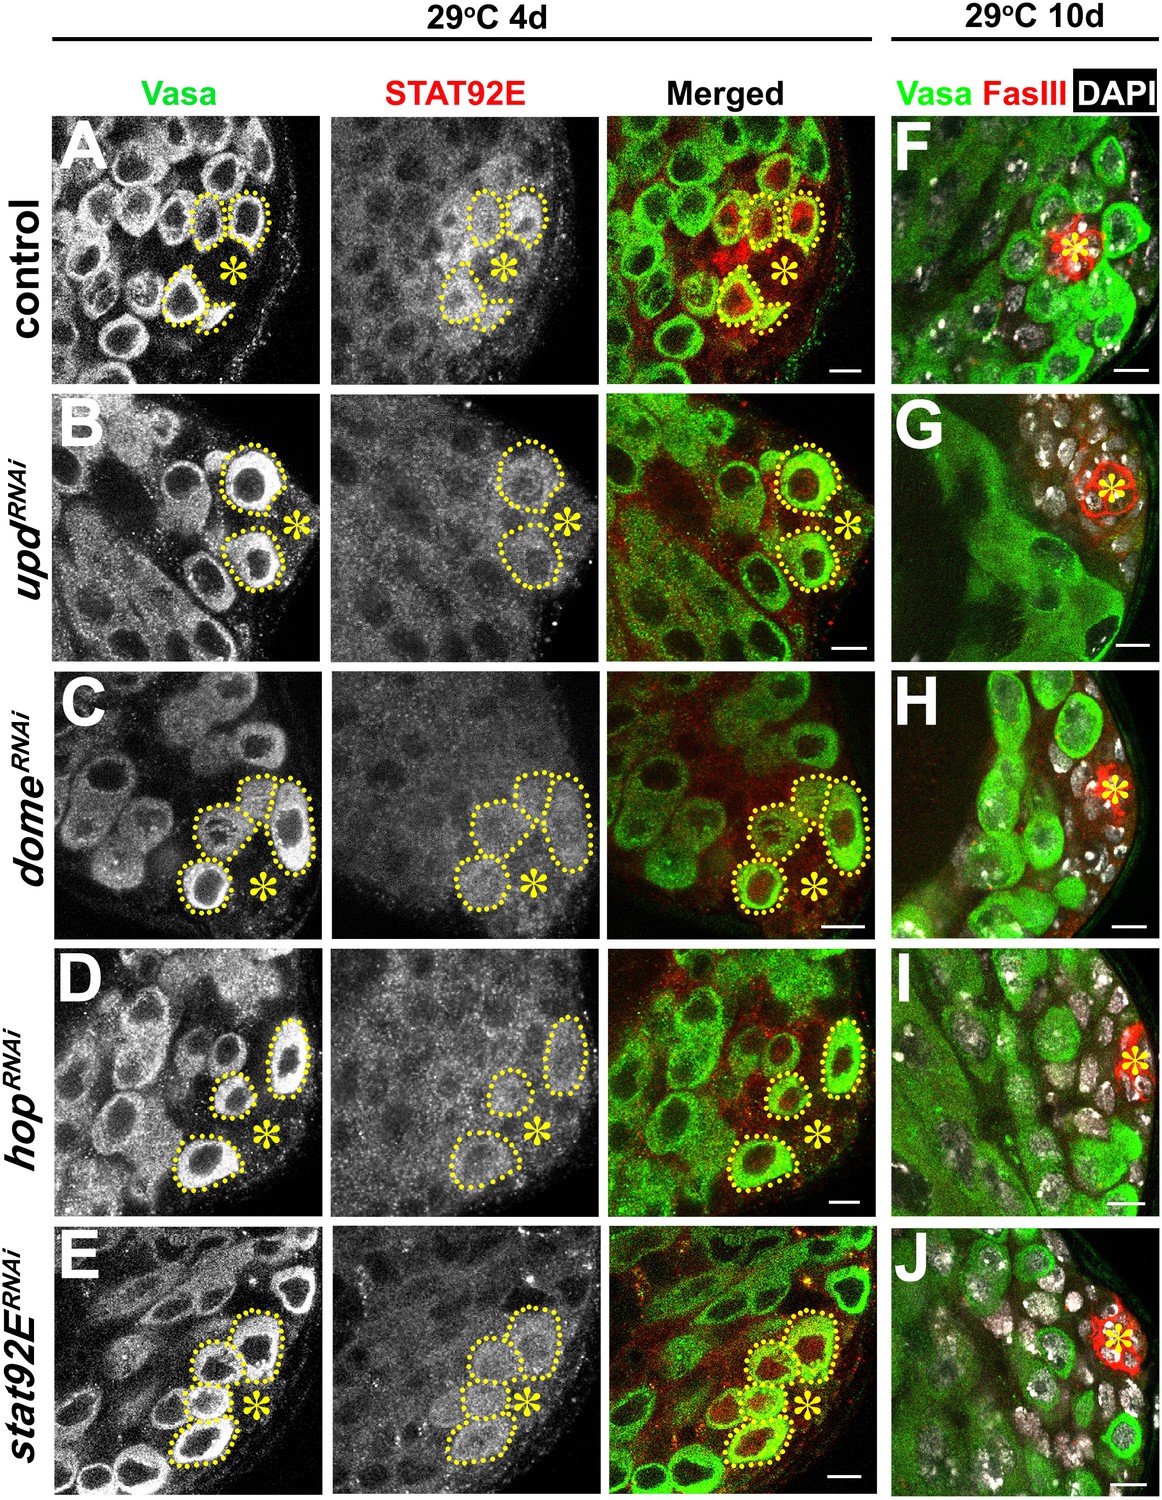
Validation of RNAi for the JAK-STAT pathway components.
(A–E) Examples of Stat92E staining after 4 days at 29°C in control (A), upd-gal4, gal80ts > UAS-updRNAi (B), nos-gal4ΔVP16, gal80ts > UAS-domeRNAi (C), nos-gal4ΔVP16, gal80ts > UAS-hopRNAi (D), and nos-gal4ΔVP16, gal80ts > UAS-stat92ERNAi (E) testes. Asterisk indicates the hub. GSCs are indicated by dotted lines. Green: Vasa. Red: Stat92E. Bar: 5 μm. (F–J) Examples of apical tip after 10 days at 29°C in control (F), upd-gal4, gal80ts > UAS-updRNAi (G), nos-gal4ΔVP16, gal80ts > UAS-domeRNAi (H), nos-gal4ΔVP16, gal80ts > UAS-hopRNAi (I), and nos-gal4ΔVP16, gal80ts > UAS-stat92ERNAi (J) testes. Green: Vasa. Red: FasIII. DAPI: white. Bar: 5 μm.
Figure 2
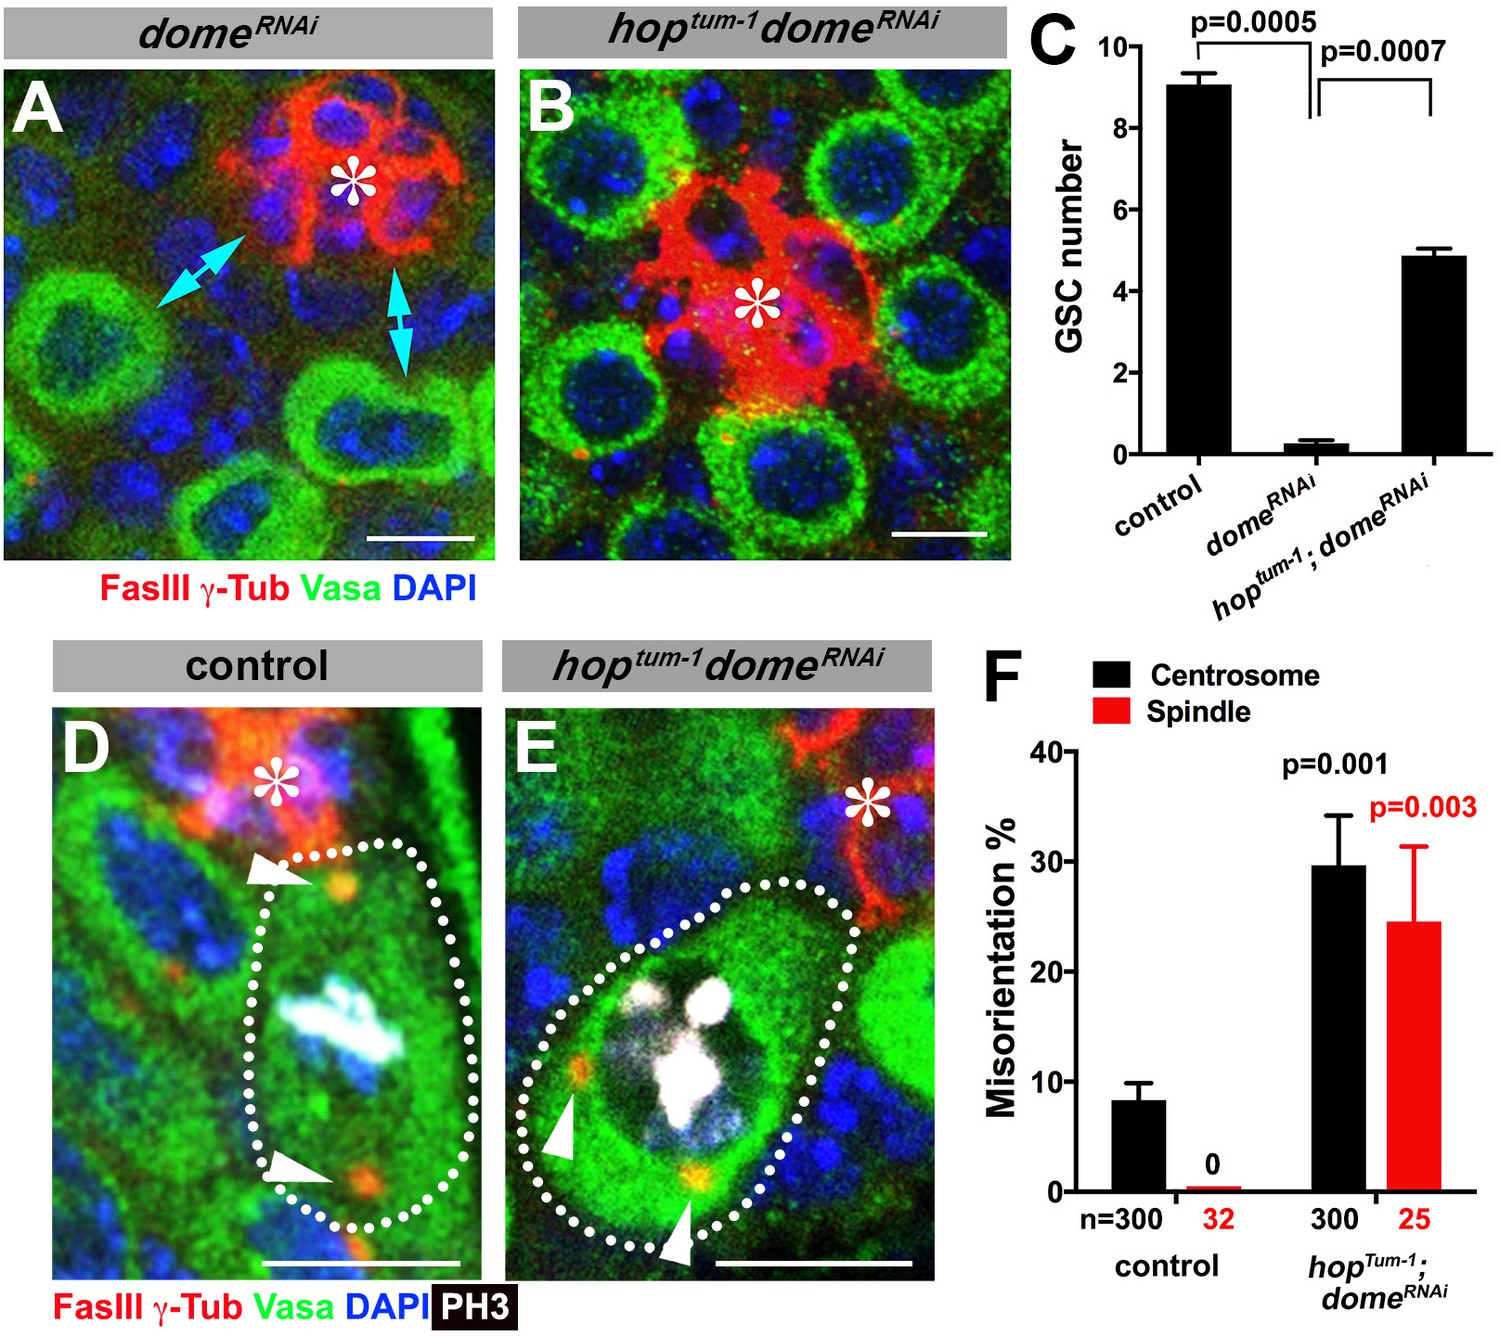
Gain-of-function mutant of the JAK kinase hop significantly rescues GSC loss but not centrosome/spindle orientation caused by domeRNAi.
(A–B) Examples of apical tip in nos-gal4 > UAS-domeRNAi (A) and hoptum-1, nos-gal4 > UAS- domeRNAi (B) testes. Double-headed arrows indicate the gap between the hub and nearest germ cells, showing GSC loss. Green: Vasa. Red: FasIII. Blue: DAPI. Bar: 5 μm. (C) GSC numbers in the indicated genotypes. P value was calculated using two-tailed Student’s t-test. Error bars indicate the standard deviation. (D–E) Examples of spindles in control (D) and hoptum-1, nos-gal4 > UAS-domeRNAi (E) GSCs (indicated by a white dotted line). Asterisk indicates the hub. Arrowheads indicate spindle poles. Green: Vasa. Red: Fas III and γ-Tubulin. White: PH3. Blue: DAPI. Bar: 5 µm. (F) Summary of GSC centrosome/spindle misorientation in the indicated genotypes. P value comparing to control was calculated using two-tailed Student’s t-test. Error bars indicate the standard deviation. N = GSC number scored for centrosome orientation or mitotic GSC number scored for spindle orientation.
Figure 3 with 2 supplements
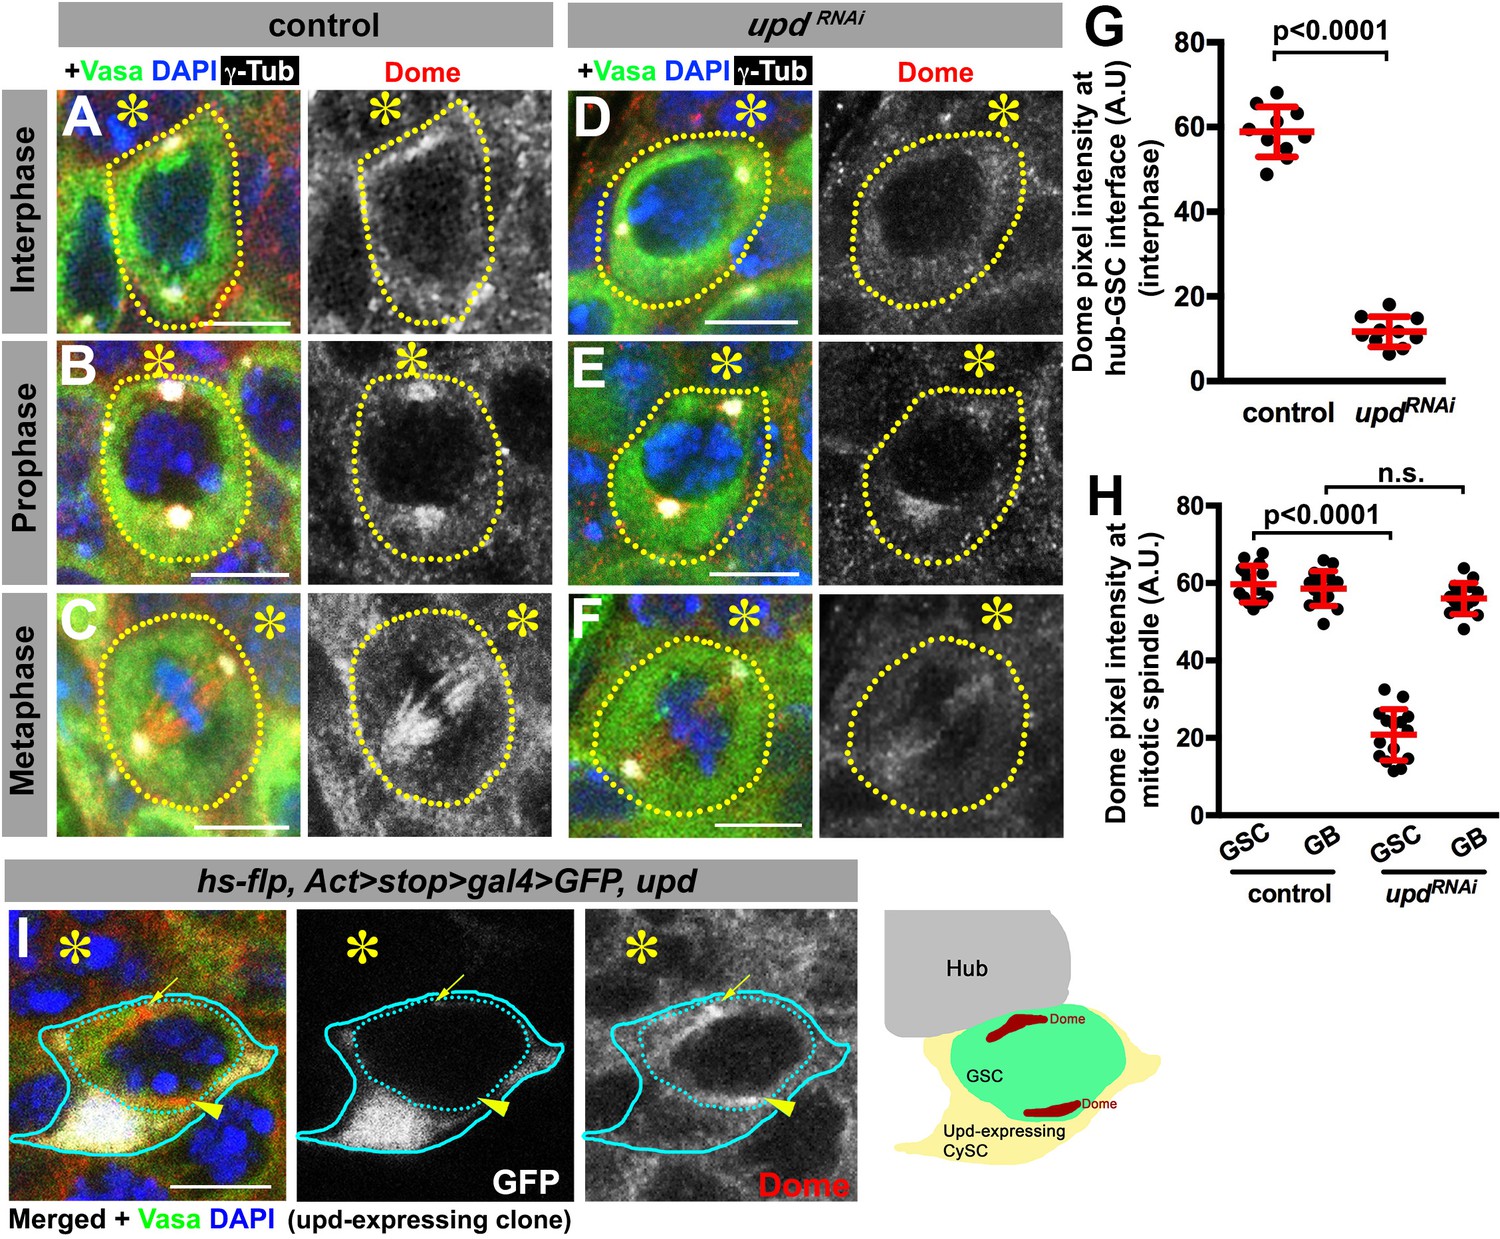
Dome localizes to the hub-GSC interface and mitotic spindle in a Upd-dependent manner.
(A–F) Dome localization in control interphase (A), prophase (B), metaphase (C), upd-gal4, gal80ts > UAS-updRNAi (4 d after RNAi induction) interphase (D), prophase (E), and metaphase (F) GSCs. Green: Vasa. Red: Dome. White: γ-Tubulin. Blue: DAPI. Asterisk indicates the hub. (G–H) Pixel intensity analyses of Dome at interphase (G) and mitotic (H) GSCs in control or upd-gal4, gal80ts > UAS-updRNAi (4 d after RNAi induction) testes. P value was calculated using two-tailed Student’s t-test. Error bars indicate the standard deviation. (I) A GSC (inside the dotted blue line) adjacent to a Upd-expressing cyst stem cell clone (blue line) with ectopic Dome localization (arrowhead), in addition to normal Dome localization near the hub (arrow). Fly genotype: hs-flp, Act-FRT-stop-FRT-gal4 > UAS-GFP, UAS-upd.
Figure 3—figure supplement 1
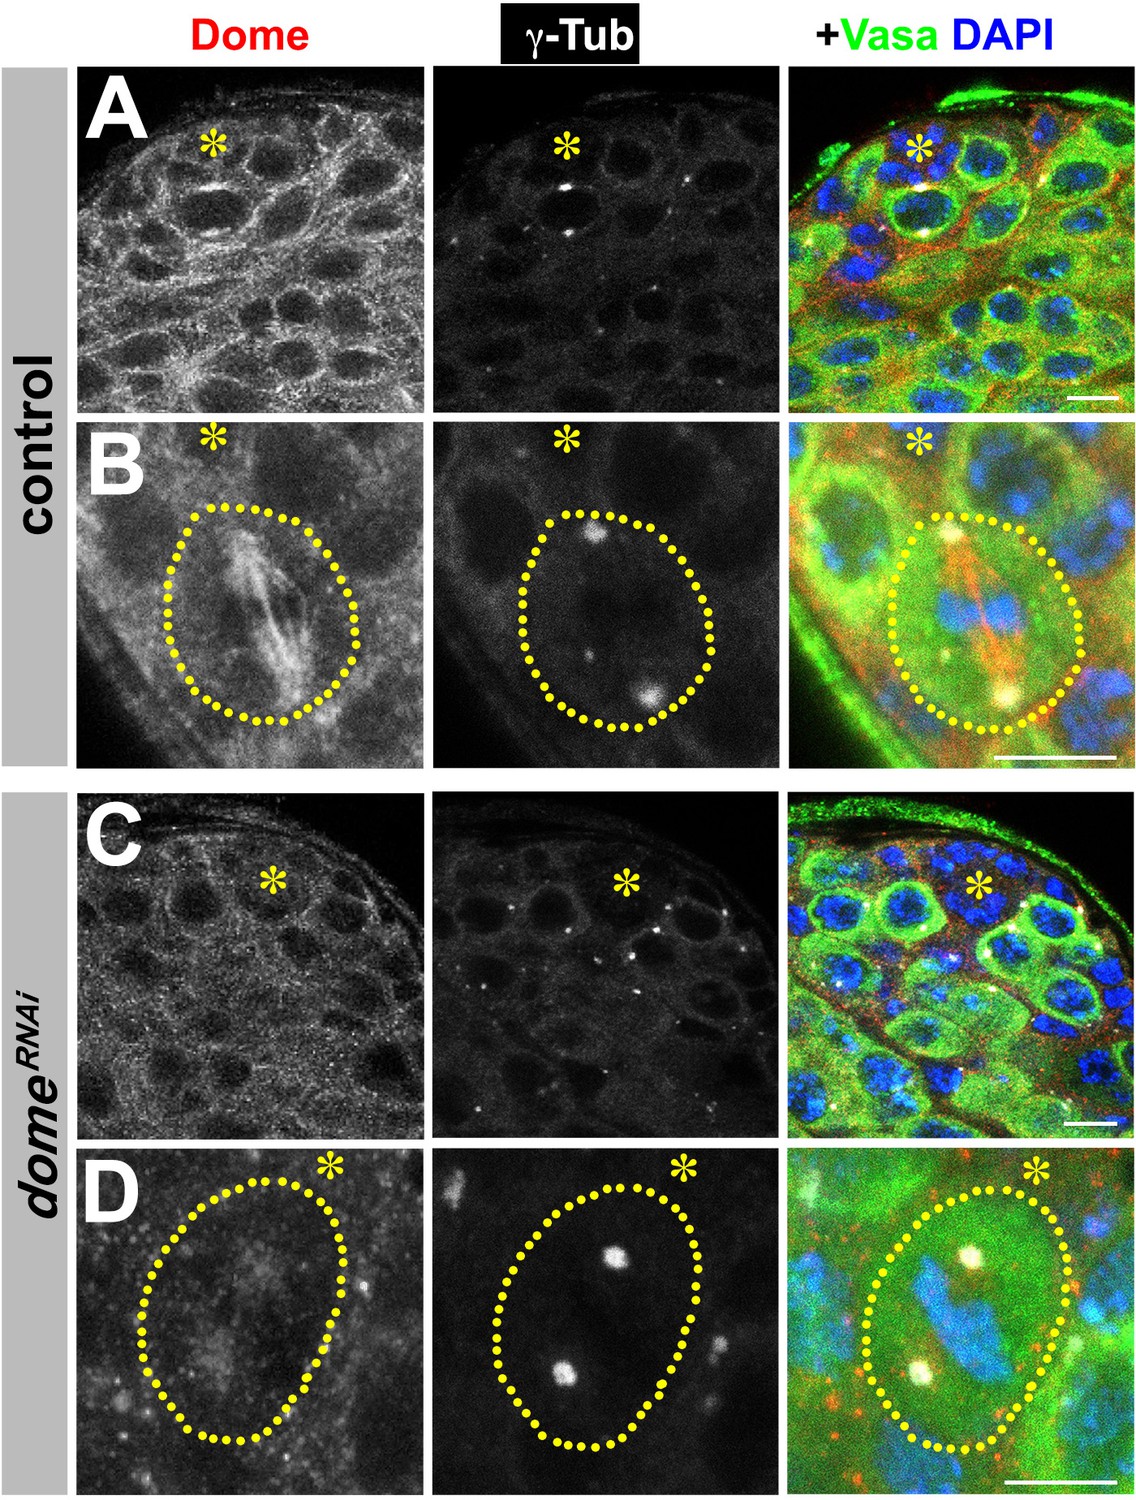
Validation of Dome antibody.
(A–D) Examples of Dome staining in control (A–B) and nos-gal4ΔVP16, gal80ts > UAS-domeRNAi (C–D) testes. Asterisk indicates the hub. Green: Vasa. Red: Dome. White: γ-Tubulin. Blue: DAPI. Bar: 5 μm.
Figure 3—figure supplement 2
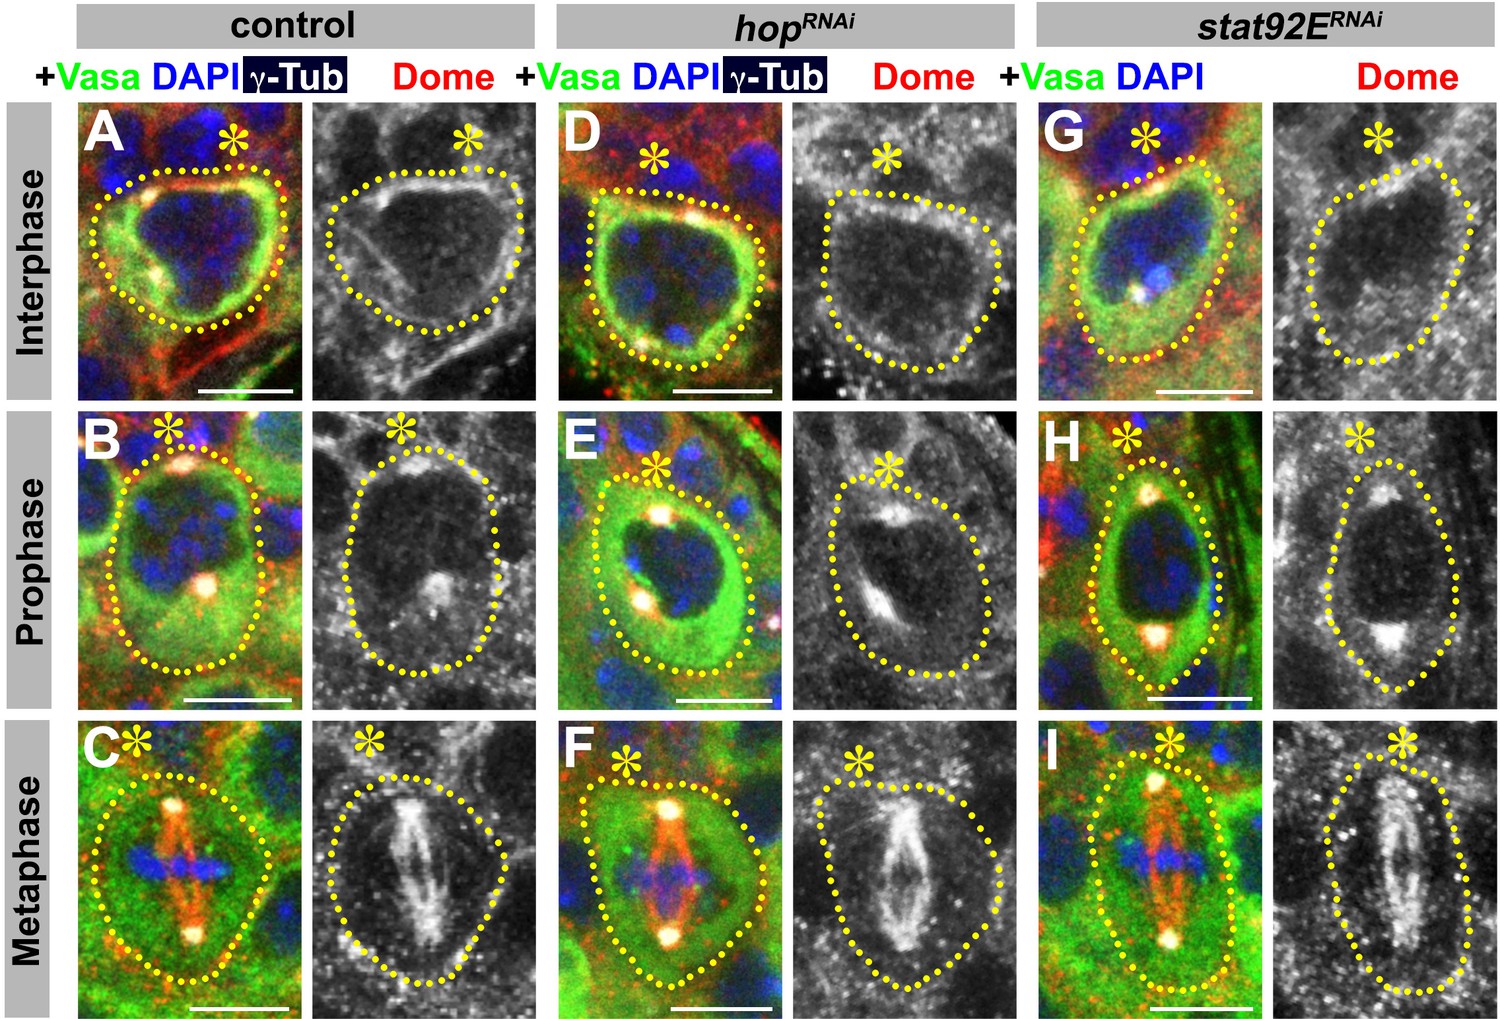
JAK or STAT is not required for correct Dome localization.
(A–C) Examples of Dome staining in control interphase (A), prophase (B) and metaphase (C) GSCs. (D–F) Examples of Dome staining in nos-gal4ΔVP16, gal80ts > UAS-hopRNAi interphase (D), prophase (E) and metaphase (F) GSCs. (G–I) Examples of Dome staining in nos-gal4ΔVP16, gal80ts > UAS-stat92ERNAi interphase (G), prophase (H) and metaphase (I) GSCs. Asterisk indicates the hub. Green: Vasa. Red: Dome. White: γ-Tubulin. Blue: DAPI. Bar: 5 μm.
Figure 4 with 2 supplements
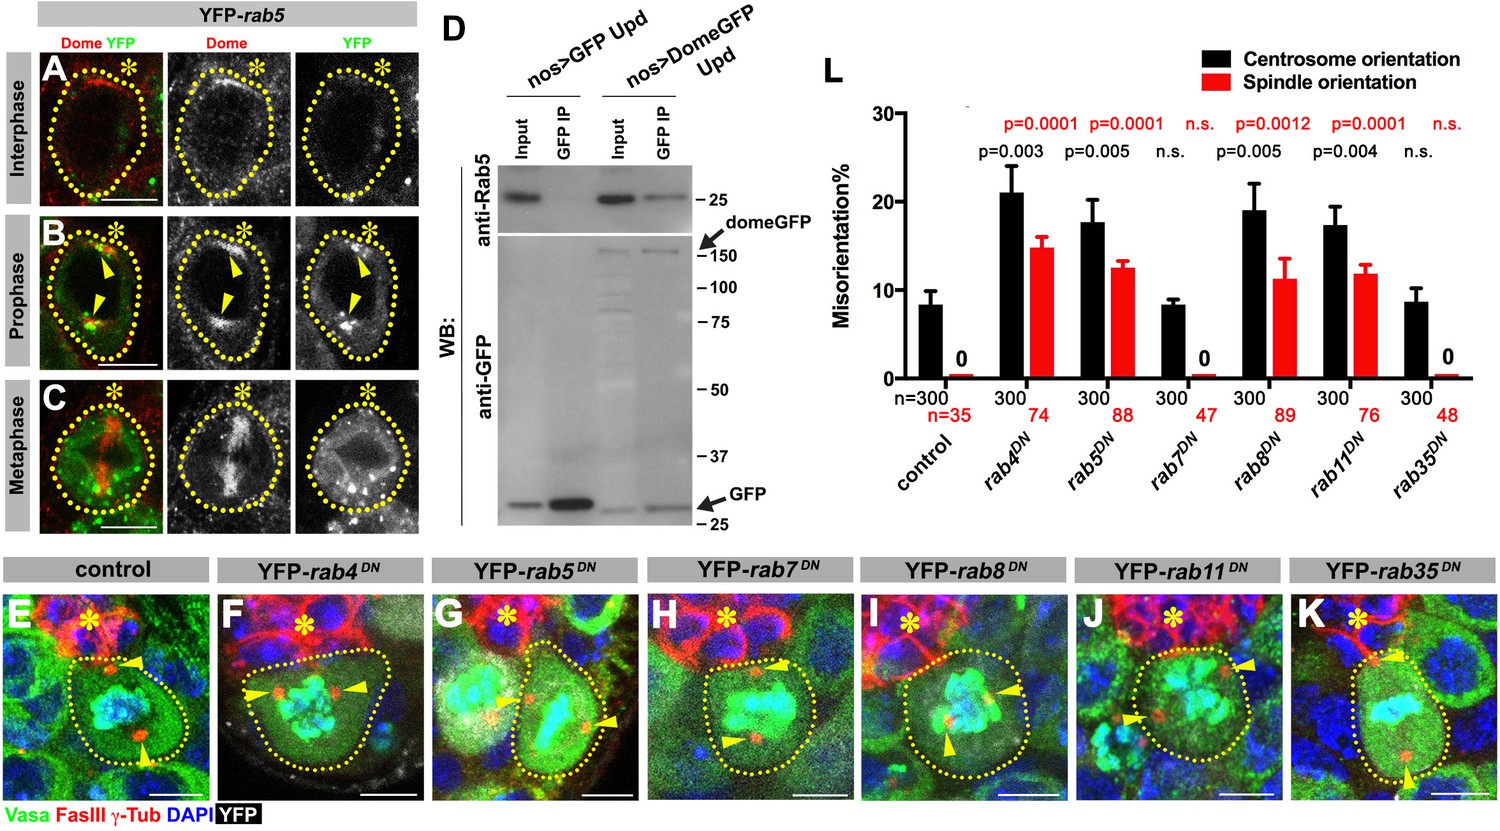
Dome is endocytosed via interactions with early/recycling endosome GTPases.
(A–C) Dome localization in nos-gal4 > UAS-YFP-rab5 GSCs at interphase (A), prophase (B), metaphase (C). Green: YFP. Red: Dome. (D) Co-immunoprecipitation of Dome with Rab5. Dome-GFP was pulled down from GSC extracts using an anti-GFP antibody and blotted using anti-Rab5 and anti-GFP antibodies. (E–K) Examples of spindles in control (E), nos-gal4 > UAS-YFP-rab4DN (F), nos-gal4 > UAS-YFP-rab5DN (G), nos-gal4 > UAS-YFP-rab7DN (H), nos-gal4 > UAS-YFP-rab8DN (I), nos-gal4 > UAS-YFP-rab11DN (J), nos-gal4 > UAS-YFP-rab35DN (K) GSCs (indicated by a white dotted line). Asterisk indicates the hub. Arrowheads indicate spindle poles. Green: Vasa and PH3. Red: Fas III and γ-Tubulin. White: YFP. Blue: DAPI. Bar: 5 µm. (L) Summary of GSC centrosome/spindle misorientation in the indicated genotypes. P value comparing control and the indicated genotype was calculated using two-tailed Student’s t-test. Error bars indicate the standard deviation. N = GSC number scored for centrosome orientation or N = mitotic GSC number scored for spindle orientation.
Figure 4—figure supplement 1
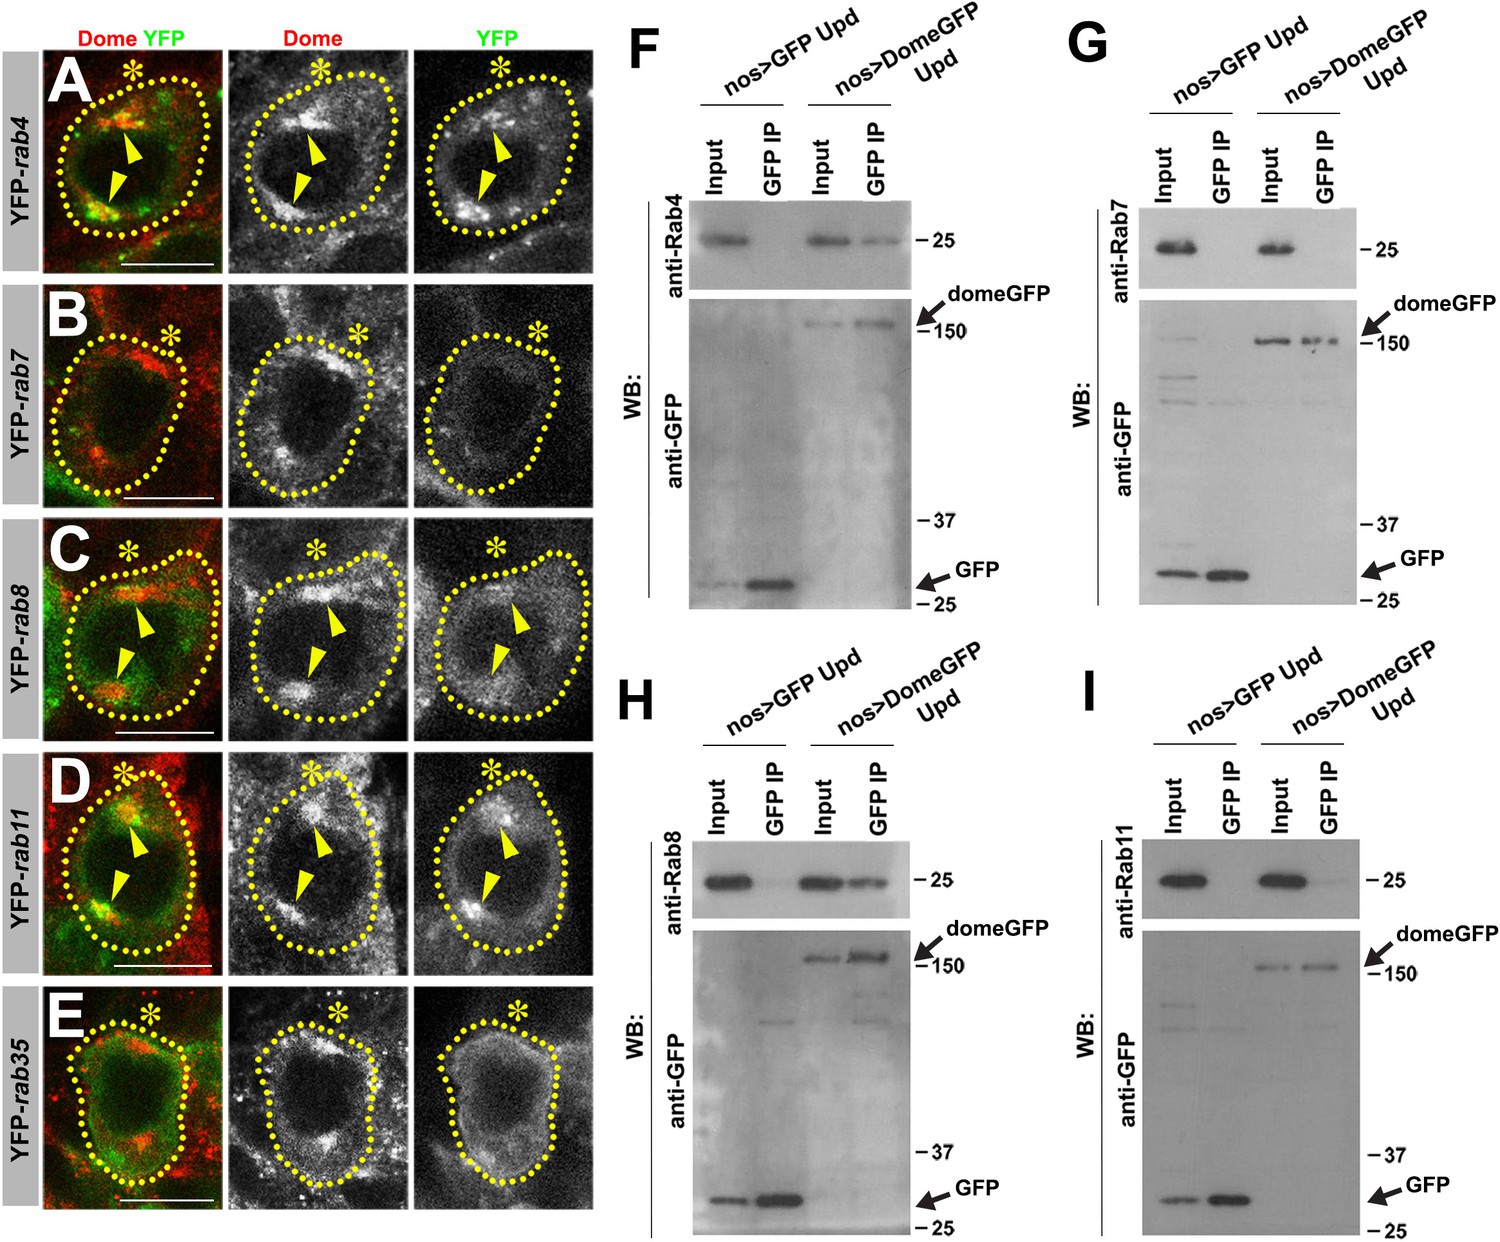
Colocalization/immunoprecipitation of Dome with RabGTPases.
(A–E) Dome localization in prophase of nos-gal4 > UAS-YFP-rab4 (A), nos-gal4 > UAS-YFP-rab7 (B), nos-gal4 > UAS-YFP-rab8 (C), nos-gal4 > UAS-YFP-rab11 (D), nos-gal4 > UAS-YFP-rab35 (E) GSCs. Green: YFP. Red: Dome. (F–I) Co-immunoprecipitations of Dome with Rab4 (F), Rab7 (G), Rab8 (H) and Rab11 (I). Dome-GFP was pulled down from GSC extracts using an anti-GFP antibody and blotted using anti-Rab4, 7, 8 or 11 and anti-GFP.
Figure 4—figure supplement 2

Early endosome GTPases rab4 and rab5 are required for correct Dome localization.
(A–C) Examples of Dome staining in control interphase (A), prophase (B) and metaphase (C) GSCs. Asterisk indicates the hub. Green: Vasa. Red: Dome. (D–F) Examples of Dome staining in nos-gal4 > UAS-YFP-rab4DN interphase (D), prophase (E) and metaphase (F) GSCs. (G–I) Examples of Dome staining in nos-gal4 > UAS-YFP-rab5DN interphase (G), prophase (H) and metaphase (I) GSCs. Asterisk indicates the hub. Green: YFP. Red: Dome. Bar: 5 µm.
Figure 5 with 1 supplement
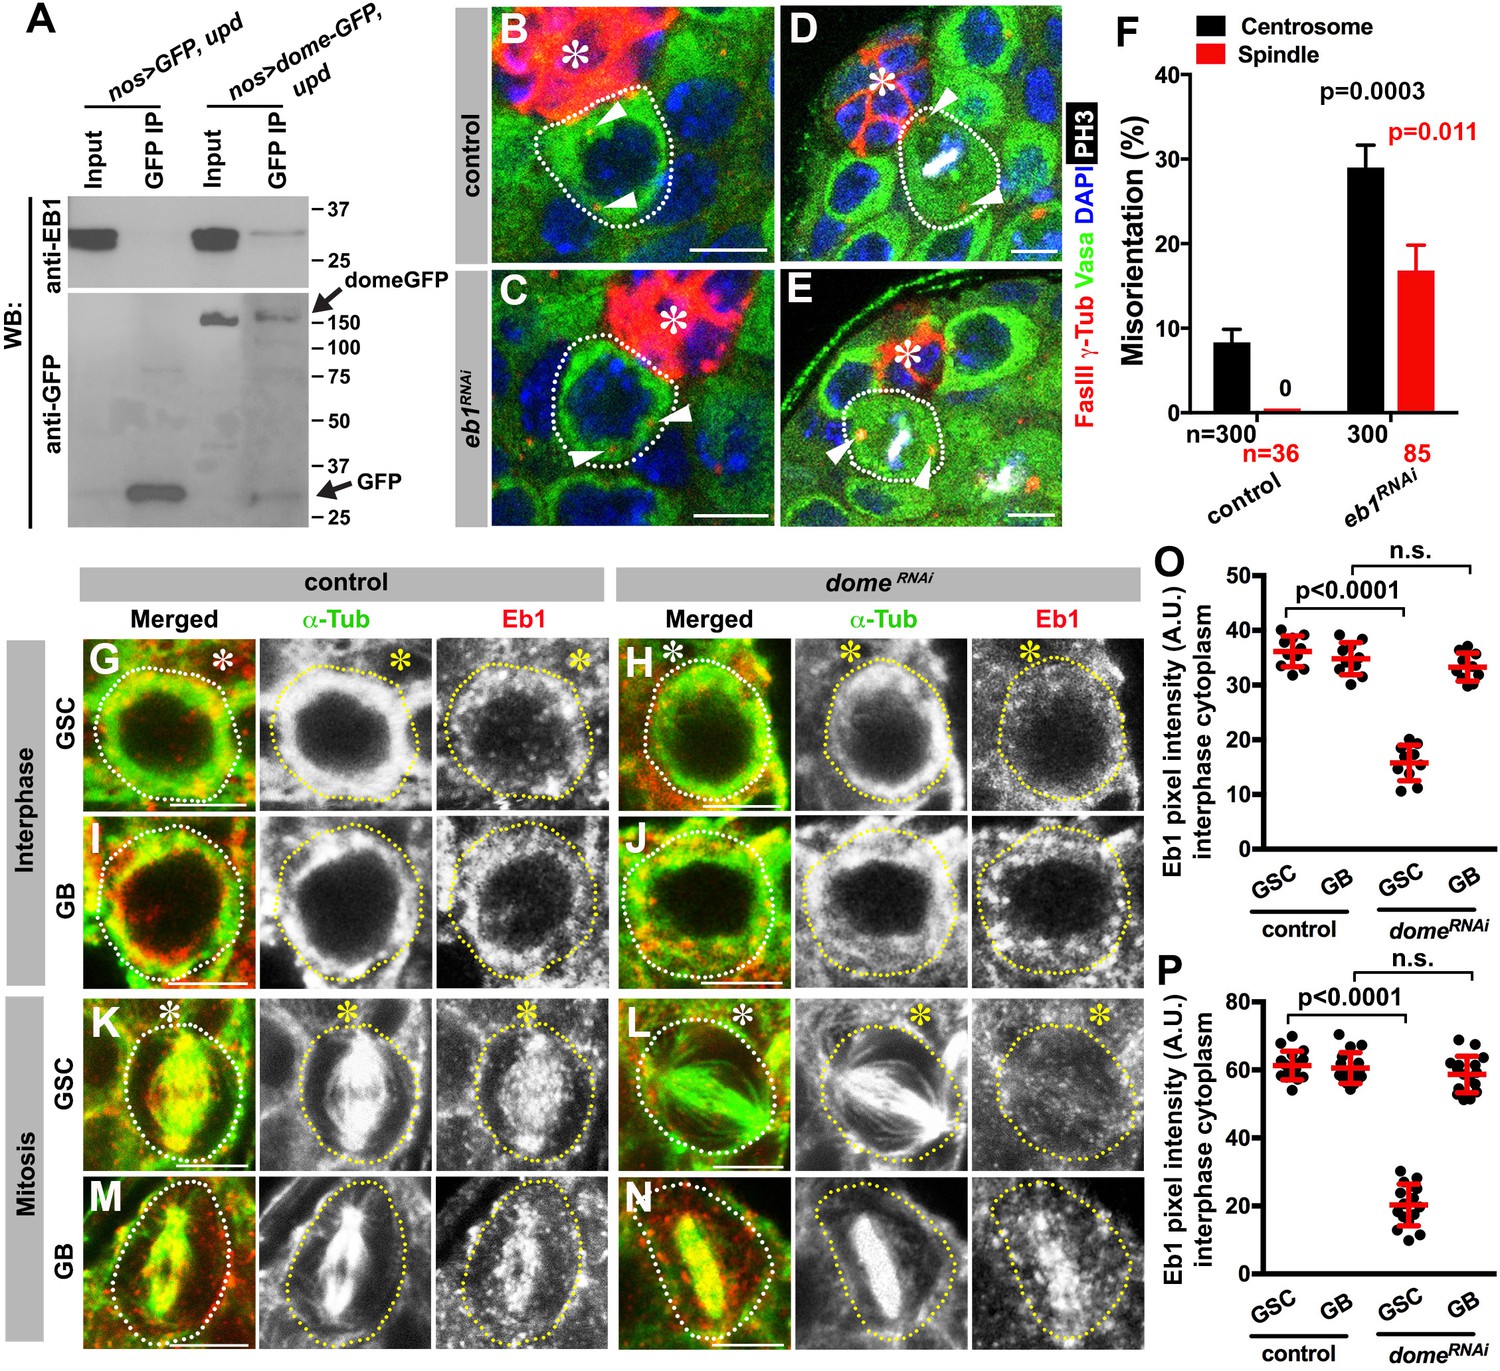
Eb1 binds to Dome and regulates GSC centrosome/spindle orientation.
(A) Co-immunoprecipitation of Dome with Eb1. Dome-GFP was pulled down from GSC extracts using an anti-GFP antibody and blotted using anti-Eb1 and anti-GFP. (B–C) Examples of centrosomes in control (B) and nos-gal4 > UAS-eb1RNAi (C) GSCs (outlined by a dotted line). Asterisk indicates the hub. Arrowheads indicate centrosomes. Green: Vasa. Red: Fas III and γ-Tubulin. Blue: DAPI. Bar: 5 µm. (D–E) Examples of mitotic spindles in control (D) and nos-gal4 > UAS-eb1RNAi (E) GSCs (outlined by a dotted line). Asterisk indicates the hub. Arrowheads indicate spindle poles. Green: Vasa. Red: Fas III and γ-Tubulin. White: PH3. Blue: DAPI. Bar: 5 µm. (F) GSC spindle orientation in the indicated genotypes. P value was calculated using two-tailed Student’s t-test. Error bars indicate the standard deviation. N = mitotic GSCs scored. (G–J) Eb1 localization in interphase control GSC (G), nos-gal4ΔVP16, gal80ts > UAS-domeRNAi (4 d after RNAi induction) GSC (H), control GB (I), and nos-gal4ΔVP16, gal80ts > UAS-domeRNAi (4 d after RNAi induction) GB (J). Asterisk indicates the hub. Green: α-Tubulin. Red: Eb1. Bar: 5 µm. (K–N) Eb1 localization in metaphase control GSC (K), nos-gal4ΔVP16, gal80ts > UAS-domeRNAi (4 d after RNAi induction) GSC (L), control GB (M), and nos-gal4ΔVP16, gal80ts > UAS domeRNAi (4 d after RNAi induction) GB (N). Asterisk indicates the hub. Green: α-Tubulin. Red: Eb1. Bar: 5 µm. (O–P) Pixel intensity analyses of Eb1 at interphase (O) and mitotic (P) GSCs in control and nos-gal4ΔVP16, gal80ts > UAS-domeRNAi (4 d after RNAi induction) testes. P value was calculated using two-tailed Student’s t-test. Error bars indicate the standard deviation.
Figure 5—figure supplement 1
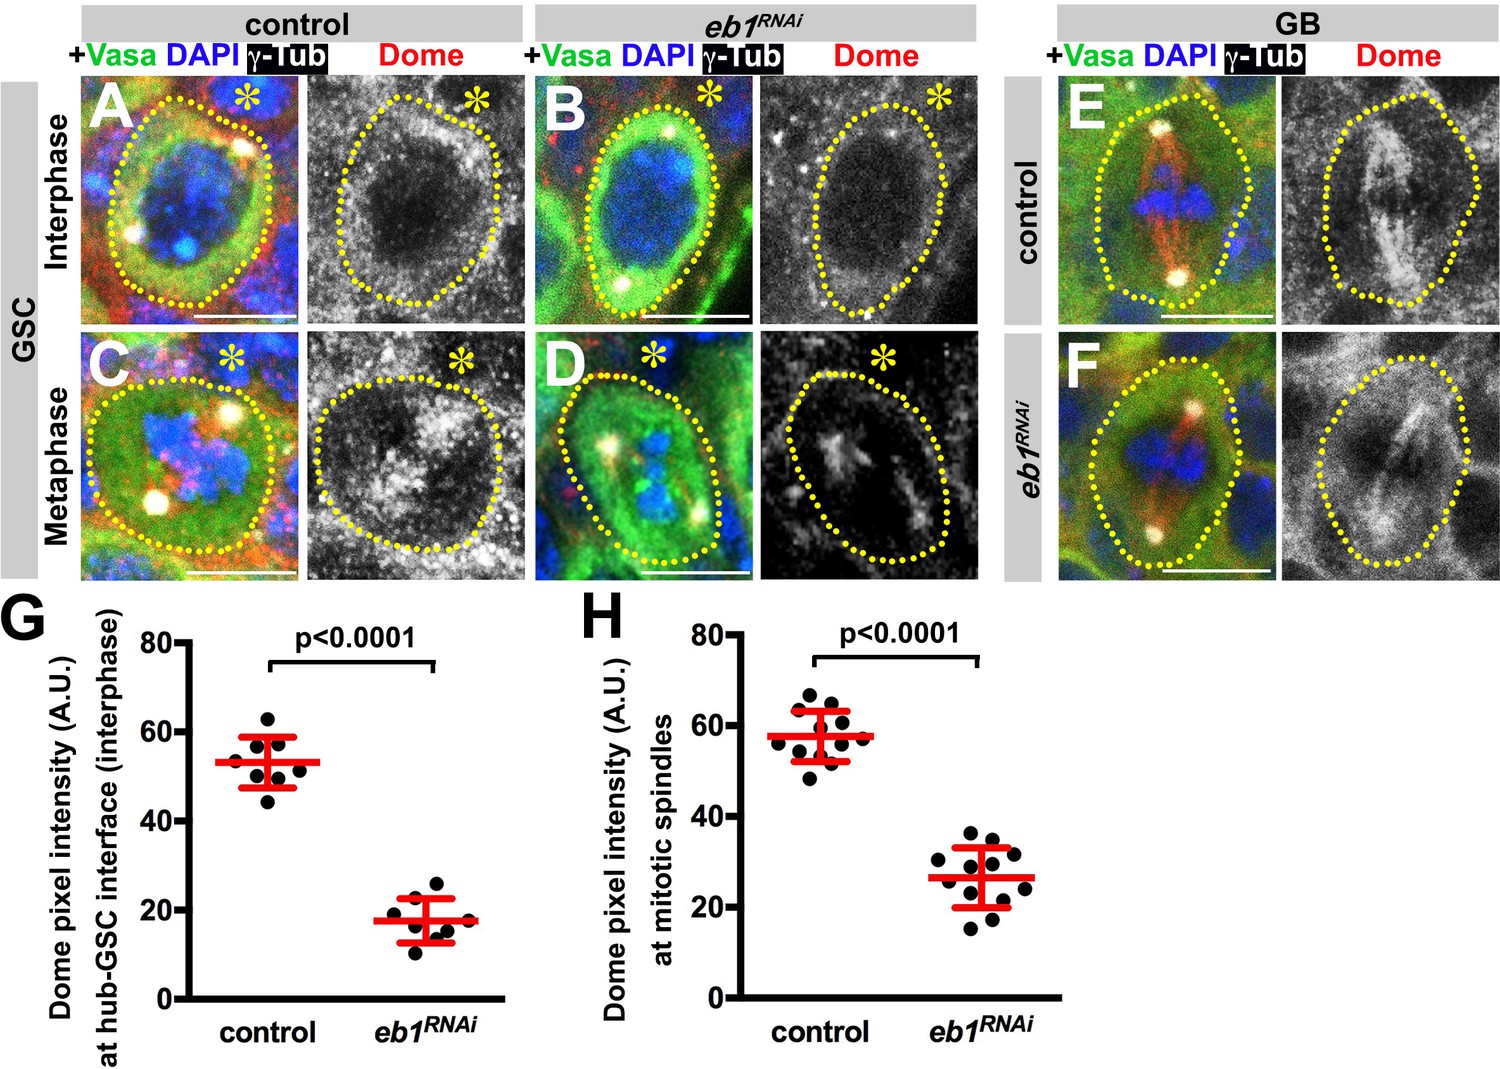
Eb1 is required for Dome localization in GSCs.
(A–D) Dome localization in control interphase (A), control metaphase (B), nos-gal4 > UAS-eb1RNAi interphase (C), and nos-gal4 > UAS-eb1RNAi metaphase (D) GSCs. Asterisk indicates the hub. Green: Vasa. Red: Dome. White: γ-Tubulin. Blue: DAPI. Bar: 5 µm. (E–F) Dome localization in control (E) and nos-gal4 > UAS-eb1RNAi (F) GBs. Green: Vasa. Red: Dome. White: γ-Tubulin. Blue: DAPI. Bar: 5 µm. (G–H) Pixel intensity analyses of Dome in interphase (G) and mitotic (H) GSCs in control and nos-gal4 > UAS-eb1RNAi testes. P value was calculated using two-tailed Student’s t-test. Error bars indicate the standard deviation.
Figure 6 with 3 supplements
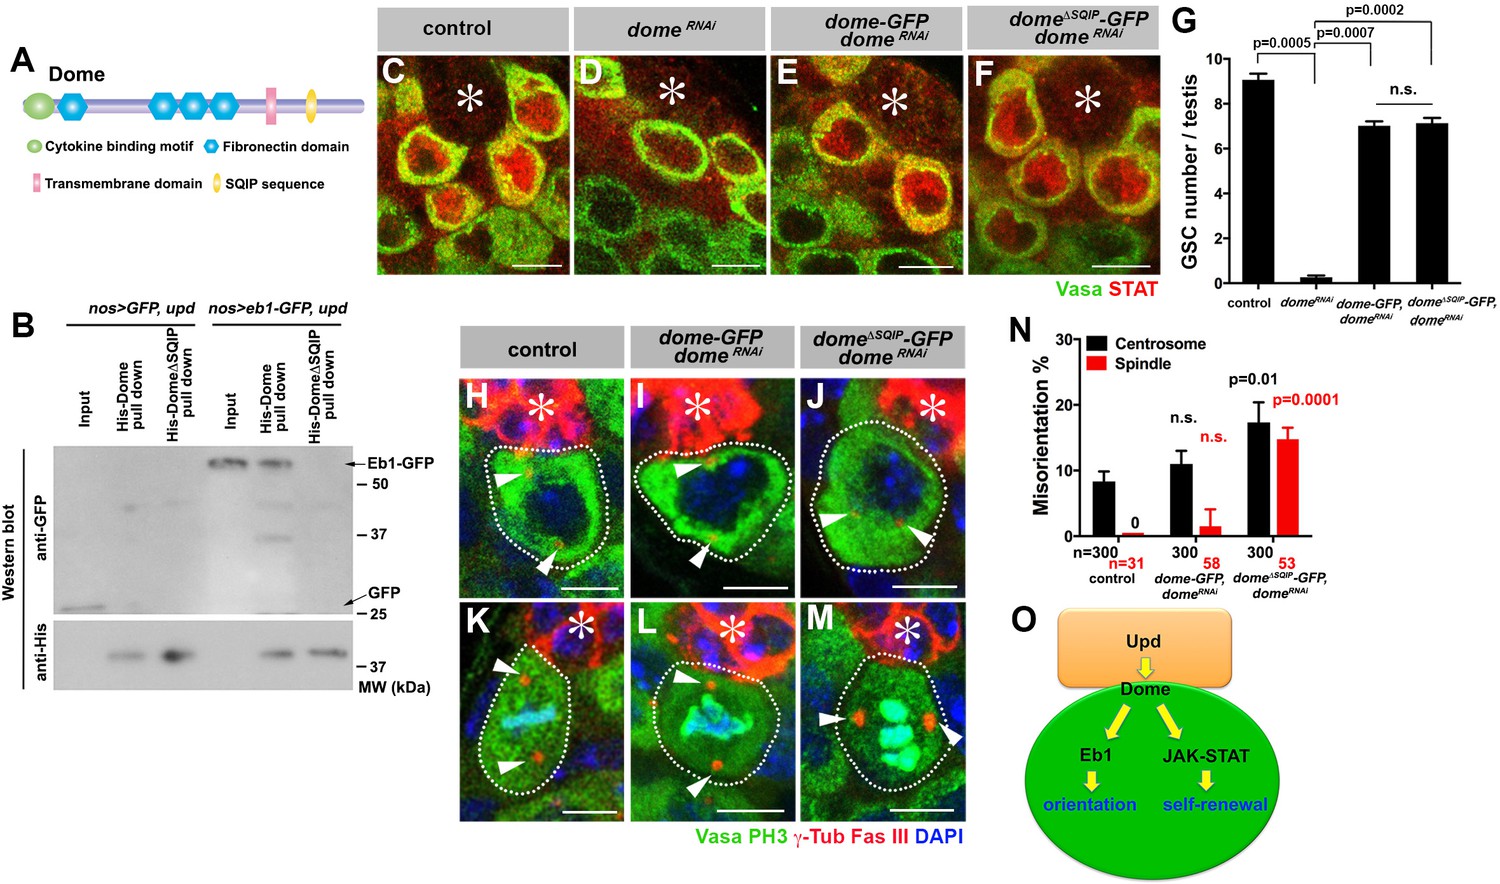
Dome interacts with EB1 via its SxIP motif to regulate spindle orientation independent of GSC self-renewal.
(A) Domain organization of Dome. (B) His-tag pull-down of a 6xHis tagged cytoplasmic (C-terminal) domain of Dome (His-Dome or His-Dome∆SQIP), blotted for anti-GFP and anti-His antibodies. (C–F) Examples of Stat92E staining in control (C), nos-gal4ΔVP16, gal80ts > UAS-domeRNAi (4 d after RNAi induction) (D), nos-gal4 > UAS-dome-GFP, UAS-domeRNAi (E) and nos-gal4 > UAS-dome∆SQIP-GFP, UAS-domeRNAi (F) testes. Asterisk indicates the hub. Green: Vasa. Red: Stat92E. Bar: 5 μm. (G) GSC numbers in control, nos-gal4 > UAS- domeRNAi, nos-gal4 > UAS-dome-GFP, UAS-domeRNAi and nos-gal4 > UAS-dome∆SQIP-GFP, UAS-domeRNAi testes. P value was calculated using two-tailed Student’s t-test. Error bars indicate the standard deviation. (H–J) Examples of centrosmes in control (H), nos-gal4 > UAS-dome-GFP, UAS-domeRNAi (I) and nos-gal4 > UAS-dome∆SQIP-GFP, UAS-domeRNAi (J) GSCs (outlined by a dotted line). Asterisk indicates the hub. Arrowheads indicate centrosomes. Green: Vasa. Red: Fas III and γ-Tubulin. Blue: DAPI. Bar: 5 μm. (K–M) Examples of mitotic spindles in control (K), nos-gal4 > UAS-dome-GFP, UAS-domeRNAi (L) and nos-gal4 > UAS-dome∆SQIP-GFP, UAS-domeRNAi (M) GSCs (outlined by a dotted line). Asterisk indicates the hub. Arrowheads indicate spindle poles. Green: Vasa and PH3. Red: Fas III and γ-Tubulin. Blue: DAPI. Bar: 5 μm. (N) GSC spindle orientation in control, nos-gal4 > UAS-dome-GFP, UAS-domeRNAi and nos-gal4 > UAS-dome∆SQIP-GFP, UAS-domeRNAi testes. P value was calculated using two-tailed Student’s t-test. Error bars indicate the standard deviation. N = total GSC number scored for centrosome orientation or mitotic GSCs number scored for spindle orientation. (O) Model: Eb1-mediated spindle orientation and JAK-STAT-mediated self-renewal are parallel pathways downstream of Upd and Dome.
Figure 6—figure supplement 1
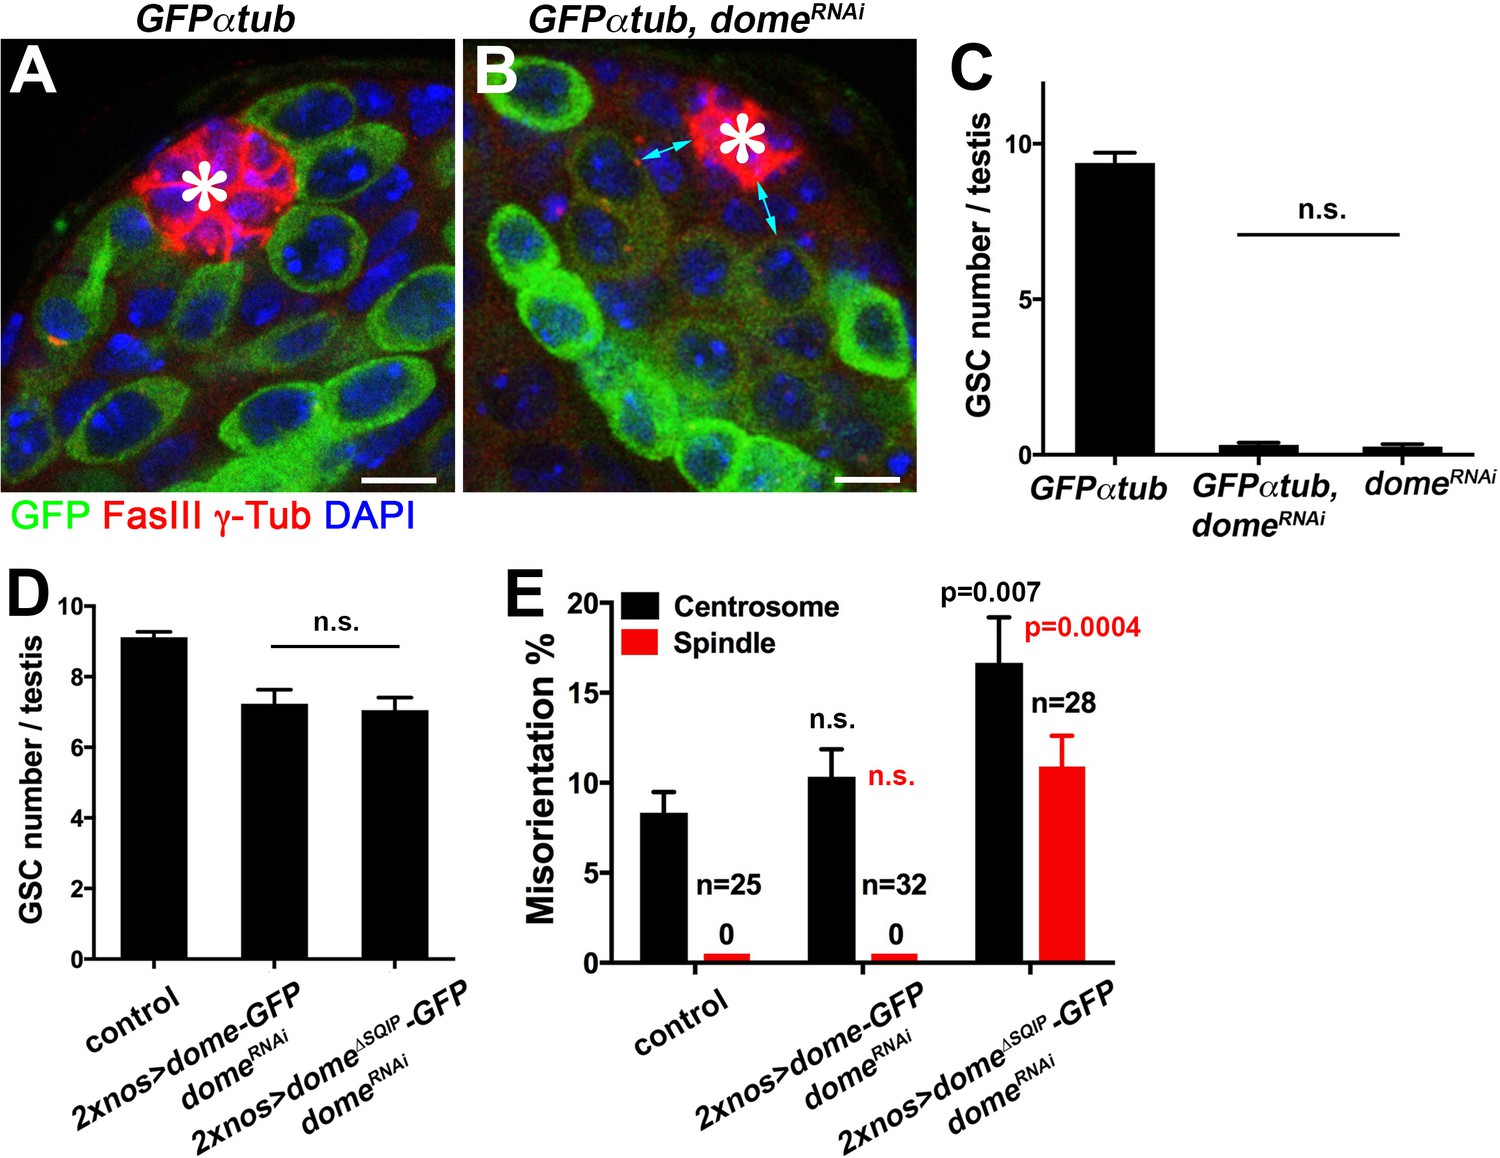
Dome∆SQIP supports GSC self-renewal but fails to orient GSC centrosome/spindle.
(A–B) Examples of testis apical tip in nos-gal4 > UAS-GFP-α-tub (A), and nos-gal4 > UAS-GFP-α-tub, UAS-domeRNAi (B) testes. Asterisk indicates the hub. Green: GFP. Red: FasIII and γ-Tub. Blue: DAPI. Bar: 5 μm. (C) GSC numbers in nos-gal4 > UAS-GFP-α-tub, nos-gal4 > UAS-GFP-α-tub, UAS-domeRNAi and nos-gal4 >UAS-domeRNAi testes. P value was calculated using two-tailed Student’s t-test. Error bars indicate the standard deviation. The results demonstrate that addition of a transgene (UAS-GFP-α-tub) does not reduce the efficiency of RNAi-mediated knockdown of dome. (D) GSC numbers in control, 2xnos-gal4 > UAS- dome-GFP, UAS-domeRNAi and 2xnos-gal4 > UAS-dome∆SQIP-GFP, UAS-domeRNAi testes. P value was calculated using two-tailed Student’s t-test. Error bars indicate the standard deviation. (E) Summary of GSC centrosome/spindle misorientation in control, 2xnos-gal4 > UAS-dome-GFP, UAS-domeRNAi and 2xnos-gal4 > UAS-dome∆SQIP-GFP, UAS-domeRNAi testes. P value comparing control and the indicated genotype was calculated using two-tailed Student’s t-test. Error bars indicate the standard deviation. N = GSC number scored for centrosome orientation or mitotic GSC number scored for spindle orientation. The use of 2xnos-gal4 ensured that RNAi-mediated knockdown of dome was not weakened by addition of UAS-dome-GFP rescue constructs.
Figure 6—figure supplement 2
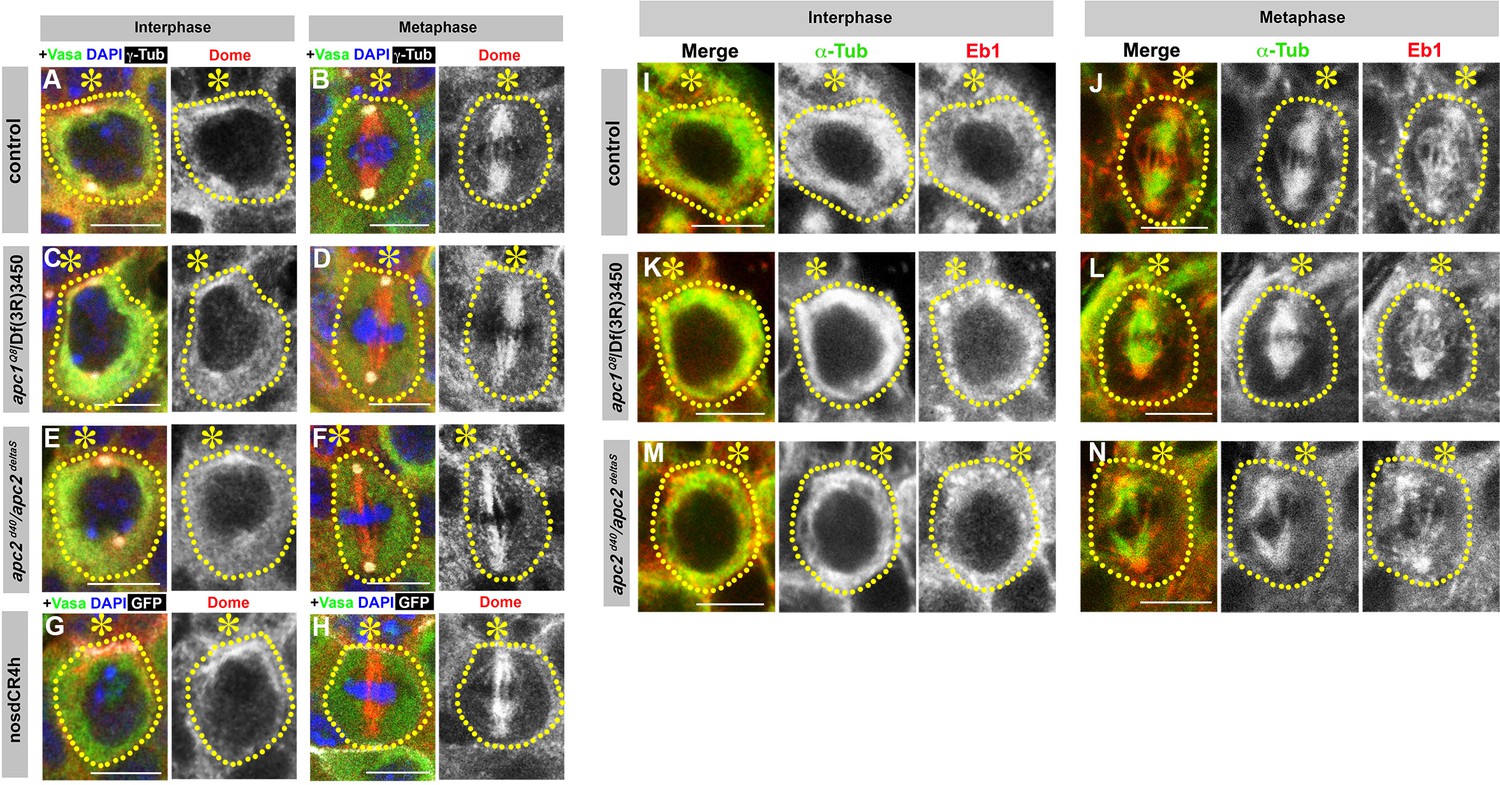
Localization of Dome and Eb1 is independent of E-cad, Apc1 and Apc2.
(A–H) Dome localization in control interphase (A), control metaphase (B), apc1Q8/Df(3R)3450 interphase (C), apc1Q8/Df(3R)3450 metaphase (D), apc2d40/apc2∆S interphase (E), apc2d40/apc2∆S metaphase (F), nos-gal4 > UAS-dCR4h interphase (G), and nos-gal4 > UAS-dCR4h metaphase (H) GSCs. Asterisk indicates the hub. Green: Vasa. Red: Dome. White: γ-Tubulin. Blue: DAPI. Bar: 5 µm. (I–N) Eb1 localization in control interphase (I), metaphase (J), apc1Q8/Df(3R)3450 interphase (K), apc1Q8/Df(3R)3450 metaphase (L), apc2d40/apc2∆S interphase (M), and apc2d40/apc2∆S metaphase (N) GSCs. Green: α-Tubulin. Red: Eb1. Bar: 5 µm.
Figure 6—figure supplement 3
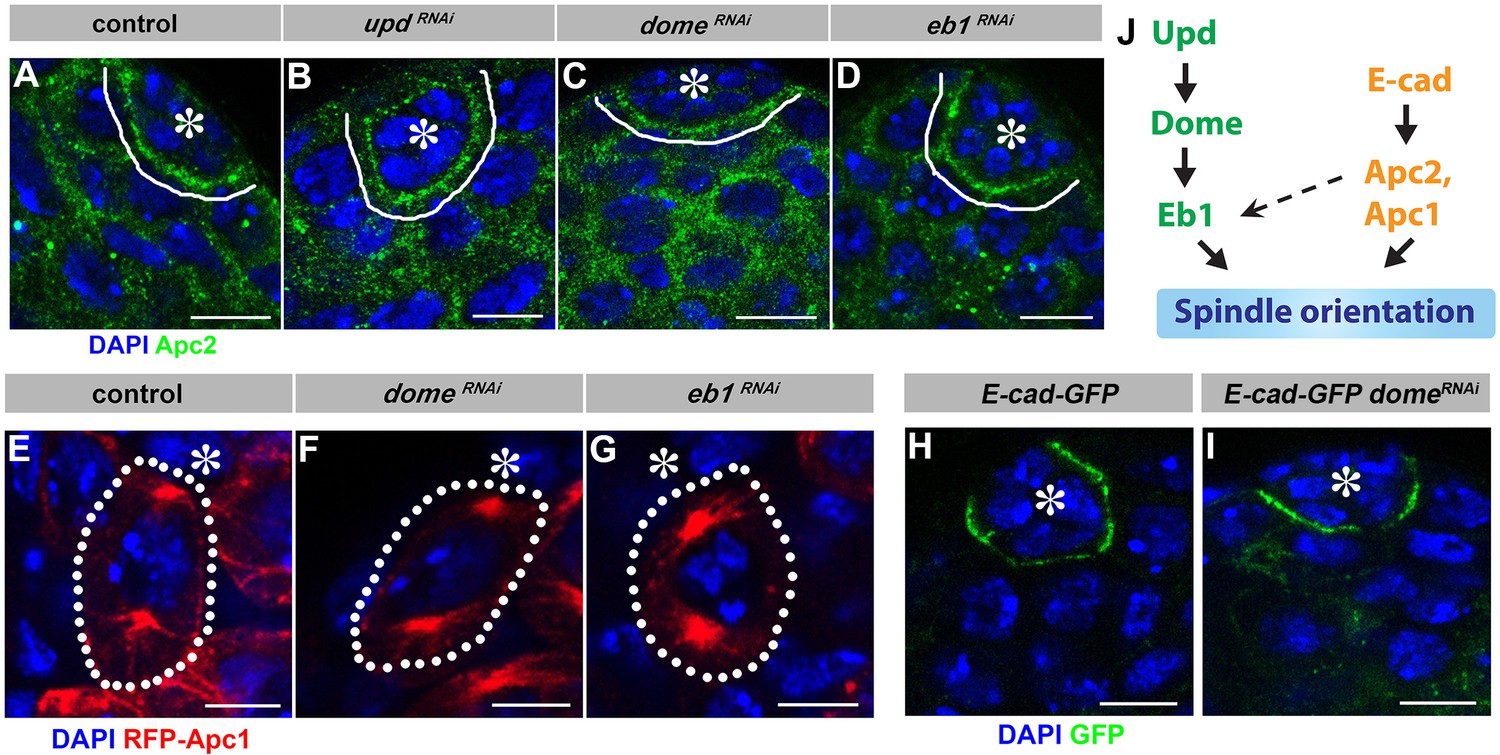
Localization of E-cad, Apc1 and Apc2 is independent of Upd-Dome-Eb1 axis.
(A–D) Apc2 localization in control (A), upd-gal4, gal80ts > UAS updRNAi (B), nos-gal4ΔVP16, gal80ts > UAS-domeRNAi (C), and nos-gal4 > UAS-eb1RNAi (D) testes. Asterisk indicates the hub. Green: Apc2. Blue: DAPI. Bar: 5 µm. (E–G) Apc1 localization in control (E), nos-gal4ΔVP16, gal80ts > UAS-domeRNAi (F), and nos-gal4 > UAS-eb1RNAi (G) testes. Asterisk indicates the hub. Red: RFP-Apc1. Blue: DAPI. Bar: 5 µm. (H–I) E-cad-GFP (DEFL) localization in control (H) and nos-gal4 > UAS-domeRNAi (I) testes. Green: GFP. Blue: DAPI. Bar: 5 µm. (J) Model of spindle orientation by mostly parallel Upd-Dome-Eb1 and E-cad-Apc1-Apc2 pathways.
Figure 7
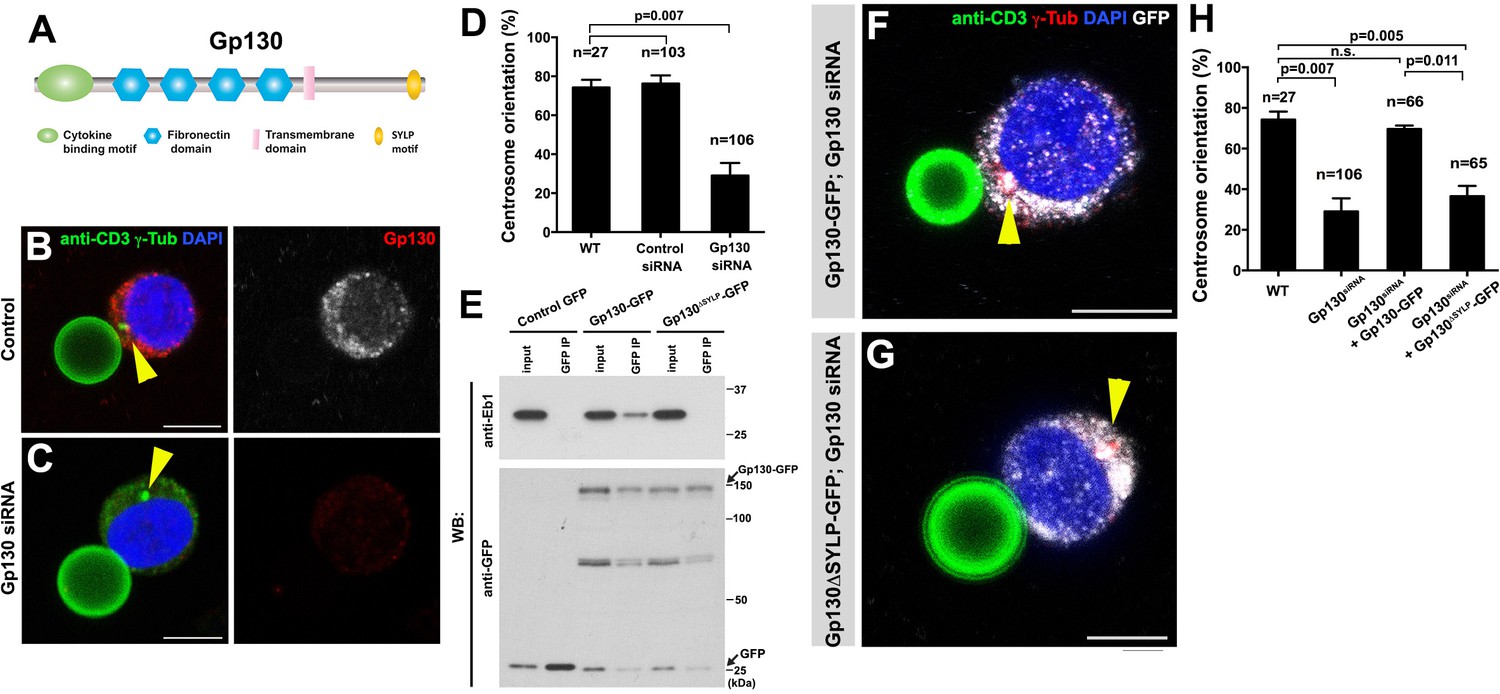
GP130 orients the centrosome at a model immunological synapse.
(A) Domain organization of Gp130. (B–C) Examples of centrosome positioning (arrowheads) in control (B) and Gp130 siRNA (C) Jurkat cells. Red: Gp130. Green: anti-CD3 and γ-Tubulin. Blue: DAPI. Bar: 5 µm. (D) Centrosome orientation toward anti-CD3 beads in the indicated genotypes. P value was calculated using two-tailed Student’s t-test. Error bars indicate the standard deviation. N = Jurkat cells scored. (E) Co-immunoprecipitation of Gp130 with Eb1. Control GFP, Gp130-GFP and Gp130∆SYLP-GFP was pulled down from Jurkat cell lysates using an anti-GFP antibody and blotted with anti-Eb1 and anti-GFP. (F–G) Examples of centrosome positioning (arrowheads) in Jurkat cells expressing Gp130-GFP; Gp130 siRNA (F) and Gp130∆SYLP-GFP; Gp130 siRNA (G). Red: γ-Tubulin. Green: anti-CD3. White, GFP. Blue: DAPI. Bar: 5 µm. (H) Summary of centrosome position relative to anti-CD3 beads in the indicated genotypes. P value was calculated using two-tailed Student’s t-test. Error bars indicate the standard deviation. N = Jurkat cells scored.
Tables
Table 1
The list of (S/T)x(I/L)P-containing cytokine receptors.
All of these motifs are found in the cytoplasmic domain of the receptors. (S/T)x(I/L)P is underlined.
| Gene name | (S/T)x(I/L)P-containing sequence (position) |
|---|---|
| Gp130(IL6RT) | ATDEGMPKSYLPQTVRQGGY (896-915) |
| IL12RB1 | ERTEPLEKTELPEGAPELAL (627-646) |
| IL12RB2 | IAEEKTQLPLDRLL (680-693), PACPWTVLPAGDLP (782-795) |
| IL23R | PSETIPEQTLLPDEFVSCLG (580-599) |
| IL2RG | YSERLCLVSEIPPKGGALGE (325-344) |
| IL11R | SPKPGFLASVIPVDRRPGAP (401-420) |
| IL7R | LLSLGTTNSTLPPPFS LQSG (405-424) |
| IL9R | QEGPGTRLPGNLSS (376-389), GGWHLSALPGNTQS (450-463) |
| IL4R | E PPRSPQSSHLPSSSPEHLG (660-679) |
| IL3RB | GPDTTPAASDLPTEQPPSPQ (559-578) |
| EPOR | PYSNPYENSLIPAAEPLPPS (484-503) |
| GHR | PQGLILNATALPLPDKEFLS (604-623) |
| PRLR | KVNKDGALSLLPKQRENSGK (514-533) |
| TPOR | ILPKSSERTPLPLCSSQAQM (570-589) |
| CNTFR | CSWHLPTPTYIPNTFNVTVL (127-146) |
Additional files
-
Transparent reporting form
- https://doi.org/10.7554/eLife.33685.019
Download links
A two-part list of links to download the article, or parts of the article, in various formats.
Downloads (link to download the article as PDF)
Open citations (links to open the citations from this article in various online reference manager services)
Cite this article (links to download the citations from this article in formats compatible with various reference manager tools)
Cytokine receptor-Eb1 interaction couples cell polarity and fate during asymmetric cell division
eLife 7:e33685.
https://doi.org/10.7554/eLife.33685


