ME31B globally represses maternal mRNAs by two distinct mechanisms during the Drosophila maternal-to-zygotic transition
- The Hospital for Sick Children Research Institute, Canada
- University of Toronto, Canada
- University of Colorado Denver School of Medicine, United States
Figures
Figure 1 with 1 supplement
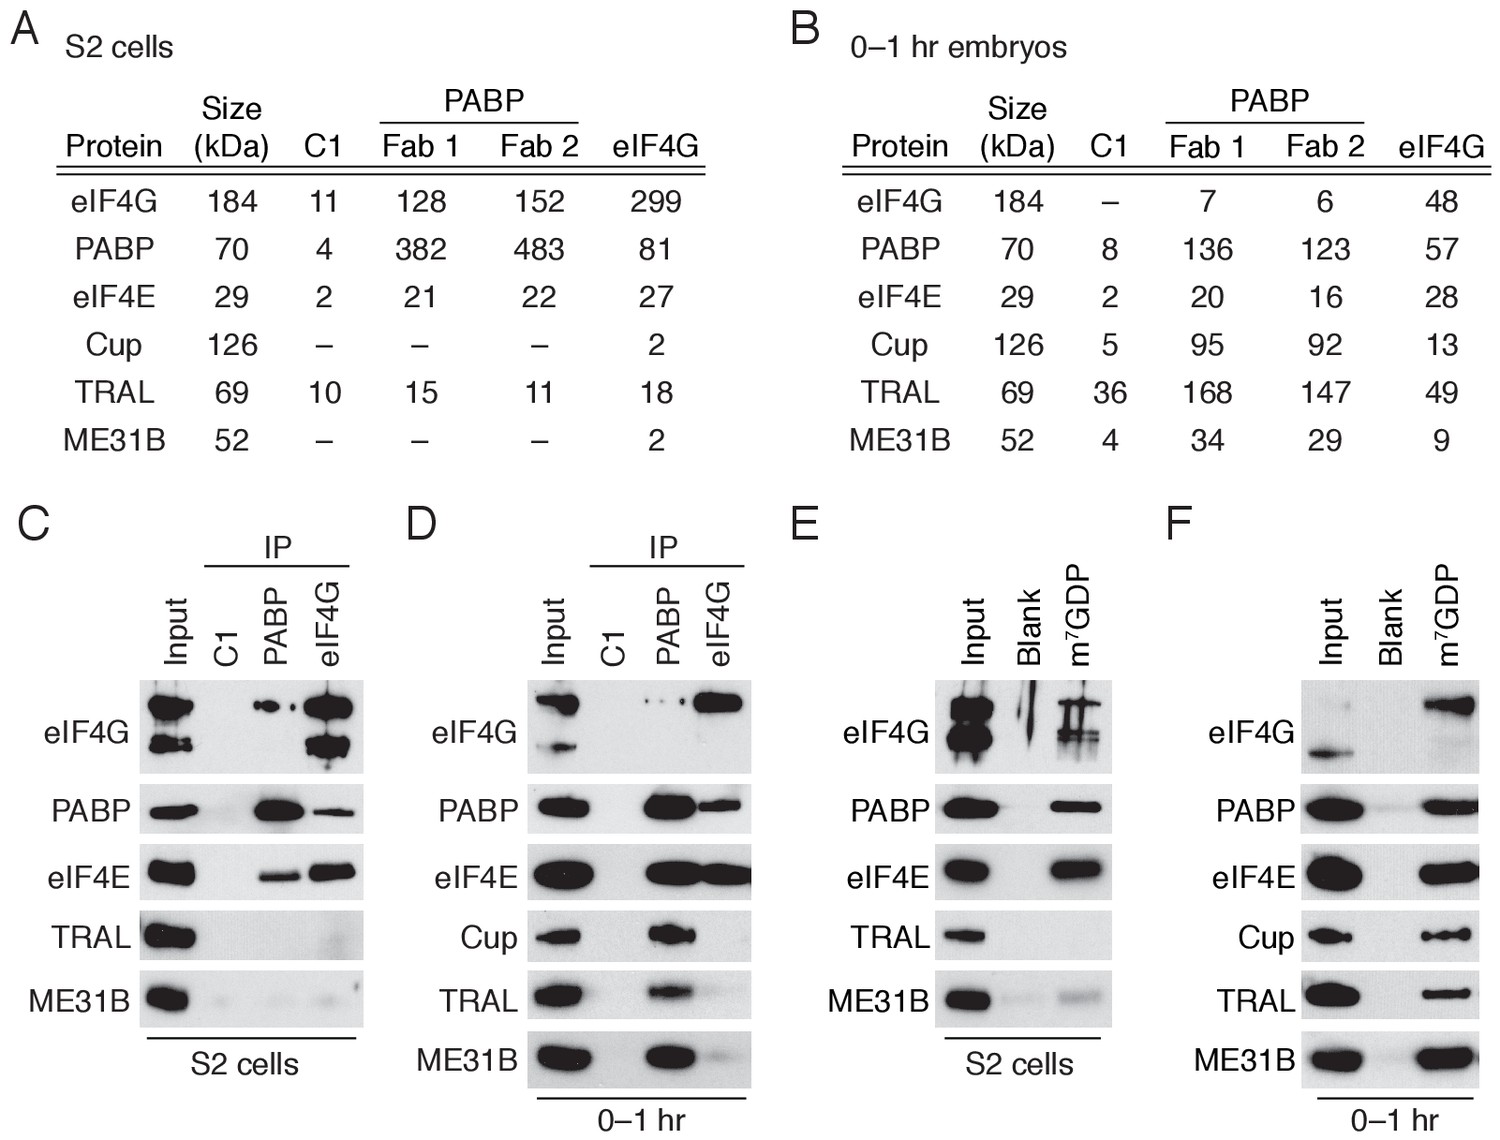
A complex containing eIF4E, Cup, TRAL, ME31B, and PABP is abundant in 0–1 hr embryos.
(A) Selected results from mass spectrometry of PABP and eIF4G co-immunoprecipitations in S2 cells. Extracts from S2 cells were immunoprecipitated with Fab C1 (a negative control), anti-PABP or anti-eIF4G Fabs. Shown are the peptide counts and protein size for proteins of interest. (B) As in (A), but for extracts from 0 to 1 hr embryos. (C) Western blot analysis for proteins co-immunoprecipitated with PABP and eIF4G in S2 cells. Western blots of input and immunoprecipitates were probed for the indicated proteins. (D) As in (C), but for extracts from 0 to 1 hr embryos. (E) Proteins binding m7GDP beads in S2 cell extracts. Lysates were incubated with either blank agarose beads or beads conjugated with m7GDP. Western blots of the input and bound fractions are shown for the indicated proteins. (F) As in (E), except with 0–1 hr embryo extracts.
-
Figure 1—source data 1
Mass spectrometry results for PABP and eIF4G immunoprecipitations in S2 cells.
- https://doi.org/10.7554/eLife.27891.004
-
Figure 1—source data 2
Mass spectrometry results for PABP and eIF4G immunoprecipitations in 0–1 hr embryos.
- https://doi.org/10.7554/eLife.27891.005
Figure 1—figure supplement 1

ME31B interacts with PABP and eIF4E in the early embryo.
(A) RNA-dependence for the interactions between PABP and ME31B, Cup, and TRAL. 0–1 hr embryo extracts were co-immunoprecipitated with either the control or anti-PABP Fabs in the presence or absence of RNase A. Western blots of inputs and immunoprecipitates are shown for the indicated proteins. (B) As in (A), except for ME31B immunoprecipitation. 0–1 hr eGFP-ME31B embryo extracts were co-immunoprecipitated with either rabbit IgG or anti-GFP antibodies in the presence or absence of RNase A. (C) Western blot analysis for proteins interacting with ME31B in S2 cells. Cells were transfected with either FLAG-eGFP or eGFP-ME31B, and then co-immunoprecipitation was performed with anti-GFP antibodies. Western blots of input and immunoprecipitates are shown for the indicated proteins; in the lower panel, proteins were probed with anti-GFP. The arrowhead indicates a nonspecific band. (D) Western blot analysis for proteins interacting with ME31B in 0–1 hr embryos. Extracts from 0 to 1 hr eGFP-ME31B embryos were co-immunoprecipitated with anti-GFP or rabbit IgG. Western blots of input and immunoprecipitates are shown for the indicated proteins.
Figure 2 with 2 supplements

ME31B and PABP bind similar mRNAs in 0–1 hr embryos.
(A) Enrichment of Act5C transcripts in PABP and ME31B immunoprecipitations. Extracts from 0 to 1 hr embryos were immunoprecipitated with the indicated antibodies (control pull-downs, black; PABP or ME31B pull-downs, red). In the case of PABP, complexes were immunoprecipitated with Fab1; ME31B was precipitated from eGFP-ME31B embryos with anti-GFP antibodies. The percent of Act5C mRNA pulled down was quantified by RT-qPCR, primed by oligo(dT) (in the case of PABP) or random-hexamers (in the case of ME31B). Numbers reflect the fold enrichment of Act5C in PABP or ME31B immunoprecipitations relative to the control immunoprecipitations. (B) Distribution of PABP enrichment values transcriptome-wide, as determined by RIP-seq. For mRNAs of each gene that satisfied the expression cut-offs, PABP binding was calculated. Highlighted is the binding for Act5C. (C) As in (B), except for ME31B binding values. (D) Comparison of PABP and ME31B binding in 0–1 hr embryos. (E) Comparison of PABP and ME31B binding in S2 cells.
Figure 2—figure supplement 1
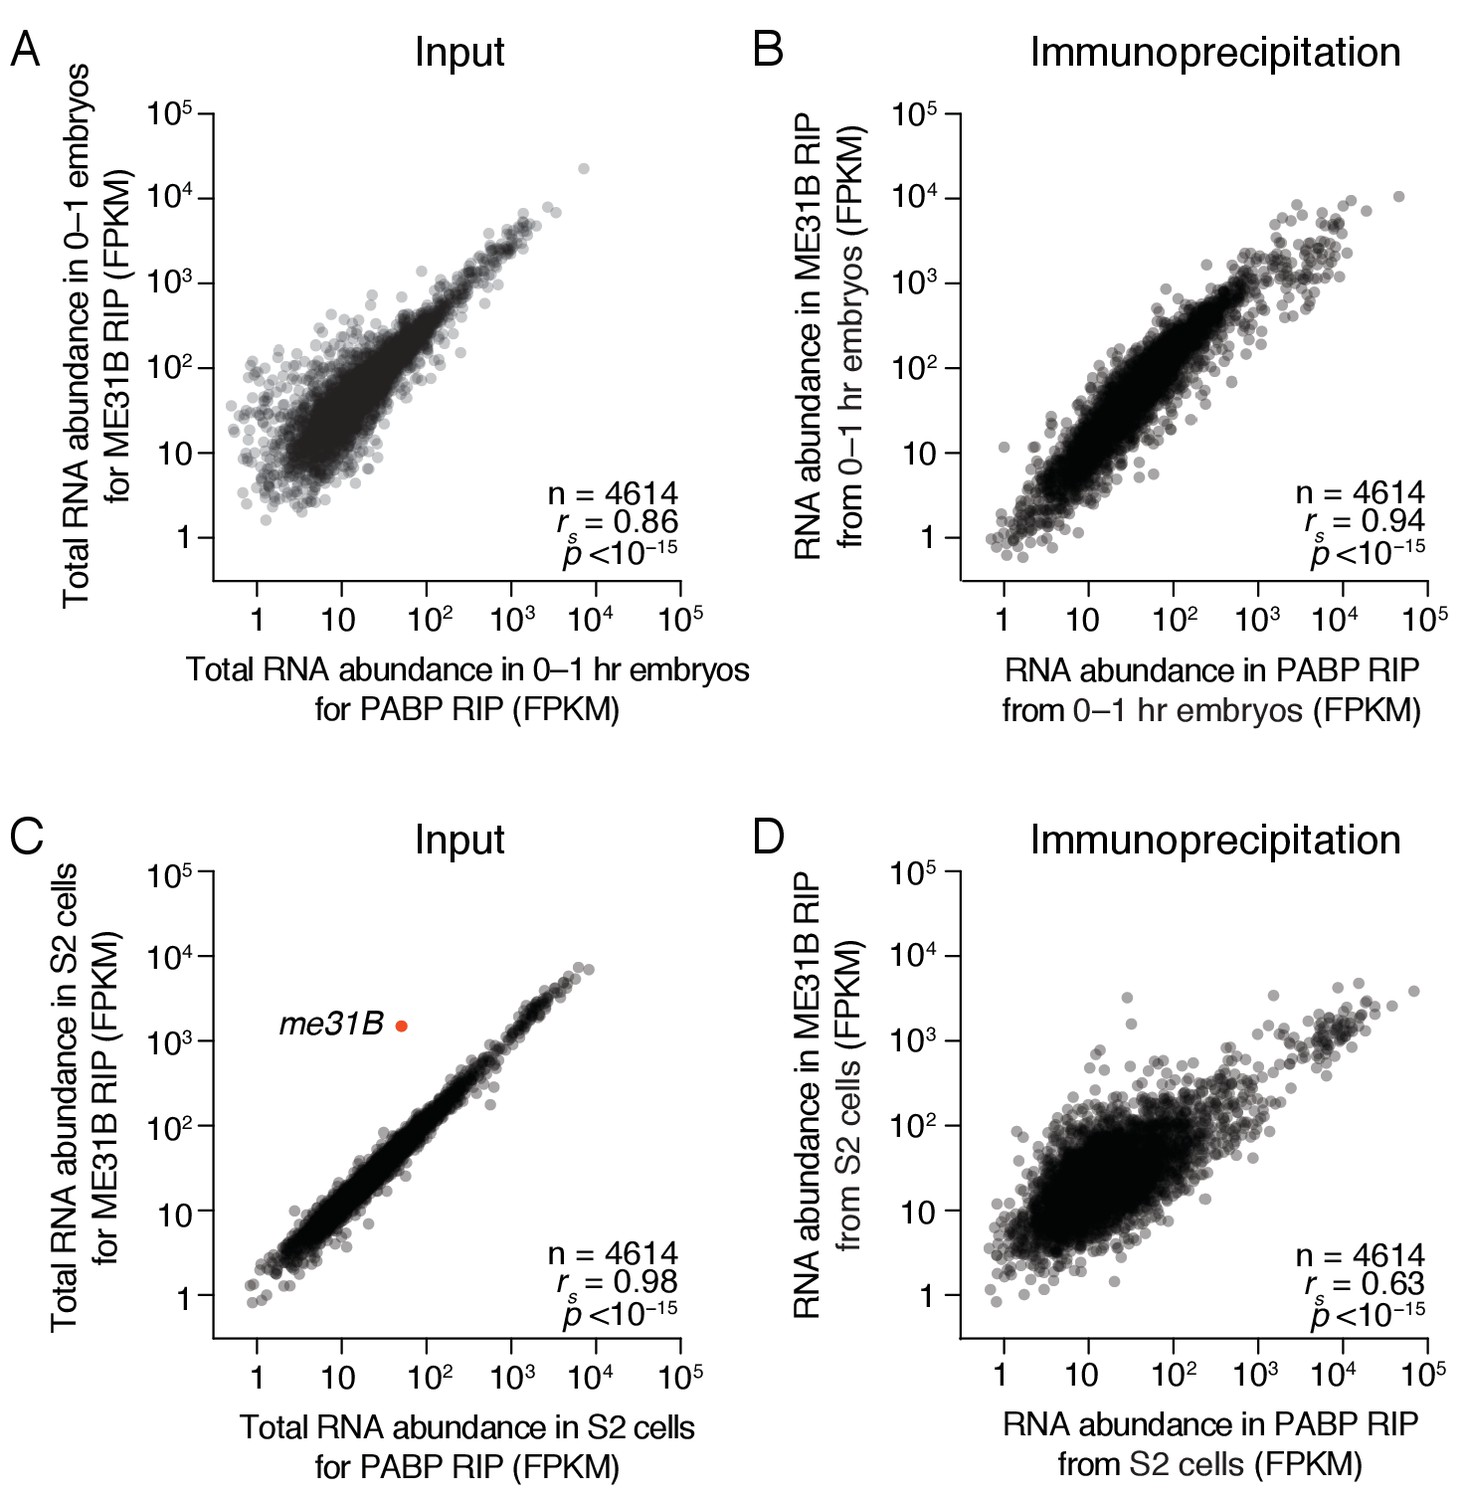
ME31B and PABP bind similar transcripts in the early embryo.
(A) Comparison of total RNA abundance in 0–1 hr embryos. Shown is a scatter plot comparing the FPKM abundance for each gene expressed above cut-off in 0–1 hr wild-type and eGFP-ME31B embryos. (B) As in (A), except for ME31B and PABP immunoprecipitations. Shown is a scatter plot comparing the FPKM abundance for each gene expressed above cut-off in PABP and ME31B immunoprecipitations from 0 to 1 hr wild-type and eGFP-ME31B embryos, respectively. (C) As in (A), except for S2 cells transfected with eGFP-ME31B. The red dot highlights me31B. (D) As in (B), except for S2 transfected with eGFP-ME31B.
Figure 2—figure supplement 2
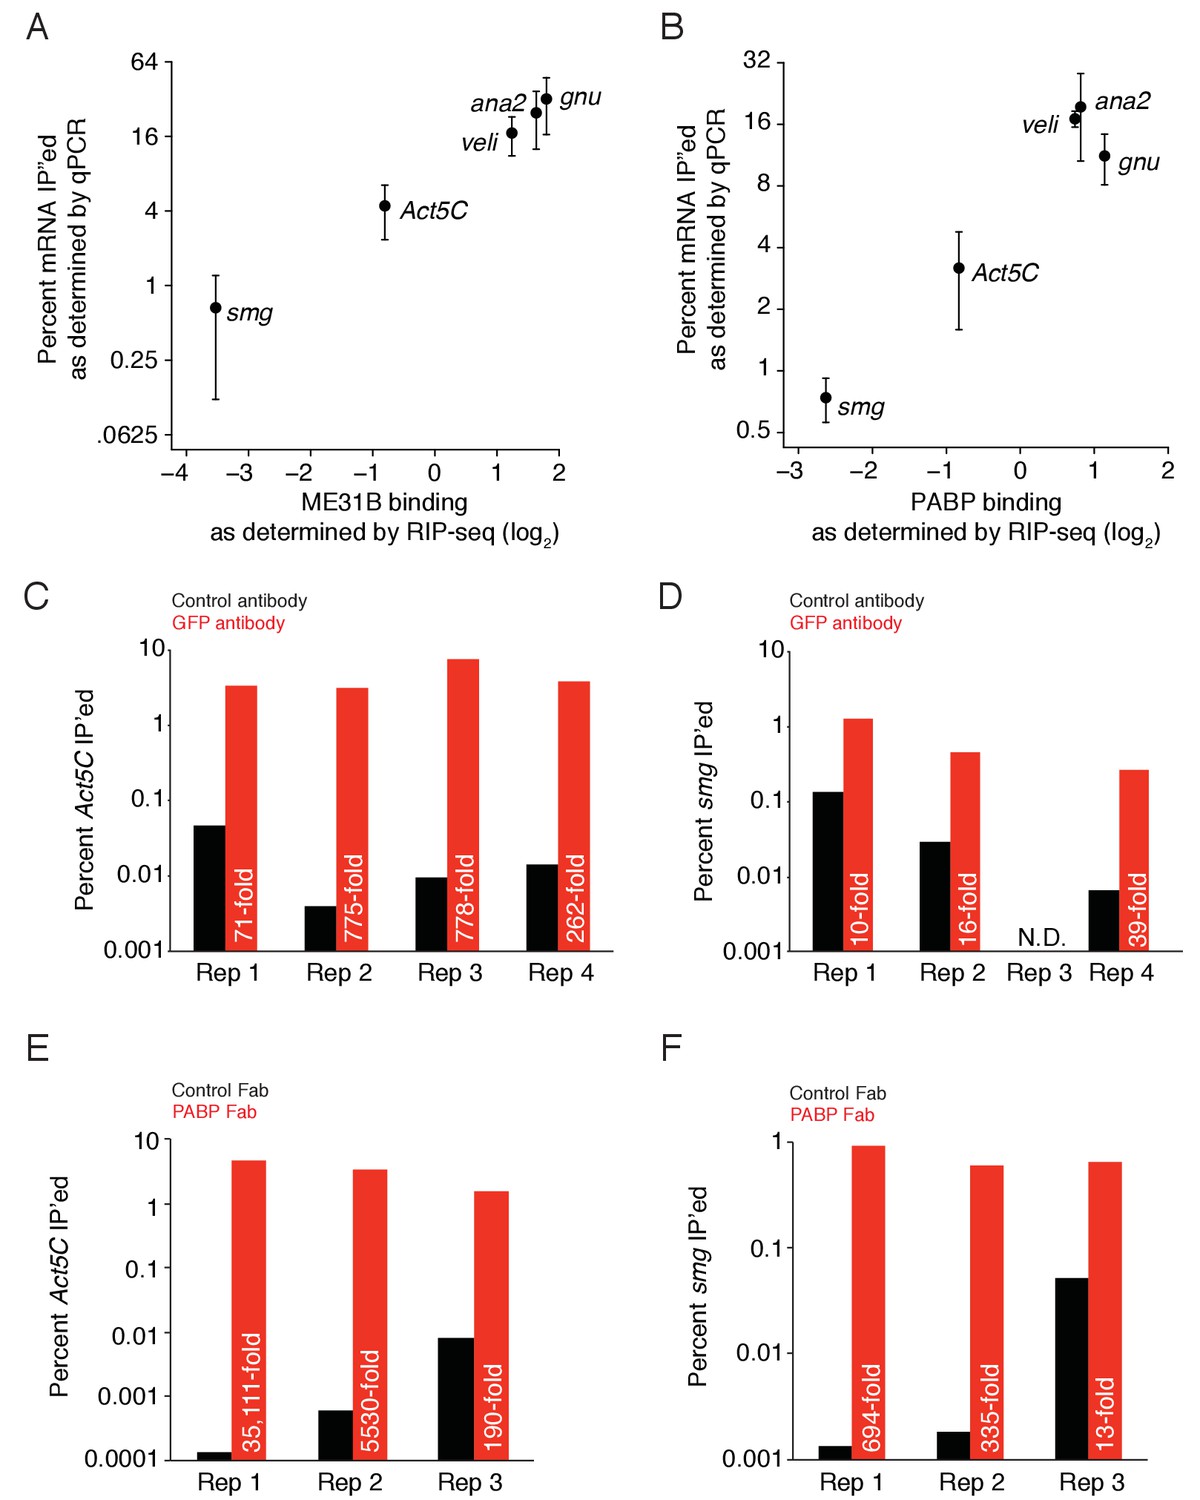
ME31B and PABP binding as measured by RT-qPCR and RNA-sequencing.
(A) A comparison of ME31B binding as determined by RT-qPCR and RNA-sequencing in 0–1 hr embryos. Plotted is the ME31B binding for the five indicated genes, as measured by RIP-seq, and the percent of total RNA immunoprecipitated, as measured by RT-qPCR. RT-qPCR measurements were an average of 3–4 independent, biological replicates with the error bars denoting standard deviation. (B) As in (A), except for PABP binding. (C) Enrichment of Act5C transcripts in ME31B immunoprecipitations in different biological replicates, summarized in (A). Extracts from 0–1 hr eGFP-ME31B embryos were immunoprecipitated with IgG or anti-GFP antibodies. The percent of Act5C mRNA pulled down was quantified by random-hexamer-primed RT-qPCR. Numbers reflect the fold enrichment of Act5C in ME31B immunoprecipitations relative to the control immunoprecipitations. (D) As in (C), except for smg. (E) As in (C), except for PABP immunoprecipitation of Act5C. (F) As in (C), except for PABP immunoprecipitation of smg.
Figure 3 with 1 supplement

ME31B binding is associated with repressed translation in 0–1 hr embryos.
(A) The relationship of poly(A)-tail length and translational efficiency (TE) in 0–1 hr embryos. Plotted are the mean poly(A)-tail lengths and TE values for each gene expressed above cut-off values in 0–1 hr embryos. Select genes concordantly regulated by poly(A)-tail length and ME31B are shown in teal; nos, in pink; Rrp45, in blue. (B) The relationship of poly(A)-tail length and ME31B binding, otherwise as in (A). (C) The relationship of ME31B binding and translational efficiency (TE), otherwise as in (A). (D) The effects of ME31B and poly(A)-tail length on translation. Transcripts were binned into quintiles by their ME31B binding and then into thirds by their mean poly(A)-tail length. Box and whisker plots of translational efficiencies are plotted (line, median; box, quartiles; whiskers, range, excluding outliers). Significance was calculated by the two-tailed Kolmogorov-Smirnov test. **p<0.01; ***p<0.001; ns, not significant. (E) The effects of ME31B and poly(A)-tail length on translation. Transcripts were binned into quintiles by their mean poly(A)-tail length and then into thirds by their ME31B binding, otherwise as in E.
Figure 3—figure supplement 1

Relationship of PABP binding and poly(A) tail length.
(A) Comparison of PABP occupancies and poly(A) tail length. Genes were binned into quintiles according to their PABP occupancies. Shown are box-and-whisker plots for the median poly(A) tail lengths for each quintile (line, median; box, quartiles; whisker, interquartile range). Significance was determined using the two-tailed Kolmogorov-Smirnov test. (B) As in (A), except for PABP enrichment over ME31B. PABP enrichment was calculated by normalizing, for each gene, its PABP occupancy by its ME31B occupancy.
Figure 4 with 1 supplement
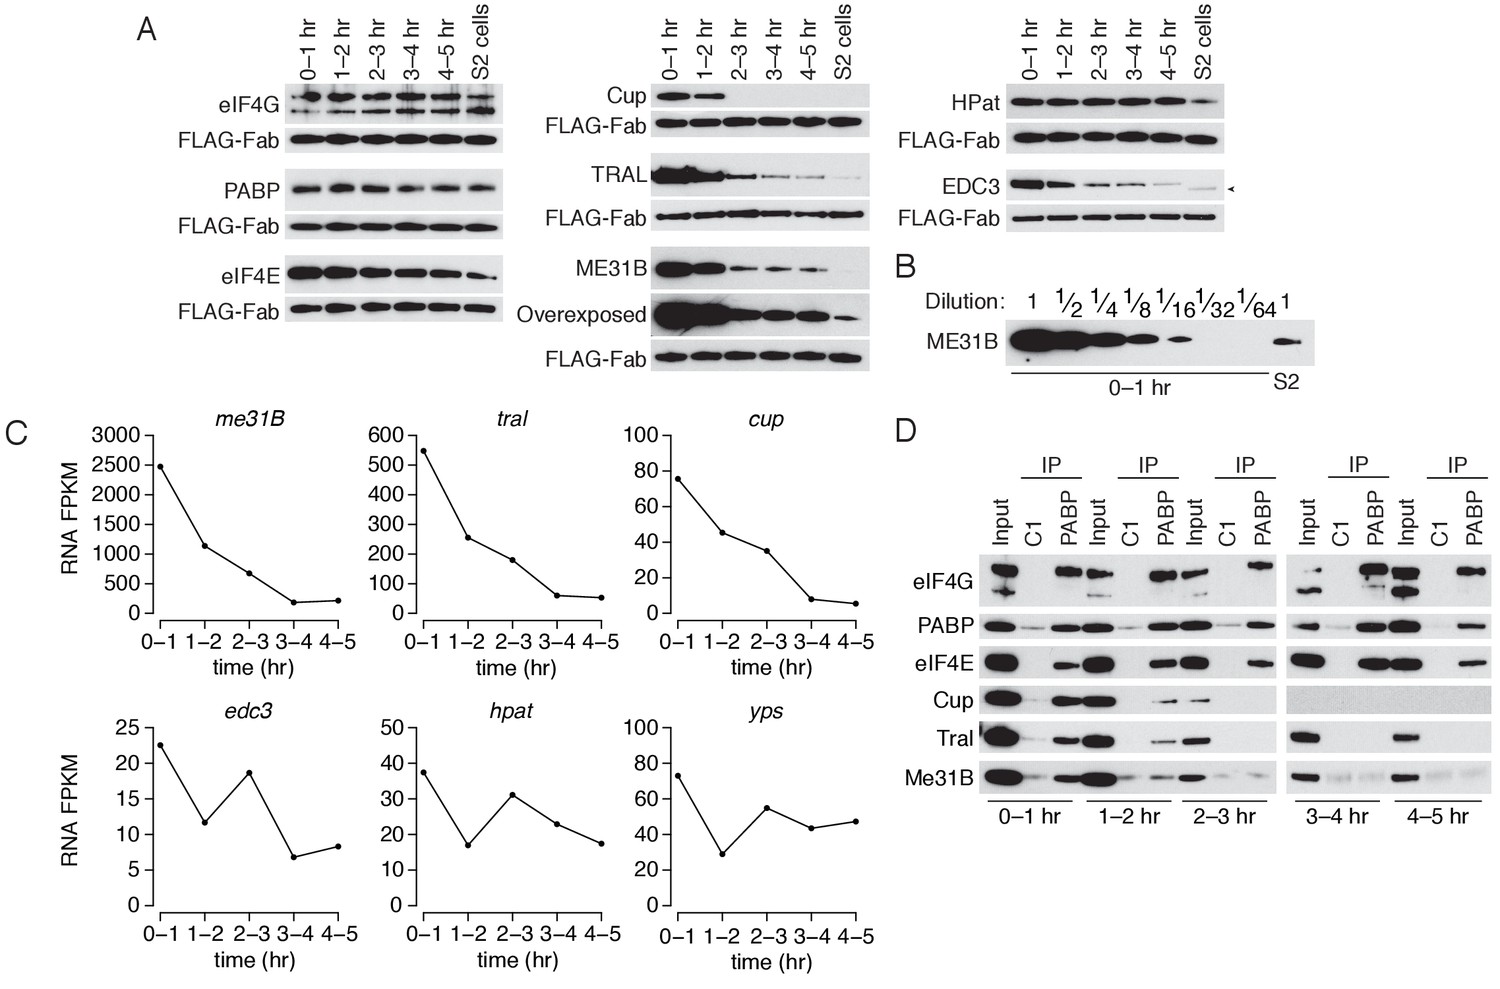
The levels of ME31B, TRAL, and Cup are developmentally regulated through multiple mechanisms.
(A) Western blot analysis of protein abundance over the first five hours of development. Extracts from embryos harvested at one-hour intervals and from S2 cells were collected, and constant amounts of exogenous FLAG-tagged Fabs were added to each lysate. Western blot analysis of the indicated proteins is shown. The arrowhead indicates a nonspecific band. (B) Levels of ME31B in 0–1 hr embryos relative to S2 cells. Western blot of serial dilutions of 0–1 hr embryo extracts and undiluted S2 cell lysate was probed for ME31B. (C) Analysis of mRNA levels over the first five hours of development. RNA-seq was used to analyze RNA abundance in embryos harvested at one-hour intervals. Libraries were prepared with rRNA-depletion. Shown are the FPKM values for the indicated genes. (D) Analysis of the interaction between PABP and Cup, TRAL, and ME31B in early development. Extracts from embryos at the indicated time points were immunoprecipitated with control C1 or anti-PABP Fabs. Western blots of inputs and immunoprecipitates were probed using the indicated antibodies.
Figure 4—figure supplement 1

Regulation of mRNA and protein abundances during early development.
(A) As in Figure 4A, except for eGFP-ME31B embryos. Briefly, extracts from embryos harvested at one-hour intervals and S2 cells were collected, and constant amounts of exogenous FLAG-tagged Fabs were added to each. Western blot analysis of the indicated proteins is shown. (B) Regulation of ME31B, TRAL, and Cup protein levels in comparison to other RNA binding proteins. Shown is a histogram of the change in protein abundance for proteins that interact with mRNA, as determined in Sysoev et al. (2016). (C) Shown are the FPKM values for the indicated genes, as in Figure 4C.
Figure 5 with 1 supplement
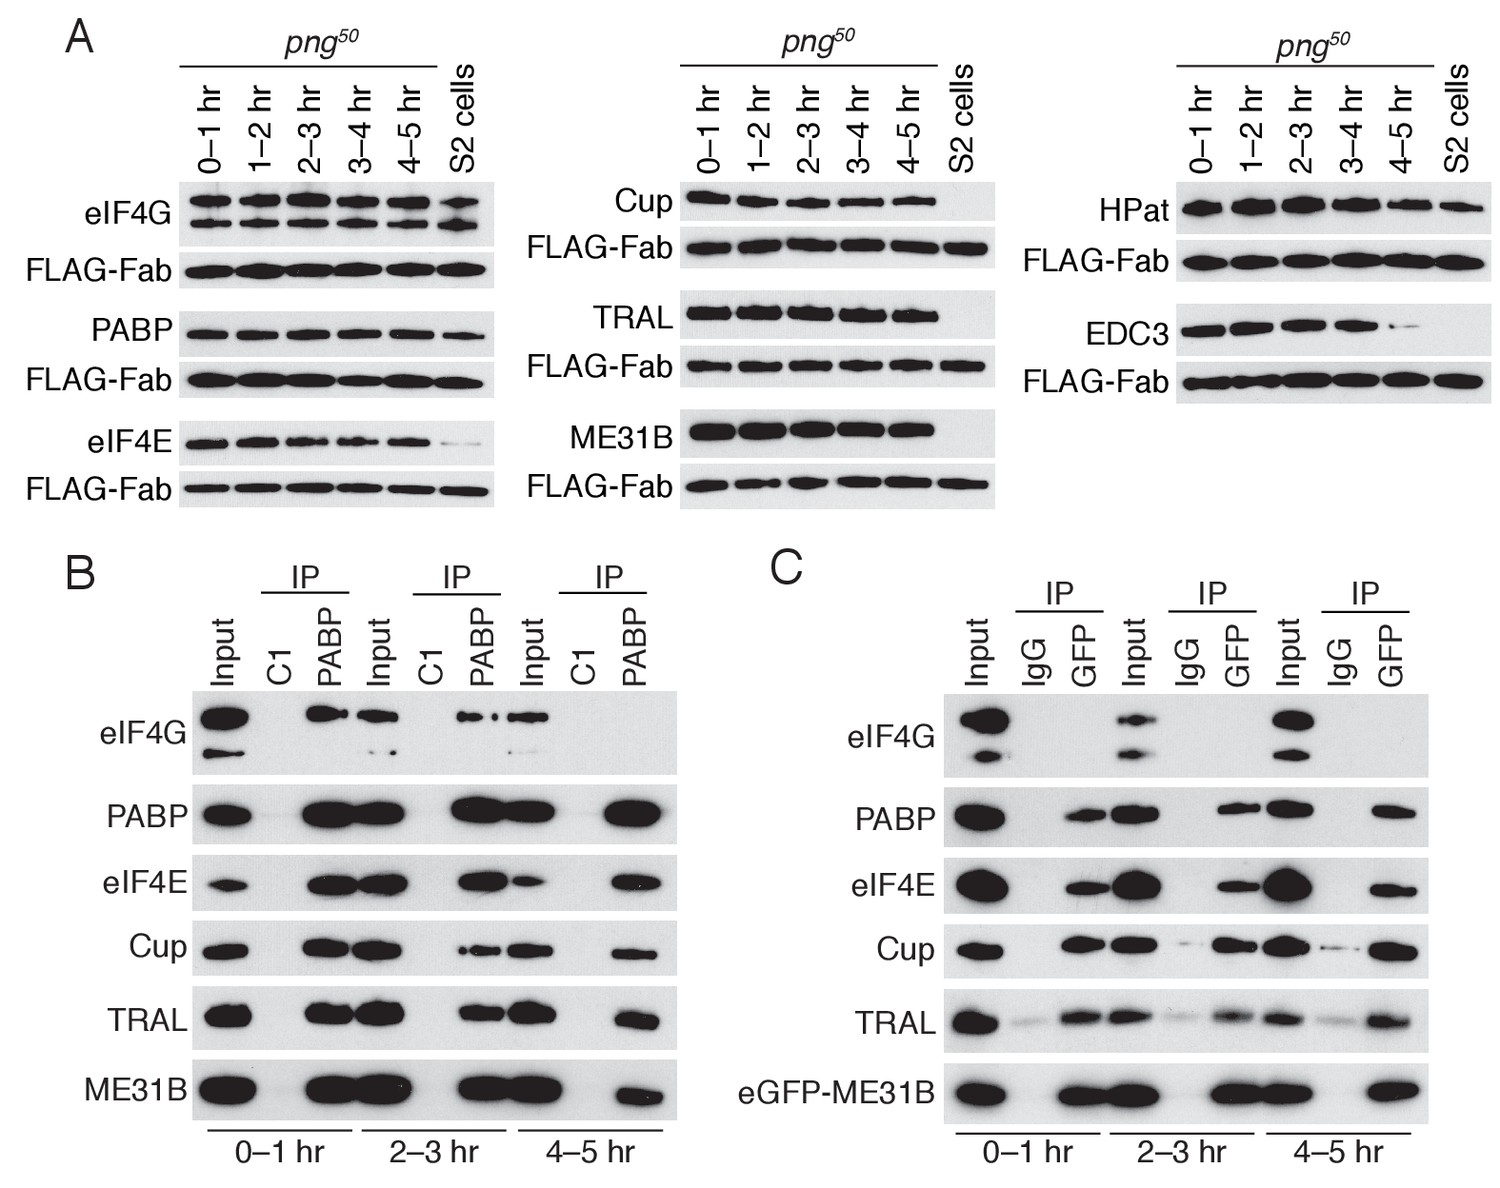
PNG is required for the loss of the Cup, TRAL, and ME31B.
(A) Western blot analysis of png50 embryos. Extracts were collected at one-hour intervals over the first five hours of development, and a constant amount of exogenous FLAG-tagged Fab was added to each lysate, as in Figure 4A. Western blot analyses of the indicated proteins are shown. The arrowhead indicates a nonspecific band. (B) Immunoprecipitation of png50 embryo lysates using control or anti-PABP Fabs. Extracts from 0 to 1, 2–3, and 4–5 hr embryos were co-immunoprecipitated with control C1 or anti-PABP Fabs. Western blots of inputs and immunoprecipitates were probed using the indicated antibodies. (C) As in (B), except for ME31B. Extracts were isolated from eGFP-me31B; png50 embryos at 0–1, 2–3, and 4–5 hr after egg laying, and co-immunoprecipitated using rabbit IgG or anti-GFP antibodies. Western blots of inputs and immunoprecipitates were probed using the indicated antibodies.
Figure 5—figure supplement 1
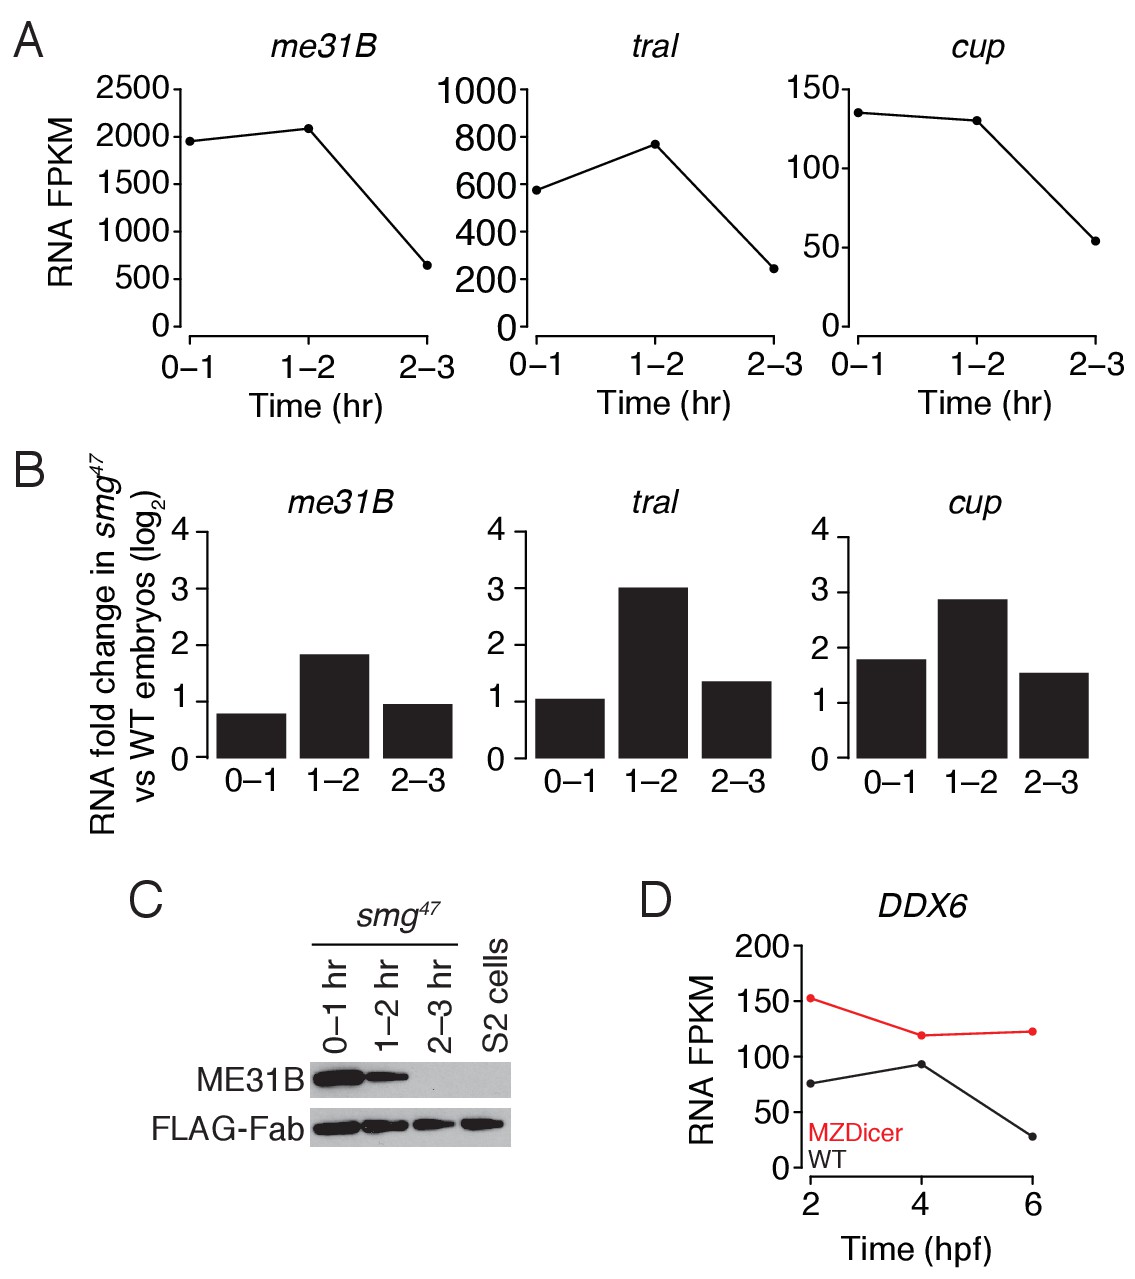
Regulation of me31b, tral, and cup transcripts during embryogenesis.
(A) As in Figure 4C, except for smg47 embryos. RNA-seq was used to quantify transcript abundance in mutant embryos. (B) Ratios of me31B, tral, and cup mRNA in smg47 embryos compared to wild-type embryos. (C) Western blot analysis of smg47 embryos. Extracts were collected at one-hour intervals over the first three hours of development, and a constant amount of exogenous FLAG-tagged Fab was added to each lysate, as in Figure 4A. Western blot analyses of the indicated proteins are shown. (D) Abundance of DDX6 mRNA in zebrafish development. DDX6 mRNA levels were previously measured in 2 hpf (hours post fertilization), 4 hpf, and 6 hpf wild-type and MZDicer zebrafish embryos by RNA-seq (Bazzini et al., 2012). Shown are the FPKM values for DDX6 at various points in embryogenesis in wild-type and MZDicer embryos.
Figure 6 with 2 supplements
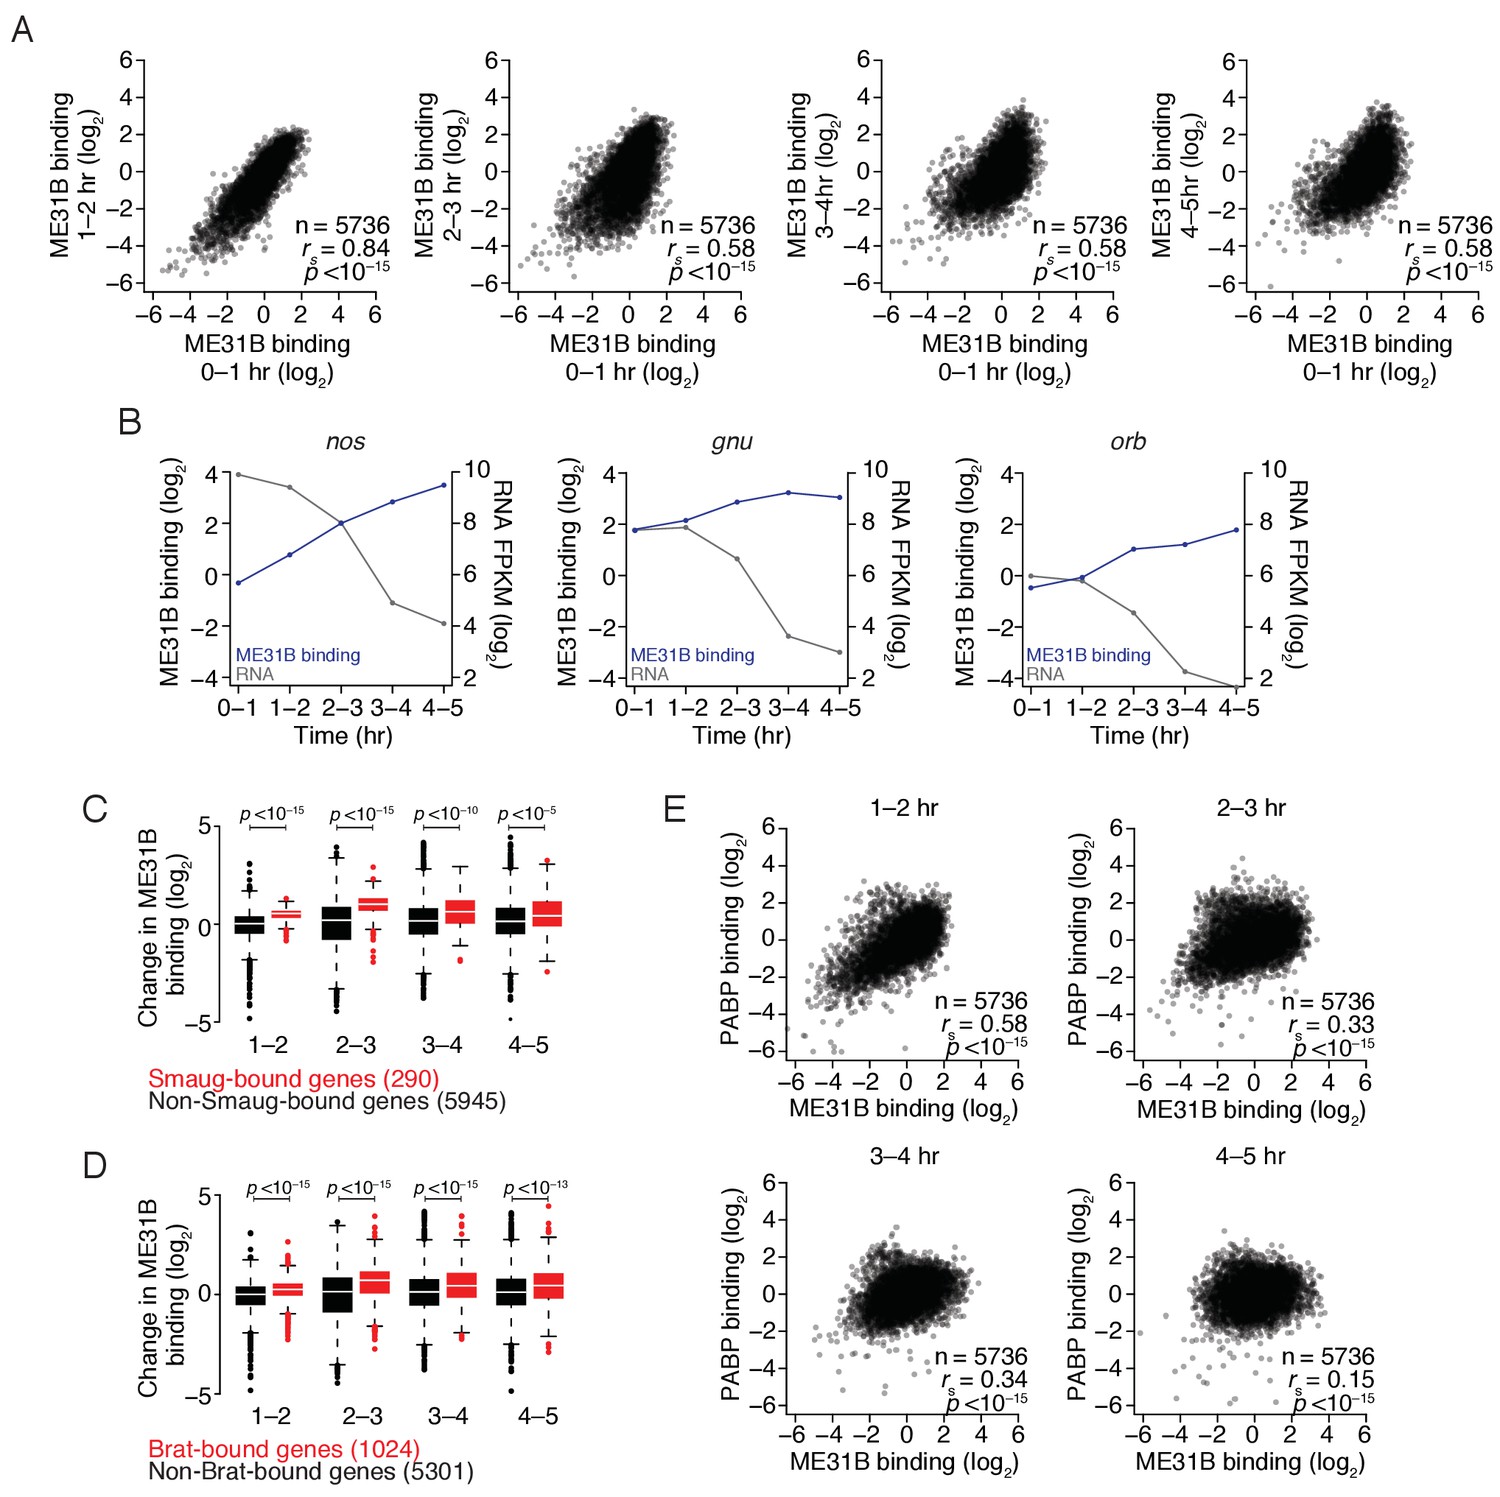
The maternal-to-zygotic transition alters the relationship between PABP and ME31B binding.
(A) Comparison of ME31B binding during early development. Extracts were collected at one-hour intervals for the first five hours of development, and mRNA abundance in the total population as well as those bound by ME31B were determined by sequencing. Note that these libraries were made using rRNA-depletion. Binding for each gene was calculated by normalizing ME31B-bound abundance by its abundance in the total RNA population. Scatter plots for the indicated comparisons are shown. Note that the 0–1 hr sample from this experiment was discussed in Figure 3. (B) Alterations in ME31B binding and transcript abundance for nos, orb, and gnu. (C) A comparison of changes in ME31B binding for SMG-bound mRNAs. For each gene, the fold change in its binding compared to 0–1 hr was calculated. Shown are box-and-whisker plots for SMG-bound genes (in red) and non-SMG bound genes (in black). Line, median; box, quartiles; whiskers, interquartile range. Significance was calculated using the two-tailed Kolmogorov-Smirnov test. (D) As in (C), except for Brat-bound mRNAs. (E) Comparison of PABP and ME31B binding. For each embryonic time point, scatter plots of PABP and ME31B binding are shown.
Figure 6—figure supplement 1

Regulation of PABP binding during the MZT.
(A) Enrichment of Act5C, gnu, ana2, veli, and smg transcripts in ME31B immunoprecipitations at different time points. Extracts from the indicated stages of eGFP-ME31B embryos were immunoprecipitated with IgG or anti-GFP antibodies. The percent of Act5C mRNA pulled down was quantified by random-hexamer-primed RT-qPCR. Numbers reflect the fold enrichment in ME31B immunoprecipitations relative to the control immunoprecipitations. (B) A comparison of ME31B binding as determined by RT-qPCR and RNA-sequencing in 4–5 hr embryos. Plotted is the ME31B binding for the five indicated genes, as measured by RIP-seq, and the percent of total RNA immunoprecipitated, as measured by RT-qPCR. RT-qPCR measurements are an average of 3–4 independent, biological replicates with the error bars denoting standard deviation. (C) Relative binding of ME31B to smg mRNA during embryogenesis. The binding of ME31B to gnu, relative to Act5C, was calculated by RIP-seq (in blue) or RT-qPCR (in black). RT-qPCR measurements were an average of 3–4 independent, biological replicates with the error bars denoting standard deviation. (D) As in (C), except for ana2 mRNA.
Figure 6—figure supplement 2
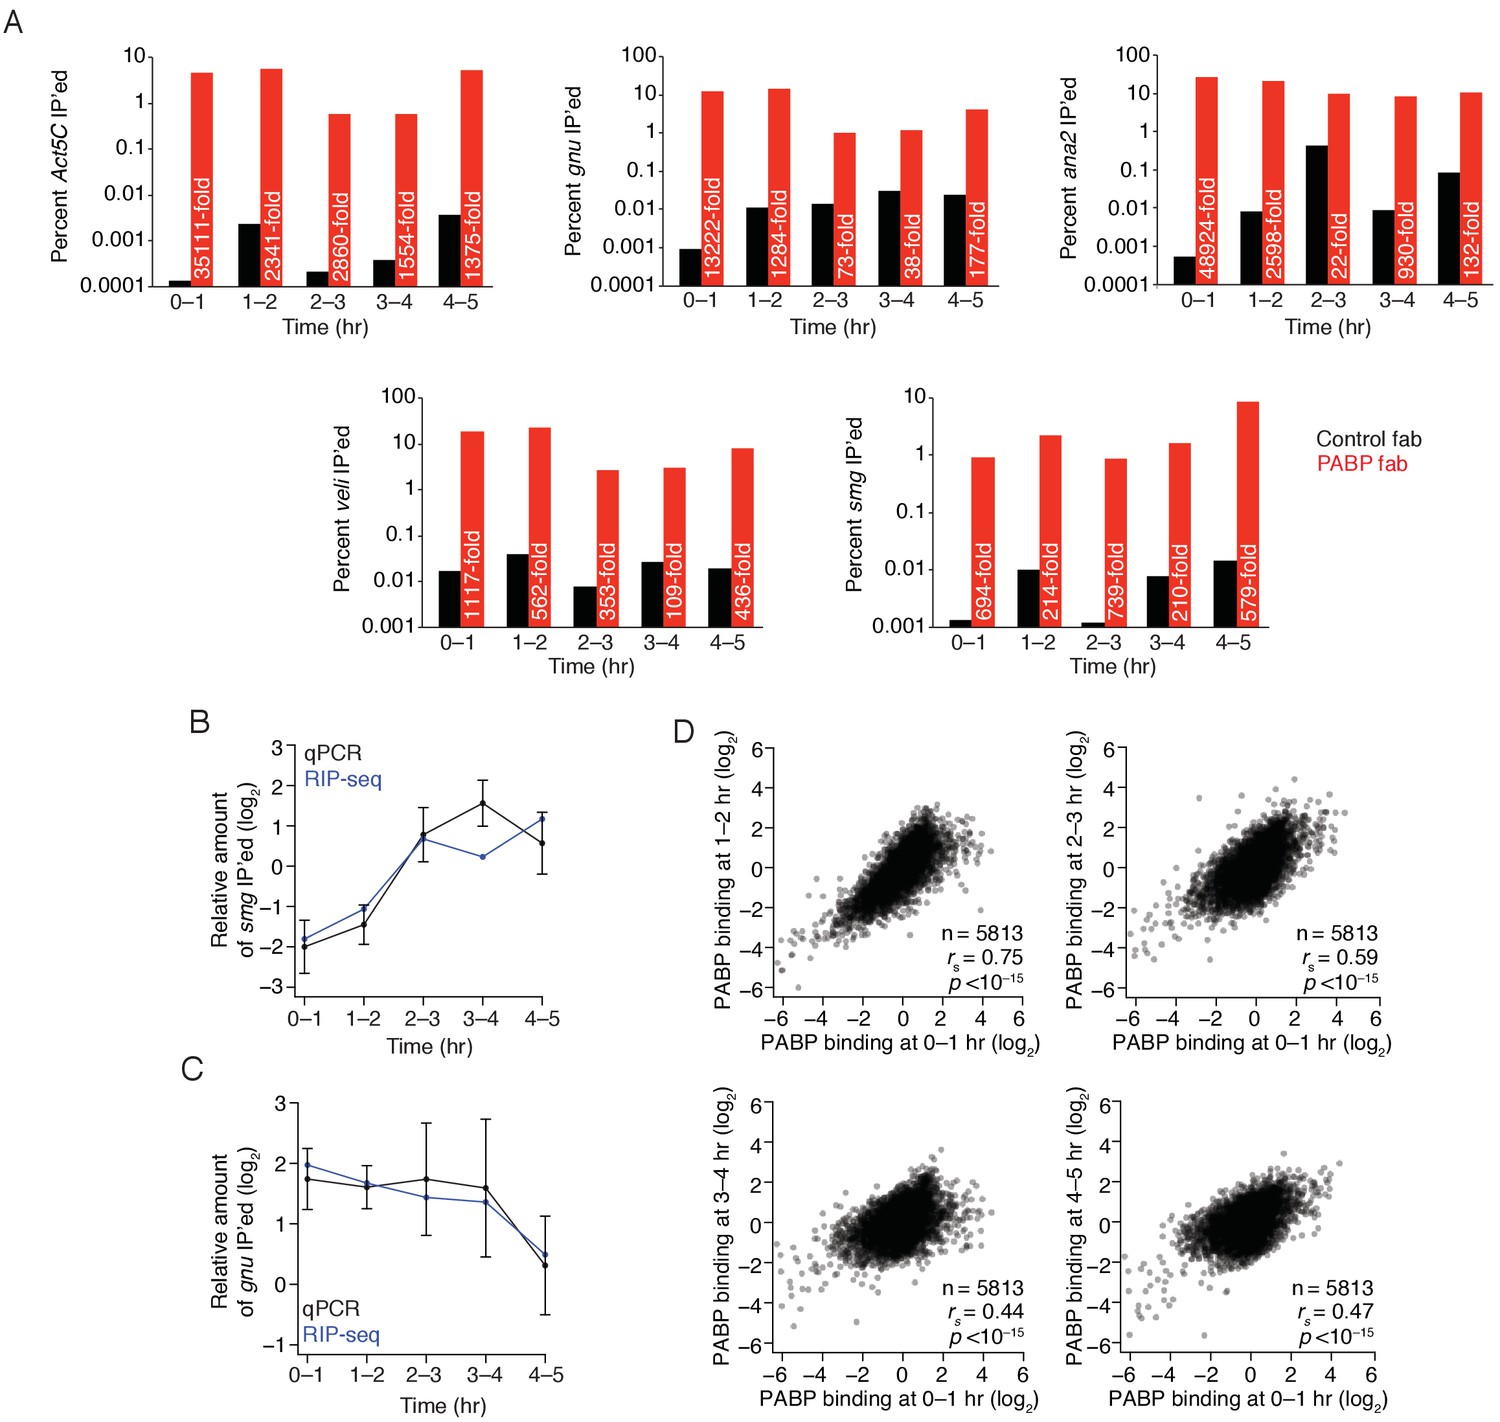
Regulation of PABP binding during the MZT.
(A) Enrichment of Act5C, gnu, ana2, veli, and smg transcripts in PABP immunoprecipitations at different time points. Extracts from the indicated stages of wild-type embryos were immunoprecipitated with control or PABP Fabs. The percent of Act5C mRNA pulled down was quantified by random-hexamer-primed RT-qPCR. Numbers reflect the fold enrichment in PABP immunoprecipitations relative to the control immunoprecipitations. (B) Relative binding of PABP to smg mRNA during embryogenesis. The binding of ME31B to smg, relative to Act5C, was calculated by RIP-seq (in blue) or RT-qPCR (in black). RT-qPCR measurements were an average of 3–4 independent, biological replicates with the error bars denoting standard deviation. (C) As in (B), except for gnu mRNA. (D) Comparison of PABP occupancies during early development. Extracts were collected at one-hour intervals for the first five hours of development, and mRNA abundance in the total population as well as those bound by PABP were determined by sequencing. Note that these libraries were made using rRNA-depletion. Occupancy for each gene was calculated by normalizing PABP-bound abundance by its abundance in the total RNA population. Scatter plots for the indicated comparisons are shown.
Figure 7 with 1 supplement
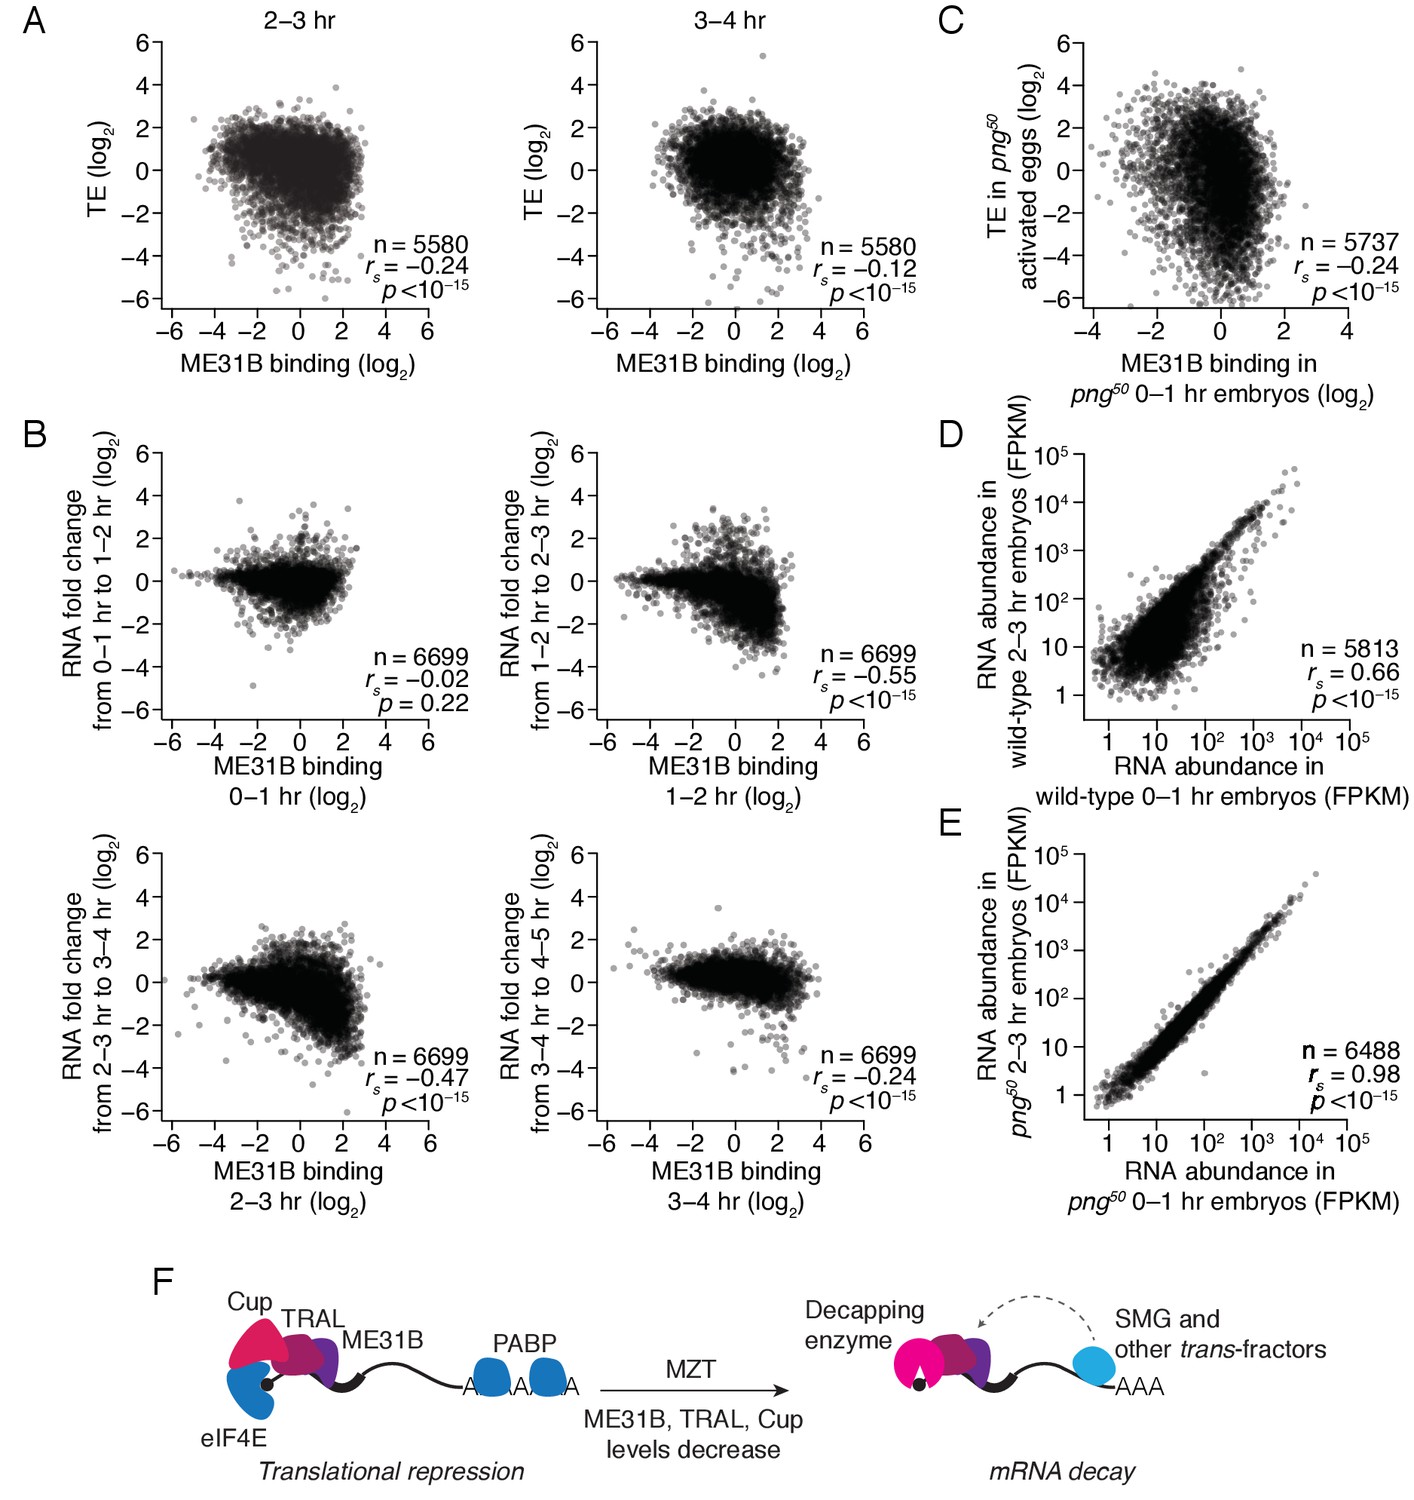
The maternal-to-zygotic transition marks an alteration in the post-transcriptional regulation associated with ME31B binding.
(A) Comparison of ME31B binding and translational efficiency. Plotted are the ME31B binding and translation efficiency values for each gene expressed above cut-off in 2–3 and 3–4 hr embryos. (B) Comparison of ME31B binding and RNA stability. At each of the indicated time points, the RNA fold change over the next hour was determined. For instance, the RNA fold change between 1–2 hr and 0–1 hr was calculated and compared with ME31B binding at 0–1 hr. Plotted are the ME31B binding and fold-change values for each of the indicated time points. (C) Comparison of ME31B binding and translational efficiency in png50 embryos. Plotted are the ME31B binding and translational efficiency values for each gene expressed above cut-off in 0–1 hr eGFP-me31B; png50 embryos (ME31B binding) and 0–1 hr png50 activated eggs (translational efficiency). (D) Comparison of RNA abundance in wild-type embryos. Plotted are the RNA abundances for each gene in 0–1 hr and 2–3 hr wild-type embryos. (E) Comparison of RNA abundance in png50 embryos. Plotted are the RNA abundances for each gene in 0–1 hr and 2–3 hr png50 embryos. (F) Model for the role of ME31B during early development. Prior to the MZT, ME31B, TRAL, and Cup are highly associated with eIF4E and PABP, and ME31B binding represses translation of many transcripts. During the MZT, protein and mRNA levels of Cup, TRAL, and ME31B decrease, and the binding of ME31B now requires recruitment via trans-factors, such as SMG. As indicated by the dotted line, this recruitment is likely indirect presumably relying upon interactions between trans-factors and the CCR4-NOT deadenylase complex and subsequent binding of ME31B and CNOT1. By the end of MZT, ME31B is no longer associated with PABP, and it promotes mRNA decay likely by recruitment of the decapping enzyme (through TRAL, EDC3, and/or HPat).
Figure 7—figure supplement 1
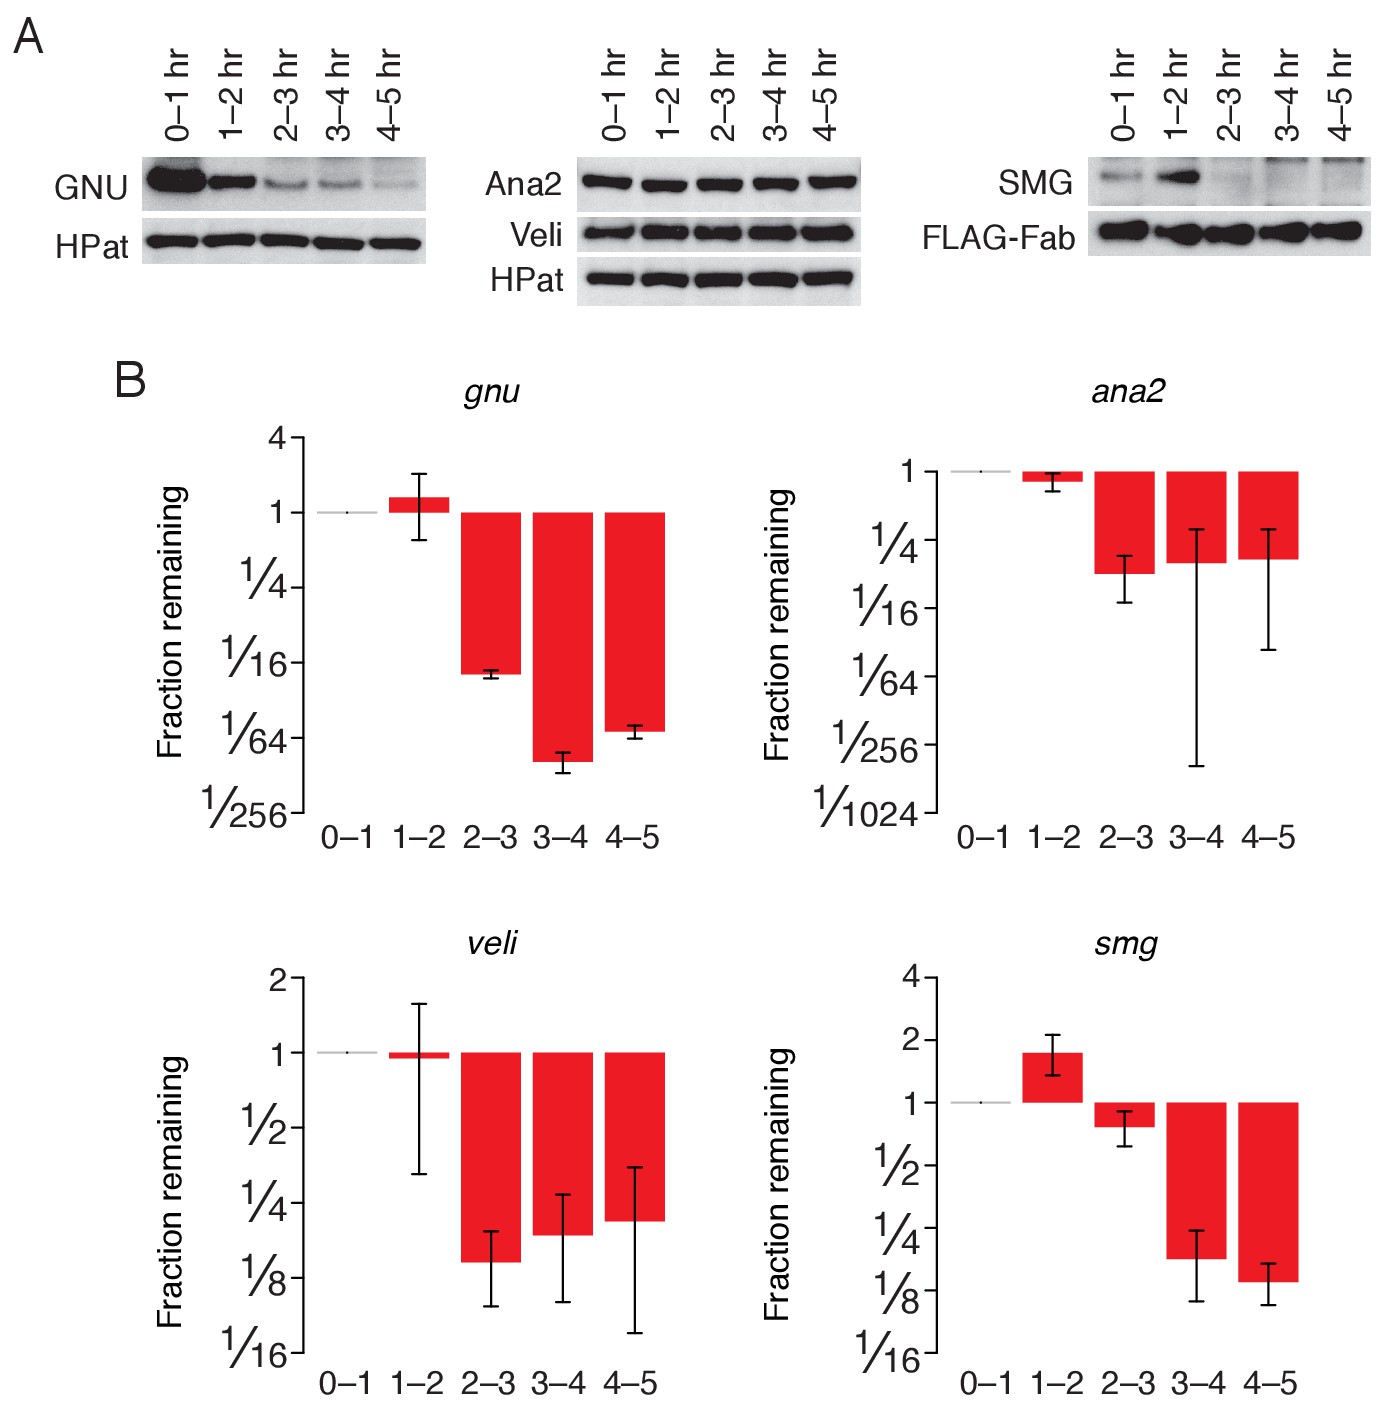
Regulation of ME31B targets during the MZT.
(A) Western blot analysis of protein abundance over the first five hours of development. Extracts from embryos harvested at one-hour intervals were collected. In the case of SMG, constant amounts of exogenous FLAG-tagged Fabs were added to each lysate as a loading control. Western blot analysis of the indicated proteins is shown; in the case of GNU, Ana2, and Veli, HPat is a loading control. (B) Change in transcript abundance over the first five hours of development. Extracts from embryos harvested at one-hour intervals were collected. Levels of gnu, ana2, veli, and smg were determined by random-hexamer-primed RT-qPCR, and normalized to that of Act5C. Plotted is the fraction of each remaining in comparison to 0–1 hr embryos.
Additional files
-
Transparent reporting form
- https://doi.org/10.7554/eLife.27891.020
Download links
A two-part list of links to download the article, or parts of the article, in various formats.
Downloads (link to download the article as PDF)
Open citations (links to open the citations from this article in various online reference manager services)
Cite this article (links to download the citations from this article in formats compatible with various reference manager tools)
ME31B globally represses maternal mRNAs by two distinct mechanisms during the Drosophila maternal-to-zygotic transition
eLife 6:e27891.
https://doi.org/10.7554/eLife.27891


