Dopamine neuron dependent behaviors mediated by glutamate cotransmission
- Columbia University, United States
- NYS Psychiatric Institute, United States
- University of Haifa, Israel
Figures
Figure 1 with 1 supplement
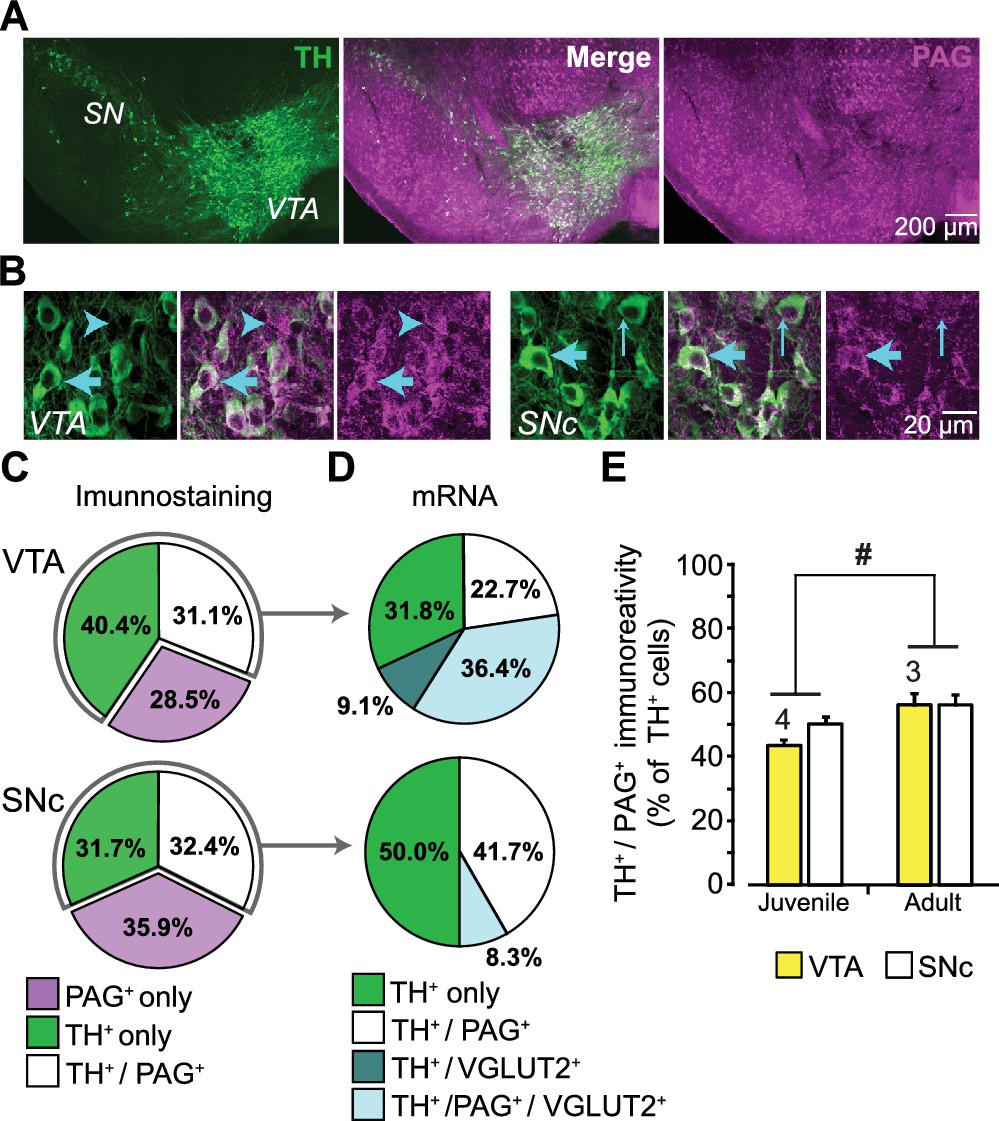
Expression of phosphate-activated glutaminase (PAG) in mouse ventral midbrain DA neurons.
(A) Confocal mosaic z-projected image of the ventral midbrain showing TH (green, left) and PAG (magenta, right) immunoreactivity. Merged image (center) shows that some TH+ DA neurons co-express PAG (white). The specificity of the PAG antibody was verified in GLS1 KO mice; see Figure 1—figure supplement 1A. (B) Magnified confocal images in the VTA (left) and SNc (right) showing TH+ only (thin blue arrow), PAG+ only (blue arrow head) and TH+/PAG+ cells (thick blue arrow). (C) Stereological counts of TH+ only (green), PAG+ only (magenta) and TH+ / PAG+ (white) cells in the VTA and SNc of juvenile (P25) wild type mice (n = 4). Cell numbers in the VTA (TH+only = 4681, PAG+only = 3411, TH+ / PAG+=3673) were greater than in the SNc (TH+only = 2564, PAG+only = 2909, TH+ / PAG+=2595) (two-way ANOVA: main effect of brain region, F(1,18)= 18.36; p<0.001; effect size (ES) partial η2 = 0.51), but the relative proportions of cell types did not differ between regions(main effect of cell type, F(2,18)= 1.22; p=0.318; cell type X brain region interaction, F(2,18)= 2.70; p=0.094). (D) Single-cell RT-PCR analysis of cells expressing TH mRNA, in the VTA and SNc of juvenile mice (P25-37), showing the percentage of cells that co-expressed PAG and VGLUT2 mRNA. In the VTA, most cells were either TH+ only (7/22) or TH+/PAG +/VGLUT2+(8/22); there were also TH+/PAG+ cells (5/22) and rarely TH+/VGLUT2+ (2/22). In the SNc, most cells were either TH+ only (5/12) or TH+/PAG+ cells (6/12); and rarely TH+/PAG+/VGLUT2+ (1/12). No TH+ cells expressed GAD mRNA. For the full coexpression analysis, including GAD mRNA, see Figure 1—figure supplement 1B and C. (E) Comparison of the relative number of TH+ / PAG+ cells in juvenile (P25) and adult (P60) mice. In both the VTA and SNc, there was a significant increase in the number of TH+ / PAG+ cells. # indicates a significant main effect of age (two-way ANOVA, F(1,10)= 8.26; p=0.017, ES partial η2 = 0.45); there was no significant region effect (F(1,10)= 2.154; p=0.173), nor interaction, (F(1,10)= 0.846; p=0.379). See Figure 1—source data 1.xlsx for source data and all statistical analysis.
-
Figure 1—source data 1
Stereology of TH and PAG positive cells in the VTA and SNc in Juvenile and Adult.
- https://doi.org/10.7554/eLife.27566.004
Figure 1—figure supplement 1

Expression of PAG in dopamine neurons.
(A) Validation of the phosphate-activated glutaminase (PAG) antibody in GLS1 KO mice (neonates were used since KOs survive only for a few hours). Immunoreactivity was absent in GLS1 KO brain. Sagittal sections are shown. Abbreviations: Ctx, cortex; Hipp, hippocampus. (B) Sample gel images of single-cell reverse transcription (RT) PCR from the VTA (top) and the SN (bottom). For each region, the upper gel shows the multiplex result for glutamate decarboxylase (GAD67, 702 bp), tyrosine hydroxylase (TH, 377 bp), vesicular glutamate transporter (VGLUT2, 250 bp); the lower gel shows PAG (512 bp). Numbers on the top of each image are cell numbers; each lane in the multiplex gel (top) and PAG gel (bottom) was from the same cell. (C) Euler diagrams showing RT-PCR results in the VTA (top) and the SN (bottom). Numbers inside each square indicate the number of cells expressing the gene or combination of genes. TH+ cells are grouped (green square) in the diagram on the left; TH— cells are divided into those expressing GAD67 (gray squares) and VGLUT2 (blue squares), on the right. PAG expressing cells are indicated by magenta-filled magenta squares. Cells expressing TH, VGLUT2 and PAG are indicated by yellow filled squares. There was no overlap of TH and GAD.
Figure 2 with 1 supplement
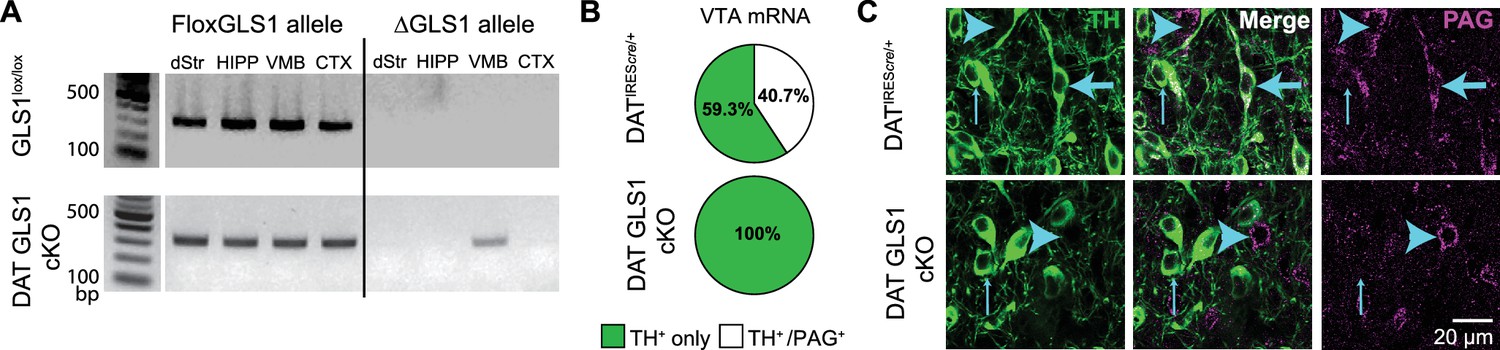
DA neuron selective PAG deletion.
(A) PCR screens for the floxGLS1 allele (left) and ΔGLS1 allele (right) in brain regions from both GLS1lox/lox and DAT GLS cKO mice. The ΔGLS1 allele was present solely in DAT GLS1 cKO ventral midbrain. dStr, dorsal striatum; HIPP, hippocampus; VMB, ventral midbrain; CTX, cortex. Gel is representative of 3 replications. (B) Single-cell rtPCR analysis of TH expressing cells in the VTA in DATIREScre/+ and DAT GLS1 cKO mice. In the VTA of DATIREScre/+mice, 11/30 TH cells expressed PAG mRNA, while in DAT GLS1 cKO none did (0/38 cells). (C) Confocal photomicrographs of the VTA from DATIREScre/+ and DAT GLS1 cKO mice showing TH+ only (thin blue arrow) and PAG+ only (blue arrow head) and TH+/PAG+ cells (thick blue arrow). There were no TH+/PAG+ cells in the DAT GLS1 cKO ventral midbrain. Expression of dopaminergic markers and amphetamine-induced hyperlocomotion were not affected in DATIREScre mice; see Figure 2—figure supplement 1. These mice were control (CTRL) mice in subsequent experiments.
Figure 2—figure supplement 1
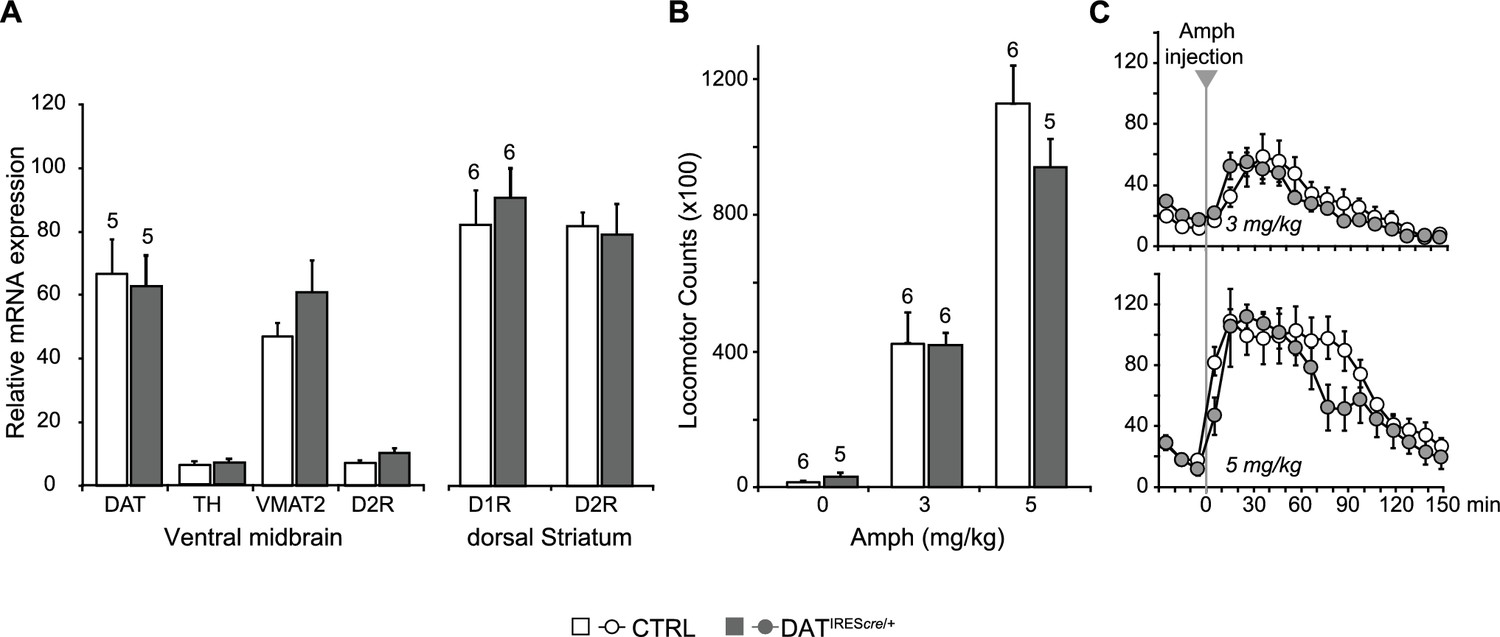
Expression of dopaminergic markers and amphetamine-induced hyperlocomotion were not affected in DATIREScre mice.
(A) The relative mRNA expression of dopamine transporter (DAT), tyrosine hydroxylase (TH), vesicular monoamine transporter 2 (VMAT2) and dopamine D2 receptor (D2R) in the ventral midbrain (left), and D1R and D2R in dorsal striatum (dStr, right) of DATIREScre/+ and wild-type littermates (CTRL). A multivariate ANOVA showed no genotypic effect for any of the dopaminergic markers (ventral midbrain, DAT, F(1,8)= 0.061, p=0.811; TH, F(1,8)= 0.320, p=0.587; VMAT2, F(1,8)= 1.742, p=0.223; D2, F(1,8)= 3.903, p=0.084; dStr, D1 = F(1,10)= 0.384, p=0.549; F(1,10)= 0.851, p=0.004). (B) Amphetamine (Amph) stimulated locomotion. Total locomotor counts (i.e., beam breaks) in the open field made over 2.5 hr following Vehicle (0 mg/kg) or Amph, 3 or 5 mg/kg (i.p.). A two-way ANOVA showed a main effect of drug (F(2,28) = 83.1; p<0.001, ES partial η2 = 0.86), but no significant main effect of genotype (F(1,28) = 0.846; p=0.366) or significant interaction (F(2,28) = 28.2; p=0.973). (C) Time course of Amph-evoked locomotion. There were no genotypic differences for either the 3 mg/kg (top) or 5 mg/kg doses (bottom). The repeated measures (RM) ANOVA showed no significant main effect of genotype (3 mg/kg dose, F(1,10) = 0.003, p=0.960; 5 mg/kg dose, F(1,9) = 1.322, p=0.280) or time X genotype interaction (3 mg/kg dose, F(14,140) = 0.784, p=0.685; 5 mg/kg dose, F(14,126) = 1.663, p=0.071); there was a main effect of time (3 mg/kg dose, F(14,140) = 20.5, p<0.0001, ES partial η2 = 0.67; 5 mg/kg dose, F(14,126) = 20.5, p<0.0001, ES partial η2 = 0.69). Numbers of cells are shown above each bar in the graphs. See Figure 2—figure supplement 1—source data 1.xlsx for source data and statistical analysis.
-
Figure 2—figure supplement 1—sourcedata 1
Expression of dopaminergic markers and amphetamine-induced hyperlocomotion in DATIREScre mice .
- https://doi.org/10.7554/eLife.27566.008
Figure 3 with 2 supplements
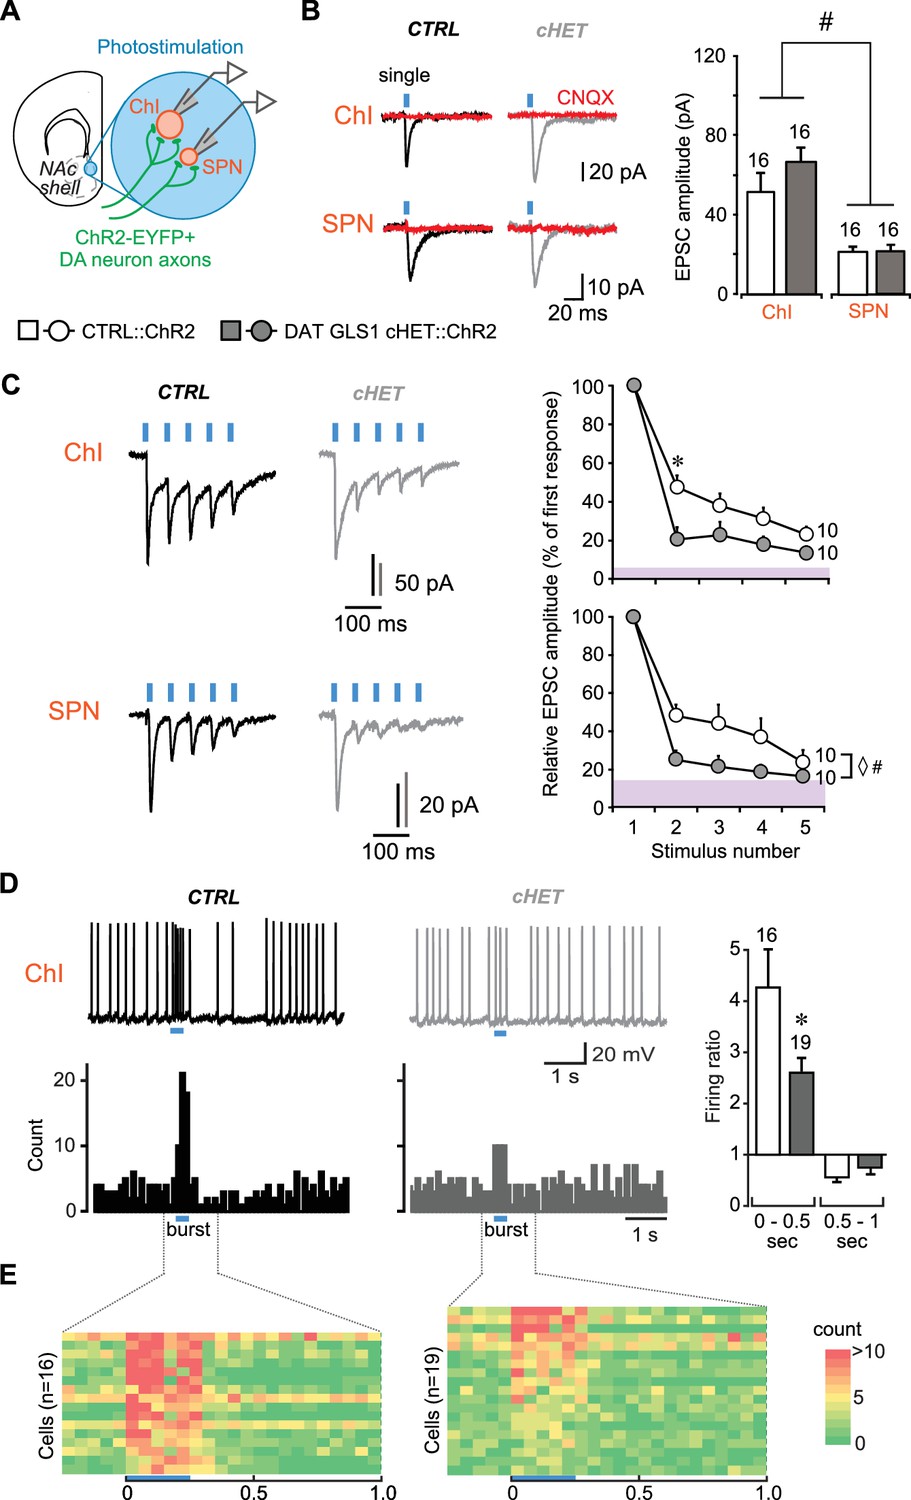
DA neuron GLU cotransmission is attenuated in DAT GLS1 cHETs at phasic firing frequencies.
(A) Schematic of a coronal slice (−1.34 mm from bregma) indicating the location of the patch-clamp recordings in the medial NAc shell. DA neuron excitatory responses evoked by photostimulation (blue circles) were measured from ChIs and SPNs (left). See also Figure 3—figure supplement 1. (B) Representative traces (left) of EPSCs generated by a single-pulse photostimulation (blue bar) at 0.1 Hz recorded from ChIs and SPNs. Traces shown are averages of 10 consecutive traces. Comparison is made between responses in CTRL (black traces) and DAT GLS1 cHET mice (gray traces); all responses were completely blocked by CNQX (40 µM; red traces). Summary of average EPSC amplitude after single-pulse photostimulation (right). # indicates a significant main effect of cell type (two-way ANOVA, F(1,36) = 25.6, p<0.001, ES partial η2 = 0.42); there was no significant genotype effect (F(1,36) = 1.084, p=0.305), nor interaction (F(1,36) = 0.628, p=0.433). See also Figure 3—figure supplement 2. (C) Representative traces of EPSCs generated by burst photostimulation (5 pulses at 20 Hz) recorded from ChIs (top) and SPNs (bottom). Summary of the average EPSC amplitudes after burst photostimulation (right) are shown as percentage of the first response, which did not differ between genotypes (ChIs, CTRL 95 ± 29 pA vs. cHET 107 ± 12 pA, Mann-Whitney, p=0.14; SPNs, CTRL 27 ± 4 pA vs. cHET 28 ± 5 pA, Mann-Whitney, p=0.88). The shaded violet bar at the bottom of the graphs represents the average baseline noise (ChIs 3.8 ± 0.4 pA; SPNs 3.5 ± 0.3 pA). For ChIs, repeated measures (RM) ANOVA revealed a significant pulses X genotype interaction (F(3,54) = 28.2, p=0.006, ES partial η2 = 0.27), main effect of pulses (F(3,54) = 20.9, p<0.001), and main effect of genotype (F(1,18) = 5.06, p=0.037). * indicates significant difference from CTRL (p=0.006) after applying a Bonferroni correction for 4 comparisons (α = 0.0125). For SPNs, ◊ # indicates a significant main effect of genotype (F(1,18) = 4.6, p=0.047, ES partial η2 = 0.20) and main effect of pulses (F(3,54) = 7.7, p<0.001, ES partial η2 = 0.30) by RM ANOVA; but no significant interaction (F(3,54) = 2.0, p=0.101). (D) Effect of photostimulation mimicking DA neuron bursting (5 pulses at 20 Hz) on ChI firing. Representative traces are shown above (left), with peristimulus histograms summing ten consecutive traces (0.1 s bin) below. Ratio of firing during burst photostimulation (0–0.5 s from onset of train) and after (0.5–1 s from onset) to baseline firing are shown on the right. * indicates significant effect of genotype (one-way ANOVA, F(1,33) = 7.0, p=0.013, ES partial η2 = 0.17). (E) Colored-coded tables showing action potential counts in 50 ms intervals, prior to, during and after DA terminal photostimulation for CTRL (left) and DAT GLS1 cHET mice (right) for all recorded cells. The blue horizontal bar at the bottom of each table indicates the duration of burst photostimulation, with onset at time 0. In all the graphs, the number of cells is shown above the bars or next to the lines. In this and subsequent figures, error bars represent SEM. See Figure 3—source data 1.xlsx for source data and statistical analysis.
-
Figure 3—source data 1
Slice patch clamp experiments.
- https://doi.org/10.7554/eLife.27566.010
Figure 3—figure supplement 1

Comparison between CTRL::ChR2 and DAT GLS1 cHET::ChR2 mice showing selective ChR2 expression in DA neurons did not differ between genotypes.
(A) ChR2-EYFP expression (green) in the ventral midbrain was restricted to TH+ cells (magenta), with similar colocalization (white) in both CTRL::ChR2 mice (left) and DAT GLS1 cHET::ChR2 mice (right). (B) Stereological counts of ChR2-EYFP and TH+ cells in the VTA and SNc of CTRL::ChR2 (n = 3) and DAT GLS1 cHET::ChR2 mice (n = 3). Values are presented as percent of the total number of cells counted in each region, for each genotype (VTA, CTRL::ChR2 = 5097 ± 817 cells and DAT GLS1 cHET::ChR2 = 3891 ± 628 cells; SNc, CTRL::ChR2 = 4782 ± 889 cells and DAT GLS1 cHET::ChR2 = 3345 ± 453 cells; Kruskal-Wallis test in each region showed no genotype effect). The percentage of TH+/ChR2-EYFP+ cells did not differ genotypically, in the VTA or SNc (Kruskal-Wallis test). (C) TH+ interneurons (magenta) in the dorsal striatum (dStr) did not express ChR2-EYFP (green).
Figure 3—figure supplement 2
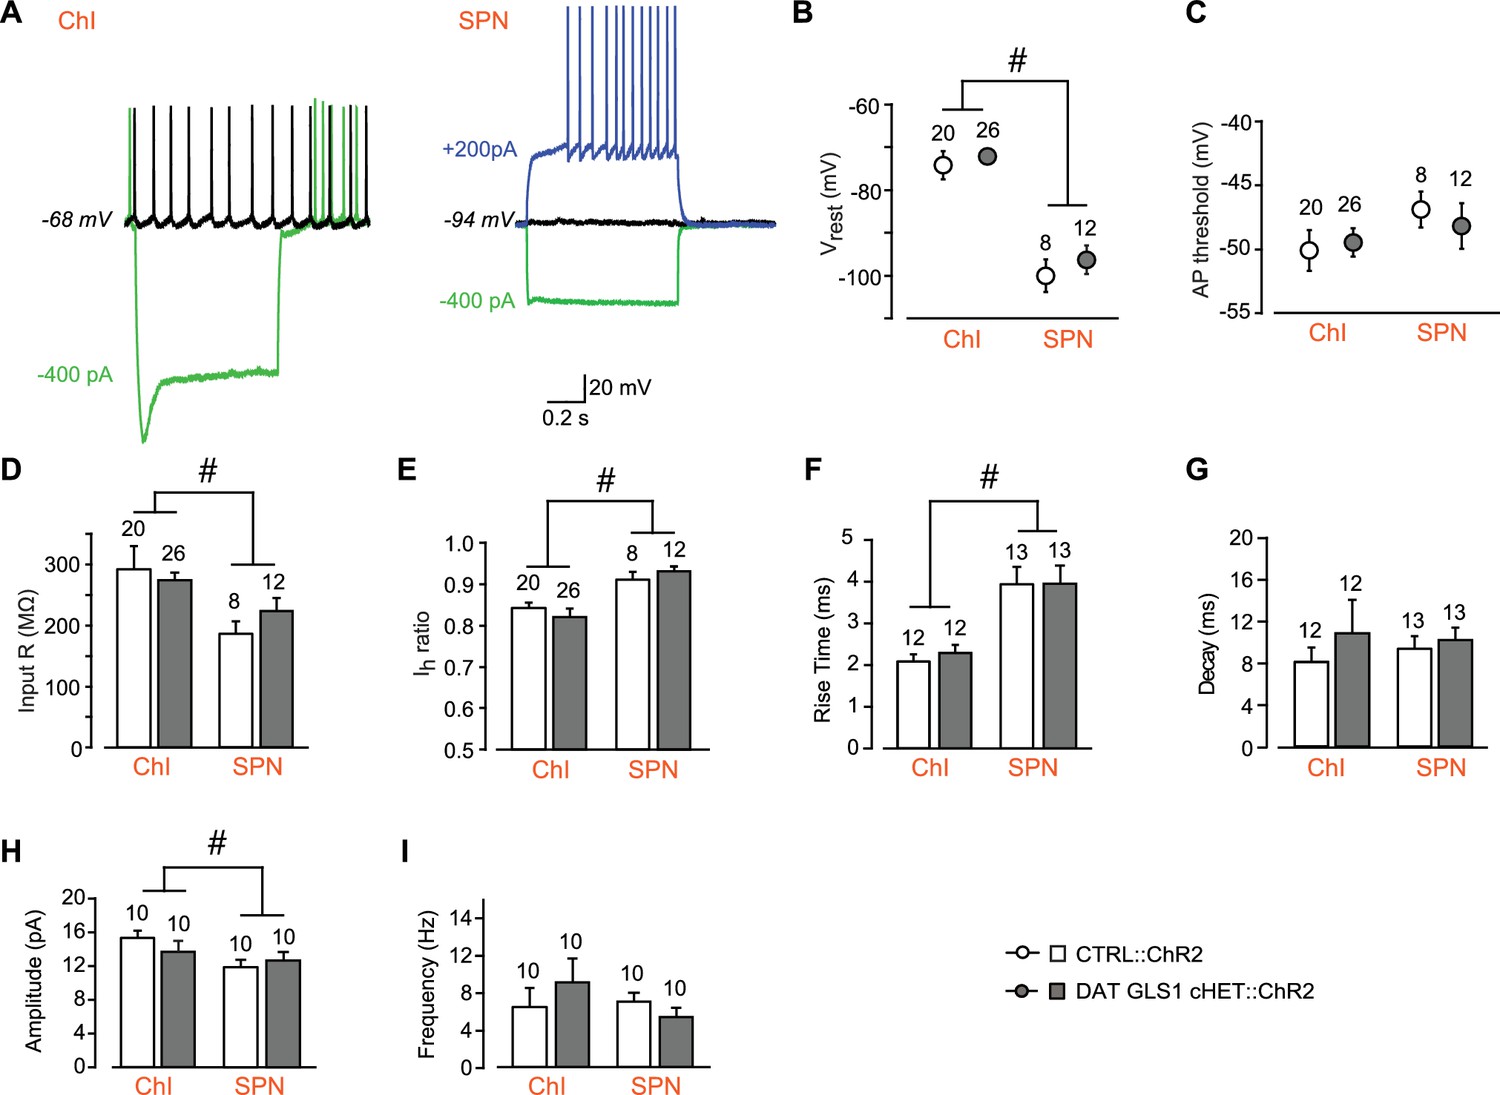
Comparison between CTRL::ChR2 and DAT GLS1 cHET::ChR2 mice showing that intrinsic electrophysiological membrane properties and spontaneous EPSCs measured in NAc shell cells did not differ between genotypes.
(A) ChIs and SPNs are identifiable based on their electrophysiological signature under current clamp. The ChI (left) had a resting membrane potential around −70 mV, fired spontaneously (black trace), and showed a voltage sag with hyperpolarizing current injection (green trace). The SPN (right) had a deep resting membrane potential around −100 mV, did not fire spontaneously (black), showed no sag with hyperpolarizing current injection (green trace), and fired rapidly with depolarizing current injection, after a delay (blue trace). (B) The average baseline membrane potential (Vrest) was more negative in SPNs than in ChIs, but not genotypically different. A two-way ANOVA showed a main effect of cell type (F(1,62) = 128.3, p<0.0001, ES partial η2 = 0.67), indicated by the #, but no main effect of genotype (F(1,62) = 1.67, p=0.201) or significant interaction (F(1,62) = 0.138, p=0.711). (C) Action potential (AP) threshold in ChIs and SPNs. A two-way ANOVA showed no main effect of genotype (F(1,62) = 0.53, p=0.819) or cell type (F(1,62) = 2.78, p=0.100), or significant interaction (F(1,62) = 0.480, p=0.491). (D) Input impedance was significantly higher in ChIs compared to SPNs, but not statistically different between genotypes. A two-way ANOVA showed a main effect of cell type (F(1,62) = 15.7, p<0.001, ES partial η2 = 0.20), indicated by the #, but no main effect of genotype (F(1,62) = 0.233, p=0.631) or significant interaction (F(1,62) = 1.96, p=0.167). (E) The hyperpolarization-activated cation current (Ih) ratio was lower in the ChIs than SPNs, revealing the presence of an Ih in ChIs but not SPNs. A two-way ANOVA showed a main effect of cell type (F(1,62) = 15.0, p<0.001, ES partial η2 = 0.20), indicated by the #, but no main effect of genotype (F(1,62) = 0.001, p=0.976) or significant interaction (F(1,62) = 0.856, p=0.358). (F) Characterization of photostimulated DA neuron evoked EPSCs in ChIs and SPNs under voltage clamp revealed that rise time (from 10% to 90% of peak amplitude) was faster in SPNs than ChIs, but not genotypically different. A two-way ANOVA showed a significant cell type effect (F(1,46) = 28.4, p<0.0001, ES partial η2 = 0.08) indicated by the #, but no main effect of genotype (F(1,46) = 1.02, p=0.305) or significant interaction (F(1,46) = 1.02, p=0.305). (G) Decay times of evoked EPSCs under voltage clamp. A two-way ANOVA showed no main effect of genotype (F(1,46) = 2.135; p=0.151) or cell type (F(1,46) = 0.458; p=0.502), or significant interaction (F(1,46) = 1.331; p=0.255). (H) Amplitude of spontaneous EPSCs measured under voltage clamp (holding potential −70 mV) in ChIs and SPNs. A two-way ANOVA showed a main effect of cell type (F(1,36) = 5.85, p<0.021, ES partial η2 = 0.14), indicated by the #, but no main effect of genotype (F(1,36) = 0.257, p=0.615) or significant interaction (F(1,36) = 1.68, p=0.203). (I) Frequency of spontaneous EPSCs measured under voltage clamp (holding potential −70 mV) in ChIs and SPNs. A two-way ANOVA showed no main effect of genotype (F(1,36) = 0.308, p=0.582) or cell type (F(1,36) = 0.764, p=0.388), or significant interaction (F(1,36) = 1.97, p=0.169). Numbers of cells are shown above each bar or circle in the graph. See Figure 3—figure supplement 2—source data 1.xlsx for source data and statistical analysis.
-
Figure 3—figure supplement 2—source data 1
Intrinsic electrophysiological membrane properties and spontaneous EPSCs measured in NAc shell cells of CTRL and DAT GLS1 cHET mice .
- https://doi.org/10.7554/eLife.27566.013
Figure 4 with 2 supplements
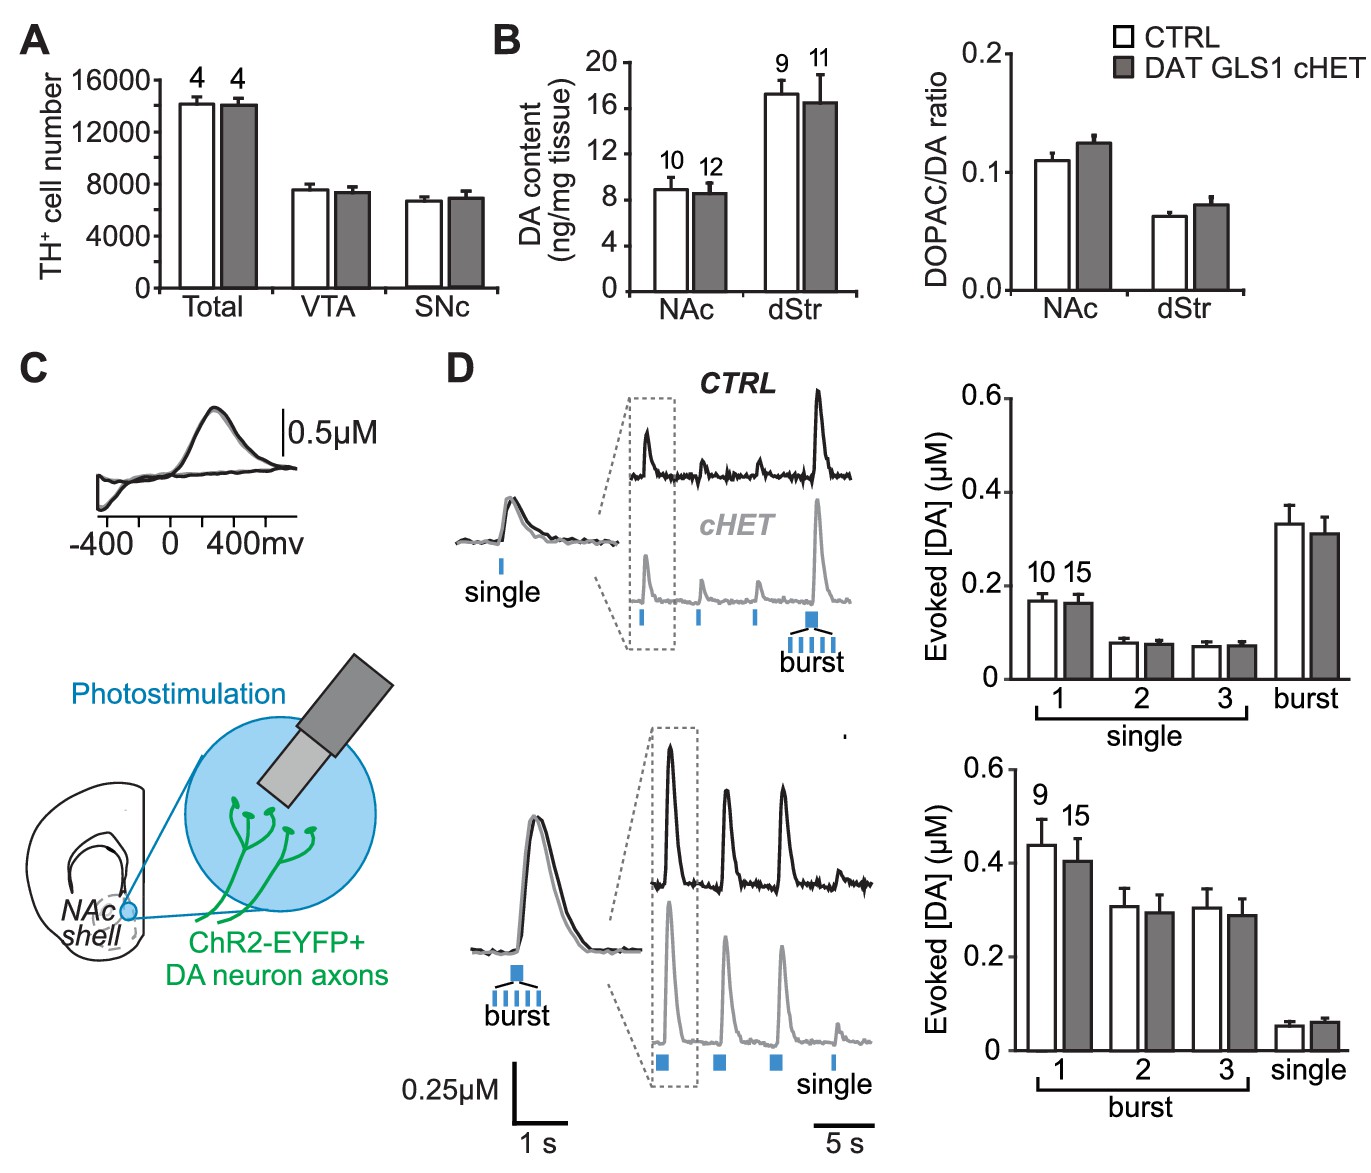
PAG reduction in DA neurons does not alter the number of DA neurons or striatal DA function.
(A) Stereological-estimate of the total number of DA neurons (TH+ neurons) in the VTA and SNc in one hemisphere showed no difference between genotypes (one-way ANOVA: VTA, F(1,6) = 0.149, p=0.713; SNc, F(1,6) = 0.085, p=0.781). There were no differences in DA neuron intrinsic electrophysiological properties; see Figure 4—figure supplement 1. (B) Tissue DA content in the NAc and dStr (left) and DA turnover measured by DOPAC/DA ratio (right) did not differ between genotypes by one-way ANOVA (NAc DA content, F(1,22) = 0.070, p=0.794; NAc DOPAC/DA, F(1,22) = 3.01, p=0.098; dStr DA content, F(1,20) = 0.078, p=0.783; dStr DOPAC/DA, F(1,20) = 1.68, p=0.211). (C) FSCV recordings in the medial NAc shell. A representative voltammogram is shown above a schematic of a coronal slice (−1.34 mm from bregma) indicating the recording configuration. (D) DA release evoked by three consecutive single photostimulation pulses followed by a burst (5 pulses at 20 Hz) (above), or by three consecutive bursts followed by a single (below). Representative recordings of evoked DA release are shown with dashed boxes indicating initial traces that were enlarged and superimposed on the left, showing that DA release dynamics did not differ between genotypes for the single (above) or burst (below) responses. DA release dynamics did not differ between genotypes for consecutive singles followed by a burst (above) or repeated bursts followed by a single pulse (below). The average evoked DA release is shown on the graph (right). For consecutive single pulses followed by a burst, a RM ANOVA revealed a significant main effect of pulses (F(3,69) = 135.1, p<0.001, ES partial η2 = 0.85); there was no effect of genotype (F(1,23) = 0.069, p=0.795) nor interaction (F(3,69) = 0.247, p=0.864). For the consecutive bursts followed by a single, a RM ANOVA revealed a significant main effect of pulses (F(3,66) = 124.5; p<0.001, ES partial η2 = 0.85); there was no effect of genotype (F(1,22) = 0.004, p=0.948) or interaction (F(3,66) = 0.103, p=0.103). Dopamine release in the NAc core and dStr was also not affected in DAT GLS1 cHETs; see Figure 4—figure supplement 2. Numbers of mice or the number of slices (FSCV) are shown in each graph above the bars. See Figure 4—source data 1.xlsx for source data and statistical analysis.
-
Figure 4—source data 1
Dopamine transmission in CTRL and DAT GLS1 cHET mice.
- https://doi.org/10.7554/eLife.27566.015
Figure 4—figure supplement 1
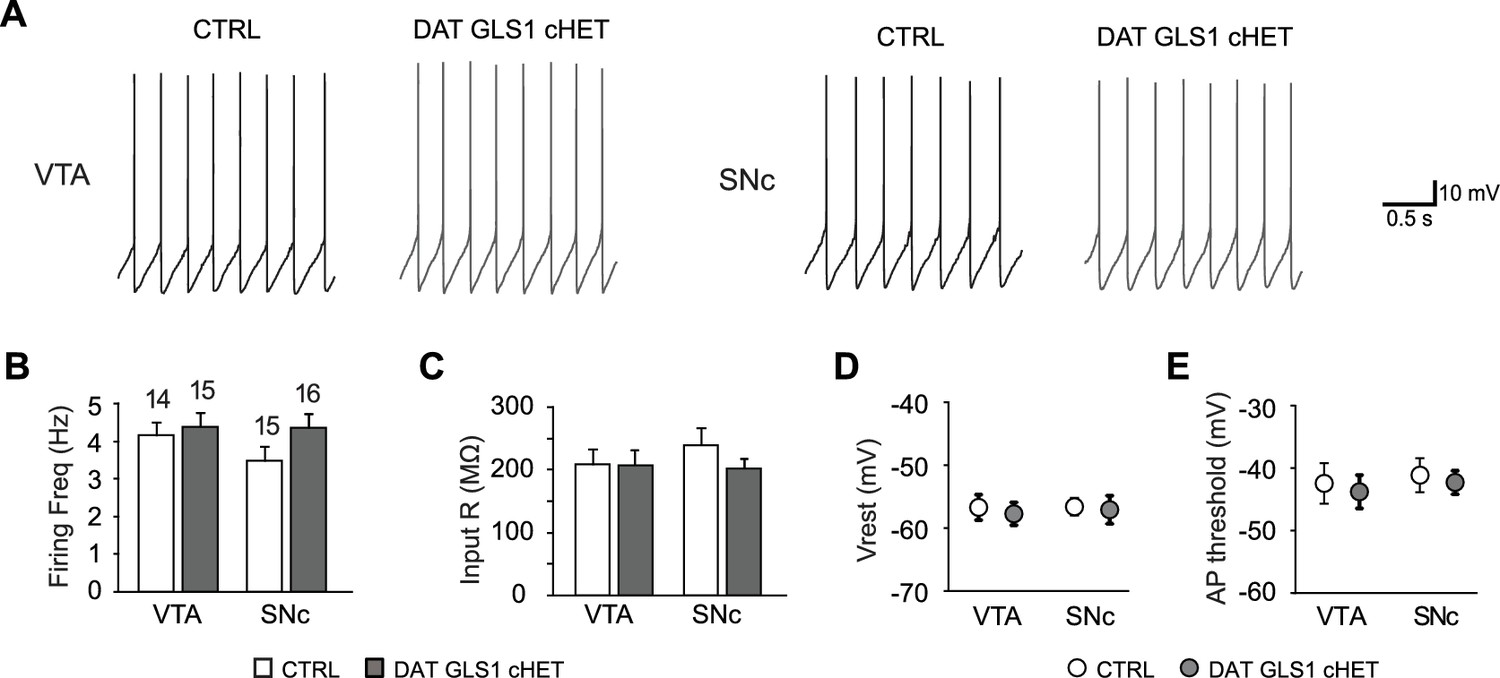
Electrophysiological properties of putative DA neurons in the ventral midbrain.
(A) DA neuron pacemaker firing recorded in the ventral tegmental area (VTA, left) or substantia nigra pars compacta (SNc, right), in CTRL and DAT GLS1 cHET slices. (B) Graph of average firing frequency. Numbers of cells recorded are shown above the bars. (C) Input impedance. (D) Baseline membrane potential (Vrest). (E) Action potential threshold. There was no genotypic difference in either the VTA or SNc for any of these measures by one-way ANOVA (firing frequency, VTA, F(1,27) = 0.238, p=0.630; SNc, F(1,29) = 2.59, p=0.118; input impedance, VTA, F(1,27) = 0.005, p=0.945; SNc, F(1,29) = 1.48, p=0.233; baseline membrane potential, VTA, F(1,27) = 0.658, p=0.424; SNc, F(1,29) = 0.140, p=0.711; action potential threshold, VTA, F(1,27) = 0.480, p=0.494; SNc, F(1,29) = 0.567, p=0.458). These results indicate that basic DA neuron properties are not affected in DAT GLS1 cHET mice, nor was there evidence for cell deterioration. The number of cells is shown in the graphs above the bars or circles. See Figure 4—figure supplement 1—source data 1.xlsx for source data and statistical analysis.
-
Figure 4—figure supplement 1—source data 1
Dopamine neuron membrane properties in CTRL and DAT GLS1 cHET mice.
- https://doi.org/10.7554/eLife.27566.017
Figure 4—figure supplement 2
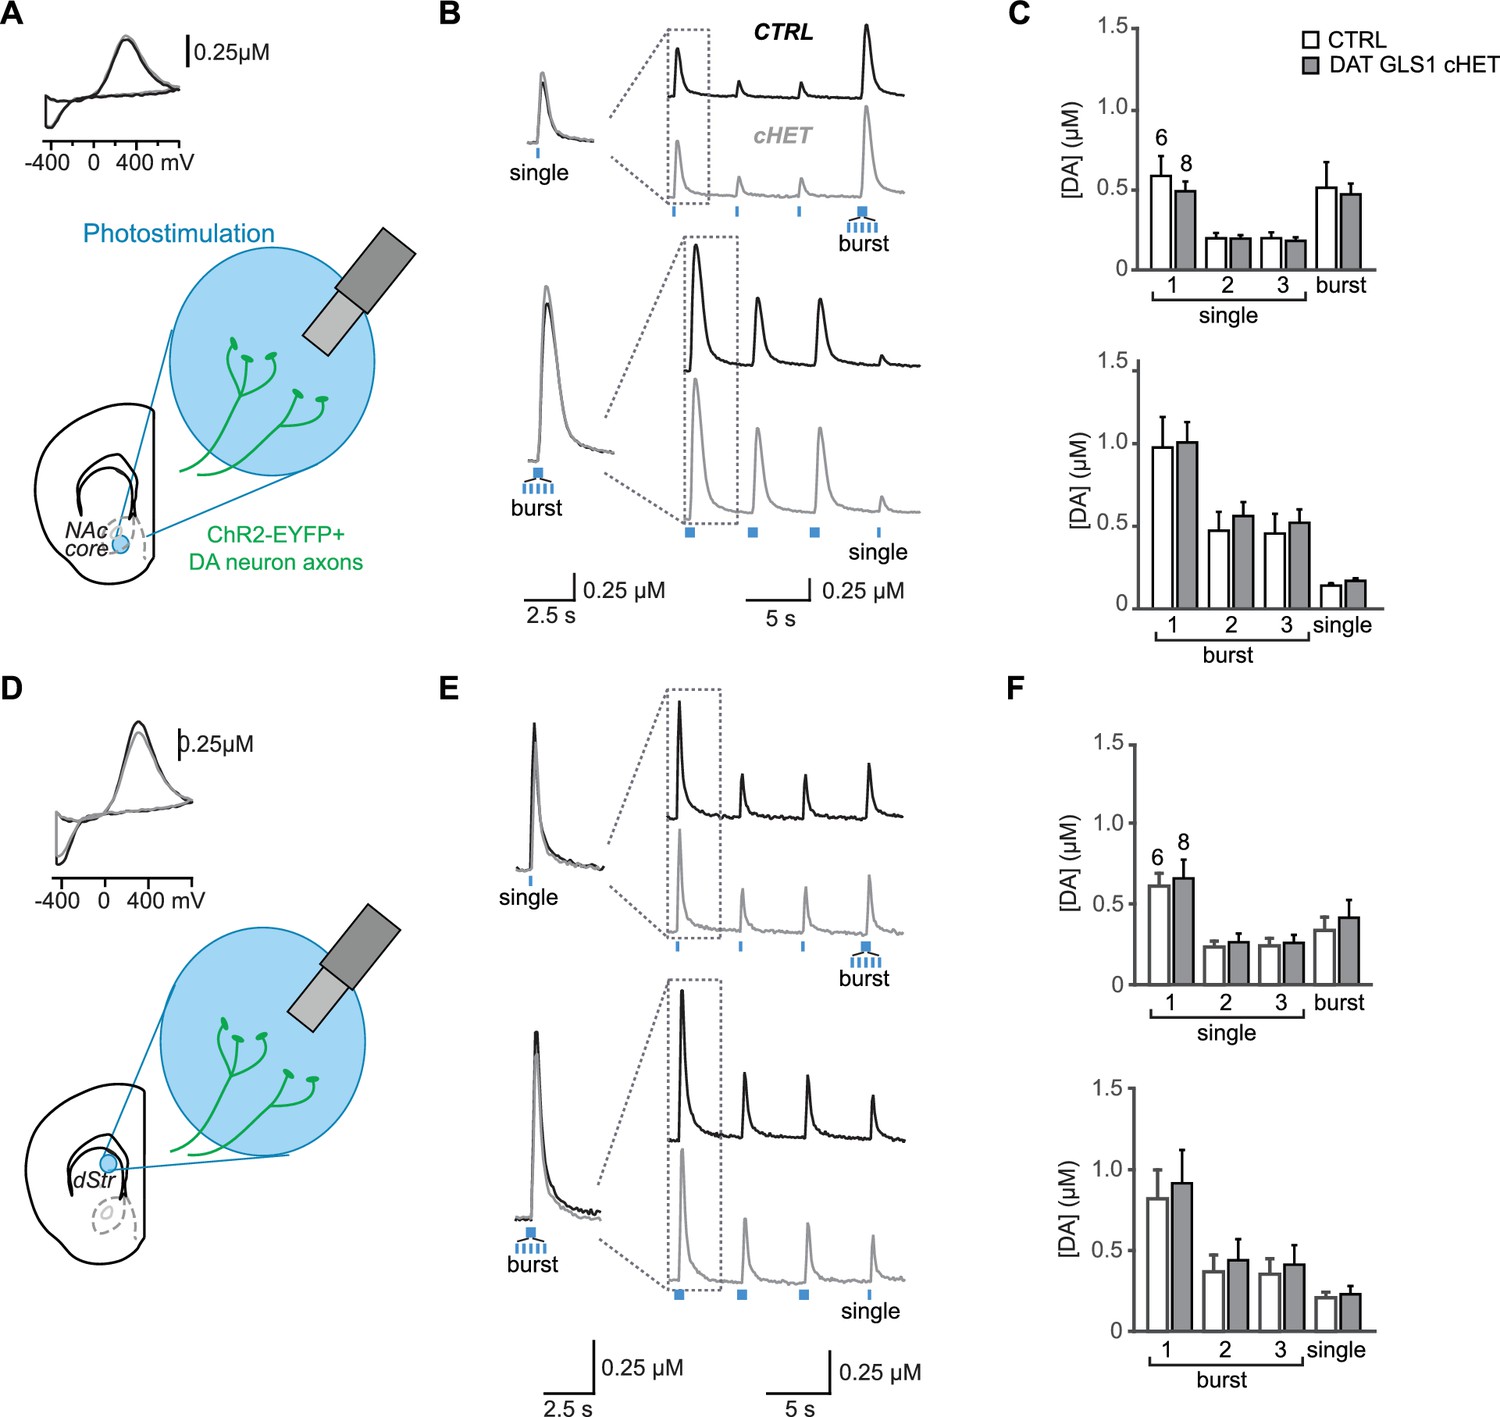
Dopamine release in nucleus accumbens core and dorsal striatum, measured by fast-scan cyclic voltammetry (FSCV), is not affected in DAT GLS1 cHET mice.
(A) Schematic of a coronal slice with recording site in the nucleus accumbens (NAc) core. (B) Representative FSCV traces, organized as in B. (C) Average evoked DA release in the NAc core. Graphs correspond to traces in E. In the upper graph, RM ANOVA showed a significant main effect of pulses (F(3,36) = 22.903, p<0.0001, ES partial η2 = 0.656), but no main effect of genotype (F(1.12) = 0.32, p=0.523) or significant interaction (F(3,36) = 0.418, p=0.741). In the lower graph, RM ANOVA showed a significant main effect of pulses (F(3,36) = 60.79, p<0.0001, ES partial η2 = 0.835), but no main effect of genotype (F(1.12) = 0.249, p=0.627) or significant interaction (F(3,36) = 0.210, p=0.889). (D) Schematic of a coronal slice with recording site in the medial dorsal striatum (dStr). DA release evoked by photostimulation was measured using FSCV. A representative cyclic voltammogram is shown in the upper left. (E) Representative FSCV traces of photostimulated DA release. The first two responses in each trace (dashed box) are enlarged and superimposed on the left. The upper pair of traces shows responses to 3 single photostimulations followed by a burst; the lower pair to 3 burst photostimulations followed by a single. (F) Average evoked DA release in the dStr. Graphs correspond to traces in B. In the upper graph, RM ANOVA showed a significant main effect of photostimulation (F(3,36) = 48.52, p<0.0001, ES partial η2 = 0.802), but no main effect of genotype (F(1,12) = 0.072, p=0.793) or significant interaction (F(3,36) = 0.26, p=854). In the lower graph, RM ANOVA showed a significant main effect of pulses (F(3,36) = 37.257, p<0.0001, ES partial η2 = 0.756), but no main effect of genotype (F(1,12) = 0.084, p=0.777) or significant interaction (F(3,36) = 0.083, p=0.969). The numbers of slices recorded are shown above the first pair of bars in the graphs. See Figure 4—figure supplement 2—source data 2.xlsx for source data and statistical analysis.
-
Figure 4—figure supplement 2—source data 2
Dopamine release measured by FSCV in the NAc Core and dStr in CTRL and DAT GLS1 cHET mice.
- https://doi.org/10.7554/eLife.27566.019
Figure 5
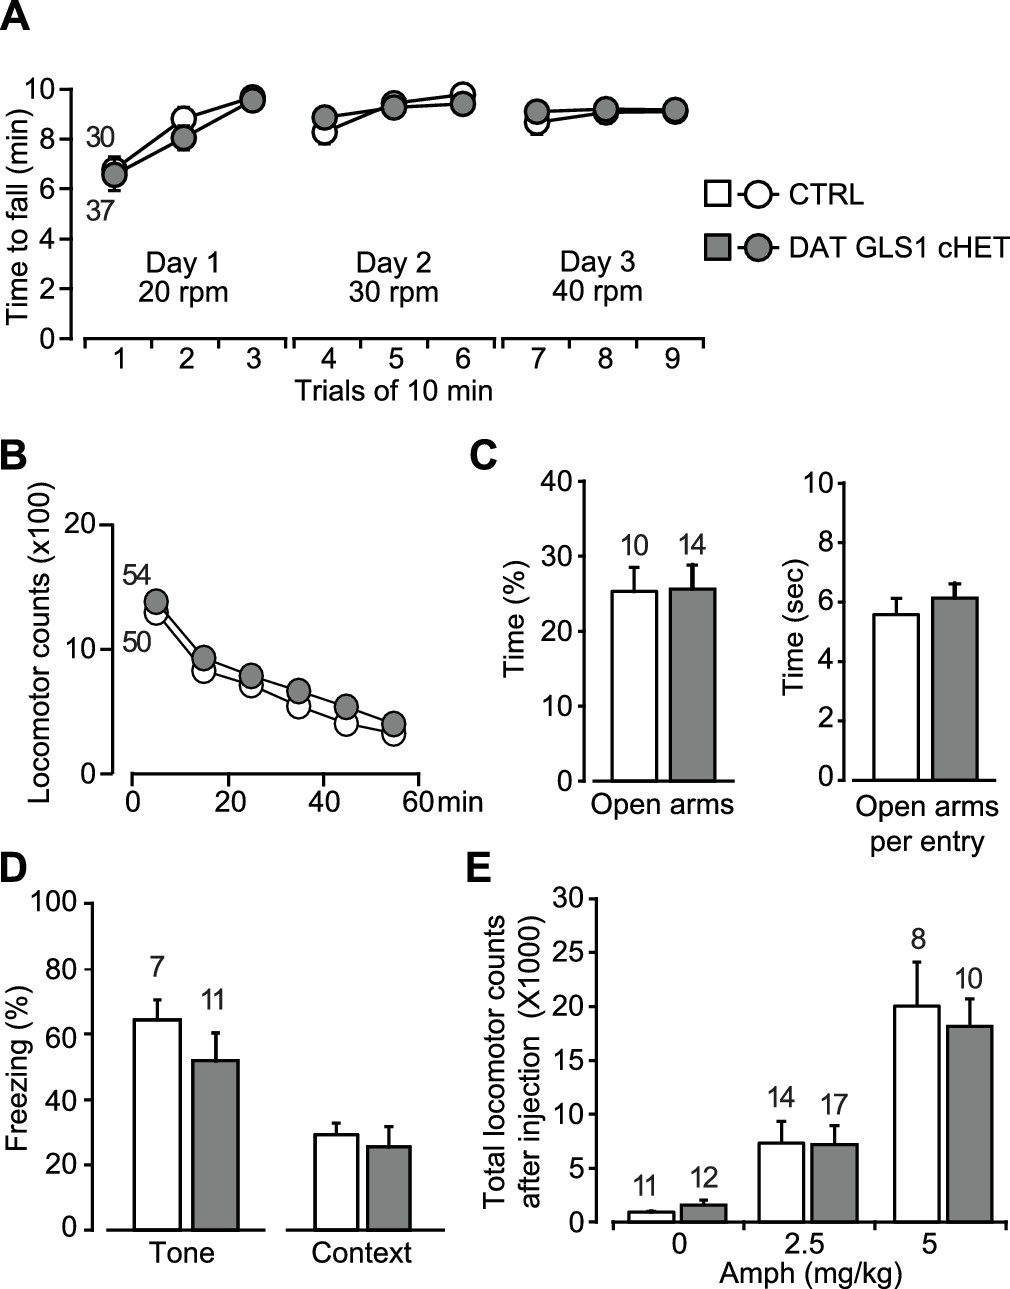
Motor performance, anxiety and amphetamine-induced hyperlocomotion are unaffected in DAT GLS1 cHETs.
(A) Motor performance on an accelerating rotarod over 3 days showed no difference between genotypes (RM ANOVA, significant effect of trials, F(8,520) = 22.9, p<0.0001, ES partial η2 = 0.26); there was no effect of genotype (F(1,65) = 0.018, p=0.894; nor interaction F(8,520) = 0.562, p=0.809). (B) Locomotor activity in the open field for one hour revealed no genotypic difference in novelty-induced locomotion and habituation (RM ANOVA, main effect of time, F(5,510) = 193.0, p<0.0001, ES partial η2 = 0.65); no effect of genotype (F(1,102) = 0.664, p=0.417) nor interaction (F(5,510) = 0.329, p=0.895). (C) Exploration in the elevated-plus maze (5 min) showed no genotypic difference in percentage of time spent in the open arms (left) (one way-ANOVA, F(1,22) = 0.004, p=0.949) or time spent in the open arms per entry (right) (one way-ANOVA, F(1,22) = 0.547, p=0.467). (D) Fear conditioning to tone (left) measured as the average percentage of freezing during the CS (two tone presentations) or to a context previously paired with a shock (right) showed no genotypic differences (one-way ANOVA, tone fear conditioning, F(1,16) = 1.145, p=0.300; context fear conditioning, F(1,16) = 0.207, p=0.655). (E) Amphetamine-induced locomotor activity recorded over 90 min post injection showed no genotypic difference in the dose-dependent responses (two-way ANOVA, main effect of drug treatment, F(2.66) = 34.8, p<0.0001, ES partial η2 = 0.51; no effect of genotype, F(2.66) = 0.068, p=0.795; nor interaction, F(2.66) = 0.18, p=0.836). The number of mice is shown in the graphs above the bars or next to the lines. See Figure 5—source data 1.xlsx for source data and statistical analysis.
-
Figure 5—source data 1
Dopamine neuron dependent behaviors in CTRL and DAT GLS1 cHET mice.
- https://doi.org/10.7554/eLife.27566.021
Figure 6 with 5 supplements
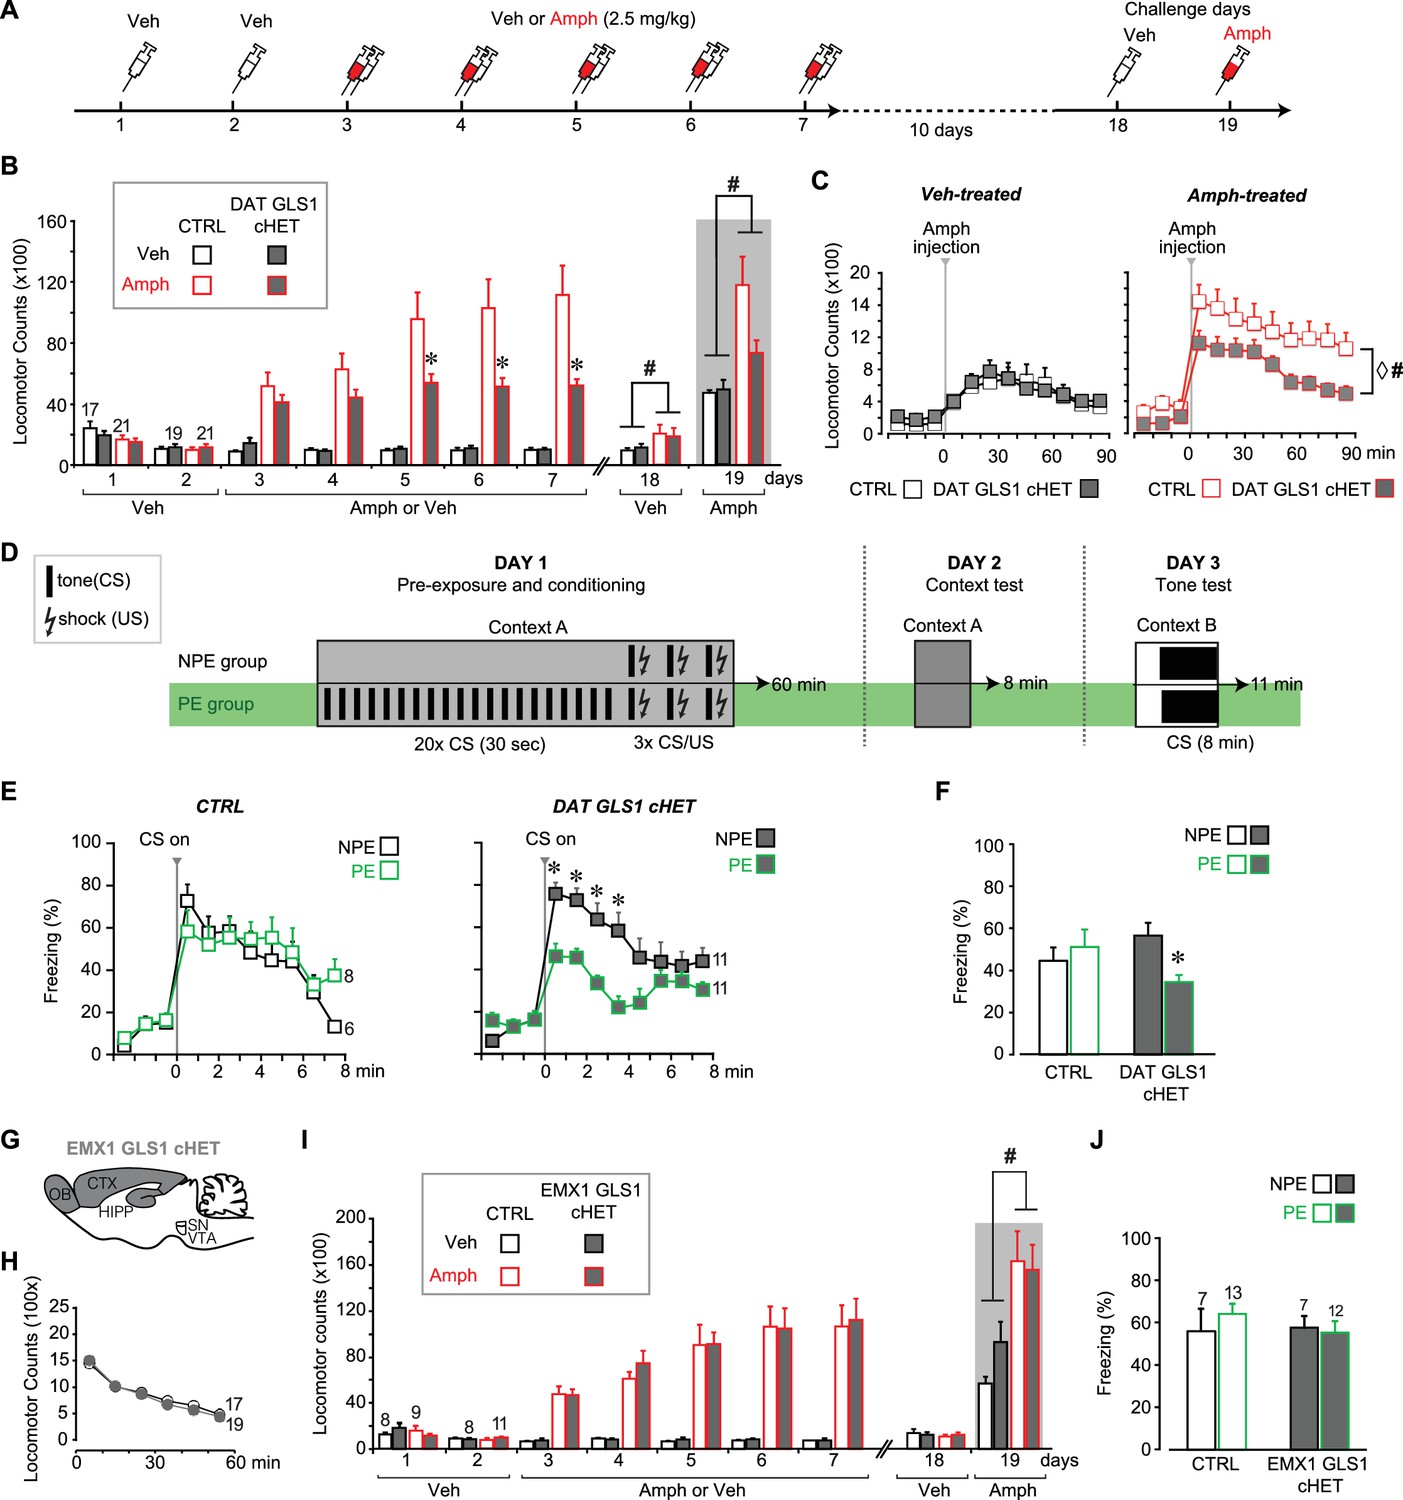
DAT GLS1 cHET mice showed attenuated amphetamine sensitization and potentiated latent inhibition.
(A) Schematic of amphetamine sensitization protocol. (B) Locomotor activity in the open field after vehicle (Veh) or Amphetamine (Amph) injection. There were no between group differences in activity on the habituation days (Days 1 and 2). Over the subsequent 5 treatment days, CTRL mice showed sensitization to Amph while DAT GLS1 cHET mice did not (RM ANOVA, significant genotype X treatment X day interaction, F(4,296) = 4.4, p=0.002, ES partial η2 = 0.06; RM ANOVA within Amph-treated mice, significant genotype X day interaction, F(4,160) = 5.9, p<0.001, ES partial η2 = 0.112). *p<0.016 indicates significantly different from CTRL Amph-treated mice, after Bonferroni correction for 3 comparisons (α = 0.016). On the Veh challenge day (day 18), Amph-treated mice showed a modest increase in locomotion relative to Veh-treated mice independent of genotype. # indicates significant treatment effect (F(1,74)= 4.03, p=0.048; partial η2 = 0.052), but no main effect of genotype (F(1,74)< 0.001, p=1) or significant interaction (F(1,74)= 0.163, p=0.688). On the challenge day (Day 19), Amph-treated mice showed increased locomotion relative to Veh-treated mice independent of genotype. # indicates significant treatment effect (two-way ANOVA: F(1,74) = 13.7, p<0.001, ES partial η2 = 0.112), with no significant genotype effect (F(1,74) = 2.76, p=0.101), but a trend for interaction (F(1,74) = 3.18, p=0.078). (C) On the Amph challenge day Veh-treated (left) and Amph-treated mice (right) received Amph and activity was monitored for 90 min. Veh-treated mice showed no genotypic difference in their response to Amph (RM ANOVA genotype effect, F(1,74) = 0.012, p=0.91; genotype X time interaction, F(1,74) = 0.53, p=0.83). Amph-treated CTRL mice showed a sensitized response to Amph while DAT GLS1 cHET did not. ♢ # indicate a significant genotype difference (RM ANOVA, F(1,40) = 89.3, p=0.034, ES partial η2 = 0.107), and significant effect of time (F(8,320) = 12.8, p<0.0001, ES partial η2 = 0.243), but no significant interaction (F(8,320) = 0.576, p=0.798). stopGLS1 mice, with a global GLS1 HET reduction, show attenuated amphetamine sensitization; see Figure 6—figure supplement 1. ΔGLS1 HET mice, generated by breeding floxGLS1 mice with mice expressing cre under the control of the ubiquitous tamoxifen-inducible ROSA26 promoter (Figure 6—figure supplement 2), also show attenuated amphetamine sensitization (Figure 6—figure supplement 3). (D) Schematic of latent inhibition protocol. (E) On the tone test day (Day 3), the percent time freezing for the 3 min before and 8 min after CS (tone) presentation are shown for CTRL (left) and DAT GLS1 cHET mice (right). CTRL non-preexposure (NPE) and preexposure (PE) groups did not differ, evidencing no LI (RM ANOVA during CS, no preexposure effect, F(2,12) = 0.127, p=0.728; nor preexposure X time interaction, F(7,84) = 1.66, p=0.129). DAT GLS1 cHET NPE and PE groups did not differ before CS presentation (PE effect, F(1,20) = 0.646, p=0.431; interaction, F(2,40) = 2.12, p=0.132); during CS presentation, PE mice showed less freezing than NPE mice, evidencing potentiated LI (RM ANOVA, significant time X PE treatment interaction, F(7,140)= 2.88, p=0.008, ES partial η2 = 0.126). *p<0.006 indicates significant different between PE and NPE groups, after Bonferroni correction for 8 comparisons (α = 0.006). (F) Percent total time freezing during 8 min CS presentation on the tone test (Day 3). DAT GLS1 cHET PE mice, but not CTRL mice, showed less freezing during CS presentation, evidencing potentiated LI (two-way ANOVA, significant genotype X PE treatment interaction, F(1,32)= 5.3, p=0.028, ES partial η2 = 0.334; no significant genotype effect, F(1,32)= 0.145, p=0.71, nor PE effect, F(1,32)= 1.52, p=0.227). Within the NPE group, there was no genotype effect, showing that learning was not affected in DAT GLS1 cHETs (F(1,15)= 1.56, p=0.23). * indicates significant pre-exposure effect within the DAT GLS1 cHET group by ANOVA (F(1,20) = 10.03, p=0.005, ES partial η2 = 0.334). stopGLS1 mice (Gaisler-Salomon et al., 2009b), as well as ΔGLS1 HET mice (Figure 6—figure supplement 3), both with a global GLS1 reduction, show potentiation of LI. (G) Schematic of the EMX1 GLS1 cHET mouse brain (sagittal view) illustrating the GLS1 cHET genotype in forebrain. See Figure 6—figure supplement 4. (H) Novelty-induced locomotion and habituation to the open field did not differ between CTRL (white circles) and EMX1 GLS1 cHET mice (grey circles). RM ANOVA showed a significant time effect (F(5,170) = 138.1, p<0.0001, ES partial η2 = 0.802); no significant genotype effect (F(1,34) = 0.599, p=0.44); and no significant interaction (F(5,170) = 0.820, p=0.537). (I) Both CTRL and EMX1 GLS1 cHET mice showed sensitization to Amph during the 5 treatment days (RM ANOVA: days X drug treatment effect, F(4,128)= 11.33, p<0.0001, ES partial η2 = 0.259; there was no significant day X drug treatment X genotype interaction, F(4,128)= 0.161, p=0.96). On the Veh challenge day, there were no significant differences between genotypes of drug-treatment groups. On the Amph challenge day, Amph-treated mice showed a sensitized response relative to Veh-injected mice, independent of genotype. # indicates a significant main effect of drug treatment (F(1.32) = 16.83, p<0.0001, ES partial η2 = 0.330). (J) EMX1 GLS1 cHET mice did not show potentiation of LI. Percent time freezing during the 8 min CS presentation on the tone test day (Day 3) did not differ between NPE and PE groups, independent of genotype (two-way ANOVA: no significant main effect of genotype, F(1,35)= 0.281, p=0.60; PE, F(1,35)= 0.163, p=0.69; or interaction, F(1,35)= 0.586, p=0.45). EMX1 GLS1 cHET mice, as well as ΔGLS1 HET and DAT GLS1 cHET mice, showed clozapine-induced potentiation of LI (Figure 6—figure supplement 5). In all graphs, the number of mice is shown above the bars or next to the lines. See Figure 6—source data 1.xlsx for source data and statistical analysis.
-
Figure 6—source data 1
Amphetamine sensitization and latent inhibition in DAT GLS1 cHET and EMX1 GLS1 cHET mice.
- https://doi.org/10.7554/eLife.27566.023
Figure 6—figure supplement 1
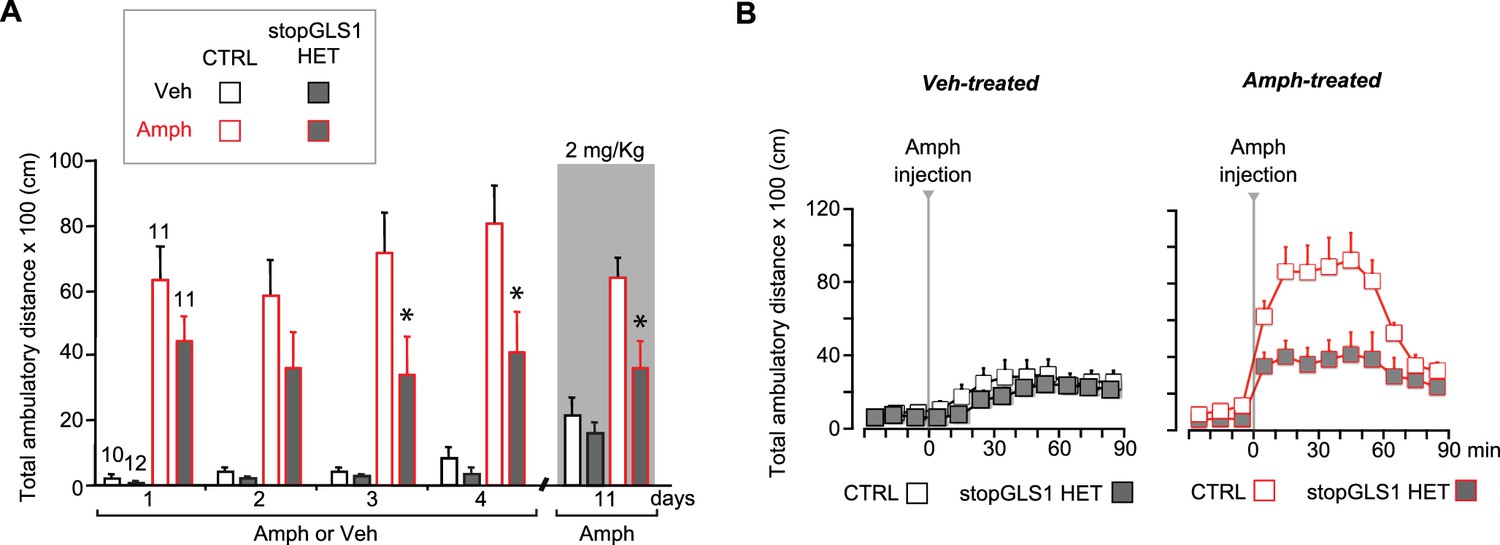
stopGLS1 HET with a global PAG reduction show attenuated amphetamine sensitization.
(A) While potentiation of LI is seen in stopGLS1 mice (Gaisler-Salomon et al., 2009b), amphetamine sensitization had not been tested. To test for amphetamine sensitization in stopGLS1 HET mice, Amph (4 mg/kg) or Veh was administered over 4 consecutive days. Amph-treated CTRL mice showed a sensitized response to Amph while Amph-treated stopGLS1 HET mice did not. A three-way RM ANOVA revealed a significant day X genotype interaction (F(3,120) = 3.4, p=0.021, ES partial η2 = 0.078), a treatment X genotype interaction (F(1,40) = 5.85, p=0.020, ES partial η2 = 0.128), and a trend for a day X treatment X genotype interaction (F(3,120) = 2.6, p=0.058, ES partial η2 = 0.060). Analysis of genotype and treatment effects on each day revealed significant genotype X treatment interactions on Day 3 (F(1,40) = 7.68, p=0.008, ES partial η2 = 0.161) and Day 4 (F(1,40) = 7.00, p=0.012, ES partial η2 = 0.149), but not on Days 1 or 2. Analysis of simple effects on Days 3 and 4 revealed a genotype effect within the Amph-treated groups indicated by * (Day 3, F(1,20) = 8.29, p=0.009, ES partial η2 = 0.313; Day 4, F(1,20) = 9.13, p=0.007, ES partial η2 = 0.616). One week later (Day 11), all mice received a lower challenge dose of Amph (2 mg/kg; gray shading). Amph-treated CTRL mice showed a significantly increased response to Amph compared to Veh-treated CTRL mice, revealing sensitization. In contrast, Amph-treated stopGLS1 HET mice showed a slightly increased response to Amph compared to Veh-treated stopGLS1 HET mice, showing reduced expression of sensitization. A two-way ANOVA revealed a significant treatment X genotype interaction (F(1,40) = 4.5, p=0.039, ES partial η2 = 0.103). Analyses within each genotype, showed a significant effect of drug treatment for CTRL mice (F(1,19) = 24.8, p<0.001, ES partial η2 = 0.566), and a trend for treatment in stopGLS1 HET mice (F(1,21) = 4.1, p=0.055, ES partial η2 = 0.164). * indicates significantly different from Amph-treated CTRL mice, analyses of simple main effects. (B) Time course of Amph-induced locomotion for CTRL and stopGLS1 HET mice on the challenge day (Day 11). There were no genotypic differences in baseline activity, prior to Amph injection. After Amph injection, Veh-treated mice — receiving Amph for the first time — showed a modest locomotor response that did not differ genotypically (left graph). Amph-treated mice showed a robust locomotor response to Amph, greater in CTRL than stopGLS1 HET mice (right graph). These differences were supported by a RM ANOVA within each treatment, showing no time X genotype interaction for Veh-treated mice (F(8,160) = 0.782, p=0.619), but a significant time X genotype interaction for Amph-treated mice (F(8,160) = 3.9, p<0.0001, ES partial η2 = 0.165). Taken together, these results indicate that stopGLS1 HET mice show attenuated amphetamine sensitization. Numbers of mice are shown above the bars. Abbreviations: Amph - amphetamine; Veh - vehicle. See Figure 6—figure supplement 1—source data 1.xlsx for source data and statistical analysis.
-
Figure 6—figure supplement 1—source data 1
Amphetamine sensitization in stopGLS1 HET mice .
- https://doi.org/10.7554/eLife.27566.025
Figure 6—figure supplement 2
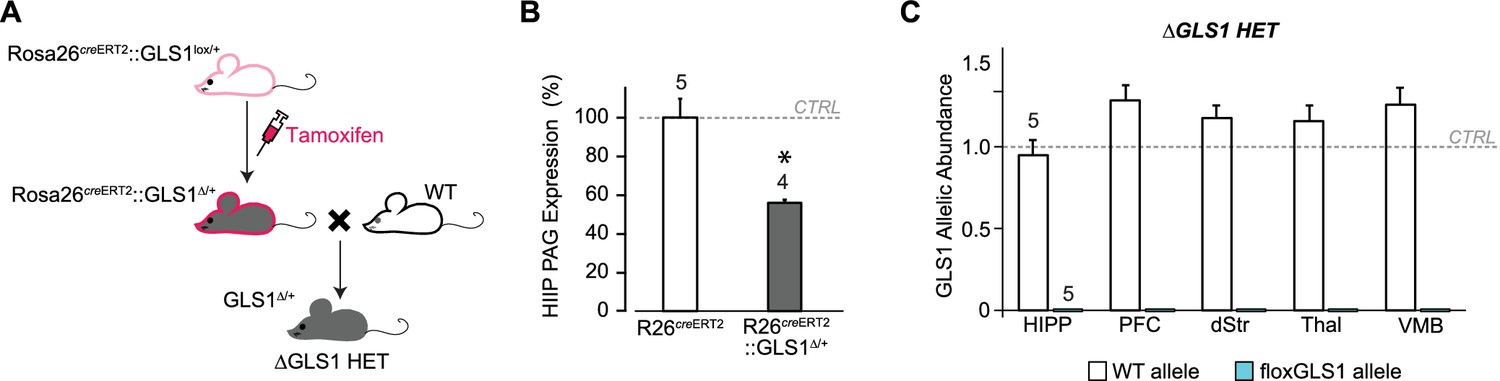
Breeding ΔGLS1 HET mice (with a global GLS1 reduction) from floxGLS1 mice.
(A) Inducible Rosa26creERT2: : GLS1lox/+ mice (pink outline) were used to produce a global heterozygous GLS1 inactivation in adulthood by tamoxifen-induced recombination of the floxGLS1 allele. These Rosa26creERT2: : GLS1Δ/+ mice (gray with pink outline) were bred with wild-type (WT) C57BL6 mice (white) to generate ΔGLS1 HET mice (gray). (B) Expression of PAG in the hippocampus (HIPP) of Rosa26creERT2: : GLS1Δ/+ mice after tamoxifen revealed that the protein was reduced to 55.5% of control levels measured in Rosa26creERT2 mice. These mice were bred with WT mice to generate ΔGLS1 HET mice. * indicates significant difference from CTRL (Rosa26creERT2) (ANOVA, F(1,7) = 20.15, p=0.003, ES partial η2 = 0.742). (C) GLS1 allelic abundance for WT and floxGLS1 alleles in ΔGLS1 HET mice showed one WT allele and the absence of the floxGLS1 allele (blue bars) in the hippocampus (HIPP), prefrontal cortex (PFC), dorsal striatum (dStr), thalamus (Thal) and ventral midbrain (VMB), further validating the global heterozygous GLS1 deletion. Allelic abundance data were normalized to CTRL values in GLS1 lox/+ (gray line). See Figure 6—figure supplement 2—source data 2.xlsx for source data and statistical analysis.
-
Figure 6—figure supplement 2—source data 2
PAG protein determinations in Rosa26ERT2cre GLS1 mice.
- https://doi.org/10.7554/eLife.27566.027
Figure 6—figure supplement 3
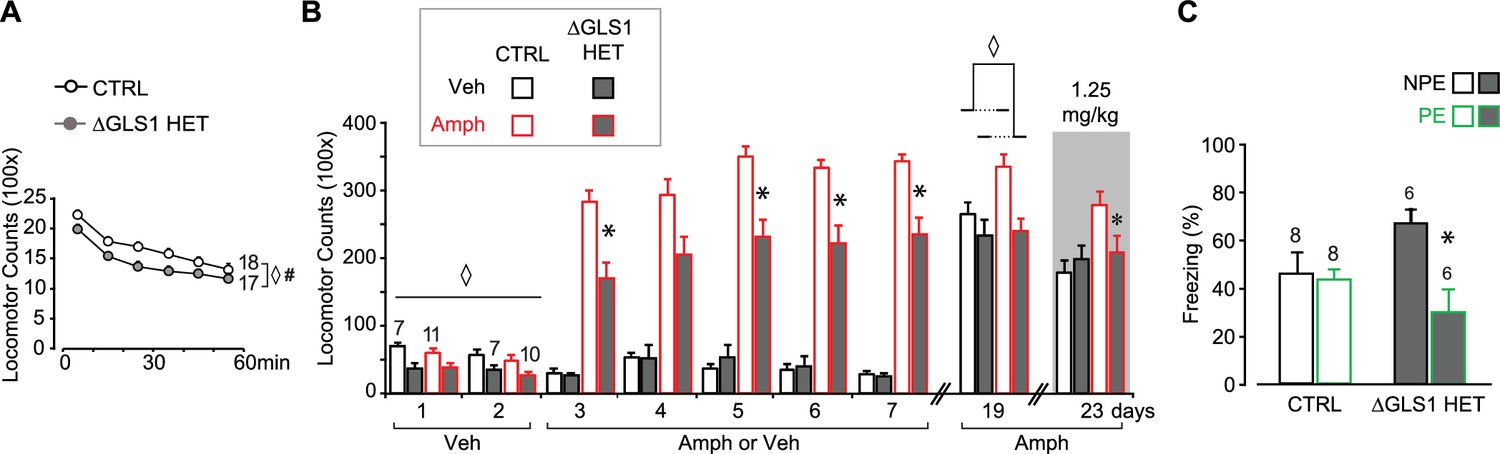
ΔGLS1 HET mice show reduced novelty-induced locomotion, attenuated amphetamine sensitization and potentiated latent inhibition.
(A) Novelty-induced locomotion, but not habituation, was reduced in ΔGLS1 HET mice. ◊ indicates a significant main effect of genotype (RM ANOVA: F(1,33) = 5.98, p<0.020, ES partial η2 = 0.153). # indicates a significant main effect of time (F(5,165) = 91.92, p<0.001, ES partial η2 = 0.736); there was no significant interaction (F(5,165) = 0.942, p=0.455). (B) ΔGLS1 HET mice were tested for amphetamine sensitization following a similar protocol and drug dose to that used for DAT GLS1 cHET mice (Figure 6A). After Veh injections (Days 1 and 2), ΔGLS1 HET mice were overall less active that CTRL mice. This was supported by a 2 (genotype) x 2 (treatment) x 2 (days) ANOVA that showed a significant main effect of genotype (F(1,31) = 17.03, p<0.001, ES partial η2 = 0.355) indicated by ◊, but no other significant main effects or interactions. During the 5 consecutive treatment days, Amph-treated ΔGLS1 HET mice showed both a blunted response to acute amphetamine and no sensitization. This is reflected in the 2 (genotype) x 2 (treatment) x 5 (days) ANOVA by the absence of a significant genotype X drug treatment X days interaction (F(4,124) = 0.733, p=0.585), but a significant genotype X drug treatment interaction (F(1,31) = 13.2, p=0.001, ES partial η2 = 0.299). Analysis of genotype and treatment effects on each day revealed significant genotype X treatment interactions on all days except Day 4 (Day 3, F(1,31) = 10.14, p=0.03; Day 4, F(1,31) = 3.73, p=0.063; Day 5, F(1,31) = 15.00, p=0.001; Day 6, F(1,31) = 11.64, p=0.002; Day 7, F(1,31) = 10.56, p=0.003). Analysis of simple effects on Days 3, 5, 6 and 7 revealed a genotype effect within the Amph-treated groups indicated by * (Day 3, F(1,19) = 18.21, p<0.001; Day 5, F(1,19) = 21.57, p<0.001; Day 6, F(1,19) = 18.97, p<0.001; Day 7, F(1,19) = 17.82, p<0.001; ES partial η2 > 0.400 for all). After a withdrawal period, on Day 19, all mice received Amph (2.5 mg/kg). Amph-treated CTRL mice showed a sensitized locomotor response compared to ΔGLS1 HET mice, yet due to a ceiling effect the responses of Amph-treated and Veh-treated CTRL mice did not differ. ◊ indicates significant main effect of genotype (two-way ANOVA: F(1,31) = 10.6, p=0.003, ES partial η2 = 0.254). There was no significant drug treatment effect (F(1,31) = 3.64, p=0.066) or interaction (F(1,31) = 2.56, p=0.120). Four days later (Day 23), mice received a low-dose Amph challenge (1.25 mg/kg). Amph-treated CTRL mice showed a sensitized response compared to Veh-treated mice and Amph-treated ΔGLS1 HET mice (two-way ANOVA: significant genotype X drug treatment interaction, F(1,31) = 4.22, p=0.048, ES partial η2 = 0.120). * indicates significant genotype effect for Amph-treated mice (ANOVA, F(1,31) = 5.20, p=0.034, ES partial η2 = 0.215). (C) ΔGLS1 HET mice were tested for potentiation of LI, following the same protocol as used for the DAT GLS1 cHETs (Figure 6D). The graph shows percent time during the 8 min CS presentation on the test day (Day 3). There was no difference between NPE and PE CTRL groups. ΔGLS1 HET PE mice froze less during the CS exposure revealing a potentiated LI response (two-way ANOVA: significant genotype X PE interaction, F(1,24) = 5.40, p=0.029, ES partial η2 = 0.183). * indicates a significant PE effect for ΔGLS1 HETs (ANOVA: F(1,10) = 11.2, p=0.007, ES partial η2 = 0.530). Numbers of mice are shown either next to the lines or above the bars. Abbreviations: Amph - amphetamine; Veh - vehicle; PE - preexposed group; NPE - non-preexposed group. See Figure 6—figure supplement 3—source data 3.xlsx for source data and statistical analysis.
-
Figure 6—figure supplement 3—source data 3
Novelty-induced locomotion and amphetamine sensitization in ΔGLS1 HET mice.
- https://doi.org/10.7554/eLife.27566.029
Figure 6—figure supplement 4

Conditional forebrain PAG reduction in EMX1 GLS1 cHET mice.
(A) Validation of the forebrain-specific GLS1 deletion in EMX1 GLS1 cKO mice using PAG immunoreactivity. P18 mice were used, as EMX1 GLS1 cKO mice die by P21. PAG immunoreactivity in EMX1 GLS1 cKO mice was absent in HIPP and PFC, but not Thal. (B) GLS1 allelic abundance for WT and floxGLS1 alleles in EMX1 GLS1 cHET mice showed that the floxGLS1 allele was reduced to 38% in the HIPP and 44% in the PFC, but not affected in the dStr and Thal, further validating the regional specificity of the EMX1cre-induced heterozygous GLS1 reduction. Allelic abundance data were normalized to CTRL values in GLS1 lox/+ (gray line). (C) PAG protein expression in the hippocampus of EMX1 GLS1 cHET mice. PAG protein was reduced to 52% of CTRL. * indicates significant difference from CTRL (EMX1cre) (one-way ANOVA, F(1,19) = 51.38, p<0.0001, ES partial η2 = 0.730). The number of mice is shown above the bars. See Figure 6—figure supplement 4—source data 4.xlsx for source data and statistical analysis.
-
Figure 6—figure supplement 4—source data 4
PAG protein determinations in EMX1 GLS1 cHET mice.
- https://doi.org/10.7554/eLife.27566.031
Figure 6—figure supplement 5

Clozapine-induced potentiation of latent inhibition in EMX1 GLS1 cHET, ΔGLS1 HET and DAT GLS1 cHET mice.
(A) Schematic of the LI protocol to test the effect of clozapine using the same protocol used for the DAT GLS1 cHETs (Figure 6D). Both NPE and PE groups received a single injection of clozapine (1.5 mg/kg) on Day 1, 30 min before being put in the conditioning boxes. (B) EMX1 GLS1 cHET mice were tested for potentiation of LI following pretreatment with clozapine. Graph shows percent freezing on the tone test (Day 3) during the 8 min CS presentation. Clozapine decreased freezing in CTRL and EMX1 GLS1 cHET PE groups, revealing potentiation of LI. # indicates a significant main PE effect (two-way ANOVA, F(1,23) = 13.13, p=0.001, ES partial η2 = 0.363); there was no significant main effect of genotype (F(1,23) = 0.452, p=0.508) or interaction (F(1,23) = 0.002, p=0.967). The percent time freezing of clozapine-treated NPE groups was similar to the freezing reported for vehicle-treated NPE groups (dashed grey line) indicating that clozapine did not affect aversive associative learning. (C) ΔGLS1 HET (left) and DAT GLS1 cHET (right) mice were tested for potentiation of LI following pretreatment with clozapine. Clozapine pretreatment selectively decreased freezing in the PE groups, revealing potentiation of LI, independent of genotype. # indicates a significant main PE effect (two-way ANOVA: for ΔGLS1 HETs, F(1,23) = 6.74, p=0.016, ES partial η2 = 0.227; DAT GLS1 cHETs, F(1,24) = 6.06, p=0.021, partial η2 = 0.202); there was no significant main effect of genotype (ΔGLS1 HETs, F(1,23) = 0.120, p=0.732; DAT GLS1 cHETs, F(1,24) = 0.069, p=0.794) or interaction (ΔGLS1 HETs, F(1,23) = 0.051, p=0.824; DAT GLS1 cHETs, F(1,24) = 1.978; p=0.172). The percent time freezing of clozapine-treated NPE groups was similar to the freezing reported for Veh-treated NPE groups (dashed gray line) indicating that clozapine did not affect aversive associative learning. The number of mice is shown above the bars. See Figure 6—figure supplement 5—source data 5.xlsx for source data and statistical analysis.
-
Figure 6—figure supplement 5—source data 5
Clozapine-induced potentiation of latent inhibition.
- https://doi.org/10.7554/eLife.27566.033
Tables
Table 1
Behaviors affected in DAT GLS1 cHET mice.
| Psychological domain | Behavioral test | Result |
|---|---|---|
| Motor skills and exploration | Rotarod | − |
| Novelty-induced locomotion | − | |
| Anxiety | Open field – center time | − |
| Elevated plus maze | − | |
| Associative learning | Fear conditioning | − |
| Psychostimulant response | Acute Amph-induced hyperlocomotion | − |
| Amph sensitization | Reduced | |
| Attention | Latent inhibition | Potentiated |
Download links
A two-part list of links to download the article, or parts of the article, in various formats.
Downloads (link to download the article as PDF)
Open citations (links to open the citations from this article in various online reference manager services)
Cite this article (links to download the citations from this article in formats compatible with various reference manager tools)
Dopamine neuron dependent behaviors mediated by glutamate cotransmission
eLife 6:e27566.
https://doi.org/10.7554/eLife.27566


