Structural mechanism of ATP-independent transcription initiation by RNA polymerase I
- Northwestern University, United States
- Georgia State University, United States
- Howard Hughes Medical Institute, University of California, United States
- SUNY Upstate Medical University, United States
Figures
Figure 1 with 4 supplements
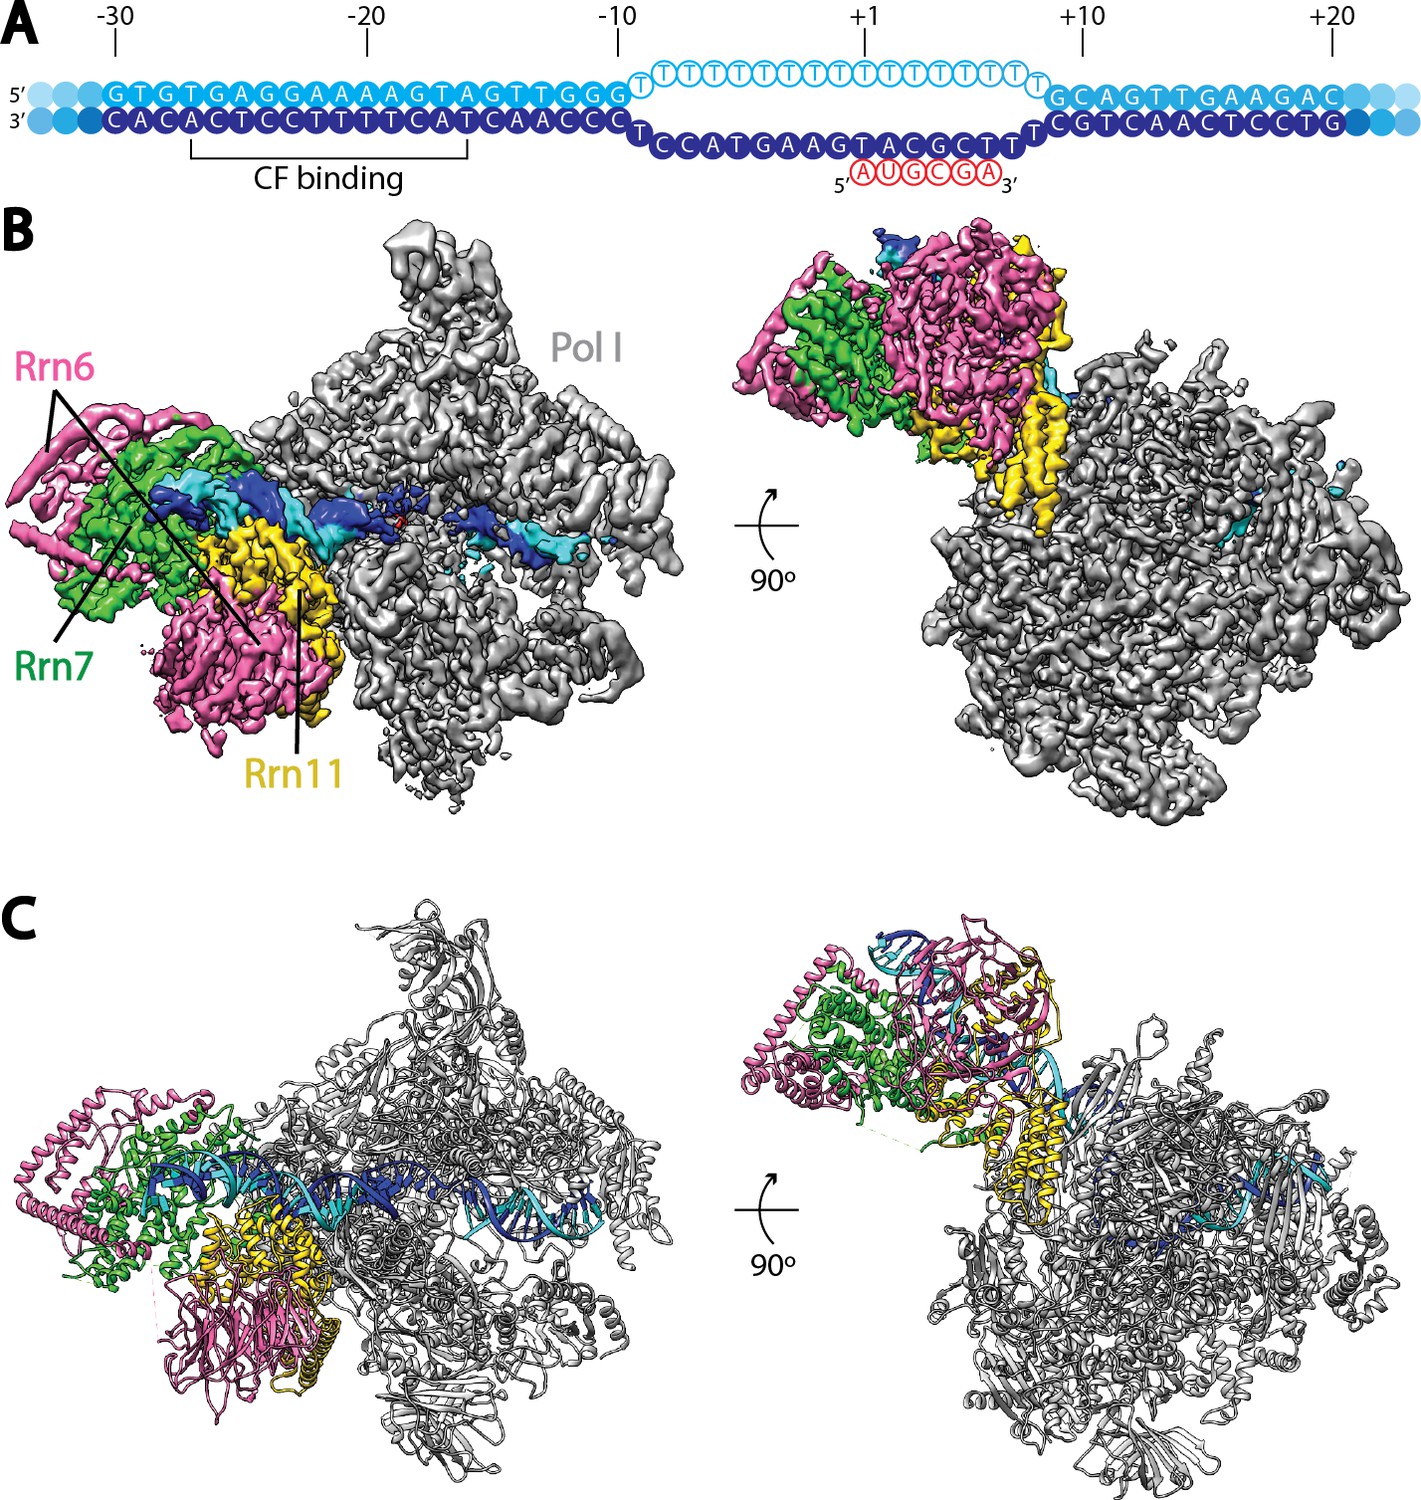
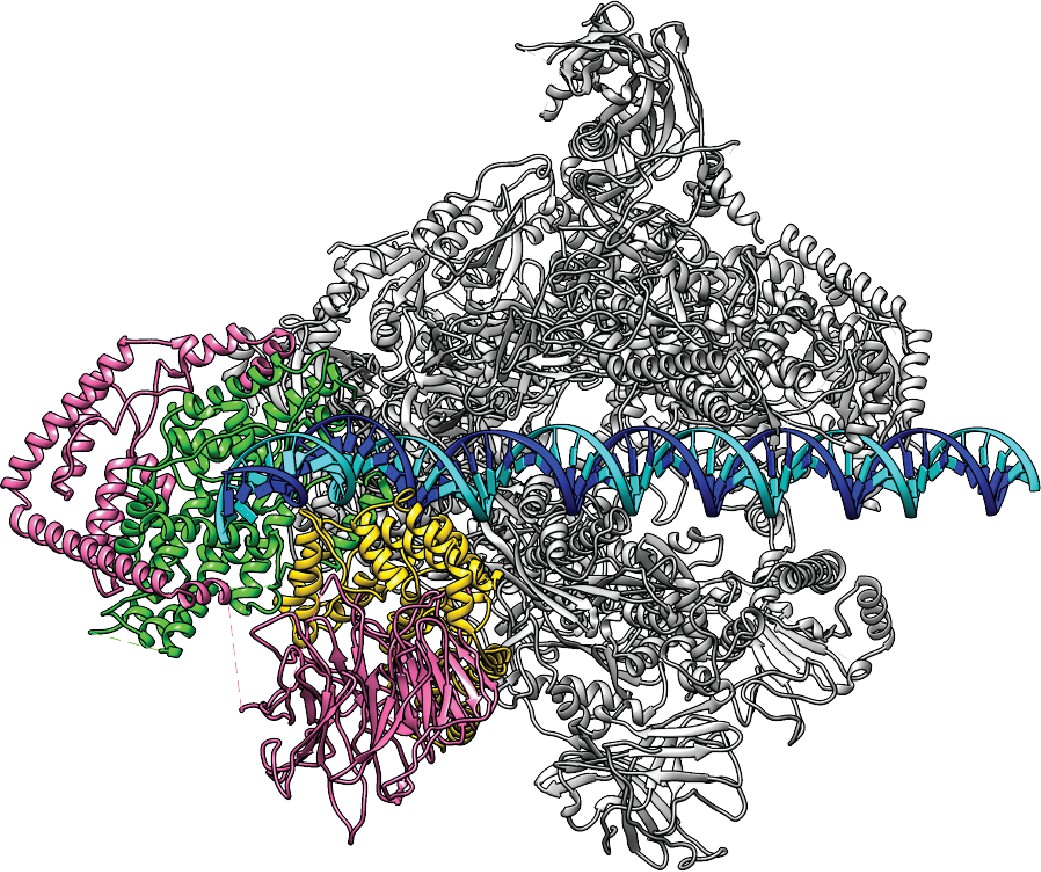
Cryo-EM structure of Pol I Initial Transcribing Complex.
(A) Nucleic acid scaffold used. The non-template and template strands are depicted in cyan and blue, respectively. Filled circles represent rDNA promoter sequence, while open circles show the poly-T mismatch sequences. RNA is shown in red. Core Factor binding region is also labeled. (B) Cryo-EM reconstruction of Pol I Initial Transcribing Complex following focused refinements on Core Factor and Pol I separately (Materials and methods). Pol I is colored gray, and nucleic acid template is colored as shown in A. The Core Factor subunits are depicted in pink (Rrn6), green (Rrn7) and gold (Rrn11). Two views, front (left) and bottom (right), are shown. (C) MDFF (molecular dynamics flexible fitting) model of the Pol I Initial Transcribing Complex. Components are colored the same as in B.
Figure 1—figure supplement 1
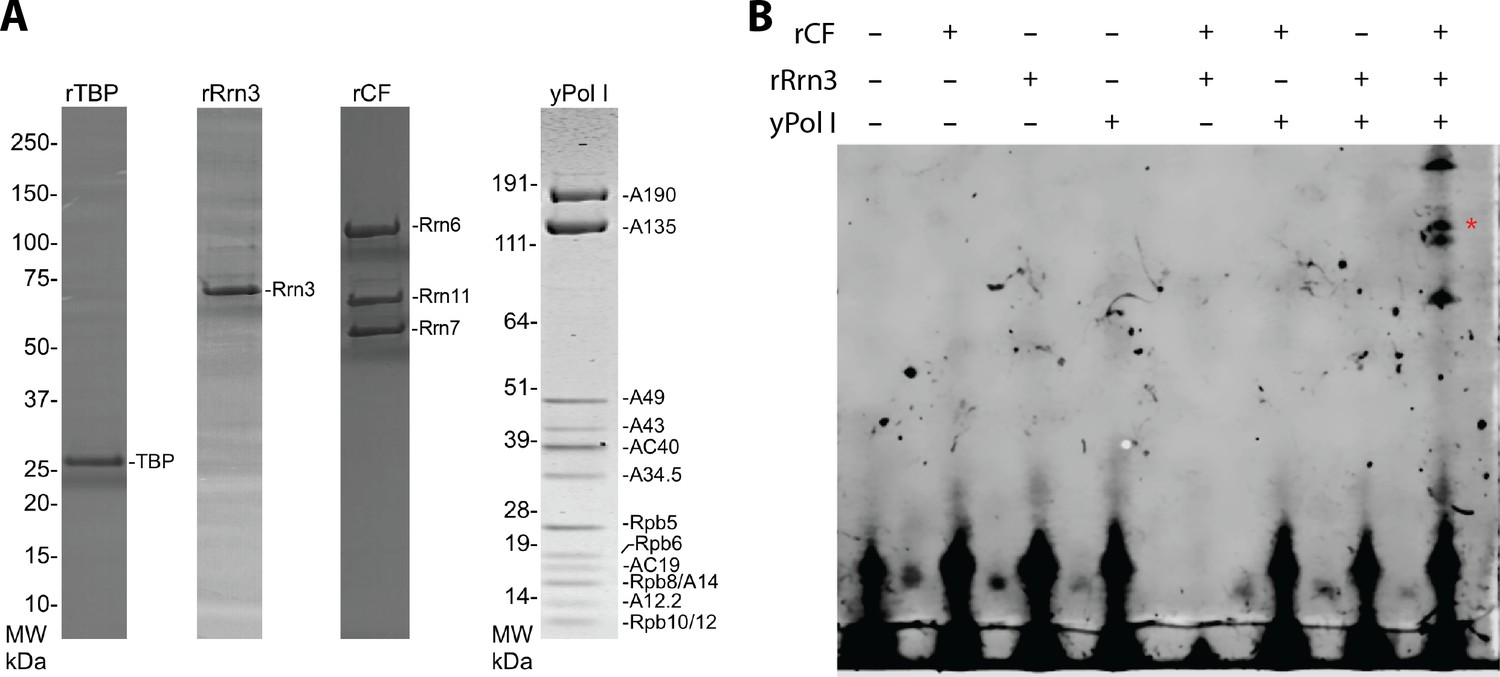
Yeast Pol I factors and in vitro transcription assay.
(A) Coomassie blue stained SDS-PAGE gel of purified yeast Pol I factors. (B) Purified yeast Pol I factors are functional in promoter dependent transcription. The RNA product was visualized by primer extension. A red asterisk denotes primer extension product specific to the Pol I promoter.
Figure 1—figure supplement 2
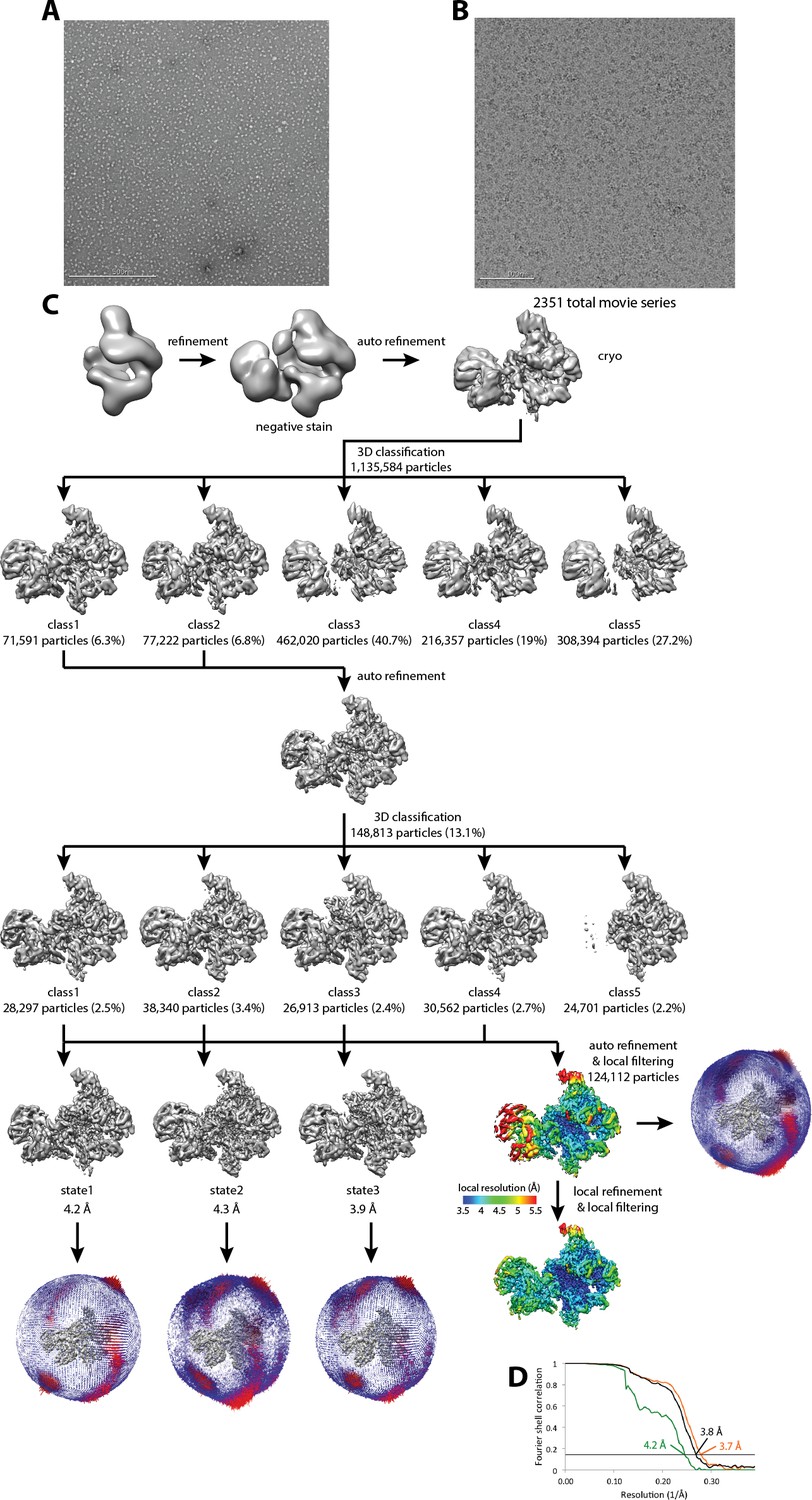
Cryo-EM of Pol I Initial Transcribing Complex.
(A) Representative negative stained raw micrograph. (B) Representative cryo-EM raw micrograph. (C) Refinement strategy (Materials and methods). A total of two rounds of 3D classification were performed, revealing three functional states of the Pol I Initial Transcribing Complex. The local resolution estimation shows flexibility for Core Factor and the Pol I stalk. Focused refinement on both Pol I and Core Factor improved alignment accuracy and improved the resolution for both regions. Euler angle distribution is also shown next to each reconstruction. (D) FSC curves and estimated resolution using the 0.143 criteria following the gold-standard procedure implemented in RELION for the full Initial Transcribing Complex (black), Pol I (orange) and Core Factor (green).
Figure 1—figure supplement 3
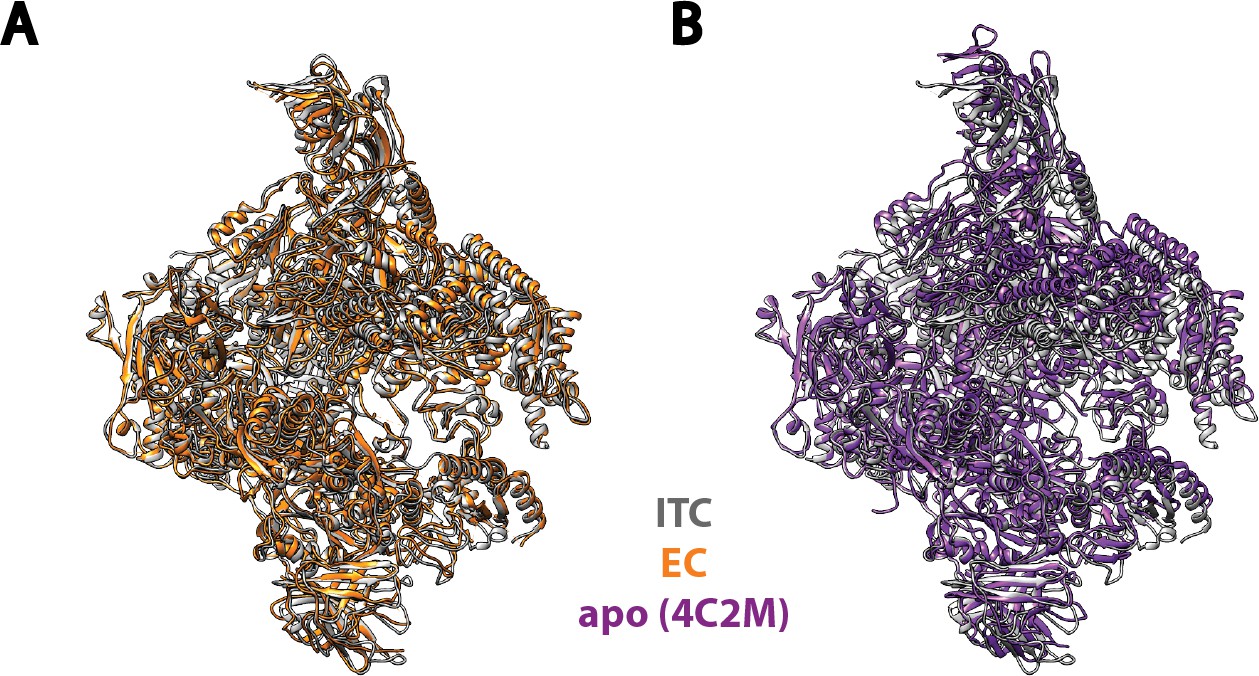
Comparison of Pol I in our Initial Transcribing Complex reconstruction with previous published models.
Pol I model from our Initial Transcribing Complex reconstruction is compared with Pol I in Elongation Complex (Neyer et al., 2016; Tafur et al., 2016) (A) and the apo crystal structure in the absence of nucleic acid (Engel et al., 2013; Fernández-Tornero et al., 2013) (B). Pol I in these models were aligned against the Core module, excluding the mobile Shelf, Jaw-lobe modules and the stalk (Cramer et al., 2001; Engel et al., 2013; Fernández-Tornero et al., 2013). Models used are 5M5X (A) and 4C2M (B). Pol I in the Initial Transcribing Complex resembles Pol I in Elongation Complex more so than the apo crystal structure in the absence of DNA.
Figure 1—figure supplement 4
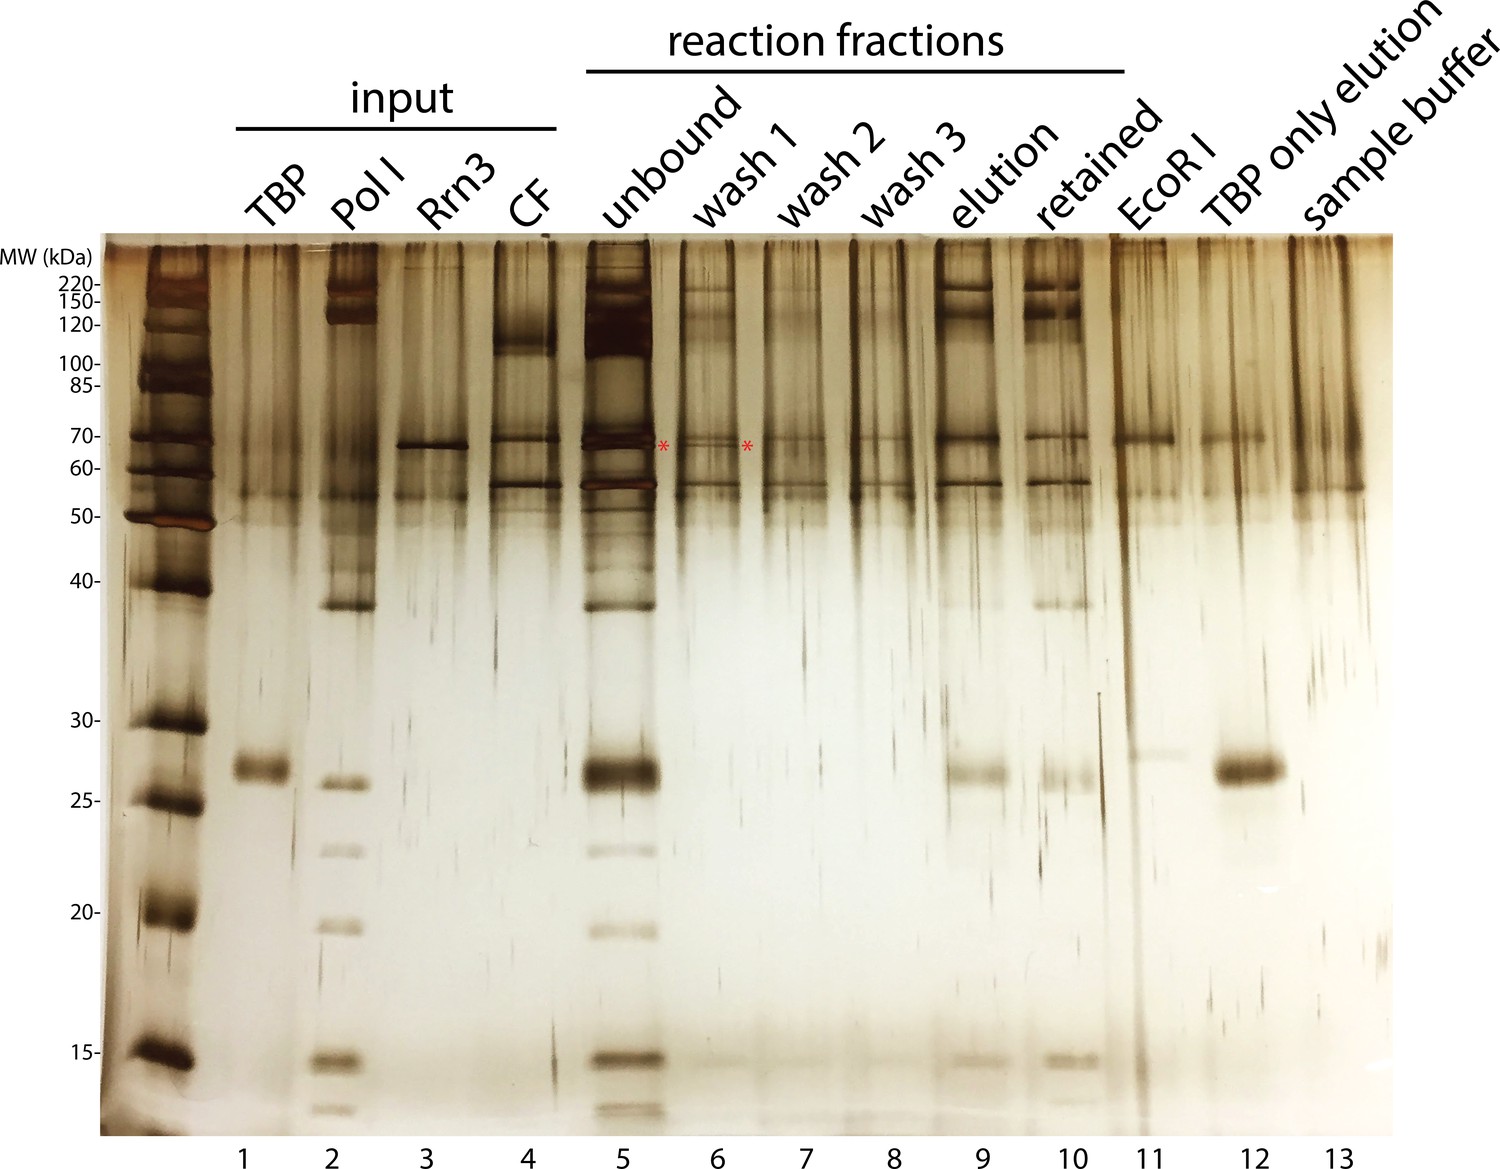
Rrn3 does not stably associate with the rest of the complex.
Complex assembly reaction was monitored on an SDS-PAGE gel and visualized by silver staining. Rrn3 was only present in the unbound and the first wash fractions (lanes 5 and 6; Rrn3 was labeled by a red asterisk). ‘Elution’ fraction in lane 9 is the assembled complex that was used in our EM analysis, whereas ‘retained’ fraction in lane 10 indicates everything that remained bound to the magnetic beads after elution, either due to inefficient digestion by the restriction enzyme or aggregation. ‘EcoRI’ fraction in lane 11 denotes the digestion buffer containing 5 unit/µl EcoRI. We also performed a control reaction in which TBP was the only protein included, and the elution from this control reaction was loaded in lane 12. Although we did not observe TBP density in our EM reconstructions, we observed a band on the gel corresponding to TBP (lane 9). This could be due to the association of TBP by itself to the DNA template (lane 12). In lane 13, the SDS sample buffer used for preparing samples for the gel was also loaded.
Figure 2 with 2 supplements
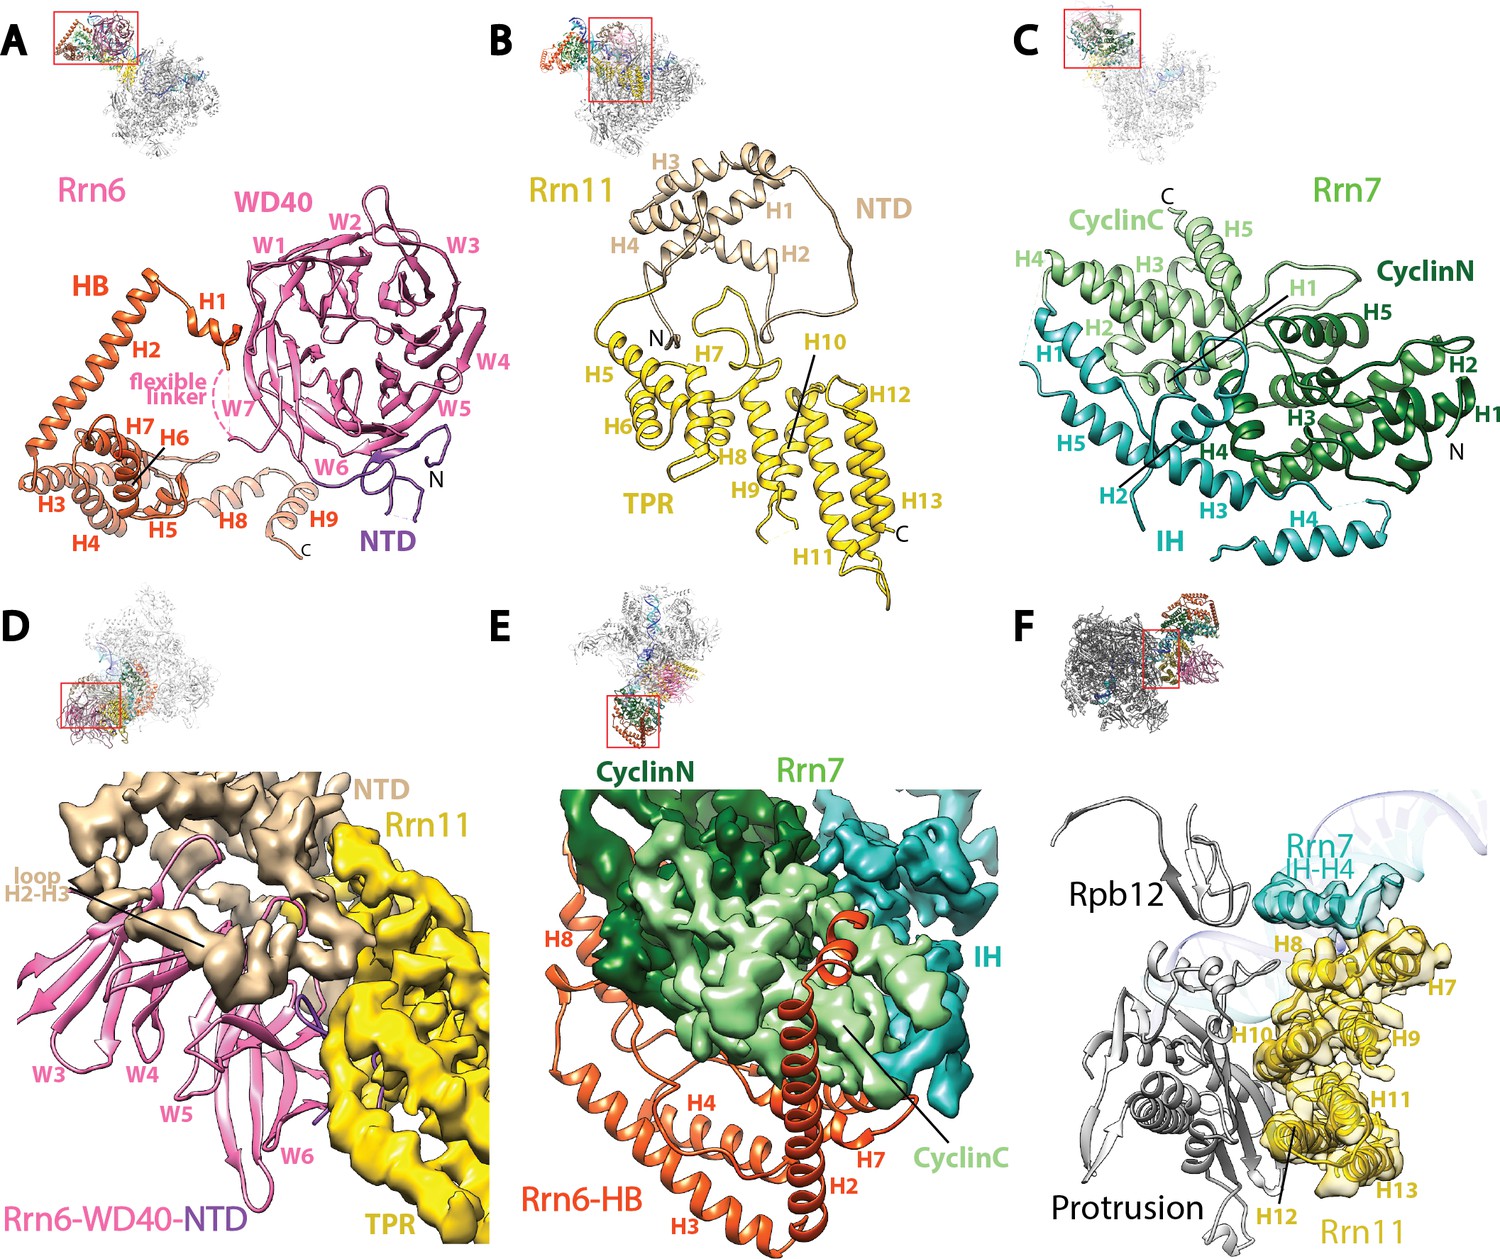
Core Factor architecture and Pol I interaction.
(A-C) Ribbon diagrams showing the domain architecture of Rrn6 (A), Rrn11 (B), and Rrn7 (C). NTD, N-terminal domain; HB, helical bundle; CyclinC/N, C/N-terminal Cyclin Fold domain; IH, insertion helices; TPR, tetratricopeptide repeats. D and E, Rrn6’s scaffolding role in Core Factor assembly by binding Rrn11 (D) and Rrn7 (E) using large interaction surfaces from WD40-NTD and HB, respectively. Color scheme is same as in (A-C). (F) Interface between Core Factor and the Pol I protrusion and subunit Rpb12. Overall views are also shown for each panel, with the same orientation and color scheme. The close-up view is indicated by a red box. Obstructing components are shown in transparency.
Figure 2—figure supplement 1
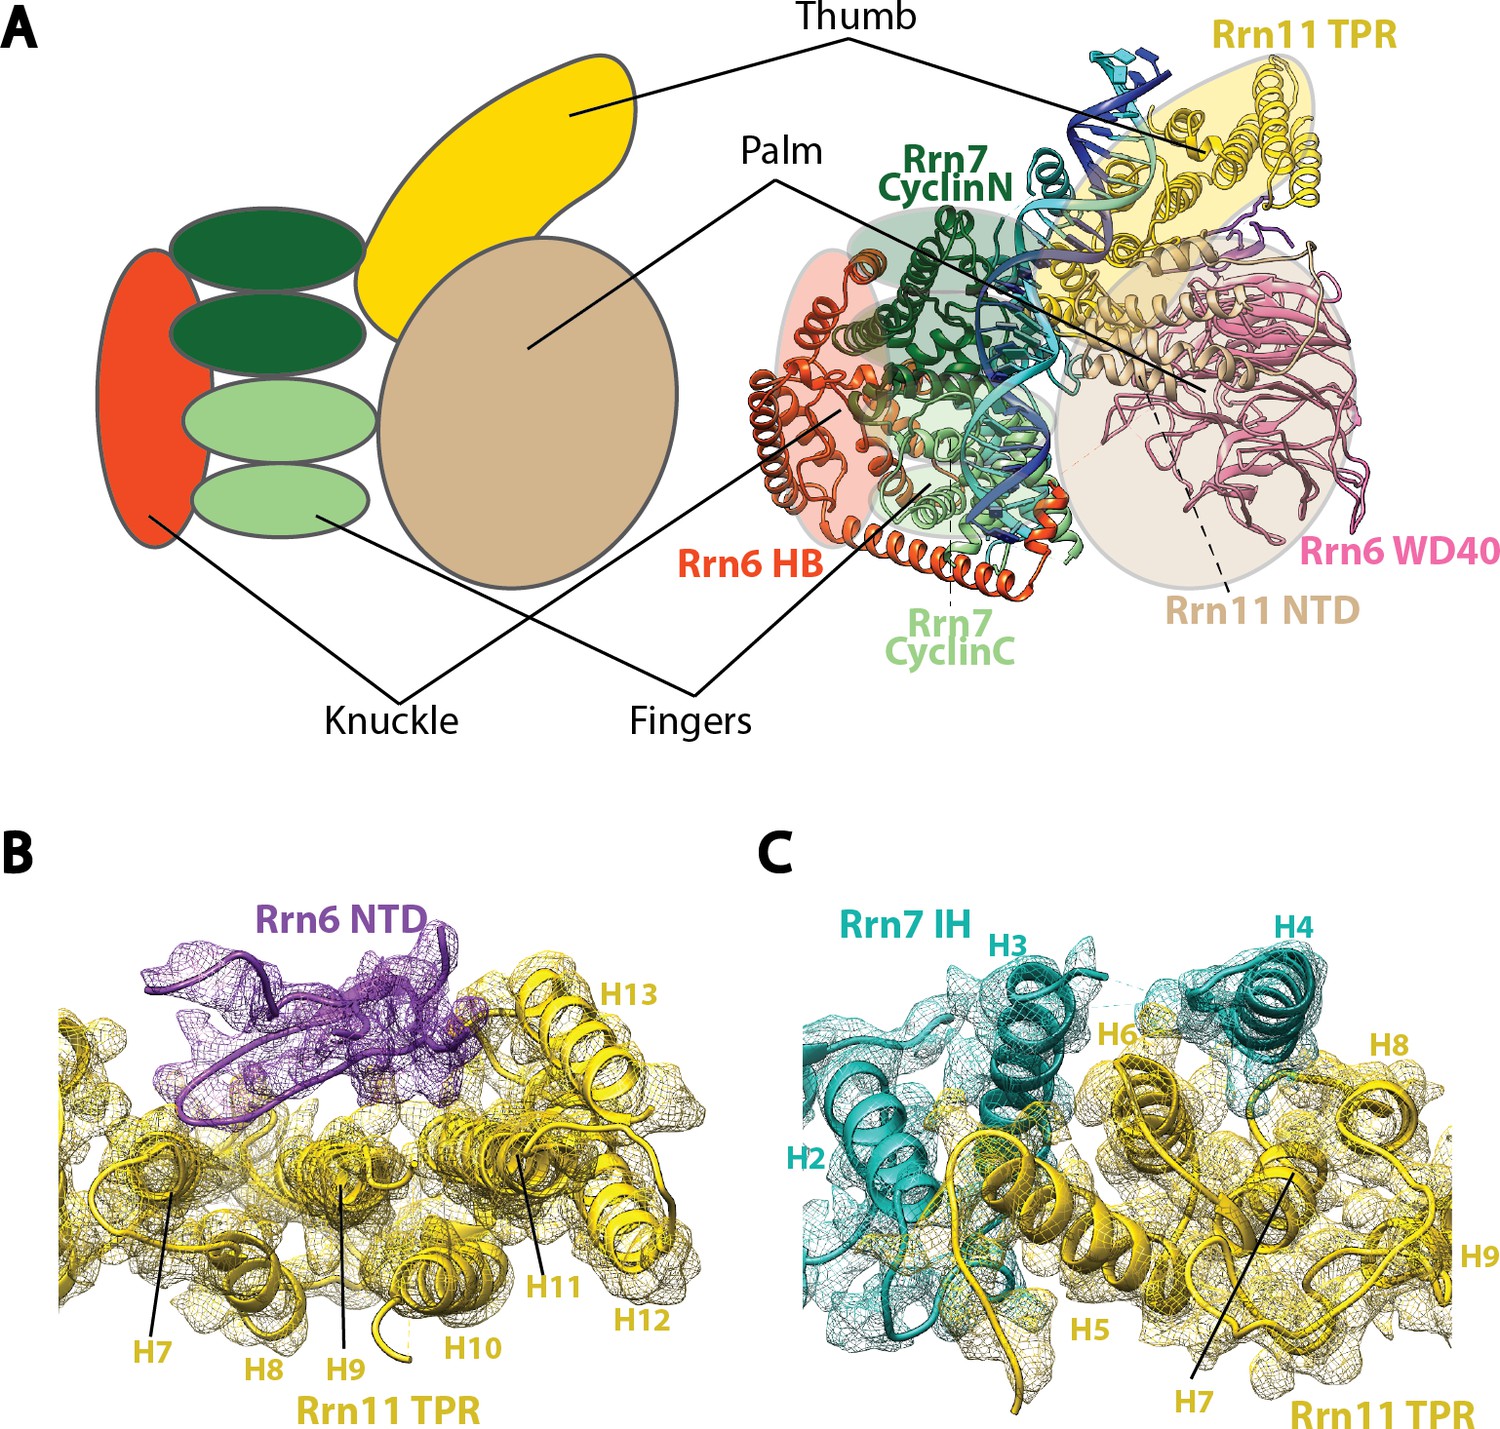
Molecular architecture of Core Factor.
(A) A ‘hand’ model for the molecular architecture of Core Factor. (B-C) interfaces between the Rrn11 TPR domain and the Rrn6 NTD (B) and the Rrn7 IH (C). Color scheme is the same as in Figure 2.
Figure 2—figure supplement 2
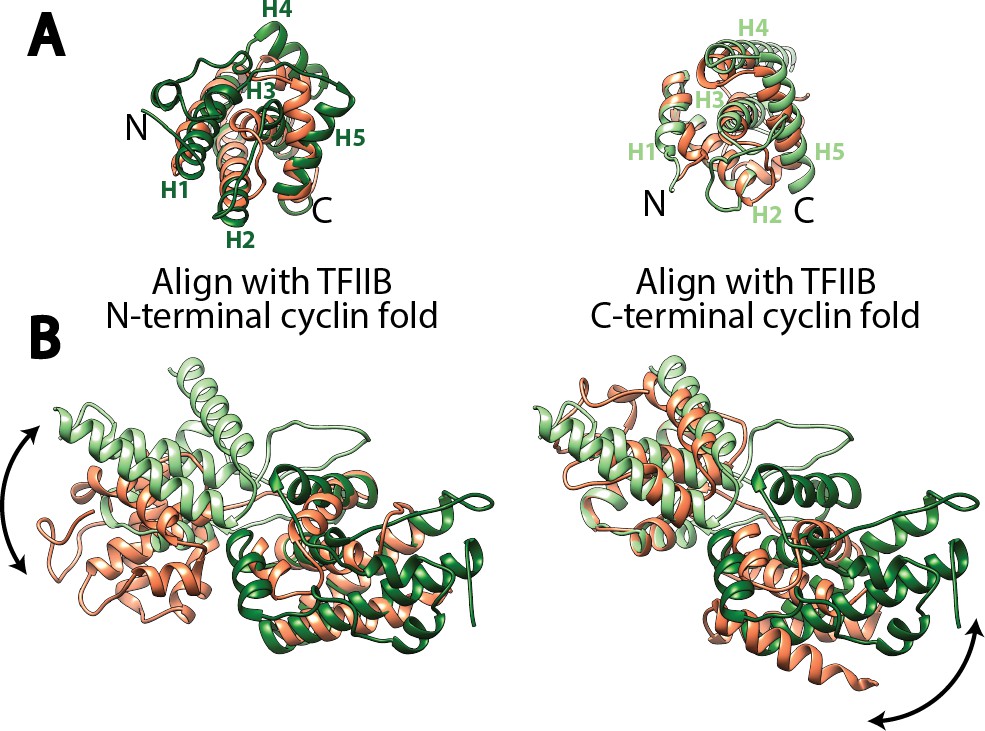
Structural comparison of the cyclin fold domains between Rrn7 and TFIIB.
(A) Alignment of the N- (left) and C-terminal (right) cyclin fold domains between Rrn7 (dark and light green) and TFIIB (orange). (B) Aligning one of the two cyclin fold domains reveals a potential rotation of the other. Left, the N-terminal cyclin fold domain is aligned; right, the C-terminal cyclin fold domain is aligned.
Figure 3 with 2 supplements
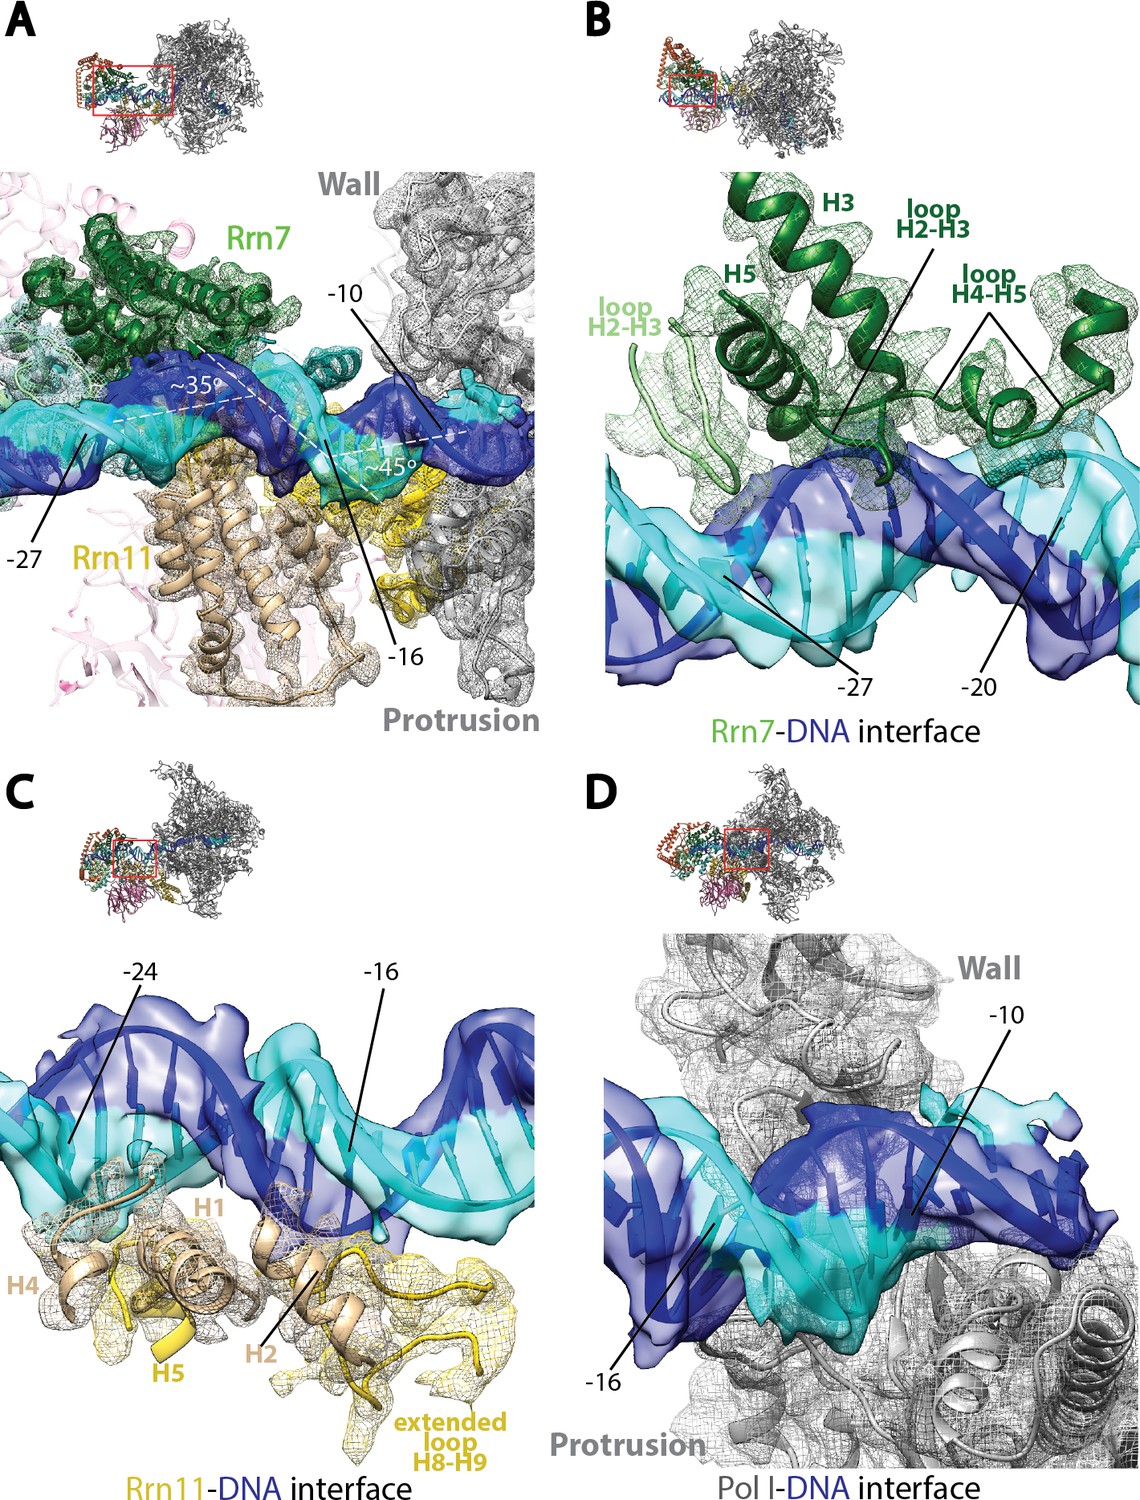
Core Factor engagement with promoter DNA from positions −27 to −16.
(A) Rrn7 and Rrn11, as well as the Pol I wall and protrusion domains interact with rDNA promoter, resulting in two consecutive kinks of ~35 and~45 degrees in promoter DNA approximately 5 bp apart. Rrn7, Key DNA binding domains and promoter DNA are shown as ribbons fitted in their corresponding density (mesh for proteins and transparent surface for DNA). Rrn6 and the remaining of Pol I are shown as transparency in the background. (B) Rrn7’s interaction with promoter DNA from positions −20 to −27. (C) Rrn11’s contact rDNA promoter from positions −16 to −24. (D) Sandwiching of promoter DNA near position −10 by the wall and protrusion. Overall views are also shown for each panel, with the same orientation and color scheme. The close-up view is indicated by a red box. Obstructing components are shown in transparency.
Figure 3—figure supplement 1
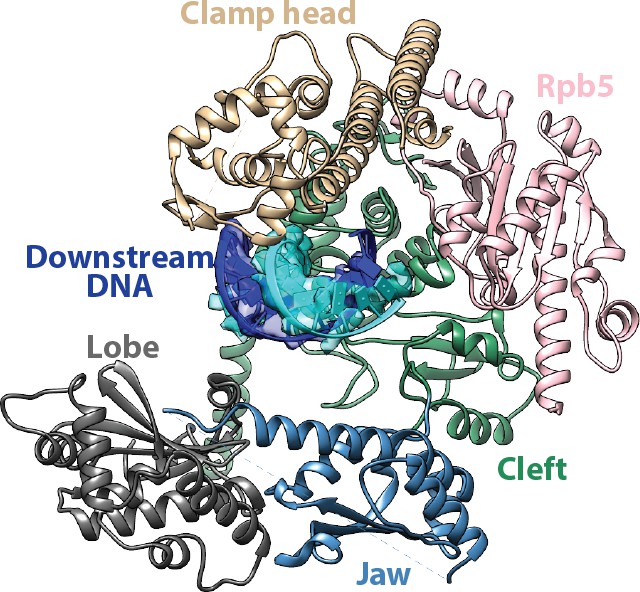
Interfaces for the downstream duplex DNA in the Pol I Initial Transcribing Complex.
Key structural domains making direct contacts on the downstream DNA are labeled and colored differently.
Figure 3—figure supplement 2
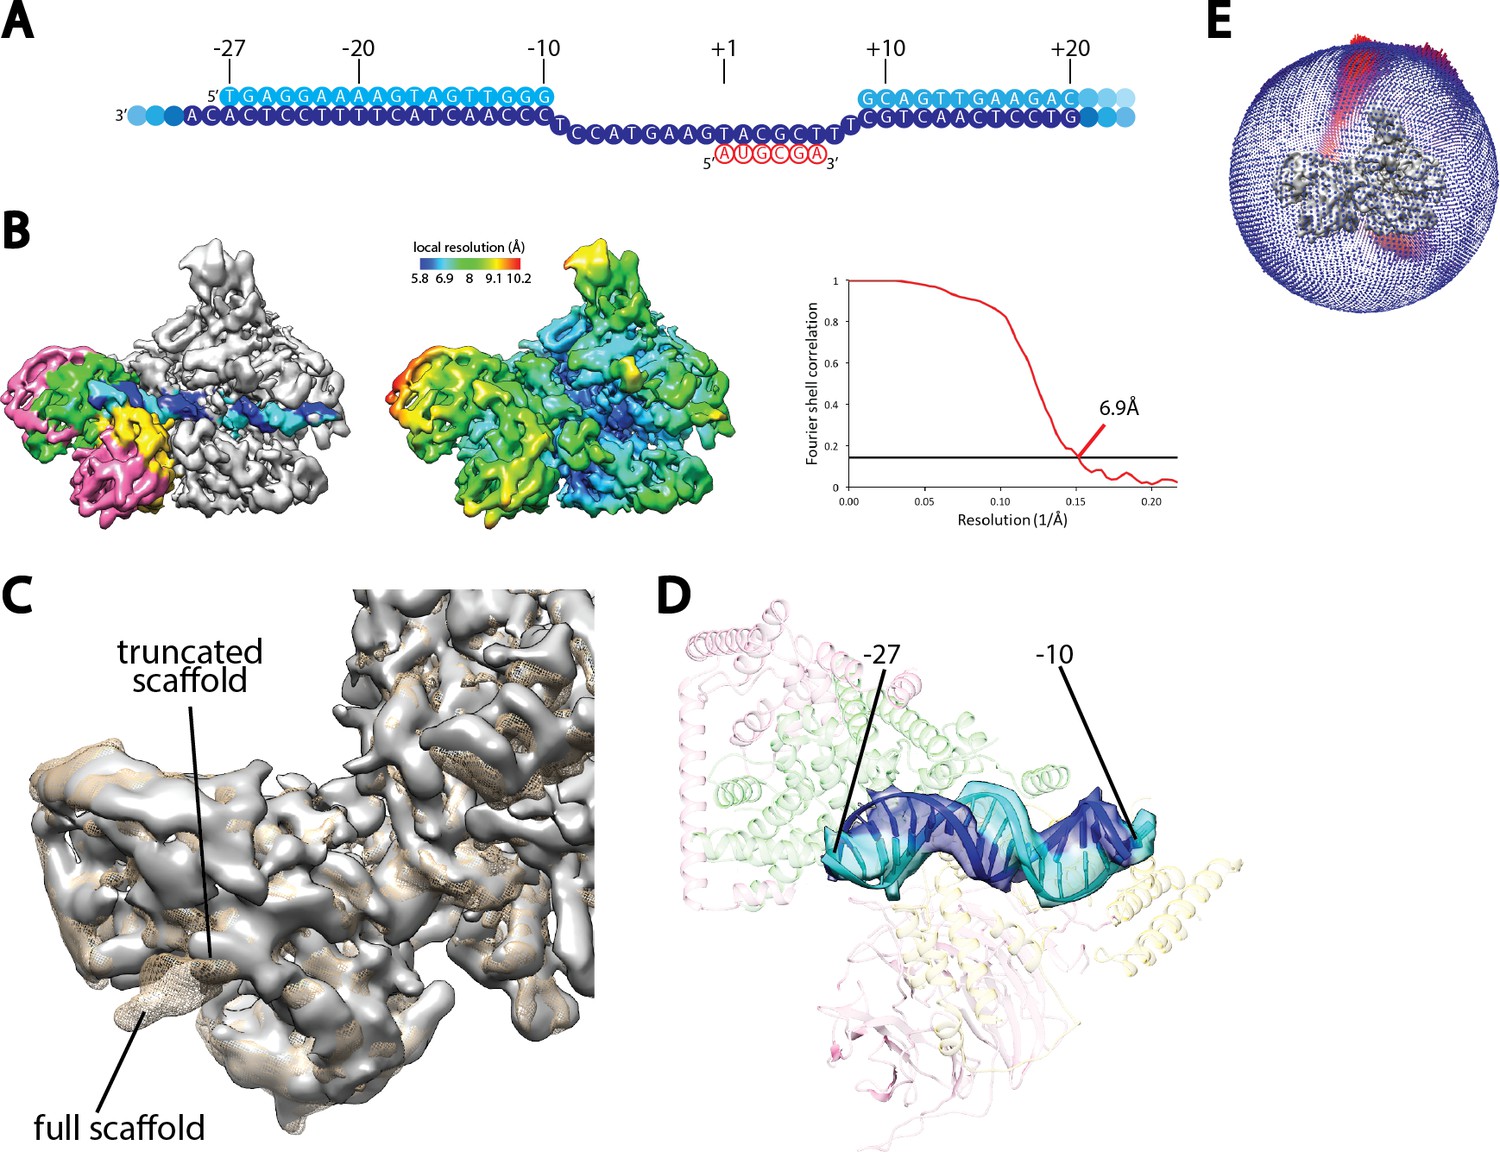
Cryo-EM reconstruction of Pol I Initial Transcribing Complex using a truncated scaffold.
(A) The sequence of the truncated scaffold used for assigning the register of upstream Core Factor bound DNA. Color scheme is the same as in Figure 1A. (B) Cryo-EM reconstruction of the Pol I Initial Transcribing Complex assembled on the scaffold shown in A. Core Factor subunits and the nucleic acid template are colored the same as in Figure 1B in the left panel. The middle panel shows the local resolution estimation of the complex. FSC curve and estimated resolution using the 0.143 criteria following the gold-standard procedure implemented in RELION are shown in the right panel. (C) Comparison between reconstructions using the full scaffold (Figure 1A) and this truncated scaffold. The density for the truncated complex is shown as a gray surface, while the full complex is depicted as mesh in tan. (D) Fitting of rDNA promoter DNA from positions −27 to −10 into the density. Template and non-template strands are shown in blue and cyan, respectively. Core Factor is shown in transparency, and is colored as in Figure 1. (E) Euler angle distribution for the reconstruction shown in B.
Figure 4 with 3 supplements
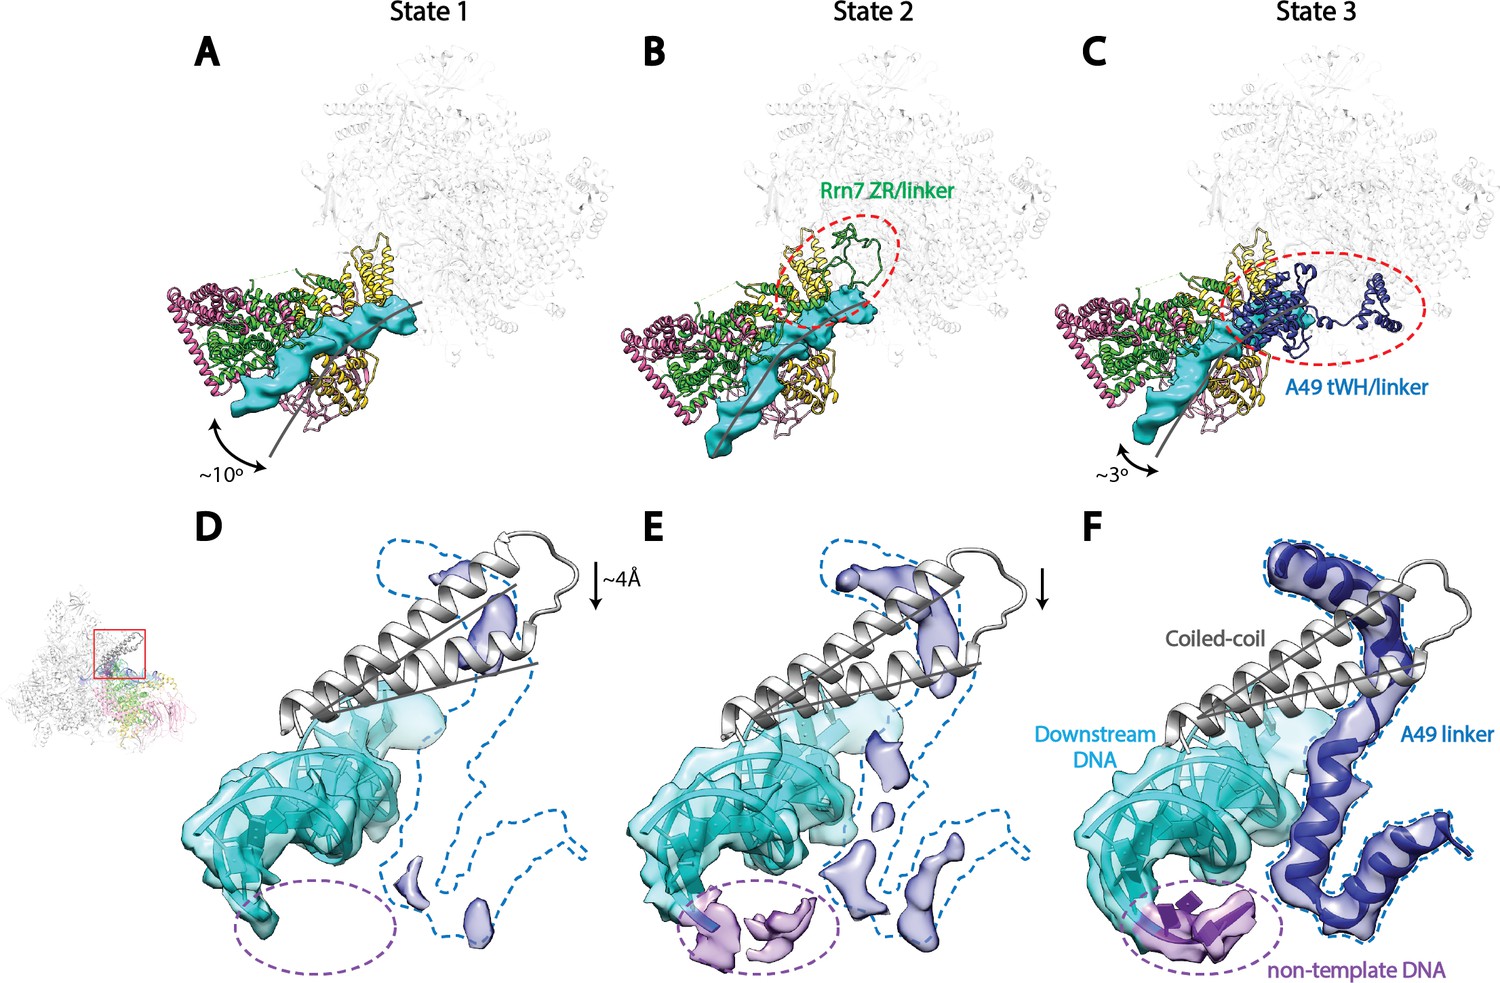
Correlation of structural states with key functional elements in Pol I Initial Transcribing Complex.
(A-C) Top-down views showing the location of the Core Factor/DNA complex relative to Pol I in State 1 (A), State 2 (B), and State 3 (C). The gray lines represent the path of upstream DNA in State 2, in which Core Factor moves closest to Pol I. Dotted red circles denote the locations of the Rrn7 N-terminal ZR and linker regions (B) and the A49 tandem winged helix (tWH) and linker domains (C). Rotations of ~10° and ~3° for the Core Factor/DNA complex by comparing State 1 and 3 with State 2 is also labeled in A and C. (D-F) Structural mobility of the active site cleft in State 1 (D), State 2 (E), and State 3 (F). The coiled-coil is shown as gray ribbon, with gray lines marking the position of the coiled-coil in State 3, where the clamp domain adopts the most contracted conformation. Arrows in D and E indicate the movement of the coiled-coil compared to State 3 (F). The A49 linker and downstream duplex DNA are shown as transparent density fitted with ribbon models in blue and cyan, respectively. Dotted outline in medium blue and purple represent the locations of the A49 linker and the non-template DNA, respectively. Zoom out view for D-F is shown to the left of panel D.
Figure 4—figure supplement 1
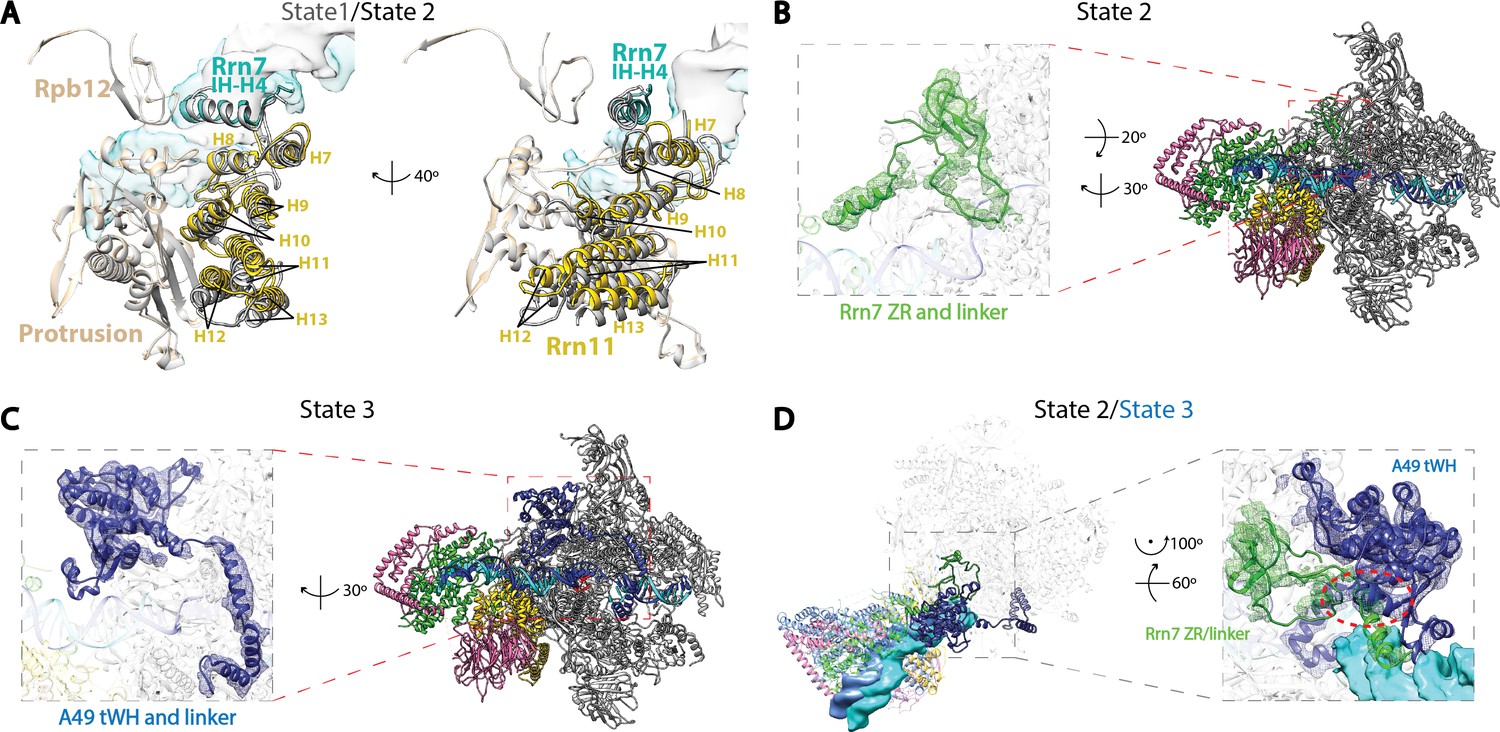
Structural features of the three functional states of Pol I Initial Transcribing Complex.
(A) Comparison of the Core Factor/Pol I interface between State 1 and 2. State 1 is shown in gray, while State 2 is shown in color. (B) Density for the N-terminal zinc ribbon domain and linker region of Rrn7 is only observed in State 2. (C) Density for A49 tandem winged helix domain and linker is only observed in State 3. (D) Comparison between State 2 and 3 for the mutually exclusive appearance of the A49 tandem winged helix domain and the Rrn7 N-terminal domain. State 2 is shown in color, while State 3 is depicted in medium blue. Zoom in panel shows the clashes between A49 tandem winged helix domain and Rrn7 linker (red circle).
Figure 4—figure supplement 2
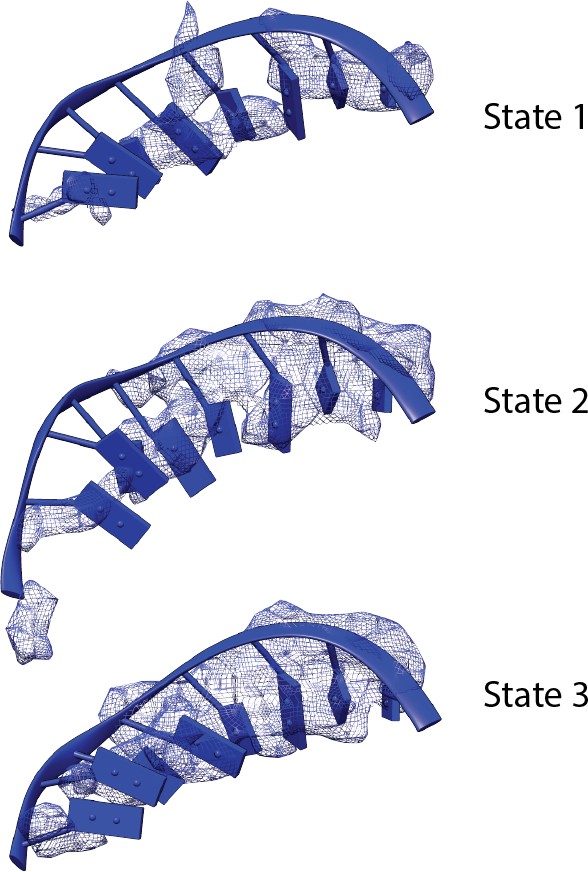
Comparison of the density of the template strand within the active site cleft among the three functional states of the Pol I Initial Transcribing Complex.
Density is depicted as blue mesh. Modeled DNA molecules are also shown.
Figure 4—figure supplement 3
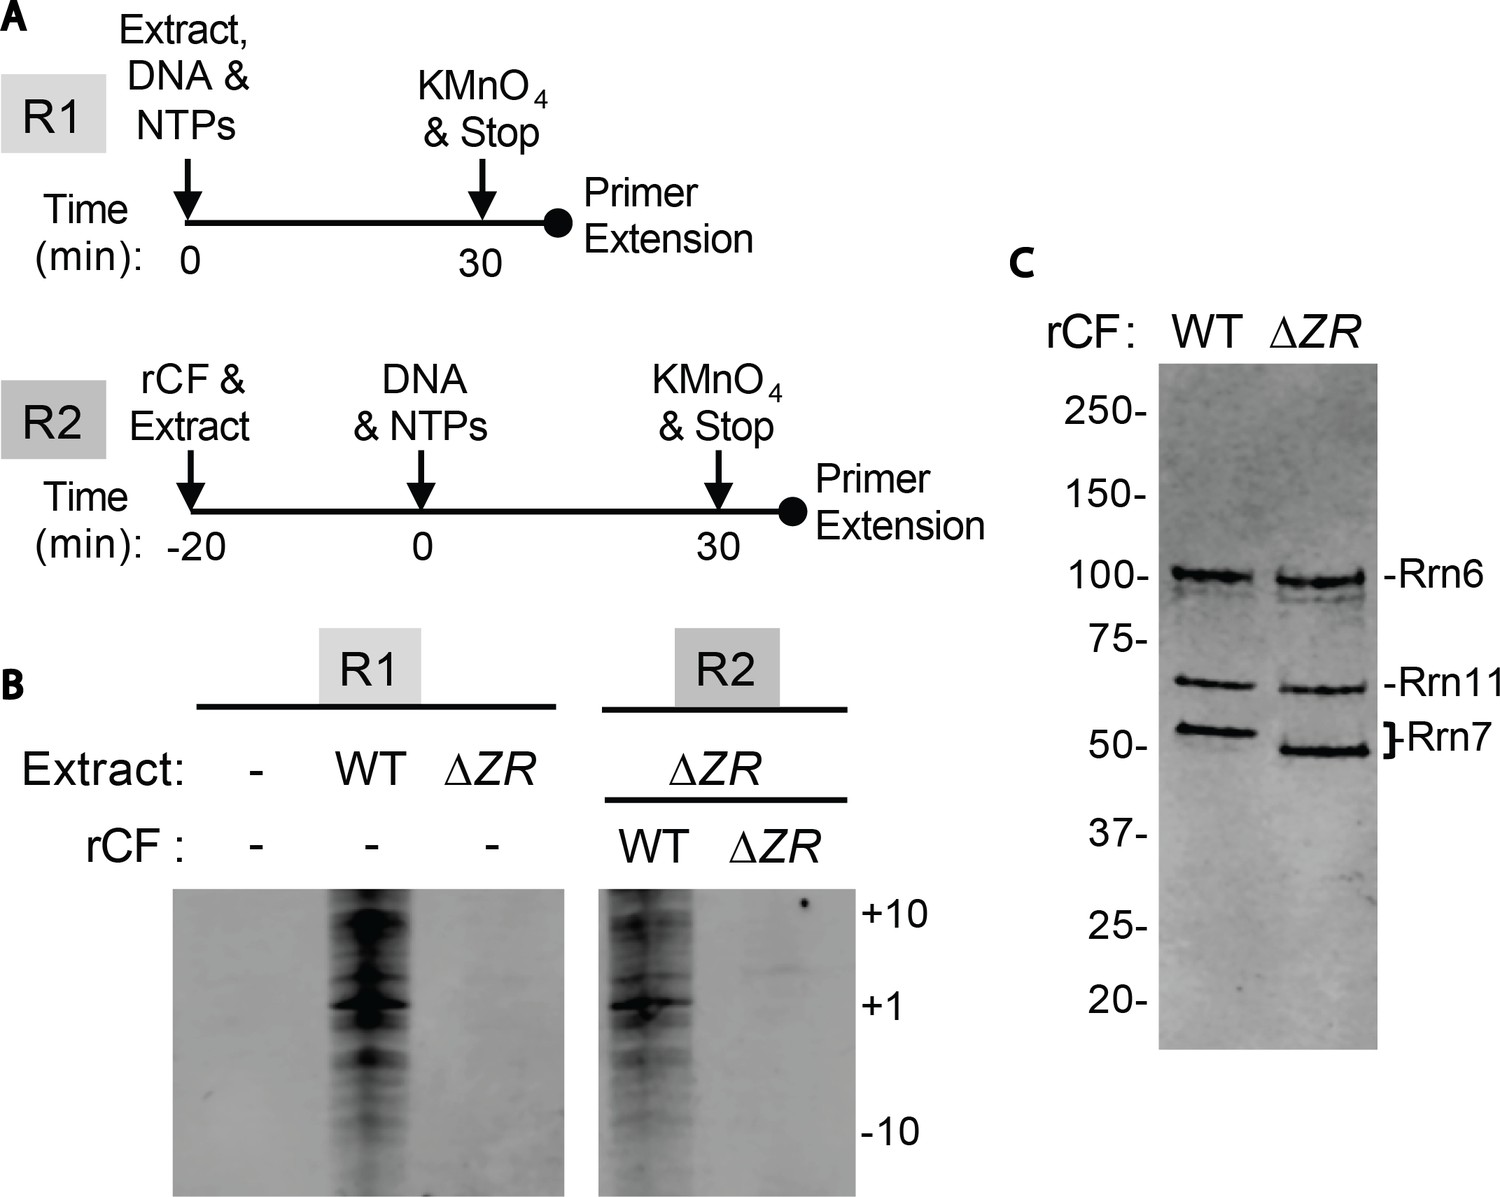
Core Factor mutants are defective for open complex formation.
(A) Schematic of experimental setup. (B) Pol I Pre-Initiation Complexes were formed on the rDNA promoter reporter plasmid and incubated with the indicated extract and/or recombinant Core Factor (rCF) protein and treated with KMnO4 after 30 min. Reactions were supplemented with rCF where indicated. Products from primer extension reactions run on a Urea-PAGE gel are shown. Numbers to the right denote the approximate nucleotide position, with +1 as the approximate transcription start site. (C) SDS-PAGE gel of indicated rCF proteins.
Figure 5 with 1 supplement
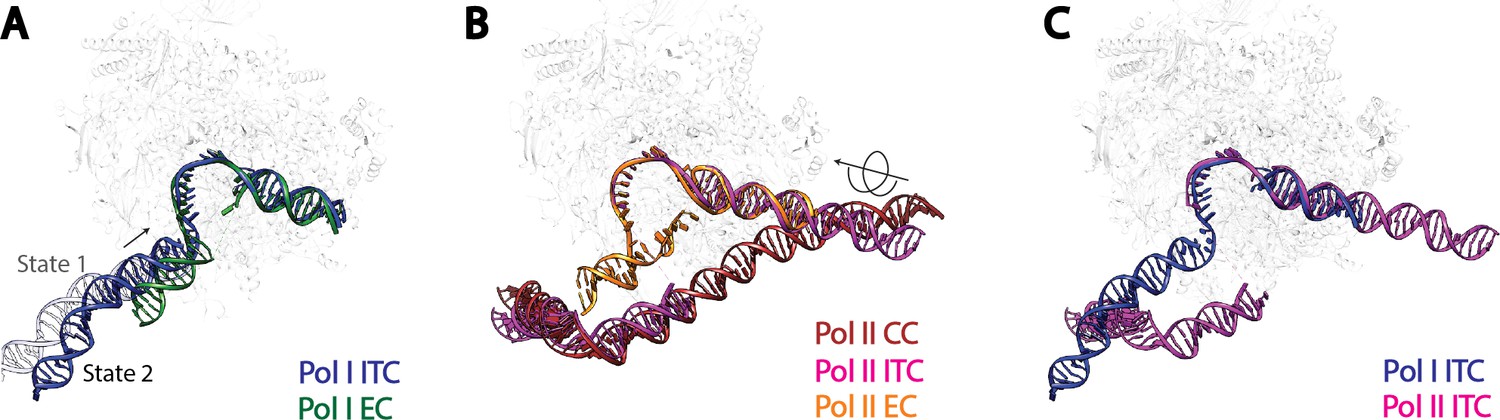
Comparison of DNA trajectories among Pol I and Pol II Pre-Initiation Complexes.
Top-down views showing the DNA paths of Pol I Initial Transcribing Complex (ITC) in this study and Elongation Complex (EC) (A), Pol II Closed Complex (CC), Initial Transcribing Complex and Elongation Complex from previous studies (B), Pol I Initial Transcribing Complex and Pol II Initial Transcribing Complex in comparison (C). Aligned polymerases are shown as transparent background. DNA is shown in blue for Pol I Initial Transcribing Complex; in green for Pol I Elongation Complex; in brown for Pol II Closed Complex; in magenta for Pol II Initial Transcribing Complex; in orange for Pol II Elongation Complex. Structural models used: Pol I Elongation Complex, 5M5X (Tafur et al., 2016); Pol II Closed Complex, 5FMF (Murakami et al., 2015); Pol II Initial Transcribing Complex, 4V1N (Plaschka et al., 2015) and 5IYD (He et al., 2016); Pol II Elongation Complex, 5C4X (Barnes et al., 2015).
Figure 5—figure supplement 1
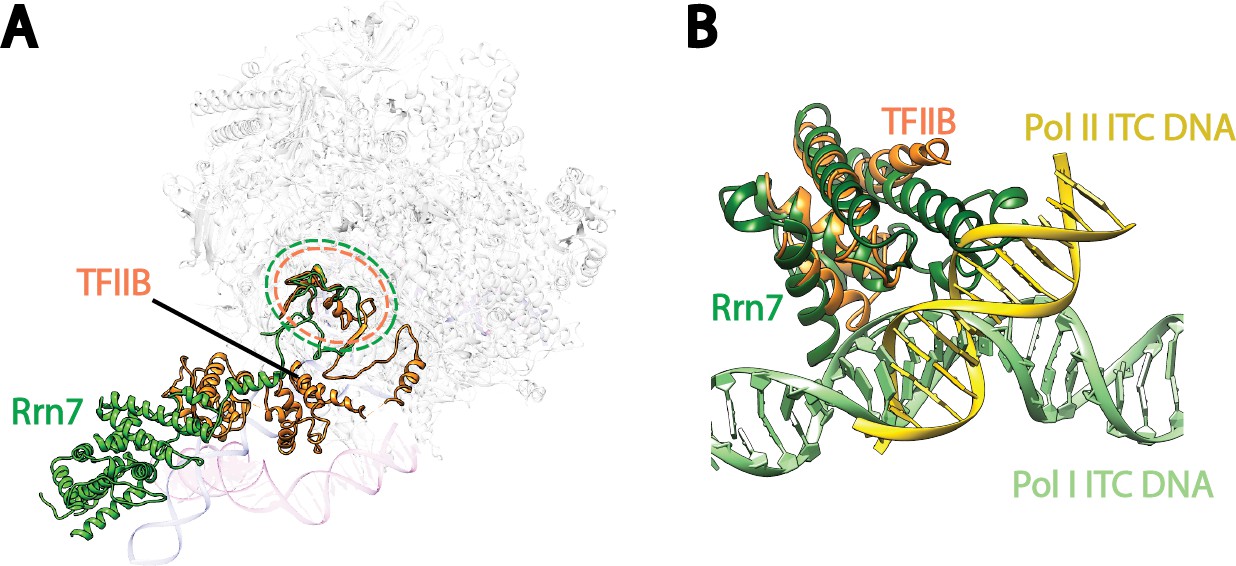
Comparison of Pre-Initiation Complexes of Pol I and II near TFIIB-like proteins.
(A) Relative positions of the zinc ribbon and the cyclin fold domains in Rrn7 and TFIIB after aligning the polymerases in Pol I and Pol II initiation complexes. Polymerases are shown in transparency. The DNA molecules are depicted in blue for the Pol I Initial Transcribing Complex, and magenta for the Pol II Pre-Initiation Complex (PDB ID: 4V1N), and are also shown in transparency. Rrn7 is shown in green, while TFIIB is in orange. Dotted circles indicate the locations of the zinc ribbon domains of Rrn7 (green) and TFIIB (orange). (B) The N-terminal cyclin fold domains engage with different phase of promoter DNA in Pol I and Pol II initiation complexes. The N-terminal cyclin fold domains between Rrn7 and TFIIB are aligned. Rrn7 obviously interact with a major groove, whereas TFIIB’s major DNA interface is at a minor groove.
Figure 6 with 1 supplement
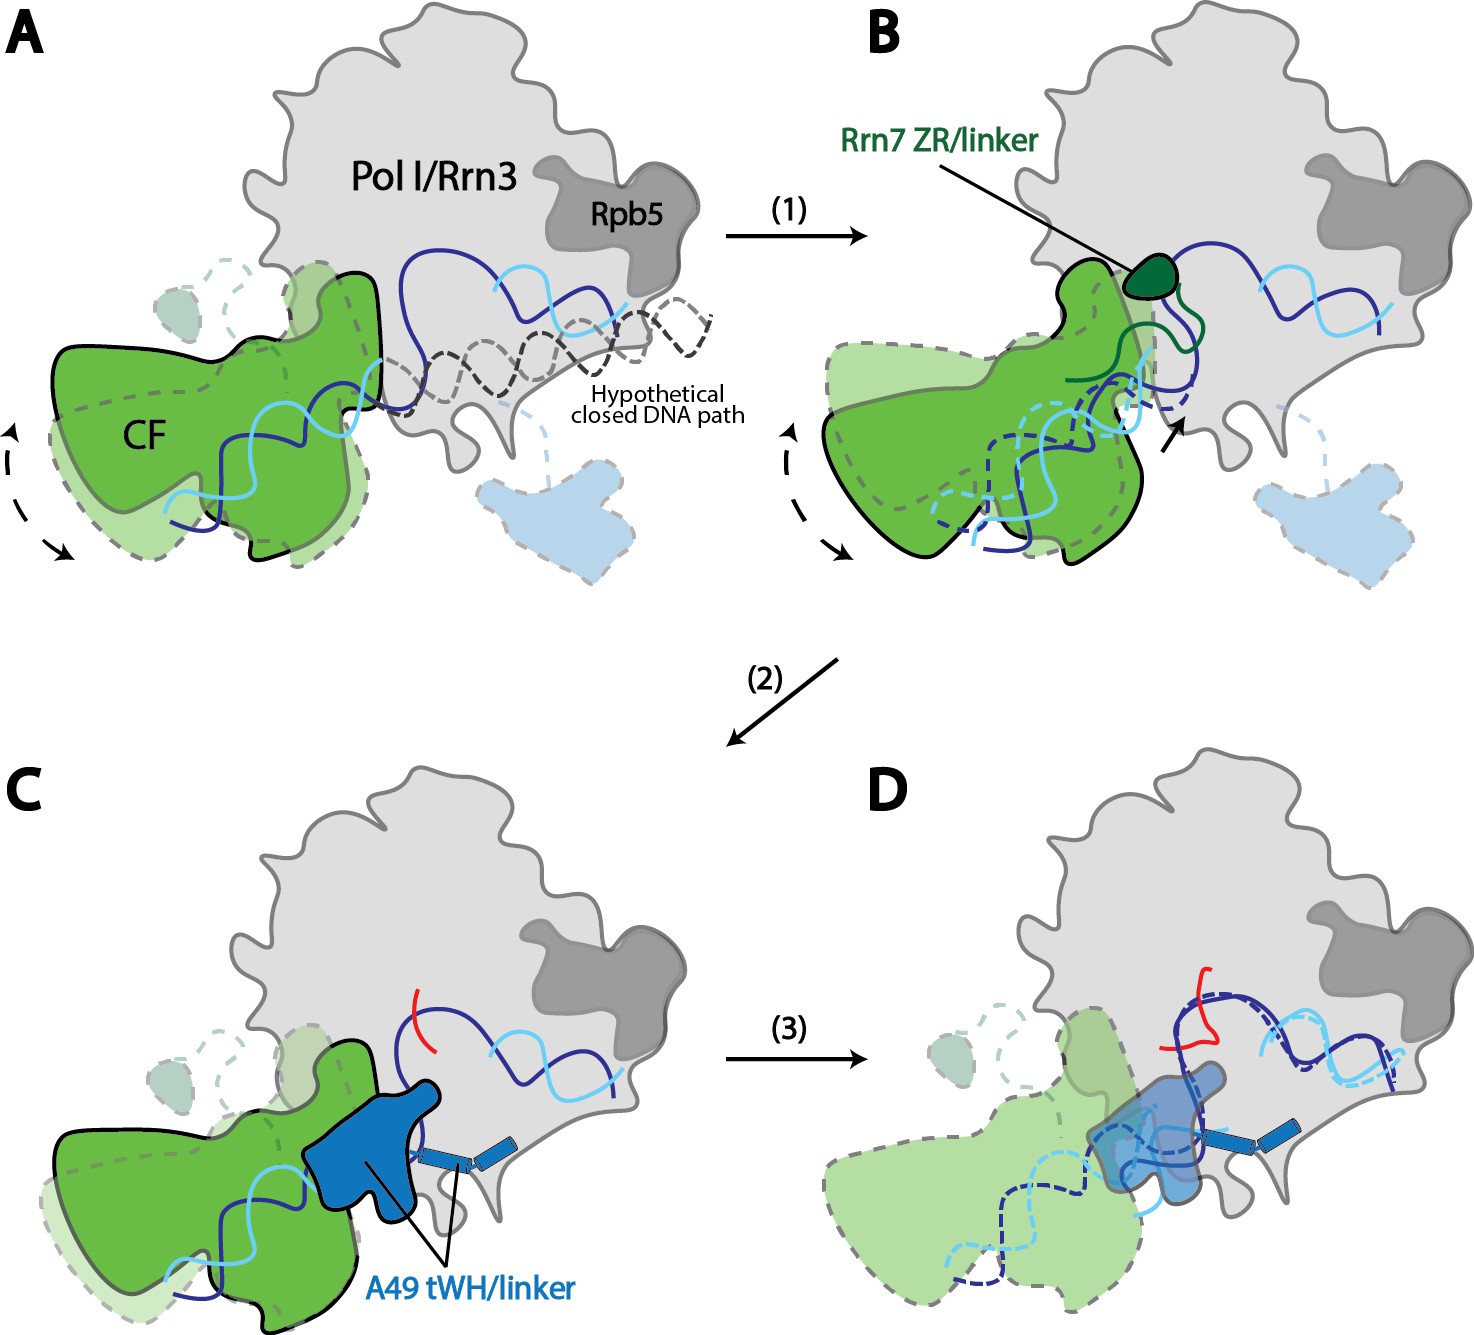
Model for Pol I transcription initiation.
Promoter bound Core Factor recruits Pol I/Rrn3, and loads DNA into the cleft of Pol I (A). At this stage, both Rrn7 N-terminal domain and A49 tandem winged helix domain are flexible. Pol I cleft is open to make room for loading of DNA. The intrinsic mobility of Core Factor upon Pol I engagement then ratchets upstream DNA against Rpb5. Promoter DNA melting occurs when Core Factor reaches a critical position where Rrn7 zinc ribbon/linker regions are stabilized on Pol I (1). This is likely a very transient state, allowing Pol I to recognize the initiation site in the template strand DNA and start synthesizing the RNA (B). Besides the well-accepted role for sensing the growing RNA length for its counterpart TFIIB in the Pol II PIC, Rrn7 likely plays an additional role in facilitating promoter opening by reaching into the RNA exit channel of Pol I and favoring the bending of DNA. During further translocation of Pol I along the promoter (2), the enzyme is acting more similarly as an elongation mode, with a more closed clamp. The gatekeeper linker helices in A49 between the dimerization and tandem winged helix domains presumably work as a ruler of the active site cleft, stabilizing upon clamp closing down while preventing escape of the downstream DNA (C). As RNA grows longer, the A49 tandem winged helix domain can also help displacing the Rrn7 zinc ribbon to clear the RNA exit channel. Subsequently, Pol I escapes the promoter and enters a processive elongation state (3). Pol I in its active, Rrn3 bound form is shown in gray, and Core Factor in green. Transparency and dotted outline indicate flexibility. Solid blue and cyan lines depict the DNA paths that has been experimentally observed [panels A–C revealed in this study; panel D shown in previous studies (Neyer et al., 2016; Tafur et al., 2016), while dotted blue and cyan lines in B and C represent the DNA paths in the preceding stages. In panel A, a hypothetical closed DNA path is depicted as dotted black/gray lines by naturally extending a B-form DNA from upstream Core Factor associated DNA. RNA molecule with growing length during initial stages of transcription is represented in red.
Figure 6—figure supplement 1
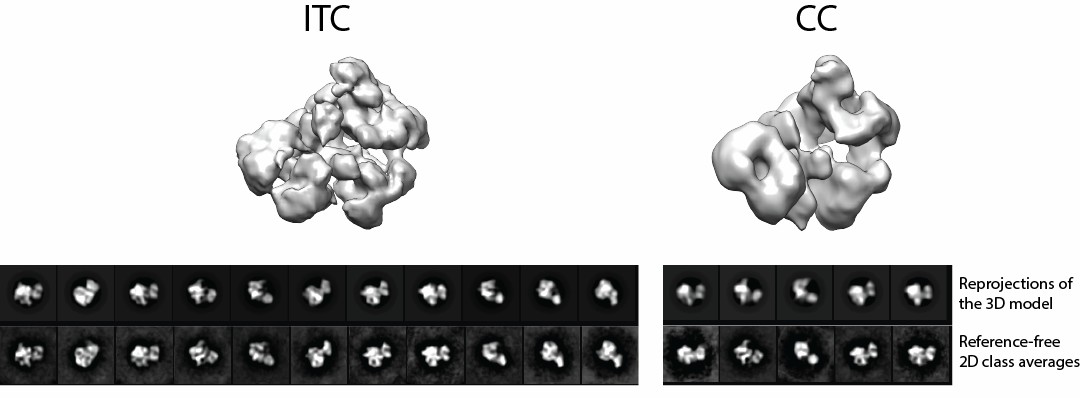
Model for the proposed Closed Complex based on the reconstruction in State 1.
A B-form DNA is naturally extended from the upstream duplex sandwiched by the wall and protrusion domains of Pol I. Color scheme is the same as in Figure 1.
Author response image 1
Videos
Video 1
Cryo-EM reconstruction and MDFF model of Pol I Initial Transcribing Complex.
Densities are shown as a semi-transparent surface following a similar color scheme to that in Figure 1.
Video 2
Molecular model for Pol I transcription initiation.
A morph among the modeled Closed Complex (CC), modeled Open Complex (OC) and Initial Transcribing Complex (ITC) states highlights the potential mechanism for promoter opening during Pol I transcription initiation. Key conformational changes observed in the three distinct functional states of the Pol I Initial Transcribing Complex are also depicted. The color scheme is same as in Figure 1.
Download links
A two-part list of links to download the article, or parts of the article, in various formats.
Downloads (link to download the article as PDF)
Open citations (links to open the citations from this article in various online reference manager services)
Cite this article (links to download the citations from this article in formats compatible with various reference manager tools)
Structural mechanism of ATP-independent transcription initiation by RNA polymerase I
eLife 6:e27414.
https://doi.org/10.7554/eLife.27414


