A widespread family of serine/threonine protein phosphatases shares a common regulatory switch with proteasomal proteases
- Harvard University, United States
- University of York, United Kingdom
Figures
Figure 1 with 2 supplements

The structure of SpoIIE with its regulatory domain.
A is a diagram of the three-protein pathway controlling σF. B is a schematic diagram of the SpoIIE primary structure with its N-terminal cytoplasmic degradation tag in black, the 10 transmembrane segments in dark grey, the regulatory domain in blue, and the PP2C phosphatase domain shown in light grey. Also shown are the switch helices in orange and the metal-coordinating residues within the active site in red. The black box identifies the SpoIIE457-827 fragment that was crystallized. C is a ribbon diagram of a single molecule of SpoIIE457-827 with front and side views using the same color scheme as the diagram in panel B. The inset shows the putative metal coordinating sidechains of the active site (from top to bottom: D795, D746, and D628) and the backbone carbonyl of G629. Figure 1—figure supplement 1 shows the 2Fo-Fc electron density map and a stereo representation of the SpoIIE457-827 structure. D shows the dimer observed in the crystal structure of SpoIIE457-827 (chains A and B) with the two protomers in darker and lighter shades (buried surface area 1500–2000 Å2 per monomer). The two and a half dimers in the asymmetric unit are shown in Figure 1—figure supplement 2.
Figure 1—figure supplement 1
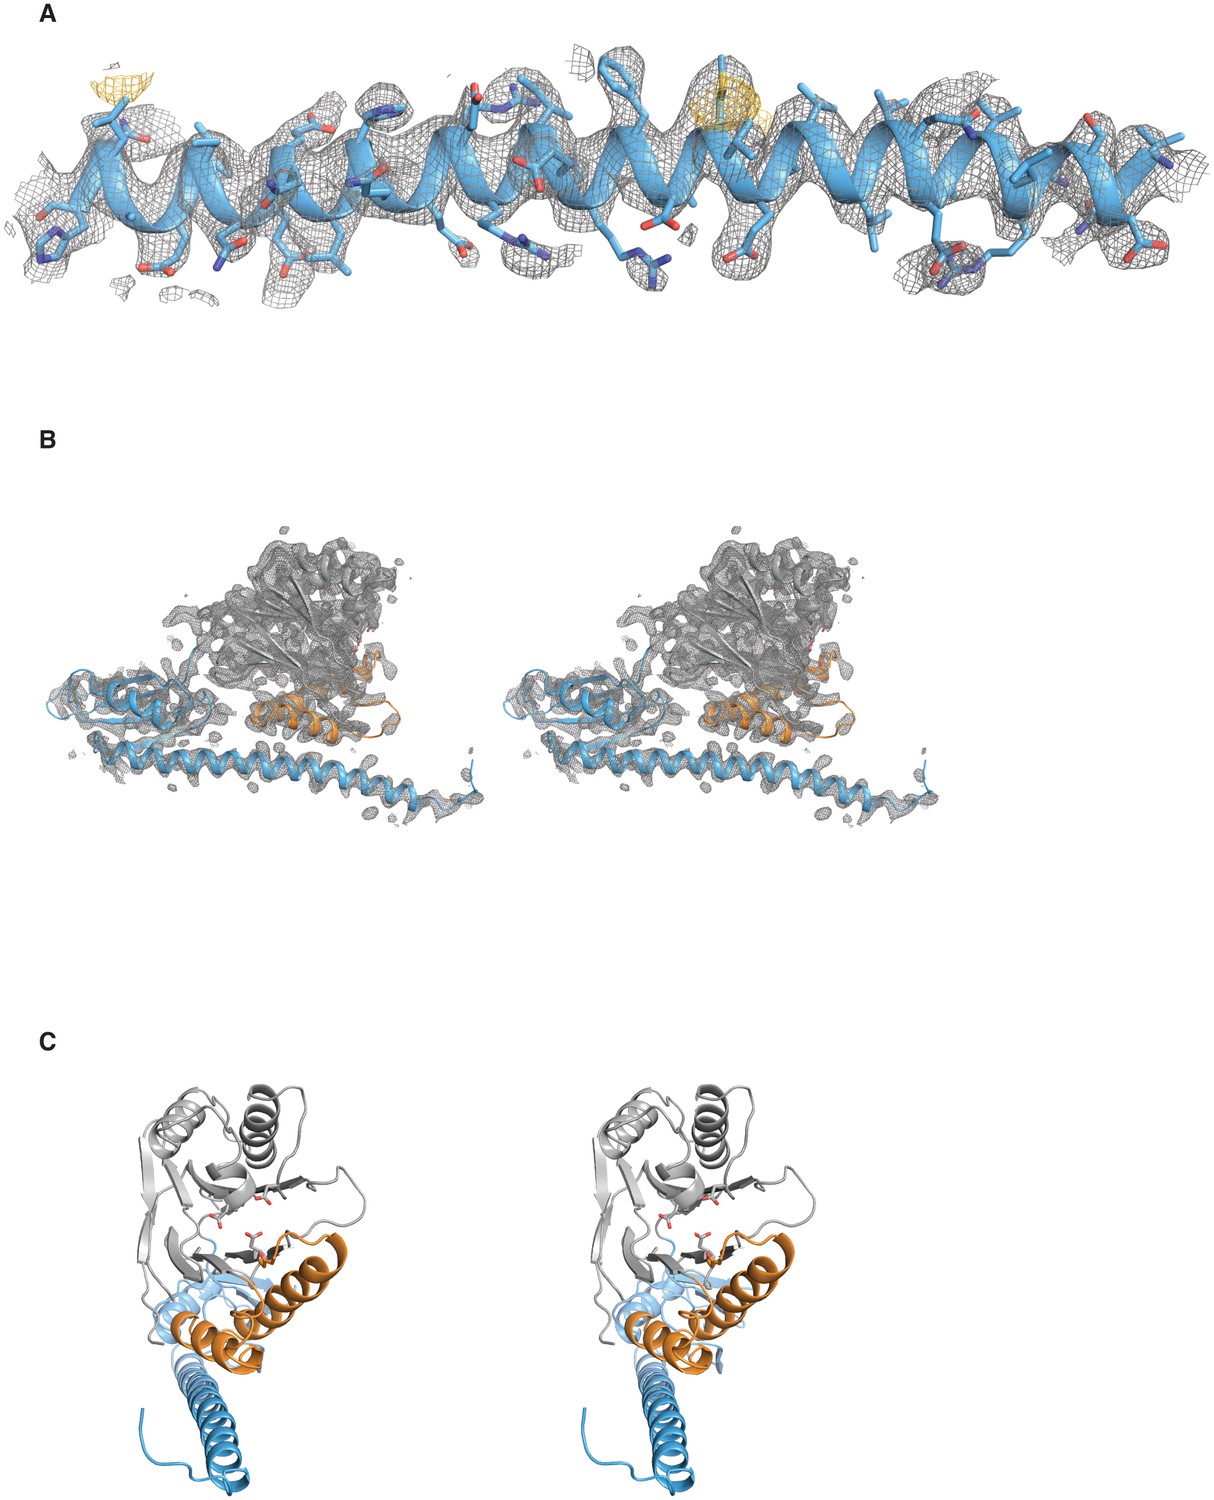
Validation of the SpoIIE457–827 structure.
A shows the long α-helix from the regulatory domain of chain A from the SpoIIE457–827 structure. The 2Fo–Fc electron density map is shown with a 4 Å carve radius around the α-helix in grey mesh contoured to 1.0 σ, and the anomalous difference map from seleno-methionine derivatized crystals is shown in yellow mesh contoured to 4.0 σ. B shows a stereo representation of chain A from the SpoIIE457–827 structure with the 2Fo–Fc electron density map shown in grey mesh contoured to 1.5 σ with a 2.5 Å carve radius around chain A. C shows a stereo representation of chain A from the SpoIIE457–827 structure.
Figure 1—figure supplement 2
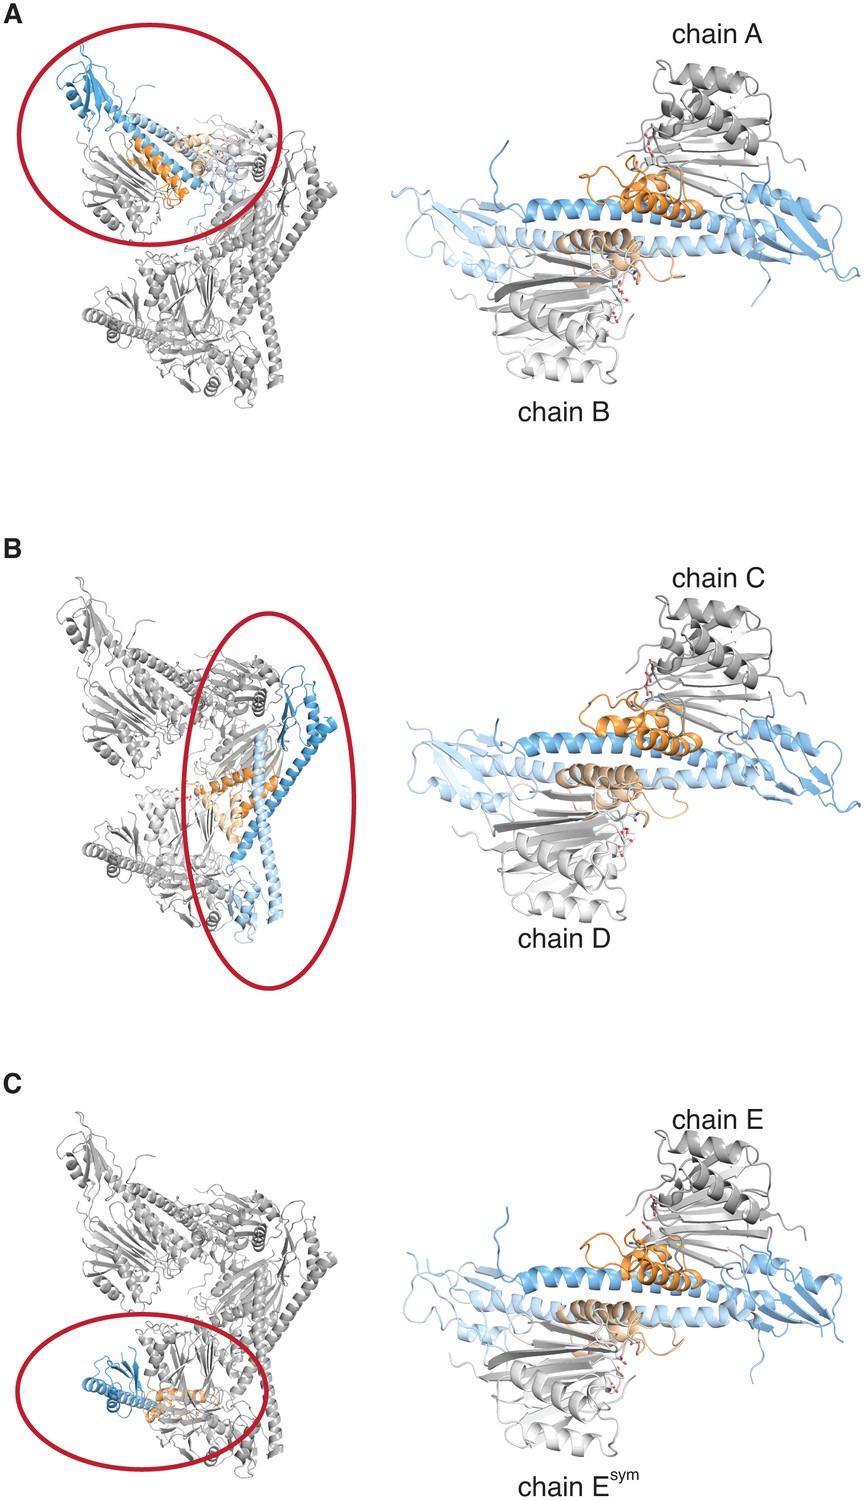
The crystal lattice contains three similar SpoIIE dimers.
Each panel shows the asymmetric unit from the crystals of SpoIIE457–827 on the left with a single dimer circled in red and presented in isolation on the right. The chains are labeled as in the PDB file with the exception of Esym, which is a crystallographic symmetry mate of chain E.
Figure 2 with 1 supplement
Dimerization activates the phosphatase.
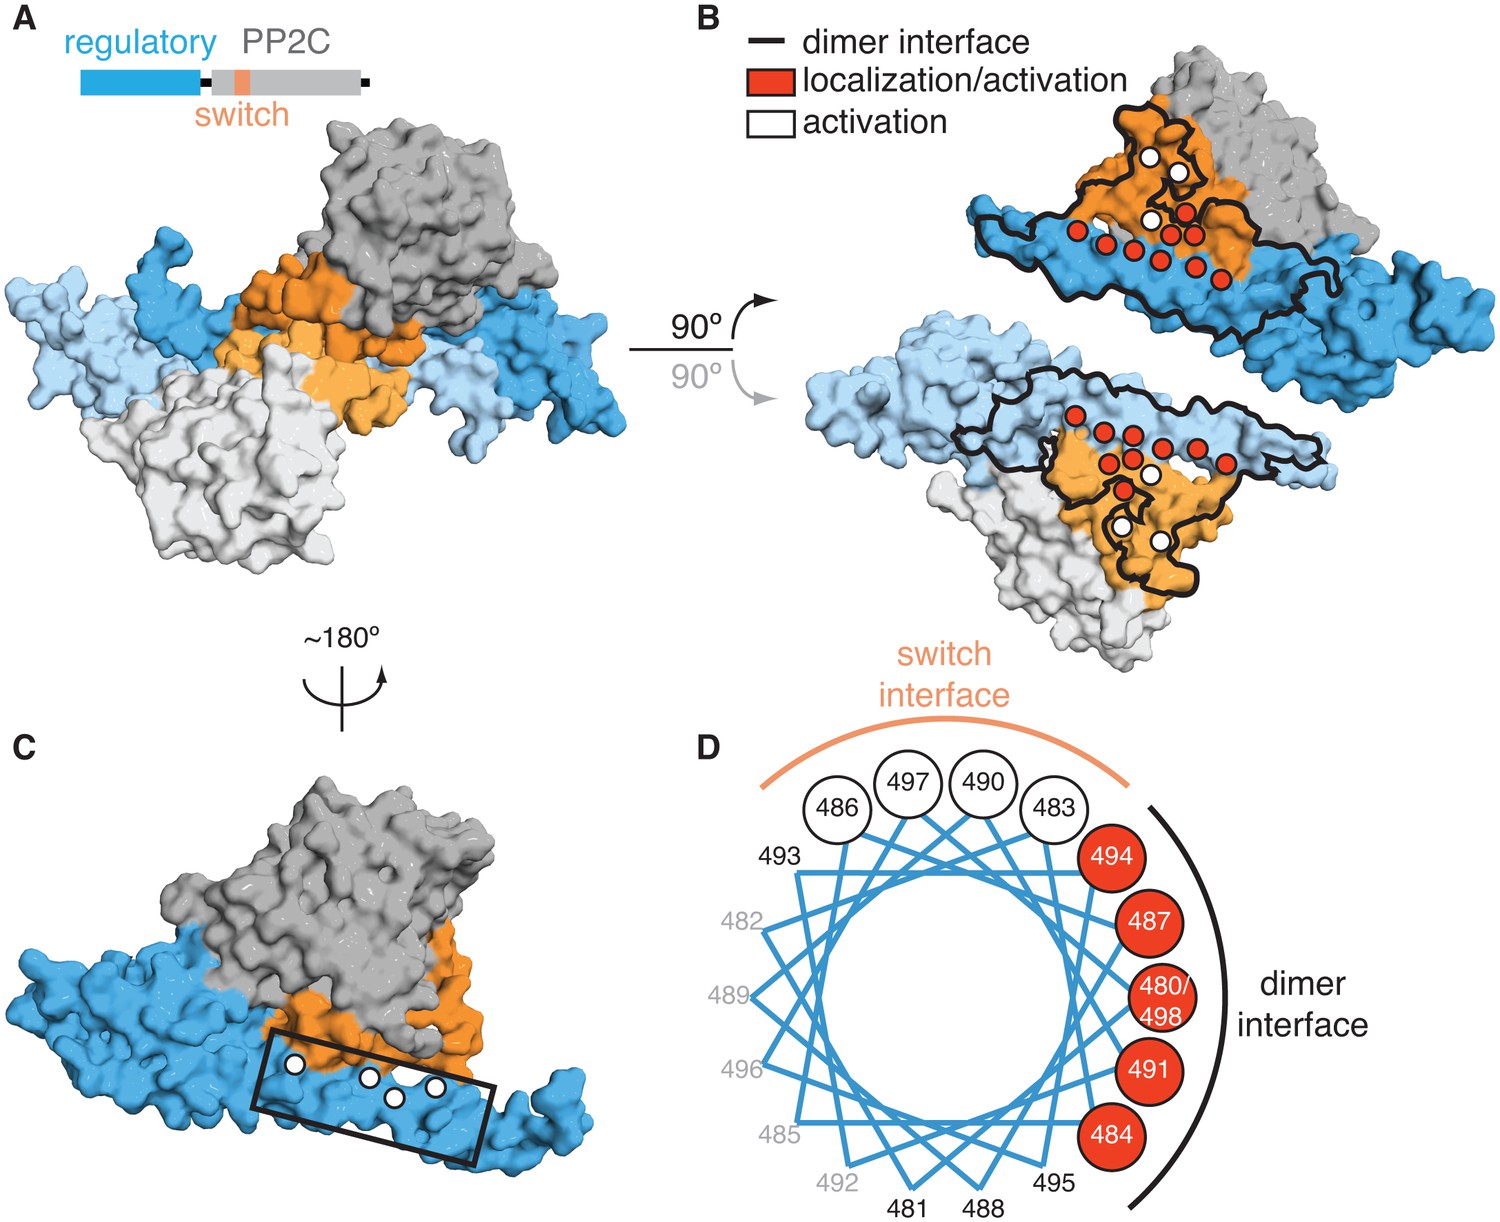
A is a surface representation of the SpoIIE457–827 dimer with the phosphatase domain, the switch, and the regulatory domain color coded as indicated in the associated schematic. Chain A is colored with darker shades and Chain B is colored with lighter shades. B is an open-book view of the SpoIIE457–827 dimer with the interface (defined as residues within 4.5 Å of the adjacent molecule) outlined in black. Red circles mark positions of amino-acid substitutions that blocked stabilization, localization, and activation (V480K, L484K, V487K, M491K, F494K, I498K, L646K, I650K, and T663K), whereas white circles mark positions of substitutions that blocked activation (as judged by σF activity) but not stabilization and localization (E639K, E642K, and I667K). Figure 2—figure supplement 1 presents the analysis of the behavior of the SpoIIE mutants in vivo. C is a surface representation of Chain A of SpoIIE457-827 rotated approximately 180° relative to the dimeric view in A. White circles indicate positions of substitutions that led to defects in activation (but not localization) of SpoIIE in vivo (Q483A, G486K, V490K, and E497K). The box outlines the section of the long α-helix of the regulatory domain that is represented as a helical wheel in D. Figure 2—figure supplement 1 presents the analysis of the behavior of the SpoIIE mutants in vivo. D is a helical wheel representation of residues 480 to 498 from the long α-helix of the regulatory domain. Positions at which substitutions led to defects in σF activation are indicated by circles colored as in B and C. Black text (A481K, S488K, D493K, and S495K) indicates positions where substitutions did not lead to a phenotype, grey text represents positions that were not tested. Figure 2—figure supplement 1 presents the analysis of the behavior of the SpoIIE mutants in vivo.
Figure 2—figure supplement 1
Functional analysis of the dimer interface.
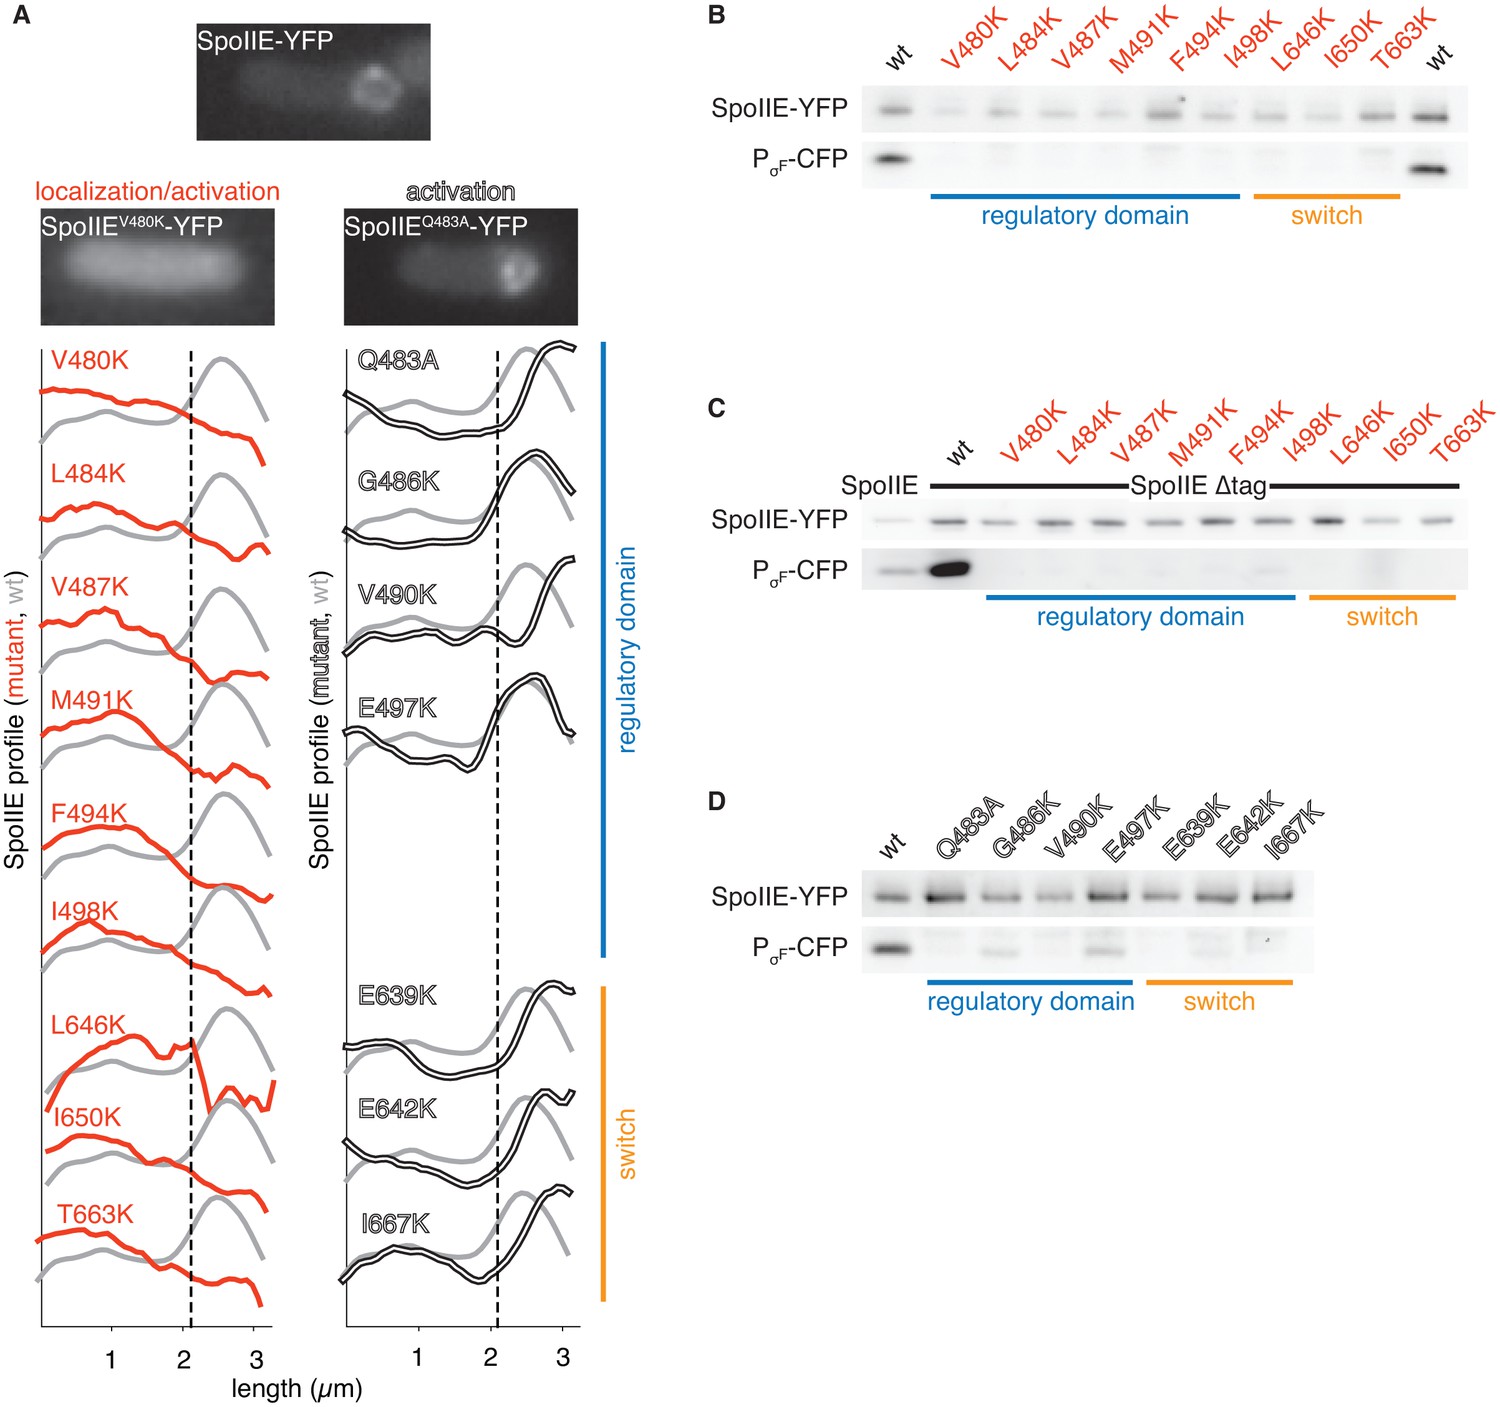
A shows the intracellular localization of the SpoIIE mutants described in Figure 2. Images of SpoIIE-YFP fluorescence from representative sporulating cells that had completed asymmetric division are shown for wild-type SpoIIE (top center), the mis-localized mutant SpoIIEV480K (left), and the forespore-localized mutant SpoIIEQ483A (right). Average fluorescence intensity profiles of SpoIIE-YFP are plotted for each mutant. Plots from mutants with defects in localization and activation of σF are in red (left), and plots from variants that are defective only in σF activation are in white (right). The blue bar at the right indicates substituted residues that reside in the long α-helix of the regulatory domain, whereas the orange bar marks substitutions in the PP2C phosphatase domain switch region. Each trace represents an average intensity profile normalized to the membrane dye FM4-64 from hundreds of asymmetrically divided cells aligned at the forespore pole. A reference plot from wild-type SpoIIE is in grey, and the dashed line represents the approximate position of the asymmetric septum. After σF activation, SpoIIE is recruited back to the forespore face of the asymmetric septum and then moves along with the engulfing membrane to encompass the forespore. Thus, mutants with the most severe defects in σF activation haves fluorescence profiles that are slightly shifted towards the forespore pole relative to that of wild-type cells. B-D are immunoblots showing the levels of SpoIIE-YFP, and CFP produced from a σF dependent promoter (detected using an α-GFP antibody) for the mutants in panel A. B shows immunoblots for the mutants that exhibited reduced SpoIIE levels and abnormal localization (red). C shows immunoblots for the mutants shown in panel B in which the FtsH degradation tag of SpoIIE had been removed to stabilize SpoIIE protein (the immunoblot for intact SpoIIE is shown in the left lane). D shows immunoblots for the properly localized mutants (white). The colored bars and mutant labels are color coded as in panel A.
Figure 3 with 3 supplements

Repositioning the switch activates the phosphatase.
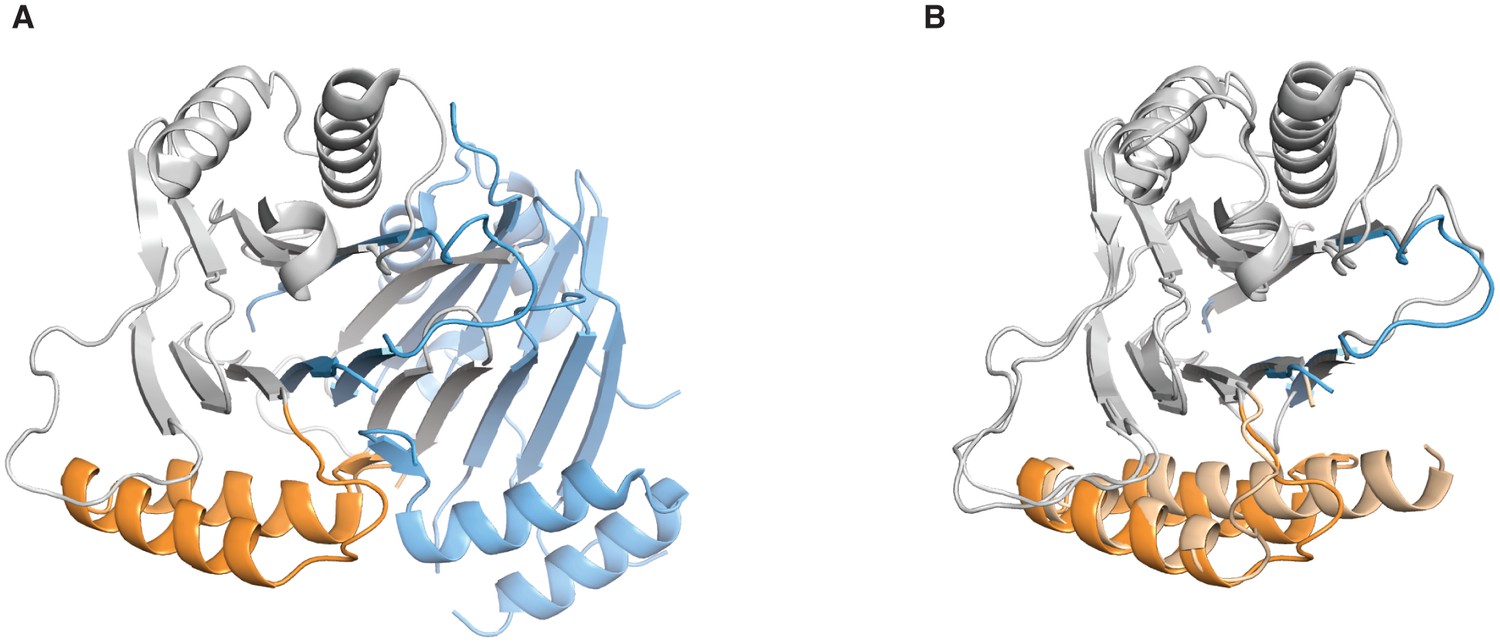
A is a ribbon diagram of the structure of SpoIIE590–827, which is the phosphatase domain of SpoIIE lacking the regulatory domain. The region of the protein that was crystallized is diagramed above. The switch region and Mn2+-coordinating residues are color-coded as in Figure 1A. Figure 3—figure supplement 1 shows a comparison with the previously published domain swapped SpoIIE590–827 structure. B compares the conformations of the phosphatase domain in the dimeric SpoIIE457–827 structure (switch helices in dark orange) and the isolated phosphatase domain of SpoIIE590–827 (switch helices in light orange). The structures were aligned based on the core of the phosphatase domain excluding the switch region (residues 590–628 and 678–827) with an RMSD = 0.952 Å (970 to 970 atoms). The major conformational change upon dimerization corresponds to a rotation and upward movement of the switch helices. Figure 3—figure supplement 2 shows how gain of function mutants may promote the conformational change. C is a model for how rotation of the switch helices leads to phosphatase activation. In the inactive state (left) G629 is not positioned to coordinate the M2 metal. We propose that dimerization (right) leads to rotation of the switch helices (orange), which repositions G629 to recruit manganese and complete the active site. We note that an additional glycine of RsbX (G47), corresponding to G631 of SpoIIE, also coordinates M2. Thus, it is possible that G631 also coordinates M2 in place of the lower right-hand water molecule depicted in the schematic diagram (Teh et al., 2015). Figure 3—figure supplement 3 shows details of the active site in the SpoIIE457–827 structure.
Figure 3—figure supplement 1
Comparison of the SpoIIE590–827 structures.
A shows the domain swapped structure of SpoIIE590–827 (PDB ID 3T91). The PP2C domain of Chain B is grey and the switch helices are colored orange and Chain A is colored blue. B shows an overlay of the unswapped SpoIIE590–827 structure (light shades), and the domain swapped SpoIIE 590–827 (colored as in panel A). The overlay was done using residues 678–800 (RMSD 0.72 Å).
Figure 3—figure supplement 2
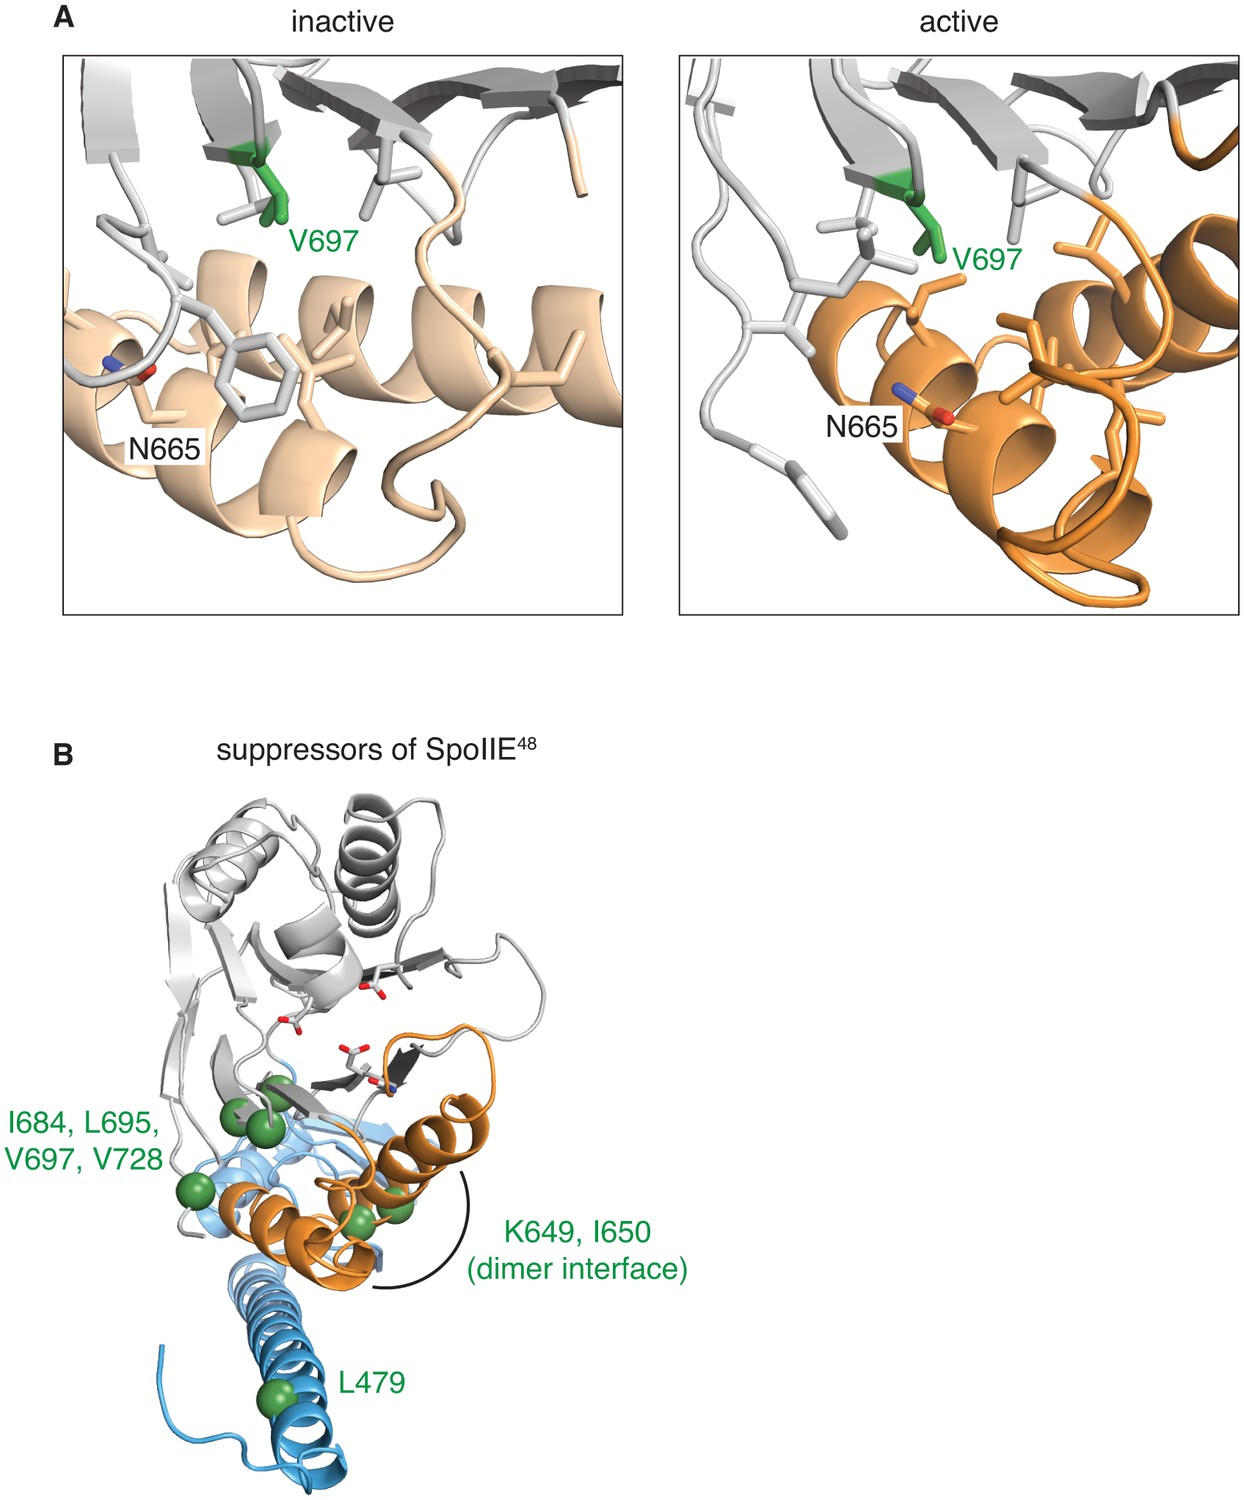
Gain-of-function alleles activate the phosphatase.
A shows the side-chains that surround V697 (green) in the inactive (SpoIIE590–827 left, switch helices in light orange) and active (SpoIIE457–827 right, switch helices in orange) conformations. Residues depicted as sticks are L647, I661, I664, N665, L668, I676, L680, L695, L718, F726, and V728. B is a head-on ribbon representation of SpoIIE457–827 as in Figure 1 with spheres indicating the position of residues substituted in gain-of-function mutants that were isolated as suppressors of the spoIIE48 mutation. The residues are in three clusters: those that contact the switch helices from the PP2C phosphatase domain (I684, L695, V697, and V728), those on the switch helices that make contacts across the dimer interface (K649 and I650), and those that point up towards the switch helix from the long α-helix of the regulatory domain (L479).
Figure 3—figure supplement 3
Manganese binding in the SpoIIE active site.
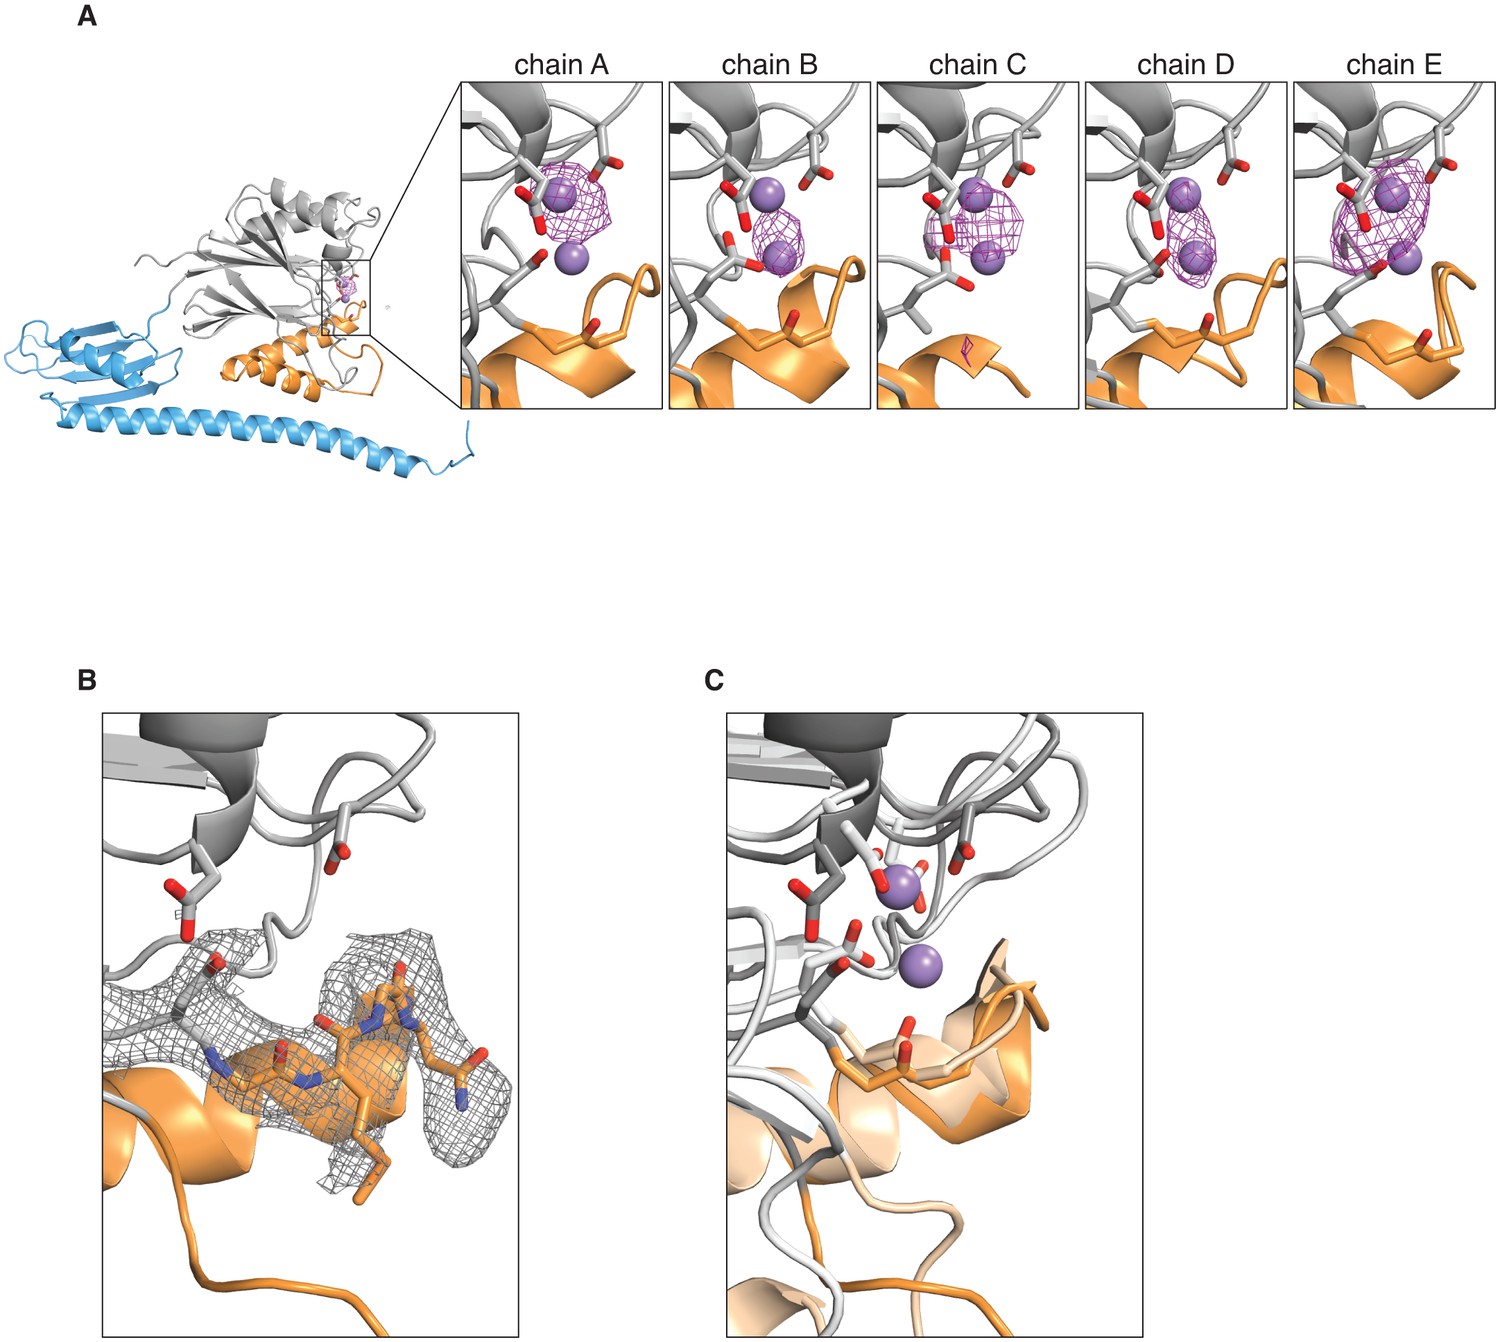
A shows an anomalous difference map calculated from an X-ray dataset collected from manganese-soaked crystals overlaid on the ribbon diagram of SpoIIE457–827 as in Figure 1. The side view of the SpoIIE457–827 structure is shown for chain A, and the inset panels show the active site regions with the putative metal-coordinating side-chains for each of the five chains in the asymmetric unit. The purple spheres represent the manganese ions from superimposed RsbX (PDB ID 3W43, see panel C below), displayed here for reference. The maps are shown with a 4 Å carve radius around the indicated chain and are contoured at 4.0 σ for chains A and B and 3.5 σ for chains C, D, and E. B shows the 2Fo–Fc electron density map from the X-ray data in grey mesh contoured to 1.0 σ with a 2.5 Å carve radius around the active site loop residues 628–635 of SpoIIE457–827. Residues 628–635 are shown as sticks. C shows an overlay of SpoIIE457–827 and RsbX (PDB ID 3W43) aligned based on residues 590–628. SpoIIE457–827 is shown as a darker shade, and RsbX is shown as a lighter shade, and the putative metal-coordinating side-chains of the active sites are shown as sticks. The purple spheres represent the manganese ions from the RsbX structure.
Figure 4 with 1 supplement

The switch promotes manganese binding in the phosphatase active site.
A is a model for phosphatase activation. During sporulation, cellular cues induce dimerization of SpoIIE molecules, rotating the switch helices and leading to Mn2+ binding in the active site. A prediction of this model is that high concentrations of Mn2+ would drive SpoIIE to become activated and form dimers. B shows SEC-MALLS (size exclusion chromatography coupled to multi angle laser light scattering) results for the SpoIIE457-827 fragment to assess complex formation at various concentrations of Mn2+. The top plot shows molecular weights calculated from light scattering and the bottom plot shows the corresponding UV absorbance traces for both wild-type SpoIIE (left-hand side) and the gain-of-function mutant SpoIIEV697A (right). The experiments were performed in the absence of Mn2+ (grey), with 0.25 mM MnCl2 (light purple), and at 1 mM MnCl2 (purple). All experiments were performed in triplicate and data from representative runs are shown. Figure 4—figure supplement 1 shows size exclusion chromatography analysis of additional SpoIIE mutants. The source data are included as Figure 4—source data 1. C is a plot of phosphatase activity (initial rates, vobs) for the wild-type (black) and V697A mutant (purple) SpoIIE457–827 fragments as a function of MnCl2 concentration using SpoIIAA-P as the substrate. The data were fit with the equation vobs=Vmax*[MnCl2]h/(K+[MnCl2]h) where h is the Hill coefficient calculated from the inset panel [Vmax = 4.15 ± 0.04 min–1 (2.28 ± 0.04 min–1 for SpoIIEV697A) and K = 0.32 ± 0.02 mM (0.020 ± 0.002 mM for SpoIIEV697A)]. The K1/2 values reported in the text were calculated from this equation and represent the concentration of MnCl2 at which SpoIIE has half maximal activity. Inset is a Hill plot for data points representing 10–90% activity. Lines are linear fits to the data using the equation log(vobs/(Vmax–vobs))=h*log[MnCl2]–logK [h = 2.0 ± 0.1 (1.92 ± 0.1 for SpoIIEV697A) and K = 0.31 ± 0.04 mM (0.022 ± 0.008 mM for SpoIIEV697A)]. The reported error is the error of the fit to the data. Experiments were repeated at least three times and data from a representative experiment are shown. The source data are included as Figure 4—source data 1.
-
Figure 4—source data 1
Source data for Figure 4B and C.
Provided is a spreadsheet with source data for Figure 4 panels B and C. Data for size-exclusion chromatography (panel B), molecular weight determined by MALLS (panel B) and phosphatase activity (panel C) are provided as separate sheets.
- https://doi.org/10.7554/eLife.26111.016
Figure 4—figure supplement 1
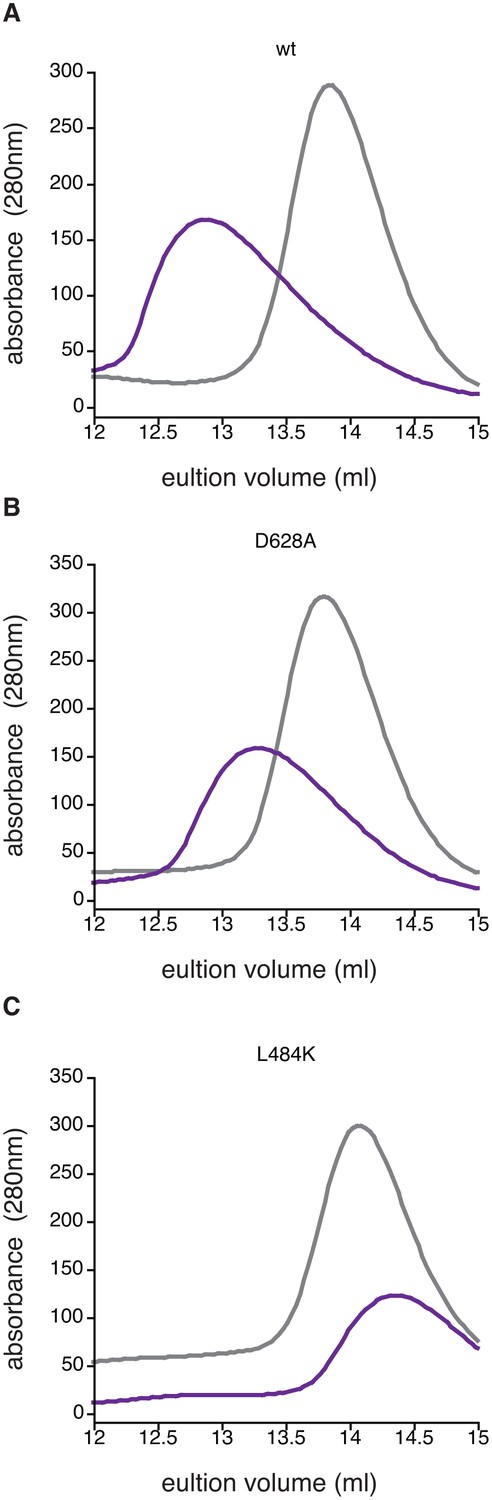
Manganese-induced dimerization requires the active site and dimer interface.
Shown is size exclusion chromatography analysis in the absence of manganese (grey) or in the presence of 1 mM MnCl2 (purple) for 200 µM wild type (Panel A), SpoIIED628A (Panel B), and SpoIIEL484K (Panel C). The fact that some dimerization still occurs for the D628A variant was not unexpected because the other metal-coordinating residues are still present (including G629) and high concentrations of protein and MnCl2 were used in the experiment.
Figure 5 with 5 supplements
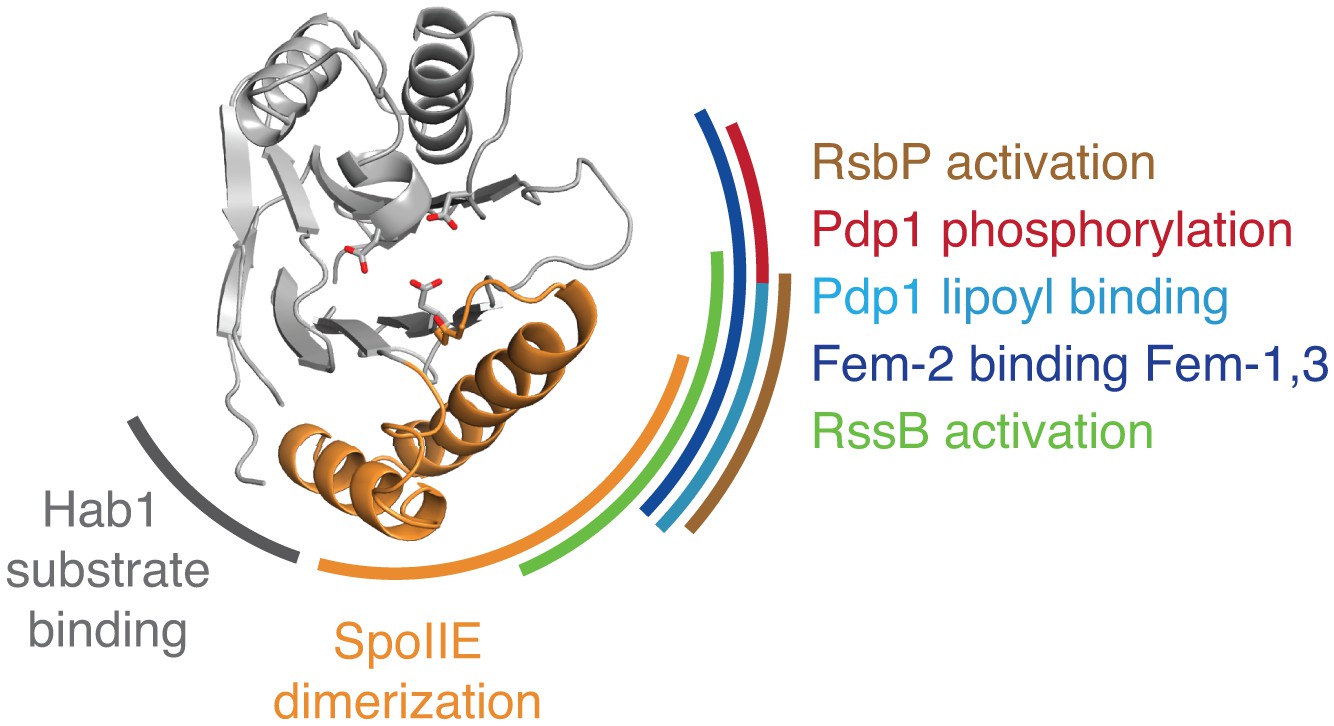
Evidence that the switch mechanism is broadly conserved among phosphatases.
The structure of the active SpoIIE457–827 phosphatase domain is shown in the center. The SpoIIE dimerization interface that mediates activation is indicated with an orange arc. Similarly, additional arcs indicate regions where regulatory inputs impinge on the PP2C phosphatase domain for RsbP (brown, Figure 5—figure supplement 1), Pdp1 (phosphorylation is shown in red, and lipoyl binding is shown in teal, Figure 5—figure supplement 2), Fem-2 (blue, Figure 5—figure supplement 3), Hab1 (grey, Figure 5—figure supplement 4), and RssB (green, Figure 5—figure supplement 5). The diagram is based on structures illustrated in Figure 5—figure supplements 1–5.
Figure 5—figure supplement 1

Gain-of-function bypass suppressors suggest that the switch controls the energy stress response PP2C phosphatase RsbP.
A shows the regulatory cascade in which the PP2C phosphatase RsbP activates the transcription factor σB. In response to energy stress RsbP is activated as a phosphatase and dephosphorylates RsbV-P, which binds to the anti-sigma factor RsbW and displaces σB, which then is competent to activate transcription. B shows the position of bypass suppressor substitutions that activate RsbP in the absence of RsbQ, the stress-responsive activator of RsbP. The positions of these substitutions are mapped onto the structure of RssB (PDB ID 3F7A) by homology (no structure of RsbP is available) and are indicated with spheres in green. Residues shown are RsbP 173, 181, 211, 230, 233, 241, 242, 244, and 246 (corresponding to RssB residues 159, 166, 199, 215, 218, 228, 229, 231, and 233). The α-helix corresponding to the predicted α0 helix of the RsbP regulatory domain is blue, and the switch helices are orange.
Figure 5—figure supplement 2

Structural evidence that the switch is used to control pyruvate dehydrogenase phosphatase.
A diagrams how the PP2C phosphatase pyruvate dehydrogenase phosphatase (Pdp1) promotes flux through the TCA cycle by activating pyruvate dehydrogenase. B is a ribbon diagram of Pdp1 (PDB ID 2PNQ). The PP2C phosphatase domain is in grey with tyrosine-94, which is phosphorylated to inhibit the activity of Pdp1, in red sticks, and the switch helices in orange. The metal-coordinating residues of the active site are shown in stick representation. A Pdp1-specific insertion, colored in blue, contains the predicted activating binding site for lipoyl groups from the E2 subunit of pyruvate dehydrogenase, as indicated.
Figure 5—figure supplement 3

Structural evidence that the switch is used to control the sex-determining PP2C phosphatase FEM-2.
A diagrams how the PP2C phosphatase Fem-2, together with FEM-1 and FEM-3, promotes sex determination in C. elegans. B is a ribbon diagram of FEM-2 (PDB ID 4JND). The PP2C phosphatase domain is grey, the switch helices are orange, and the N-terminal domain that binds FEM-1 and FEM-3 is blue. The metal-coordinating sidechains of the active site are shown as sticks, and the magnesium ions are shown as green spheres.
Figure 5—figure supplement 4

The switch for the drought responsive PP2C phosphatase Hab1 switch could coordinate phosphatase activity and substrate binding.
A diagrams how the PP2C phosphatase Hab1 promotes drought tolerance in plants. B shows a ribbon diagram of Hab1 (PDB ID 3UJG). The PP2C phosphatase domain is grey, the switch helices are orange, and the ‘flap’ region is blue. The metal-coordinating sidechains of the active site are shown, and the magnesium ions are shown as spheres. C shows a surface representation of Hab1 as in panel B. The contact surface with the kinase SnRK2 (defined as residues within 4 Å) is indicated with a black outline and the ‘lock’ residue W385, which is critical for binding of Hab1 to both its substrate and to the PYR/PYL/RCAR family of abscisic acid binding receptors that inhibit Hab1 activity, is indicated with a red circle. D is an overlay of the structures of dimeric SpoIIE457–827 (switch helices colored dark orange) and monomeric SpoIIE590–827 (switch helices colored light orange) as in Figure 3. The ‘flap’ region of SpoIIE is blue (SpoIIE457–827) or light blue (SpoIIE590–827).
Figure 5—figure supplement 5
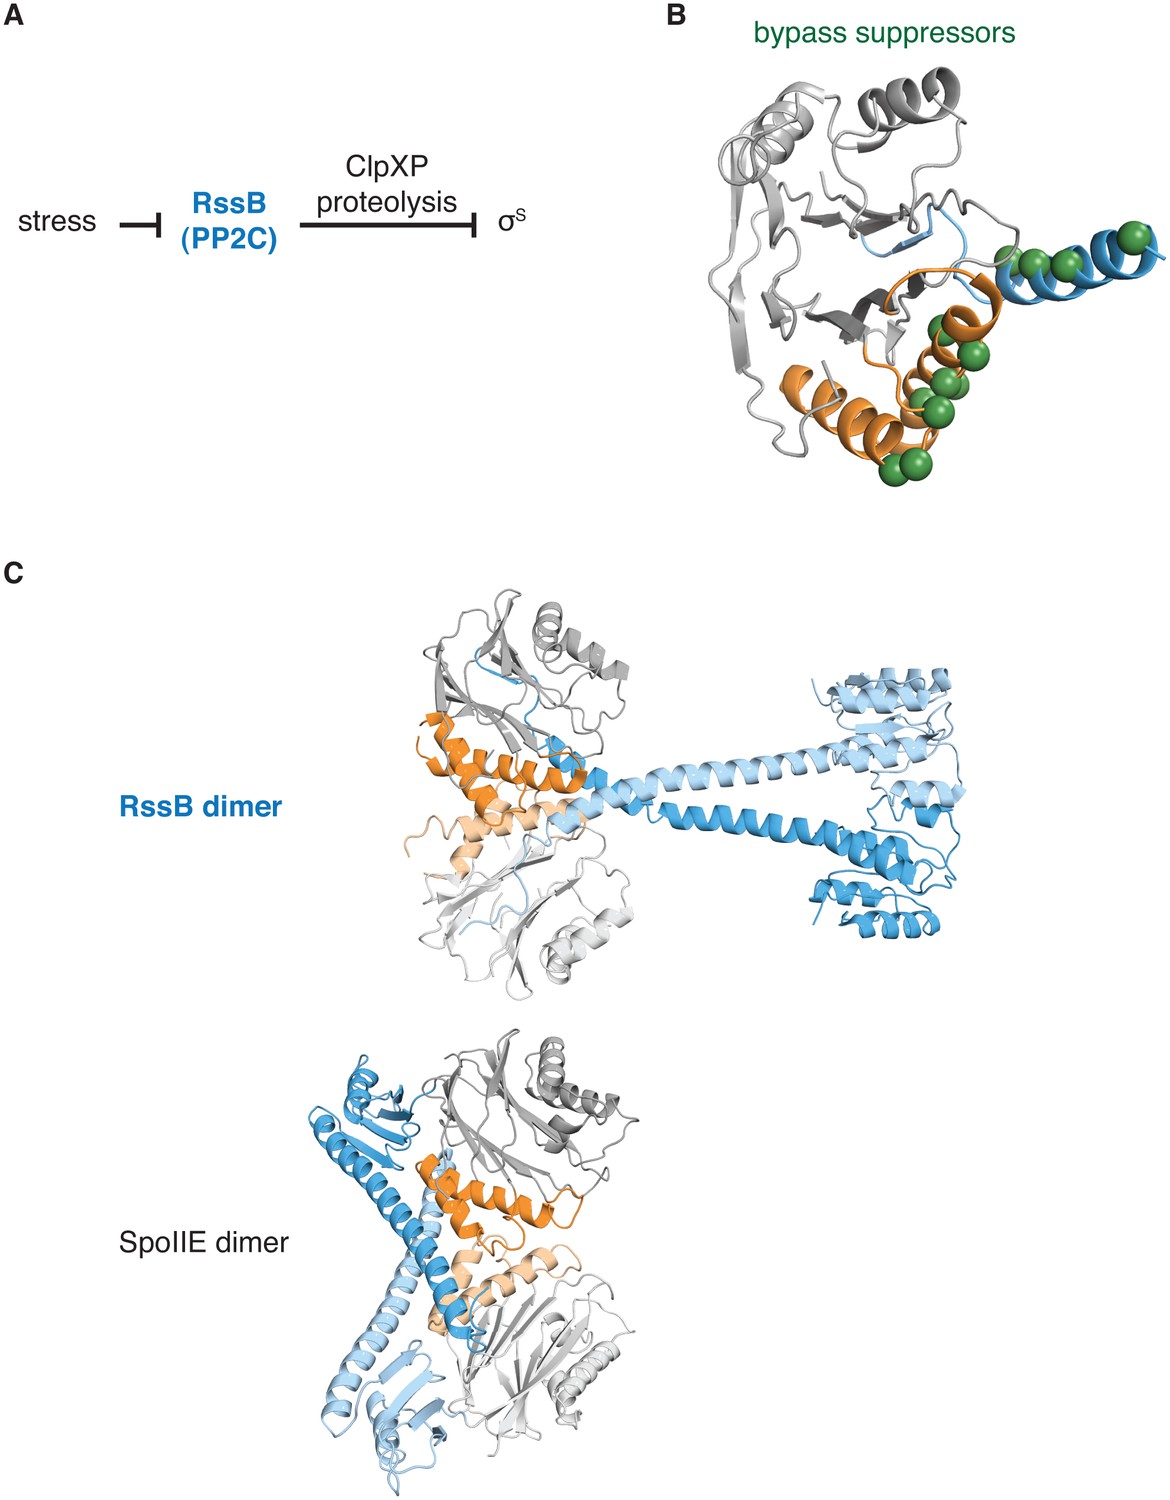
The switch for the pseudo-PP2C phosphatase RssB controls protease adapter activity.
A diagrams how the pseudo-PP2C phosphatase RssB destabilizes σS by acting as an adapter protein for ClpXP proteolysis. B is a ribbon diagram of RssB (PDB ID 3F7A). The PP2C phosphatase domain is grey, the switch helices are orange, and the regulatory region is blue. The positions of bypass suppressor amino acid substitutions (residues 149, 156, 160, 164, 220, 222, 224, 227, 228, 260, 261, and 263 from P. aeruginosa corresponding to residues 146, 150, 154, 158, 214, 216, 218, 221, 222, 254, 255, and 257 from E. coli) that render RssB active in the absence of stress are indicated with spheres. C shows a comparison of the RssB dimer (above) and the SpoIIE457-827 dimer (below). The structures are colored as in panel A.
Figure 6
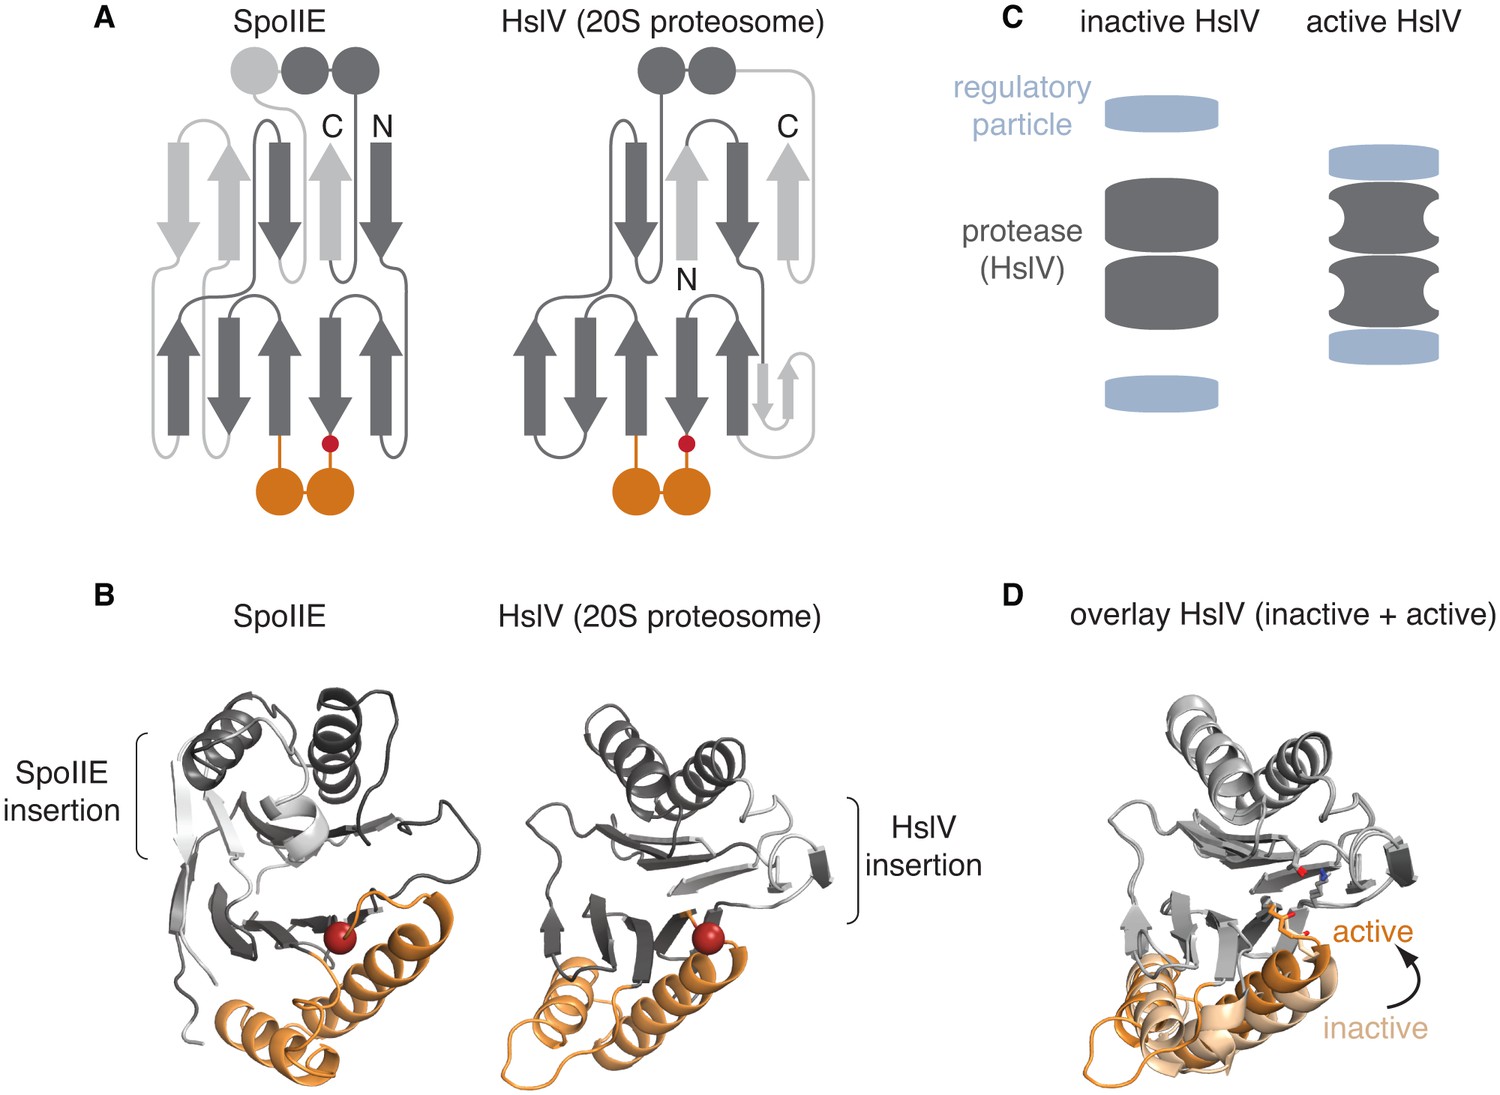
The switch mechanism is shared with proteasome proteases.
A is a secondary structure topology diagram for SpoIIE (left) and for HslV (the E. coli homolog of the proteasome protease; right). β strands are shown as arrows pointing from N to C terminus and α-helices as circles in cross section. Conserved features are dark grey, whereas variable features are light grey. The conserved glycine that moves to activate each protein is indicated with a red circle. The switch helices of SpoIIE and the corresponding α-helices of HslV are colored orange. B shows ribbon diagrams of SpoIIE and HslV (PDB ID 1G3I) colored as in A. The position of the conserved regulatory glycine (G649 in SpoIIE, and G69 in HslV) is shown with a red sphere and the insertions specific to each protein are indicated by brackets. C is a schematic of how the regulatory particle (blue) activates the proteasome proteases (grey). D shows an overlay of the active (PDB ID 1G3I) and inactive (PDB ID 1G3K) states of HslV following superimposition of the regions in grey. The switch helices are color-coded orange and light orange for the active and inactive states, respectively. The active site residues T1, K33, and the carbonyl oxygen of G69 are shown.
Videos
Video 1
The PP2C phosphatase domain of SpoIIE changes conformation upon dimerization.
Shown is the PP2C phosphatase domain of SpoIIE (switch helices in orange) morphing from the structure of SpoIIE590–827 to the structure of SpoIIE457–827. The structures were aligned based on the core of the phosphatase domain excluding the switch region (residues 590–628 and 678–827) as in Figure 3B.
Video 2
PP2C phosphatases and proteasomal proteases share a common conformational switch.
Shown are side-by-side displays of SpoIIE and HslV morphing from the inactive to active states. Shown on the left is the PP2C phosphatase domain of SpoIIE morphing from SpoIIE590–827 (inactive, PDB ID 5MQH) to SpoIIE457–827 (active, PDB ID 5UCG) as in Figure 3B. Shown on the right is HslV morphing from the HslU free structure (inactive, PDB ID 1G3K) to the HslU bound structure (active, PDB ID 1G3I) as in Figure 6D. The switch helices are colored orange and the active site residues of each protein are shown.
Tables
Table 1
Data collection and refinement statistics.
| SpoIIE457-827 (5UCG) | SpoIIE590-827 (5MQH) | |
|---|---|---|
| Data collection | ||
| Beam source | APS 24-ID-C | Diamond, I02 |
| Wavelength (Å) | 0.9792 | 0.97950 |
| Space group | P43212 | C2221 |
| Cell dimensions | ||
| a, b, c (Å) | 125.62, 125.62, 330.70 | 56.29, 122.51, 81.62 |
| α, β, γ (°) | 90, 90, 90 | 90, 90, 90 |
| Resolution (Å)* | 60–3.9 (3.97–3.9) | 61.34–2.44 (2.48–2.44) |
| Total reflections* | 284918 (8031) | 60359 (4228) |
| Unique reflections* | 24917 (1181) | 10961 (681) |
| Rsym†* | 0.102 (1.448) | 0.057 (0.631) |
| CC1/2 | 0.999 (0.847) | 0.999 (0.874) |
| CC* | 1.00 (0.958) | - |
| I / σI* | 24.7 (0.8) | 20.1 (2.8) |
| Completeness (%)* | 99.7 (97.4) | 99.7 (99.8) |
| Redundancy* | 11.4 (6.8) | 6.3 (6.2) |
| Refinement | ||
| Resolution (Å)* | 50–3.9 (4.1–3.9) | 50–2.45 (2.51–2.45) |
| No. reflections | 21558 | 10187 |
| Rwork / Rfree‡* | 0.28/0.32 | 0.21/0.28 |
| No. atoms | ||
| Protein | 13166 | 1783 |
| B-factors | ||
| Protein | 93.0 | 68.0 |
| R.m.s. deviations | ||
| Bond lengths (Å) | 0.002 | 0.010 |
| Bond angles (°) | 0.525 | 1.545 |
| Ramachandran plot | ||
| Favored (%) | 92.48 | 96.9 |
| Allowed (%) | 7.40 | 3.1 |
| Outliers (%) | 0.12 | 0 |
| Rotamer outliers (%) | 6.44 | 15.4 |
-
*Values in parentheses are for highest-resolution shell.
-
†Rsym = ∑hkl∑i|Ii - <I> |/∑hkl∑i <I> where Ii is the intensity of the ith measurement of a reflection with indexes hkl and <I> is the statistically weighted average reflection intensity.
-
‡Rwork = ∑||Fo| - |Fc||/∑|Fo| where Fo and Fc are the observed and calculated structure factor amplitudes, respectively. Rfree is the R-factor calculated with 5% of the reflections chosen at random and omitted from refinement.
Table 2
Data collection statistics for anomalous datasets.
| SpoIIE457-827 Mn | SpoIIE457-827 SeMet | |
|---|---|---|
| Data collection | ||
| Beam source | APS 24-ID-C | APS 24-ID-E |
| Space group | P43212 | P43212 |
| Cell dimensions | ||
| a, b, c (Å) | 124.783, 124.783, 329.787 | 123.081, 123.081, 329.556 |
| α, β, γ (°) | 90, 90, 90 | 90, 90, 90 |
| Inflection | Inflection | |
| Wavelength (Å) | 1.89350 | 0.97920 |
| Resolution (Å)* | 50–5.4 (5.49 — 5.4) | 50–5.7 (5.8–5.7) |
| Total reflections* | 40325 (318) | 51233 (4024) |
| Unique reflections* | 8598 (187) | 8071 (706) |
| Rsym* | 0.145 (0.535) | 0.175 (1.475) |
| CC1/2* | 0.99 (0.75) | 0.996 (0.459) |
| CC* * | 0.997 (0.926) | 0.999 (0.793) |
| Mean I / σI* | 9.14 (1.00) | 7.86 (1.13) |
| Completeness (%)* | 90.1 (41.6) | 99.0 (97.4) |
| Redundancy* | 4.7 (1.7) | 6.3 (5.7) |
-
*Values in parentheses are for highest-resolution shell.
Table 3
Table of strains. B. subtilis strains (all strains are in the background of PY79-RL3).
| Strain # | Genotype | Reference |
|---|---|---|
| RL3 | prototrophic | Youngman et al., 1984 |
| RL5874 | spoIIE::kan yxiD::spoIIE-yfp spc amyE::PspoIIE-cfp cm | Bradshaw and Losick, 2015 |
| RL5902 | spoIIE::kan yhdGH::PspoIIQ-cfp tet amyE::spoIIE-yfp L646K spc | Bradshaw and Losick, 2015 |
| RL5904 | spoIIE::kan yhdGH::PspoIIQ-cfp tet amyE::spoIIE-yfp Q483A spc | Bradshaw and Losick, 2015 |
| RL5905 | spoIIE::kan yhdGH::PspoIIQ-cfp tet amyE::spoIIE-yfp G486K spc | Bradshaw and Losick, 2015 |
| RL5907 | spoIIE::kan yhdGH::PspoIIQ-cfp tet amyE::spoIIE-yfp E639K spc | Bradshaw and Losick, 2015 |
| RL6198 | spoIIE::kan yhdGH::PspoIIQ-cfp tet amyE::spoIIE-yfp V480K spc | this study |
| RL6199 | spoIIE::kan yhdGH::PspoIIQ-cfp tet amyE::spoIIE-yfp A481K spc | this study |
| RL6200 | spoIIE::kan yhdGH::PspoIIQ-cfp tet amyE::spoIIE-yfp L484K spc | this study |
| RL6201 | spoIIE::kan yhdGH::PspoIIQ-cfp tet amyE::spoIIE-yfp V487K spc | this study |
| RL6202 | spoIIE::kan yhdGH::PspoIIQ-cfp tet amyE::spoIIE-yfp S488K spc | this study |
| RL6203 | spoIIE::kan yhdGH::PspoIIQ-cfp tet amyE::spoIIE-yfp V490K spc | this study |
| RL6204 | spoIIE::kan yhdGH::PspoIIQ-cfp tet amyE::spoIIE-yfp M491K spc | this study |
| RL6205 | spoIIE::kan yhdGH::PspoIIQ-cfp tet amyE::spoIIE-yfp D493K spc | this study |
| RL6206 | spoIIE::kan yhdGH::PspoIIQ-cfp tet amyE::spoIIE-yfp F494K spc | this study |
| RL6207 | spoIIE::kan yhdGH::PspoIIQ-cfp tet amyE::spoIIE-yfp S495K spc | this study |
| RL6208 | spoIIE::kan yhdGH::PspoIIQ-cfp tet amyE::spoIIE-yfp E497K spc | this study |
| RL6209 | spoIIE::kan yhdGH::PspoIIQ-cfp tet amyE::spoIIE-yfp I498K spc | this study |
| RL6210 | spoIIE::kan yhdGH::PspoIIQ-cfp tet amyE::spoIIE-yfp E642K spc | this study |
| RL6211 | spoIIE::kan yhdGH::PspoIIQ-cfp tet amyE::spoIIE-yfp I650K spc | this study |
| RL6212 | spoIIE::kan yhdGH::PspoIIQ-cfp tet amyE::spoIIE-yfp T663K spc | this study |
| RL6213 | spoIIE::kan yhdGH::PspoIIQ-cfp tet amyE::spoIIE-yfp I667K spc | this study |
| RL5915 | spoIIE::kan yhdGH::PspoIIQ-cfp tet amyE::spoIIE-∆tag-yfp L646K spc | Bradshaw and Losick, 2015 |
| RL6246 | spoIIE::kan yhdGH::PspoIIQ-cfp tet amyE::spoIIE-∆tag-yfp V480K spc | this study |
| RL6247 | spoIIE::kan yhdGH::PspoIIQ-cfp tet amyE::spoIIE-∆tag-yfp L484K spc | this study |
| RL6248 | spoIIE::kan yhdGH::PspoIIQ-cfp tet amyE::spoIIE-∆tag-yfp V487K spc | this study |
| RL6249 | spoIIE::kan yhdGH::PspoIIQ-cfp tet amyE::spoIIE-∆tag-yfp F494K spc | this study |
| RL6250 | spoIIE::kan yhdGH::PspoIIQ-cfp tet amyE::spoIIE-∆tag-yfp I498K spc | this study |
| RL6251 | spoIIE::kan yhdGH::PspoIIQ-cfp tet amyE::spoIIE-∆tag-yfp I650K spc | this study |
| RL6252 | spoIIE::kan yhdGH::PspoIIQ-cfp tet amyE::spoIIE-∆tag-yfp T663K spc | this study |
| RL6253 | spoIIE::kan yhdGH::PspoIIQ-cfp tet amyE::spoIIE-∆tag-yfp M491K spc | this study |
| E. coli strains | ||
| RL6214 | BL21 (DE3) pET47b H6-3C-spoIIE 457–827 | This study |
| RL6215 | BL21 (DE3) pET47b H6-3C-spoIIE 457–827 V697A | this study |
| RL6216 | BL21 (DE3) pET47b H6-3C-spoIIE 457–827 D628A | this study |
| RL6217 | BL21 (DE3) pET47b H6-3C-spoIIE 457–827 L484K | this study |
| RL6218 | BL21 (DE3) pET23a H6-sumo-spoIIAA | Bradshaw and Losick, 2015 |
| RL6219 | BL21 (DE3) pET23a H6-sumo-spoIIAB | Bradshaw and Losick, 2015 |
| AW2001 | BL21 (DE3) pET-YSBLIC H6-3C-spoIIE 590–827 A624I | Levdikov et al., 2012 |
| AW2002 | BL21 (DE3) pET-YSBLIC H6-3C-spoIIAA spoIIAB | Levdikov et al., 2012 |
Download links
A two-part list of links to download the article, or parts of the article, in various formats.
Downloads (link to download the article as PDF)
Open citations (links to open the citations from this article in various online reference manager services)
Cite this article (links to download the citations from this article in formats compatible with various reference manager tools)
A widespread family of serine/threonine protein phosphatases shares a common regulatory switch with proteasomal proteases
eLife 6:e26111.
https://doi.org/10.7554/eLife.26111


