Pervasive epigenetic effects of Drosophila euchromatic transposable elements impact their evolution
- Lawrence Berkeley National Laboratory, United States
- University of California Berkeley, United States
Figures
Figure 1

Epigenetic states of euchromatic sequences around TEs.
Euchromatic sequences around TEs are enriched for (A) repressive epigenetic marks (H3K9me2, H3K9me3, and HP1a), (B) and depleted for active epigenetic marks (H3K4me2 and H3K4me2) in Oregon-R. Different colors represent different developmental stages. Plots were generated using LOESS smoothing (span = 10%).
Figure 2 with 3 supplements
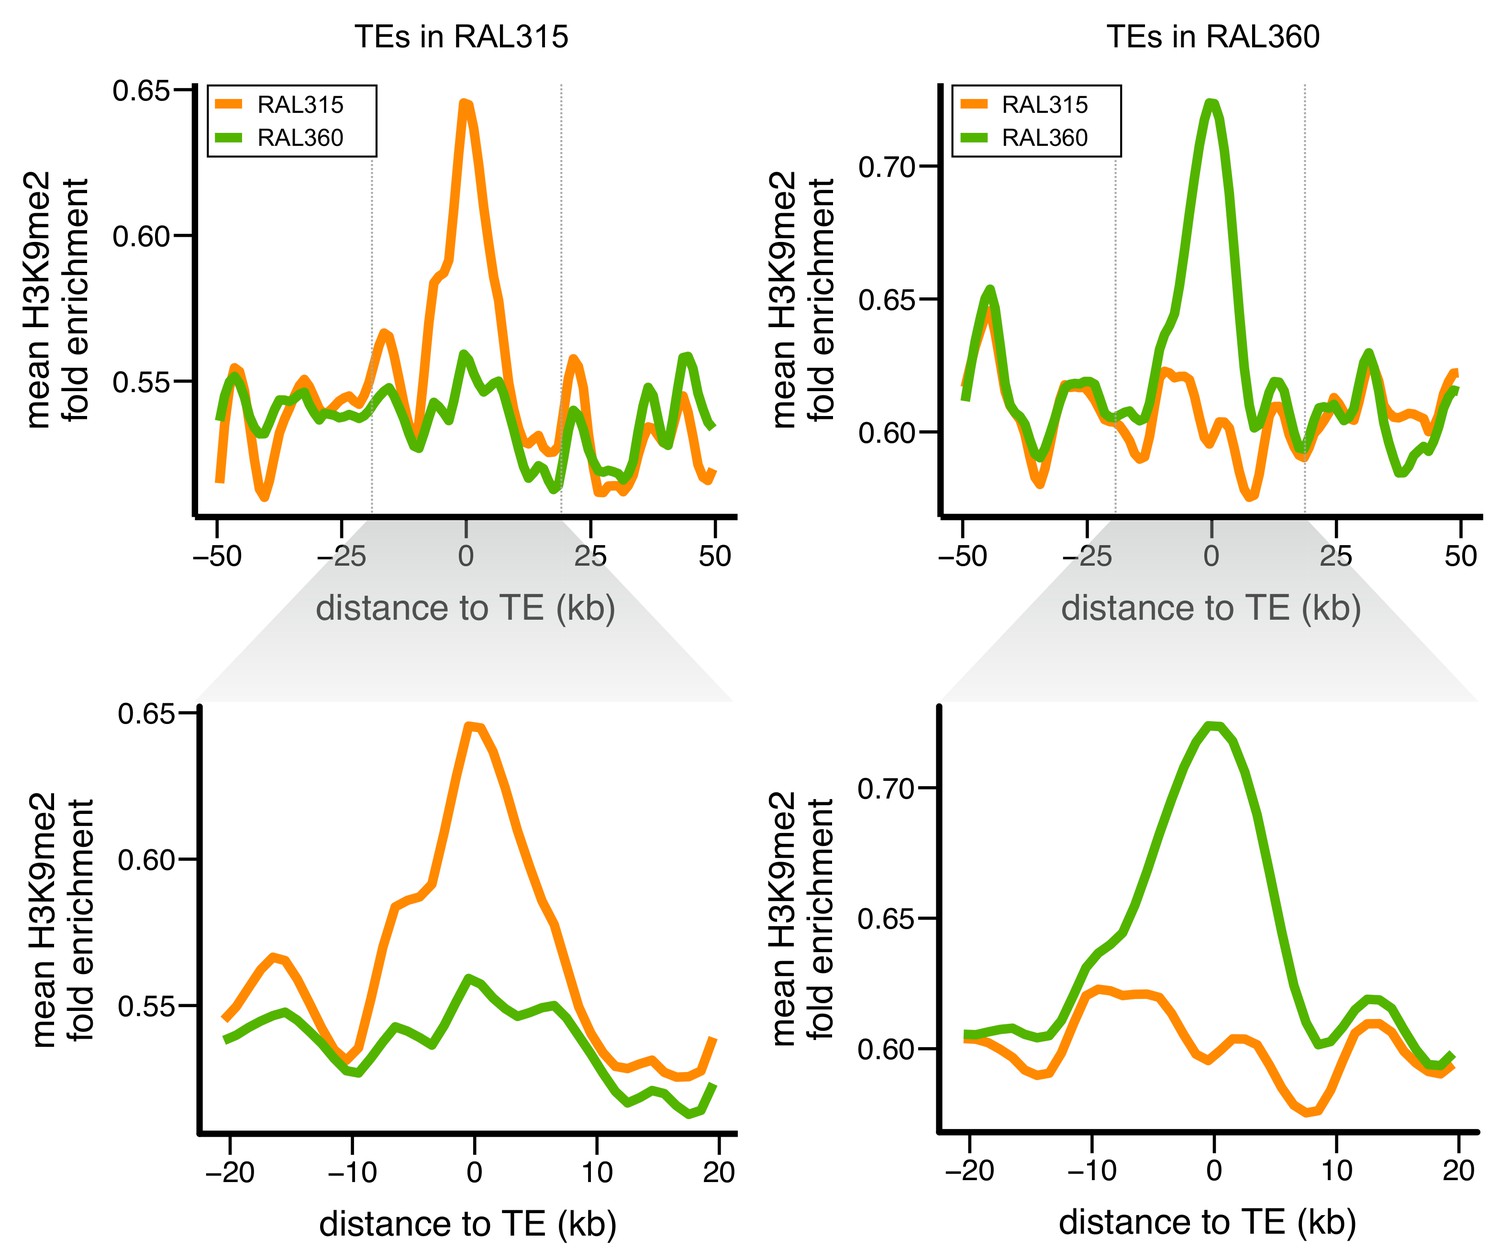
Euchromatic sequences around TE insertions are enriched for H3K9me2.
Levels of H3K9me2 enrichment were compared between homologous sequences of two D. melanogaster strains. Left: sequences around TEs in strain RAL315 that are absent in RAL360. Right: sequences around TEs in strain RAL360 that are absent in RAL315. H3K9me2 fold enrichment was averaged over all euchromatic sequences flanking the analyzed TEs. Plots were generated using LOESS smoothing (span = 10%). Upper figures show ±50 kb around TE insertions, while lower figures show expanded views of ±20 kb.
-
Figure 2—source data 1
Estimates of epigenetic effects for D. melanogaster TE insertions.
- https://doi.org/10.7554/eLife.25762.005
Figure 2—figure supplement 1
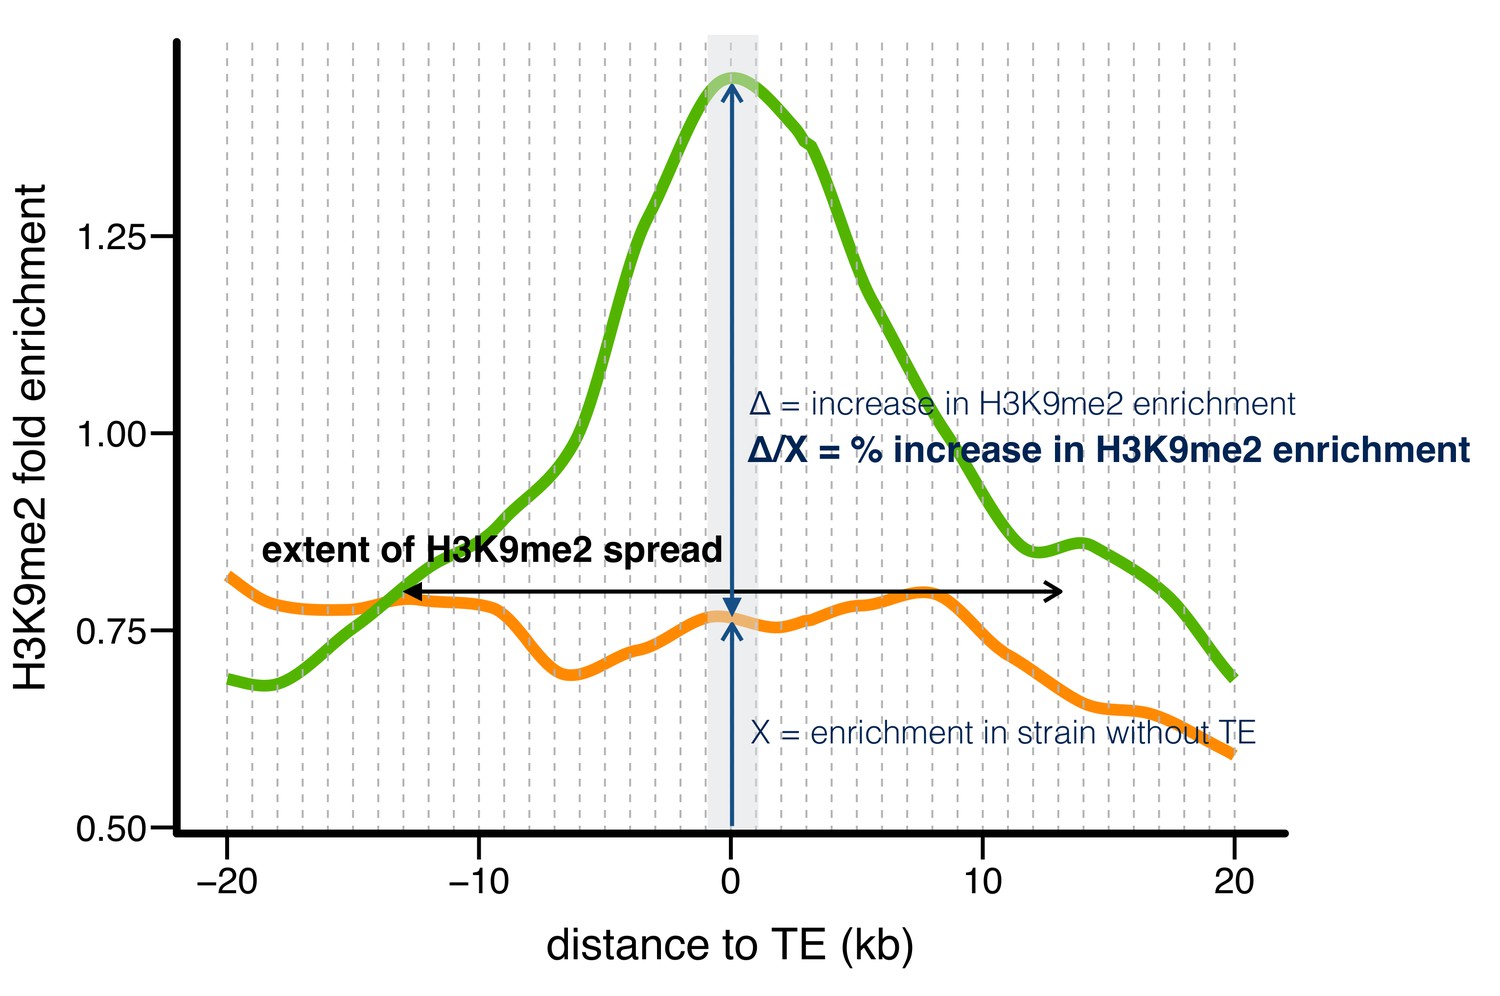
Three indexes describing the epigenetic effects of TE insertions.
Taking one TE present in RAL360 (green line) and absent in RAL315 (orange line) as an example, we compared H3K9me2 fold enrichment in the two strains for 20 kb on each side of the insertion site (40 kb total), using 1 kb nonoverlapping windows (dashed lines). A TE is counted as having epigenetic effects if the H3K9me2 enrichment is significantly higher (determined by Mann-Whitney U test) in the strain with the TE (RAL360 here, green line) than in the strain lacking the TE (RAL 315 here, orange line) in 0–1 kb windows around TE insertion site (shaded gray area). The ‘extent of H3K9me2 spread’ is the farthest window in which H3K9me2 enrichment was consecutively and significantly higher in the strain with the TE. Note that H3K9me2 enrichment needs to be significantly higher in windows on both left and right sides of TE insertions. The ‘% increase in H3K9me2 enrichment’ is the difference in H3K9me2 enrichment between the two strains, divided by the enrichment level of the strain without TE, in 0–1 kb windows (shaded gray area).
Figure 2—figure supplement 2
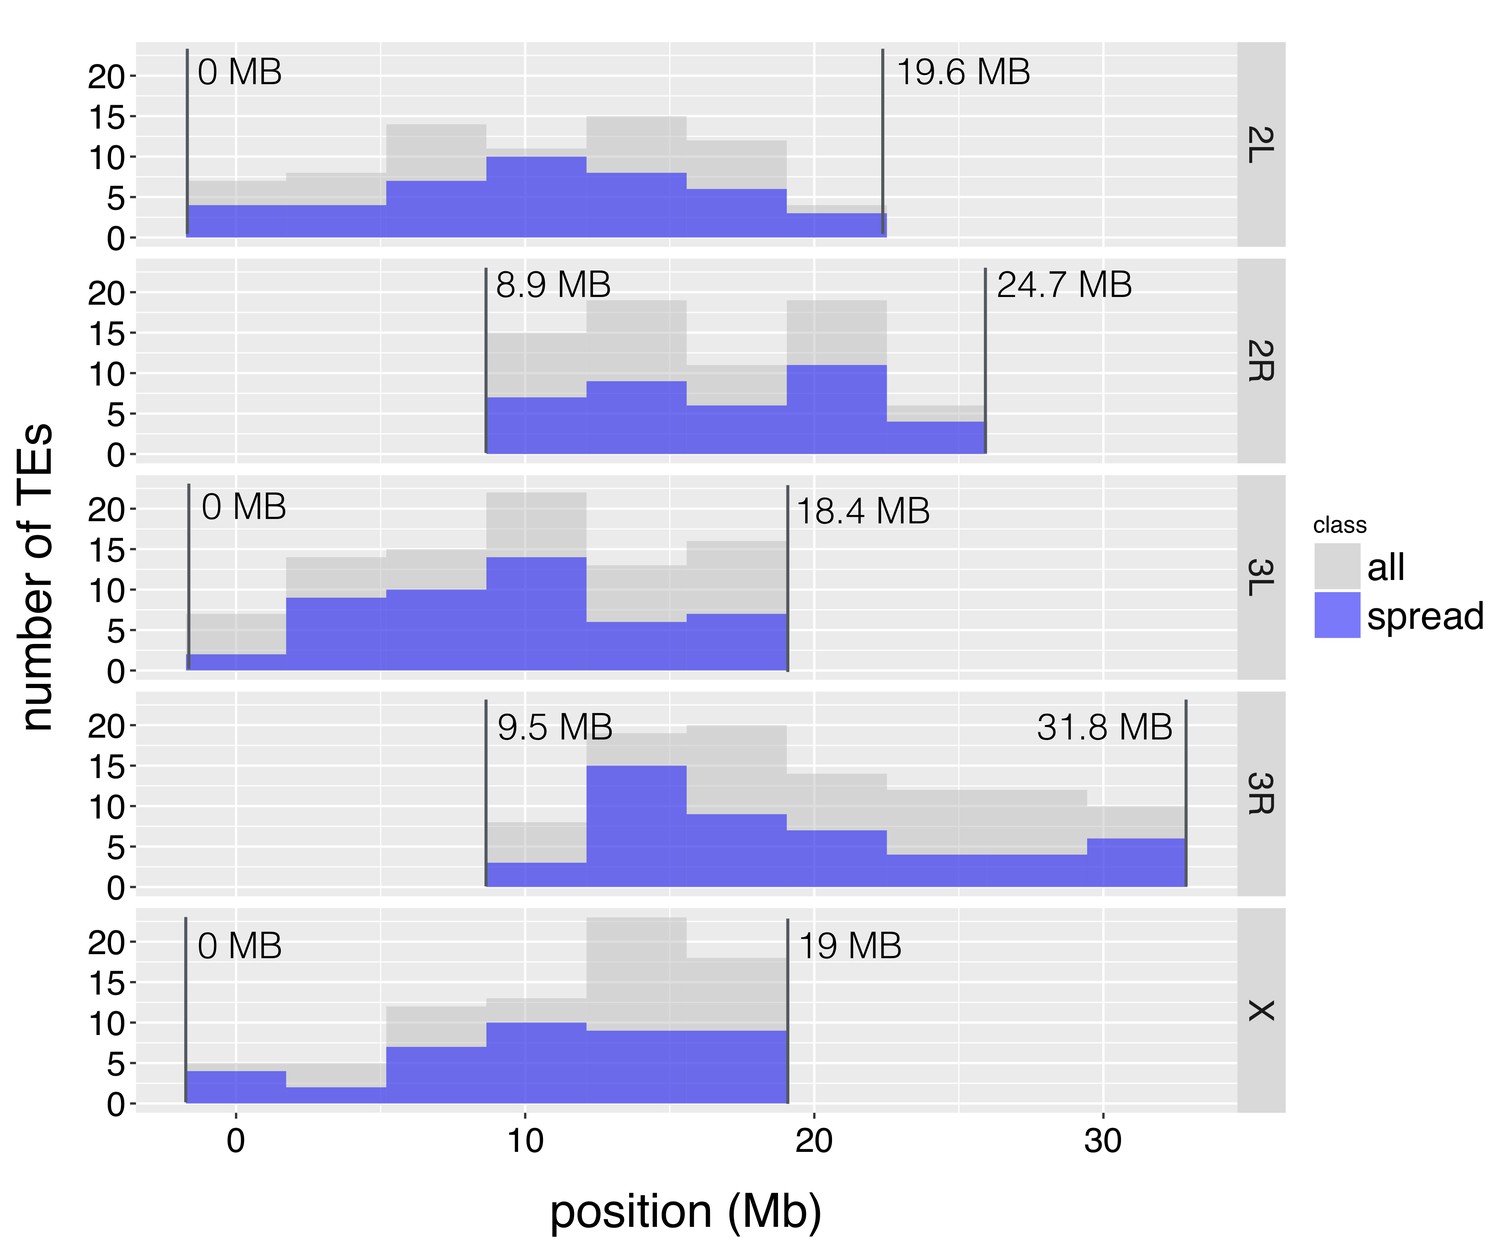
The distribution of TE insertions with epigenetic effects.
The number of TE insertions analyzed at each genomic window is represented with gray bars, while the number of such TE insertions with epigenetic effects is represented with blue bars. The start and end of euchromatic regions analyzed are labeled with vertical lines.
Figure 2—figure supplement 3
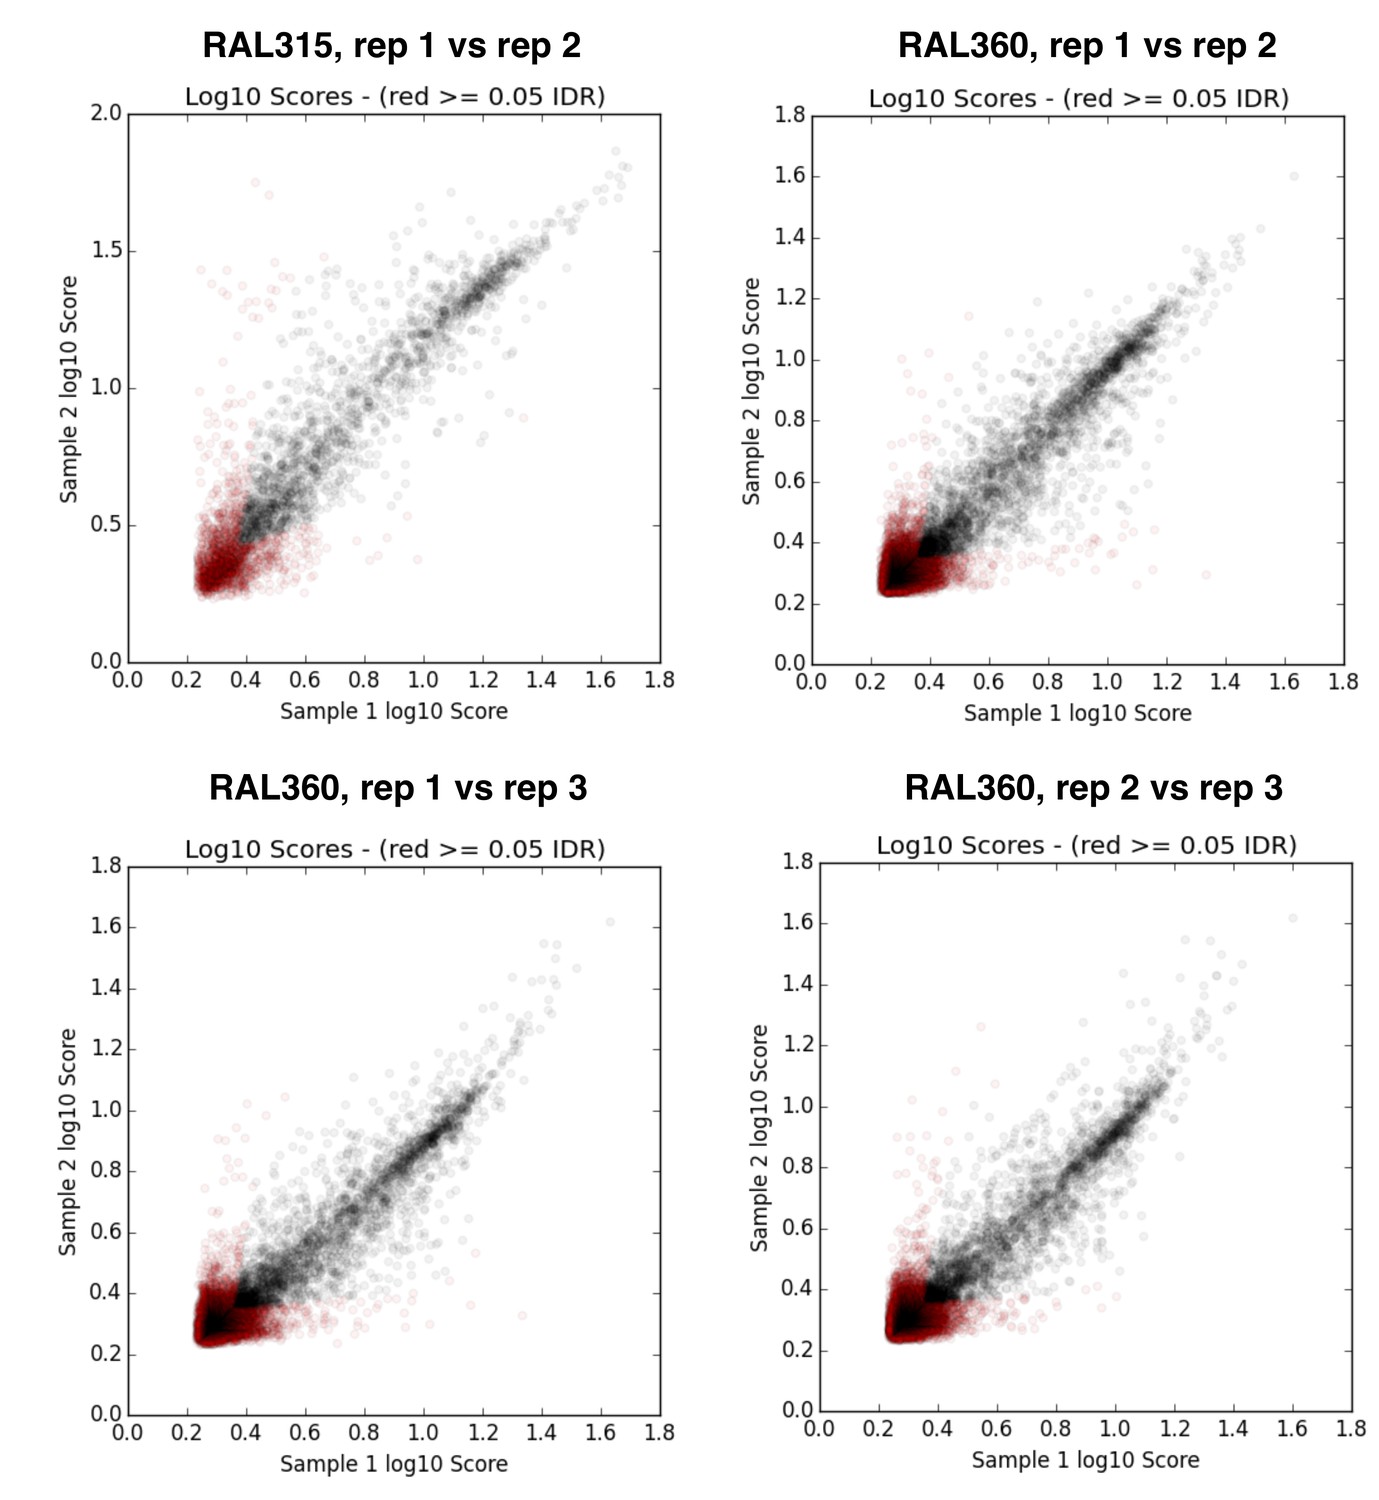
IDR (irreproducible rate) analysis plots (Li et al., 2011) for replicates of D. melanogaster RAL strain ChIP samples.
https://doi.org/10.7554/eLife.25762.008
Figure 3
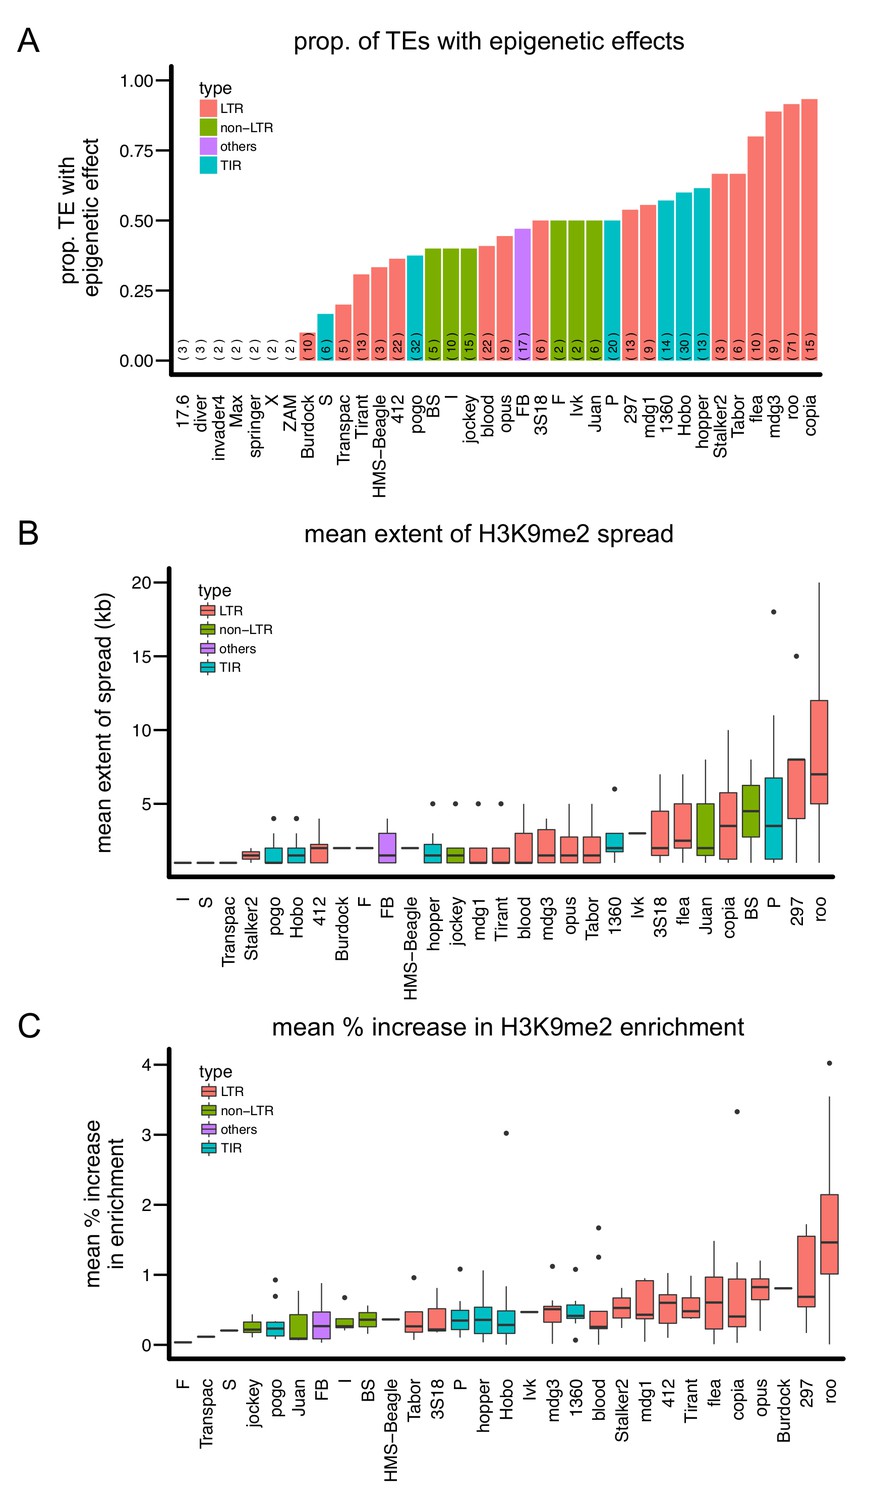
Variation in the epigenetic effects of different TE families.
There is substantial variation in the (A) proportion of TEs with epigenetic effects, (B) mean extent of H3K9me2 spread, and (C) mean % increase in H3K9me2 enrichment of the TE families analyzed. Different colors denote different types of TEs. The number of observations for each TE family is in parenthesis in (A).
Figure 4 with 1 supplement
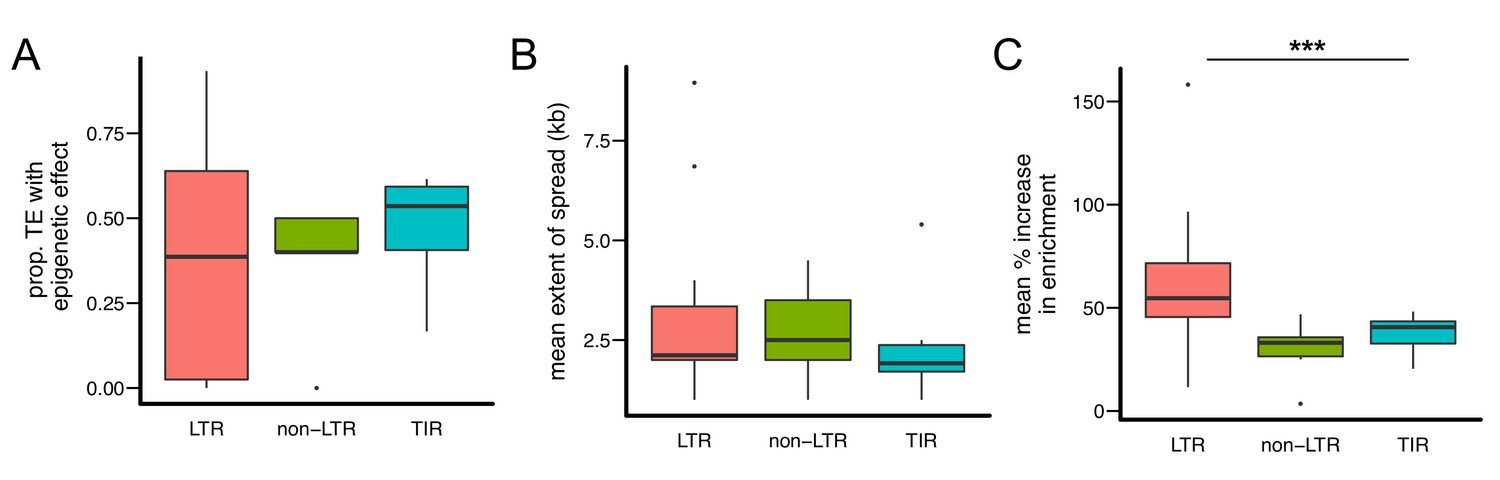
Quantitative analysis of the epigenetic effects of different types of TE families.
While there are no significant differences in (A) the proportion of TEs with epigenetic effects and (B) the mean extent of H3K9me2 spread, (C) TE insertions of LTR-type families lead to significantly higher mean % increase of H3K9me2 enrichment in flanking sequences. Note that each data point represents one TE family. (*** Kruskal-Wallis test p<0.005).
Figure 4—figure supplement 1
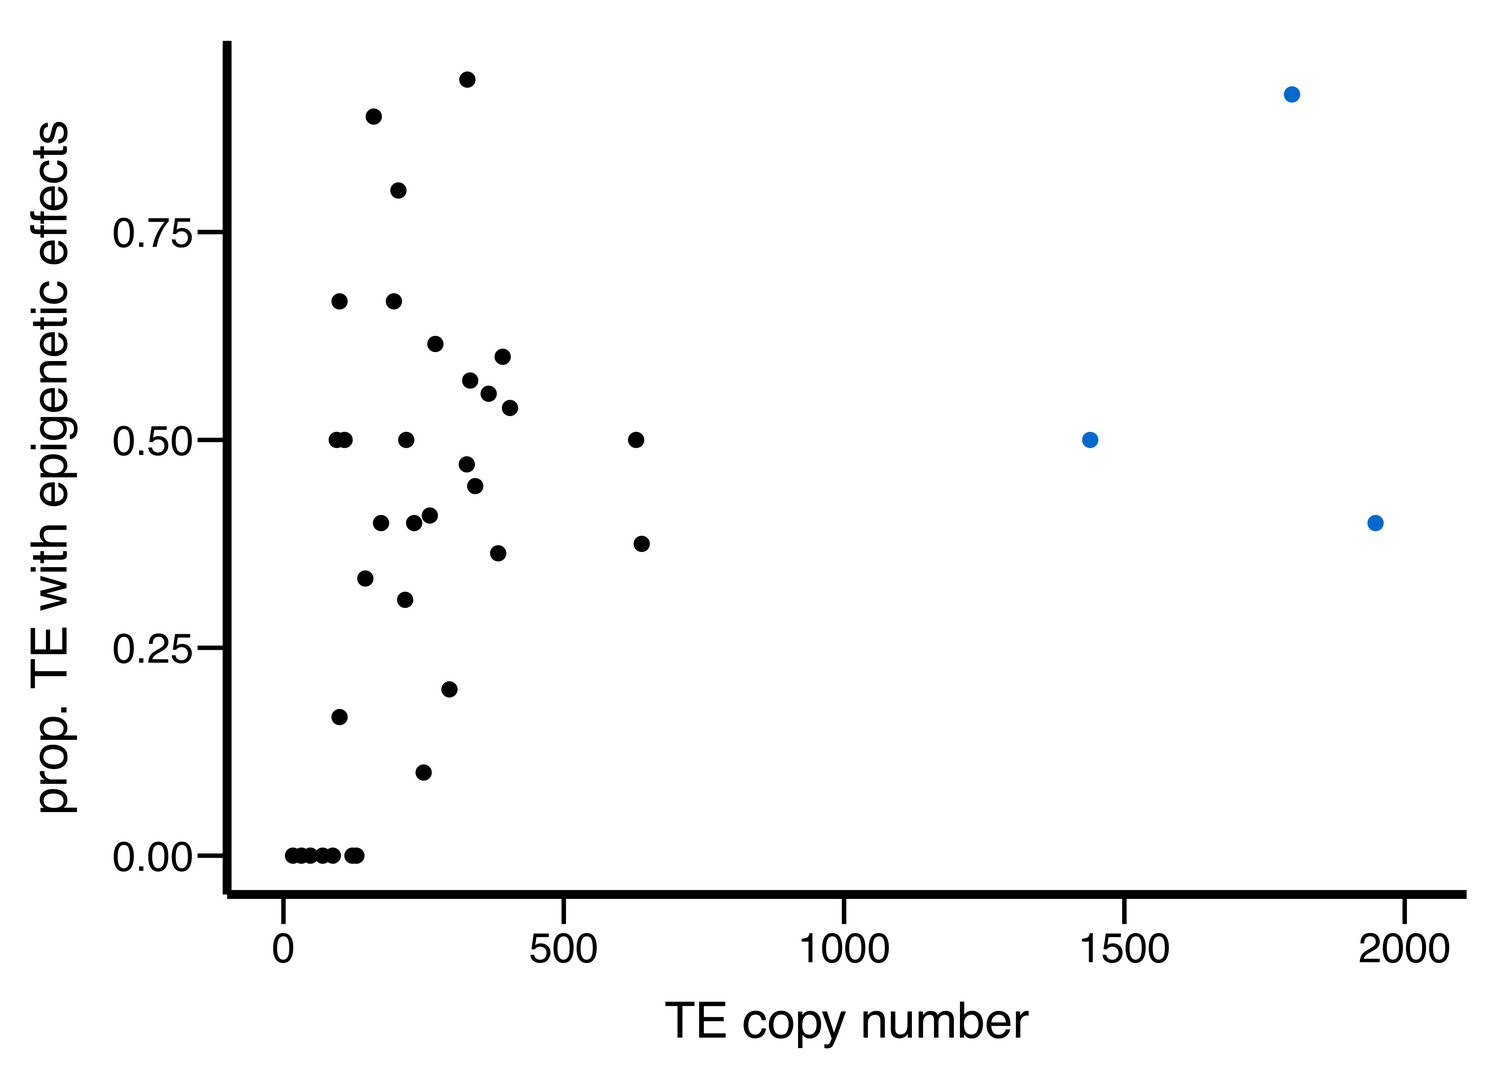
Scatter plot for the abundance of a TE family (X-axis) and the proportion of TEs with epigenetic effects (Y-axis).
Outlier TE families are denoted in blue.
Figure 5 with 3 supplements
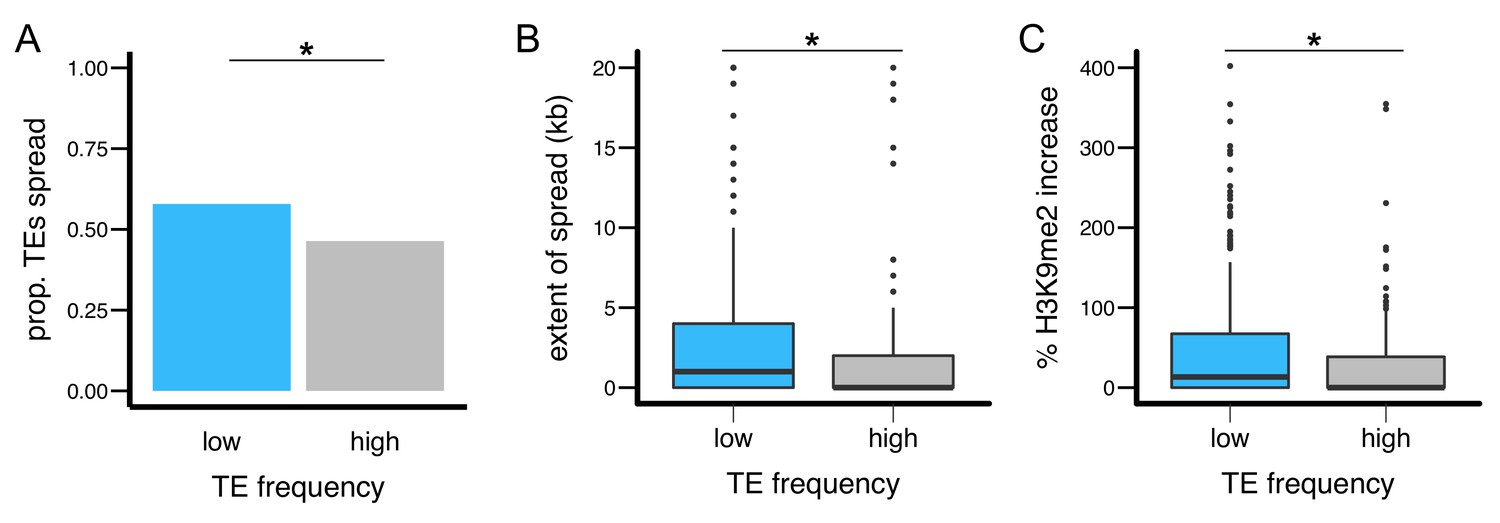
TEs with different population frequencies show different strength of epigenetic effects.
TEs with low population frequencies are (A) more likely to show spread of H3K9me2, (B) result in more extensive spread of H3K9me2, and (C) lead to a larger increase in H3K9me2 enrichment. (*Mann-Whitney U test, p<0.05).
Figure 5—figure supplement 1
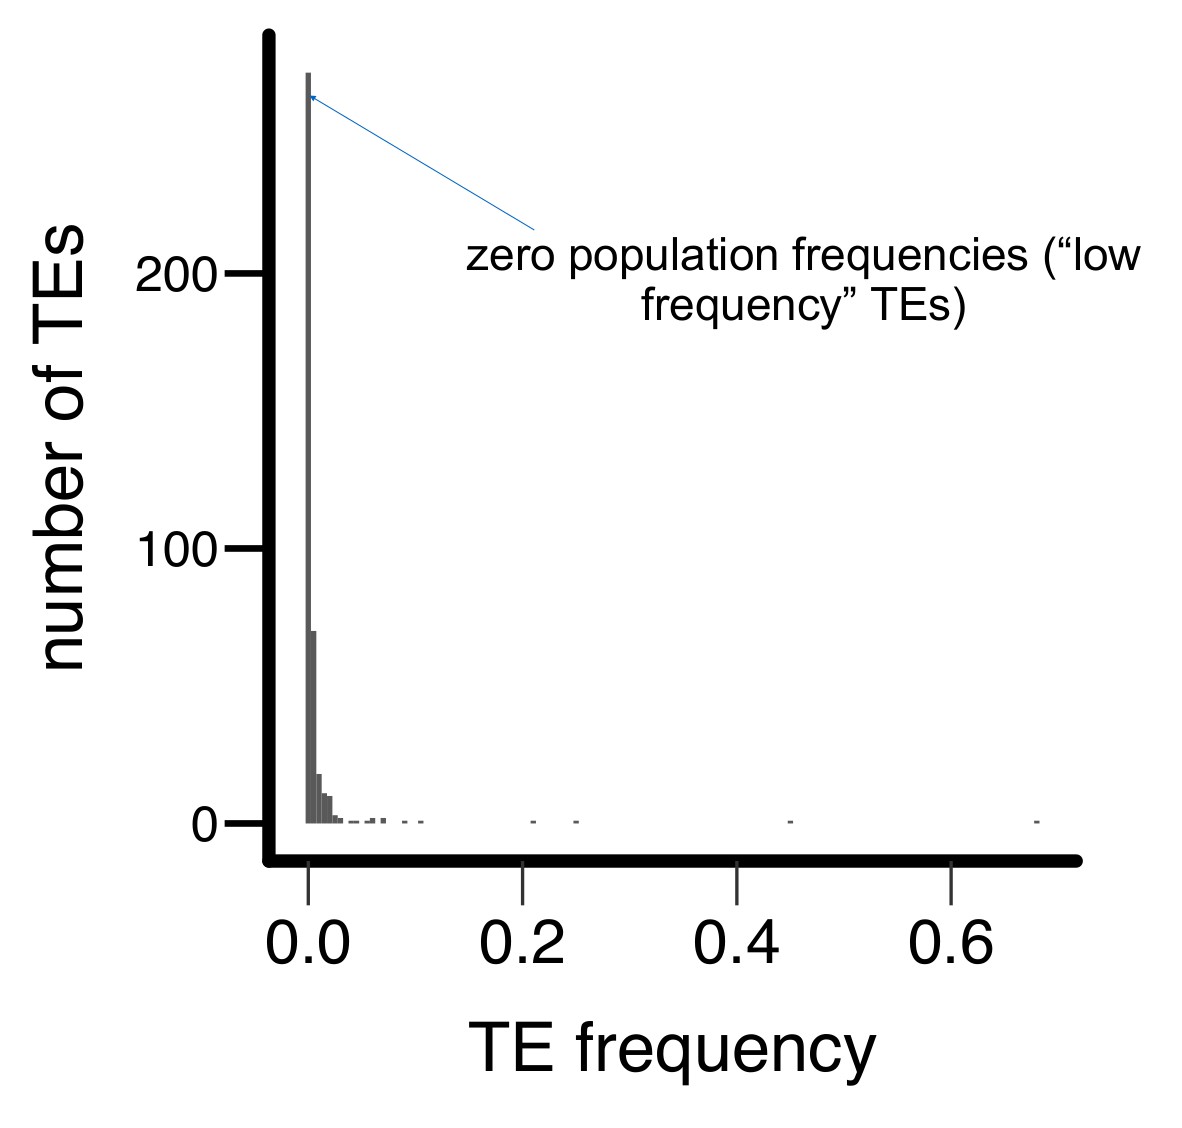
Histogram for the population frequencies of analyzed TE insertions in the Zambian population.
Most TEs have zero (‘low frequency’ TEs, see text) or low population frequencies in the Zambian population.
Figure 5—figure supplement 2
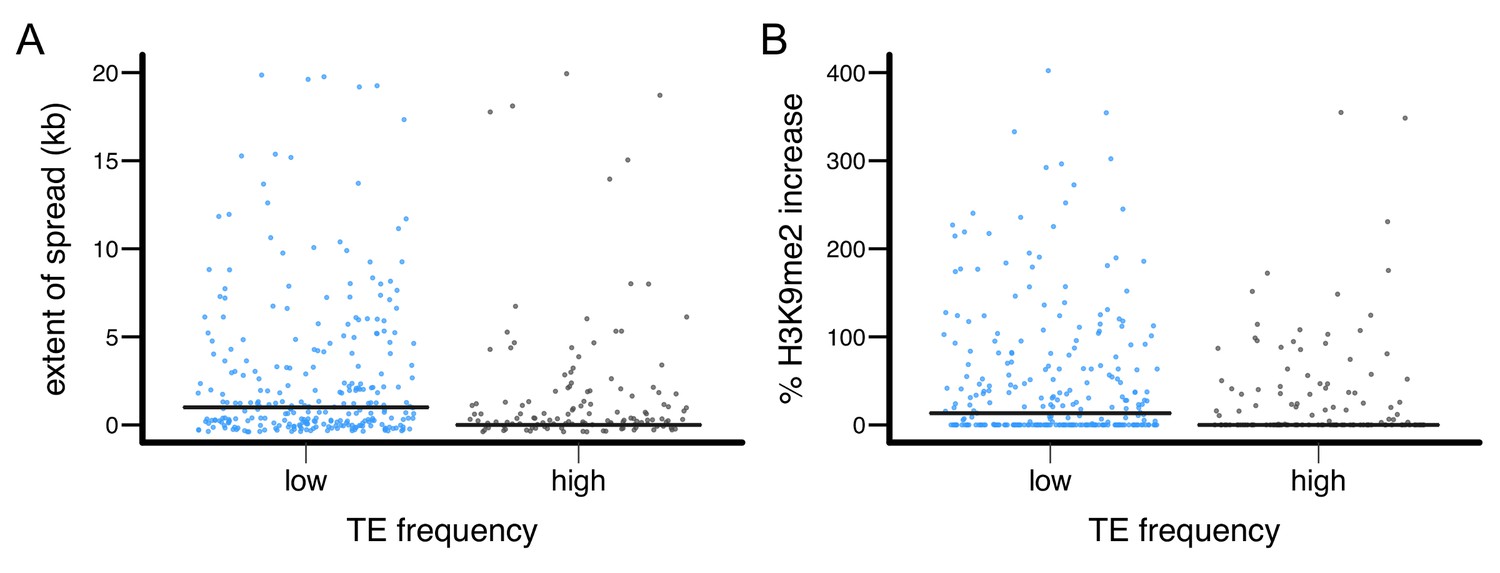
The epigenetic effects of TEs with low and high population frequencies.
(A) the extent of H3K9me2 spread, and (B) the % increase in H3K9me2 enrichment were plotted for individual TE insertion. Median is denoted by horizontal lines.
Figure 5—figure supplement 3
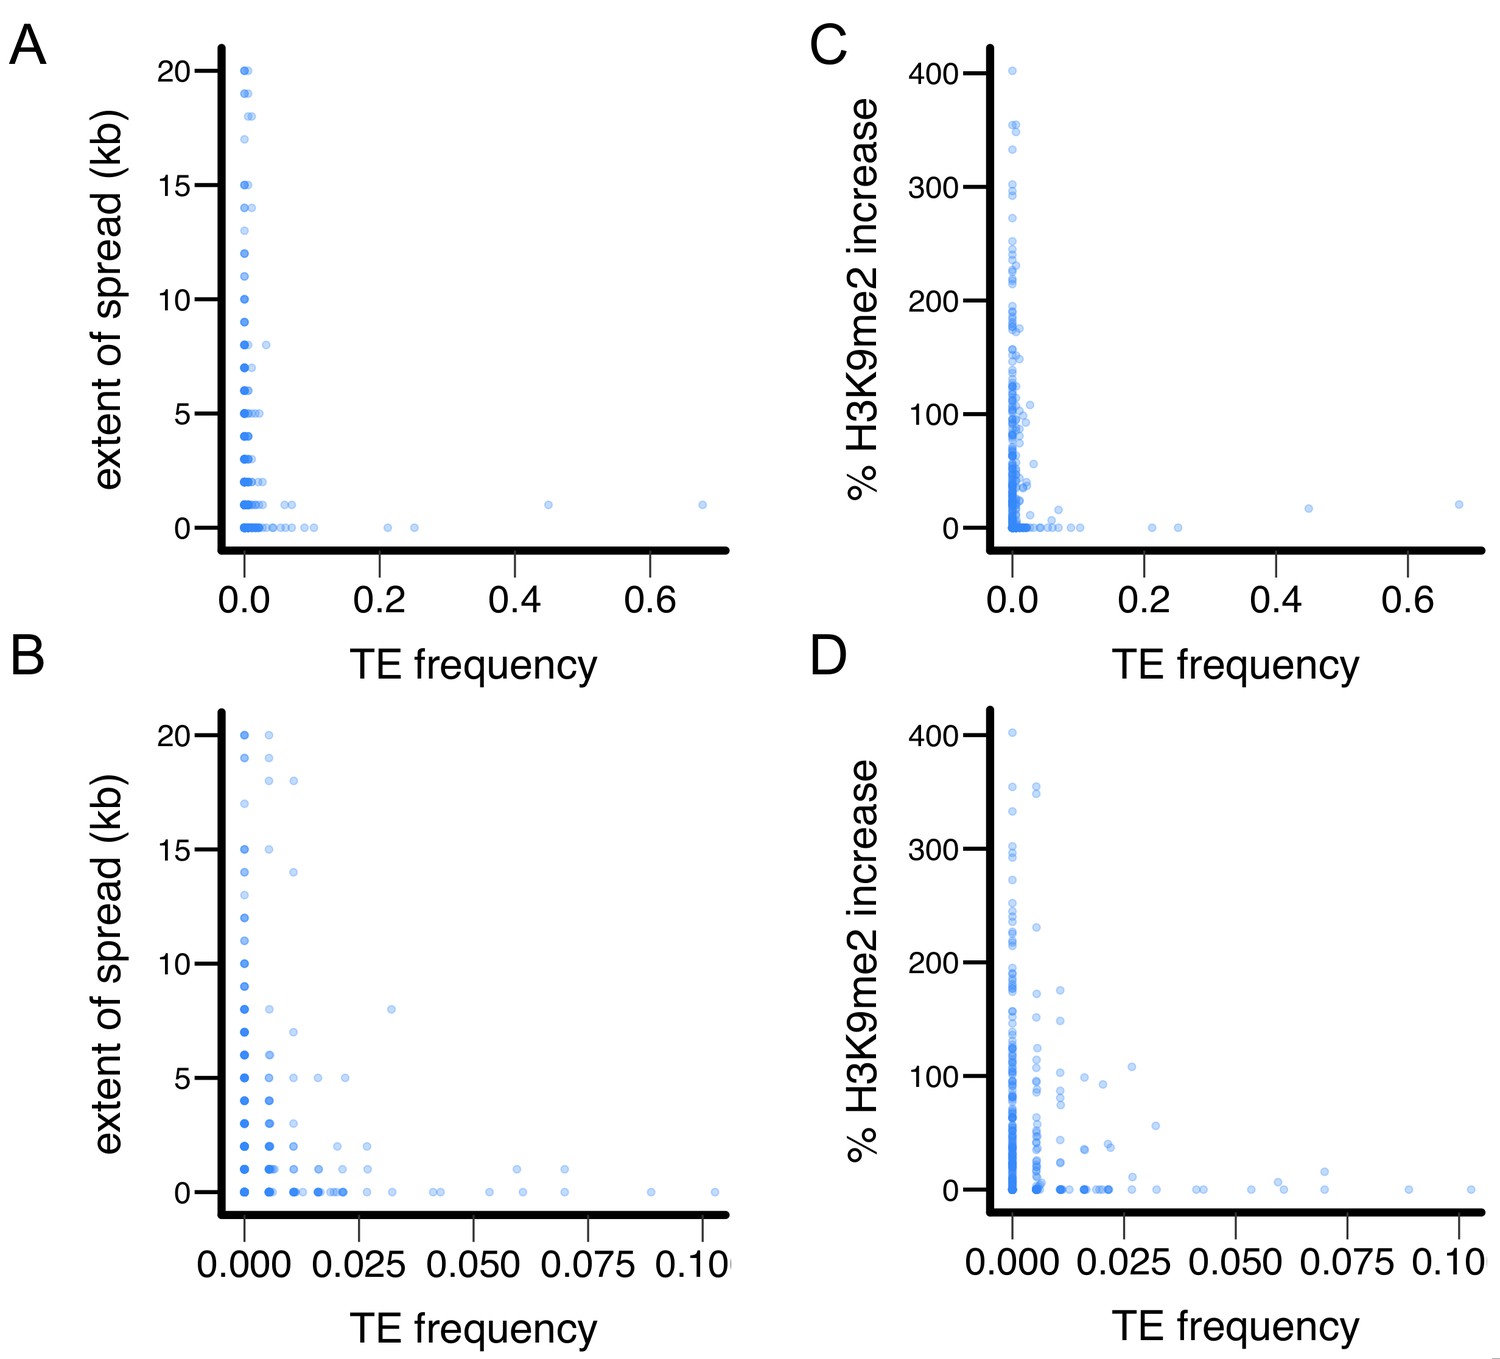
X-Y plot for TE’s epigenetic effects and population frequencies in the Zambian population.
(A and B) TE’s population frequency vs TE-induced extent of H3K9me2 spread, and (C and D) TE’s population frequency vs TE-induced % increase in H3K9me2.
Figure 6 with 1 supplement
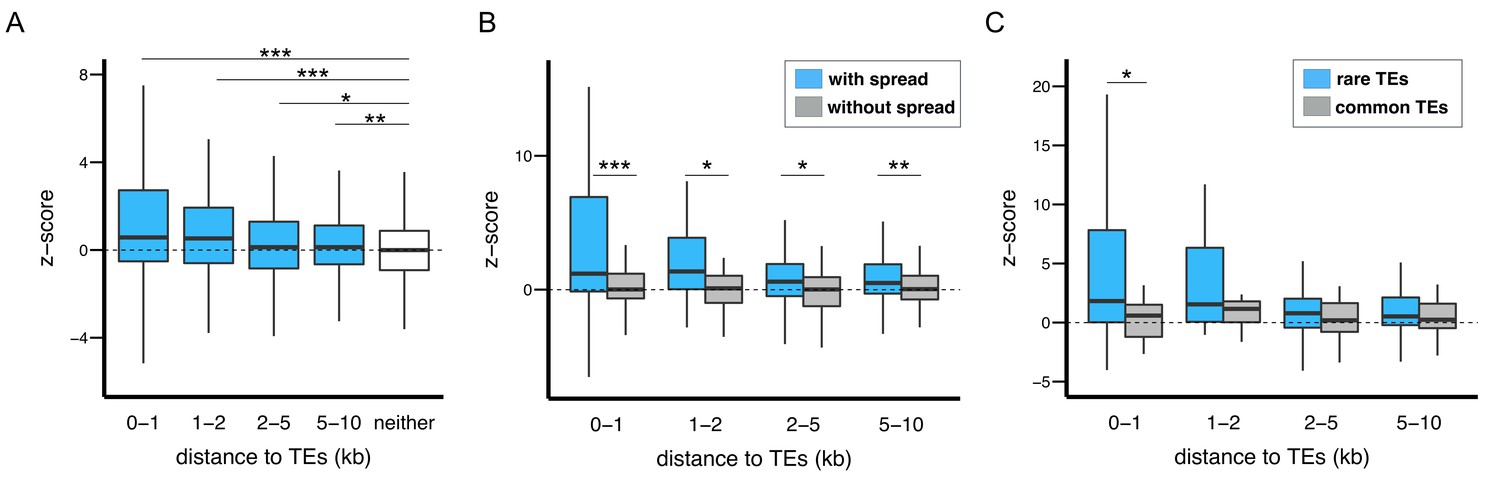
The epigenetic effects of TEs on adjacent protein coding genes.
(A) Alleles with adjacent TEs have higher H3K9me2 enrichment compared to homologous alleles in the strain that lacks adjacent TEs, as indicated by positive z-scores (see text), and the strength of the effect decreases with distance from TEs. (B) Genes adjacent to TEs with epigenetic effects show stronger differential enrichment for H3K9me2 than genes adjacent to TEs without epigenetic effects. (C) Genes adjacent to low frequency TEs with epigenetic effects, which likely experienced stronger selection against them, show stronger differential enrichment of H3K9me2 than genes adjacent to high frequency TEs with epigenetic effects (Mann-Whitney U test, *p<0.05, **p<0.01, ***p<0.001).
Figure 6—figure supplement 1
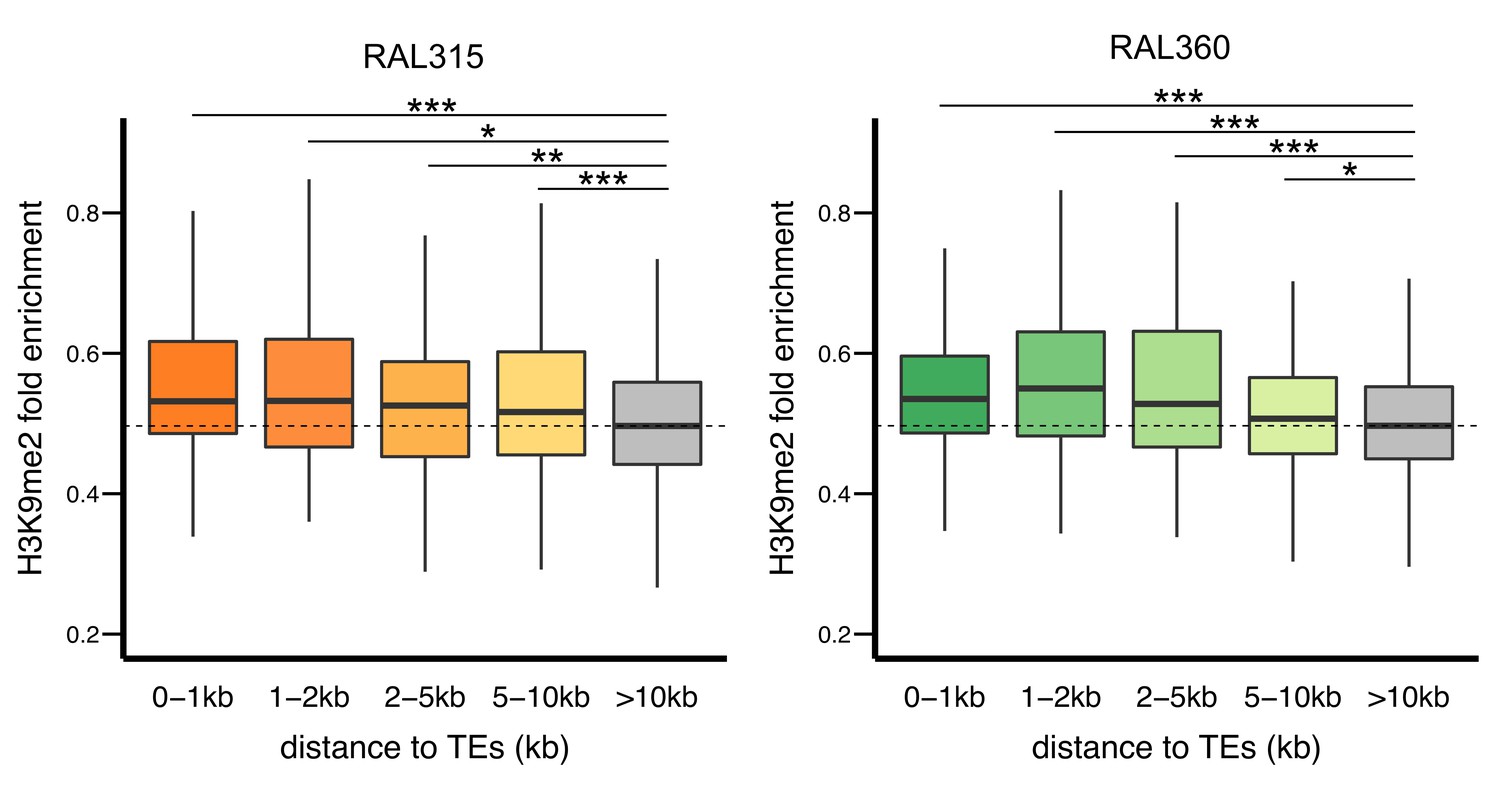
H3K9me2 enrichments at genes decreases with distance from TEs in both RAL315 (left) and RAL360 (right).
Significant levels are comparisons to genes without TEs in 10 kb (gray) (Mann-Whitney U test, *p<0.05, **p<0.01, ***p<0.001).
Figure 7
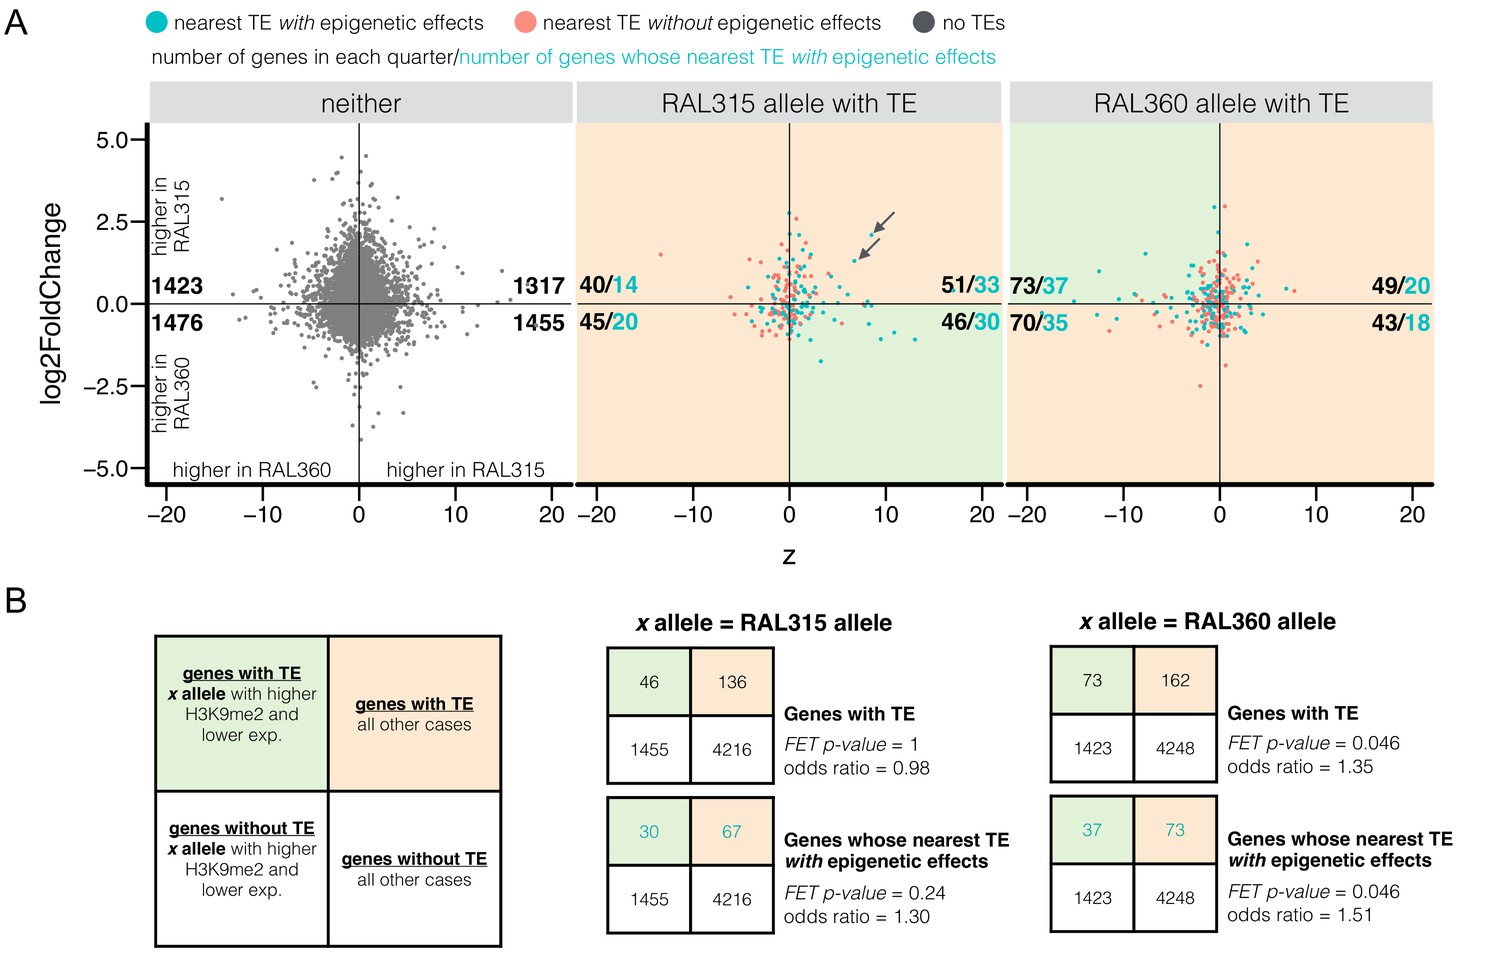
Differential H3K9me2 enrichment and RNA transcript levels of protein coding genes with and without adjacent TE insertions.
(A) The z-score for H3K9me2 enrichment (X-axis) and log2 expression fold change (Y-axis) were plotted for euchromatic protein coding genes without TEs within 10 kb (‘neither’) and for genes with adjacent TEs in either strain. It is worth noting that both H3K9me2 z-score and log2 expression fold change used RAL360 as reference. Shaded green areas are genes displaying the expected negative influence of TE’s epigenetic effects on gene expression (i.e. alleles adjacent to TEs have higher H3K9me2 enrichment and lower RNA transcript levels), while shaded orange areas are all other cases of epigenetic states and transcript levels. For each sub-plot, the numbers of genes (blue, pink, or gray dots) in each quarter are shown in black, and the numbers of genes whose nearest TEs with epigenetic effects (blue dots) are shown in blue. (B) Left: 2 × 2 contingency table for comparing the number of genes supporting the influence of TE’s epigenetic effects on gene expression (shaded green) and the number of other genes (shaded orange), against those for genes without TEs within 10 kb (‘neither’). Middle and right: 2 × 2 contingency tables for testing if there is an excess number of genes with TEs in RAL315 (middle) and in RAL360 (right) supporting the influence of TE-induced epigenetic effects on gene expression.
Figure 8 with 2 supplements
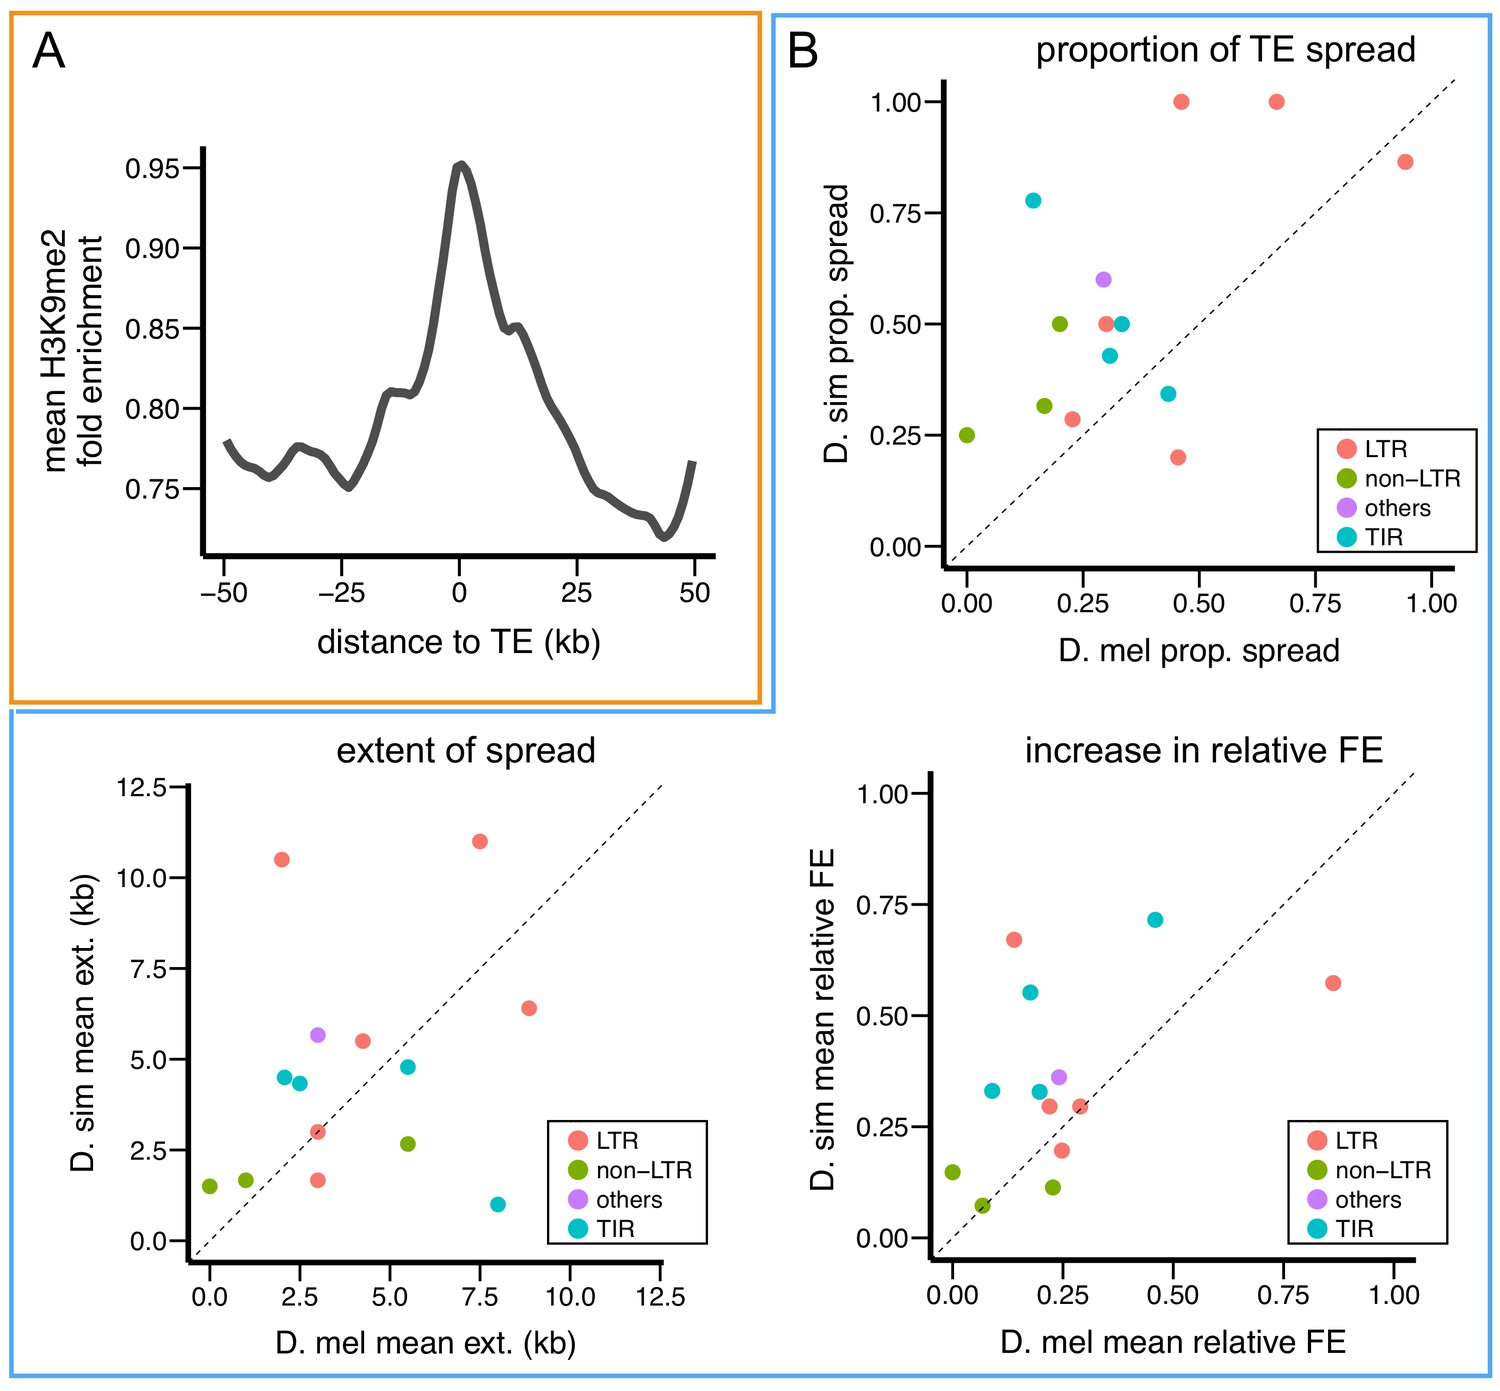
D. simulans TEs show stronger epigenetic effects than D. melanogaster TEs.
(A) Enrichment of H3K9me2 is also observed at sequences adjacent to euchromatic TEs in D. simulans. (B) Compared to insertions of the same TE family in D. melanogaster, insertions in D. simulans are more likely to show epigenetic effects (proportion of TE spread) and a larger increase in relative H3K9me2 fold enrichment in adjacent sequences. FE: fold enrichment, D. mel: D. melanogaster, D. sim: D. simulans.
-
Figure 8—source data 1
Estimates of epigenetic effects for D. simulans TEs.
Estimates of D. melanogaster TEs using the same methods are also included.
- https://doi.org/10.7554/eLife.25762.023
Figure 8—figure supplement 1

H3K9me2 enrichment at genes adjacent to TEs in D. simulans.
Compared to genes without TEs within 10 kb, genes with adjacent TEs have higher enrichment for H3K9me2. For genes at equal distance from TEs, genes adjacent to TEs with epigenetic effects (darker gray) have higher H3K9me2 enrichment than genes adjacent to TEs without epigenetic effects (lighter gray). (Mann-Whitney U test, *p<0.05, **p<0.01, ***p<0.001).
Figure 8—figure supplement 2
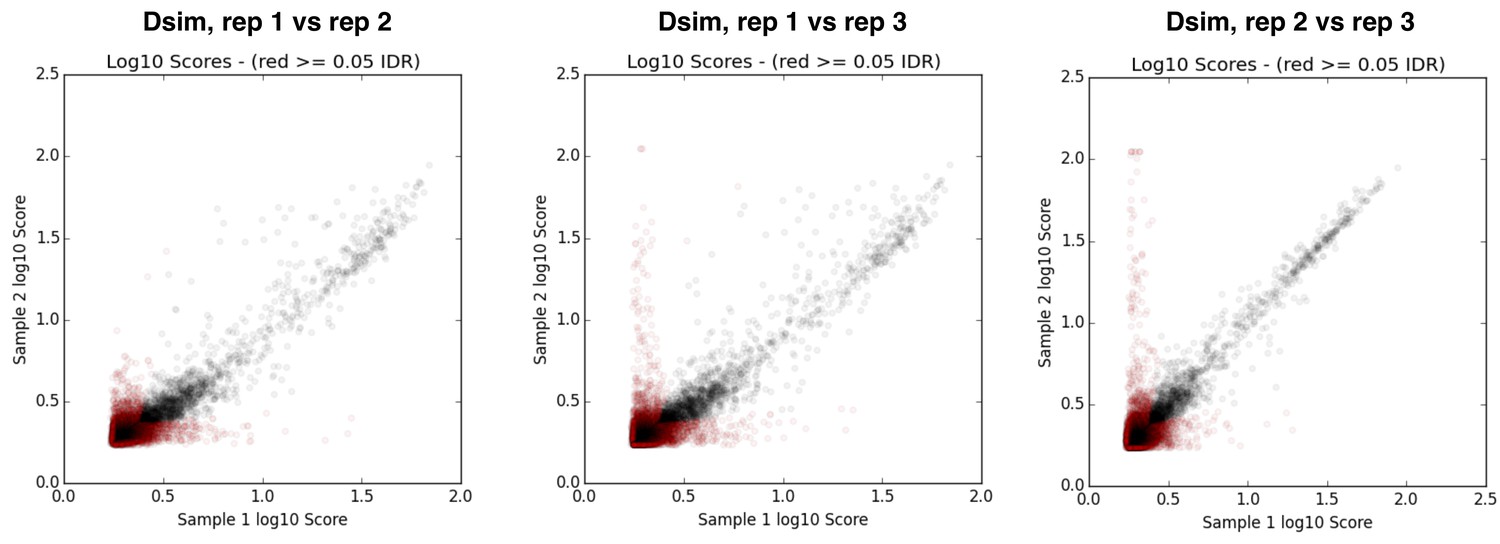
IDR plots for replicates of D. simulans ChIP samples.
https://doi.org/10.7554/eLife.25762.025
Figure 9 with 1 supplement
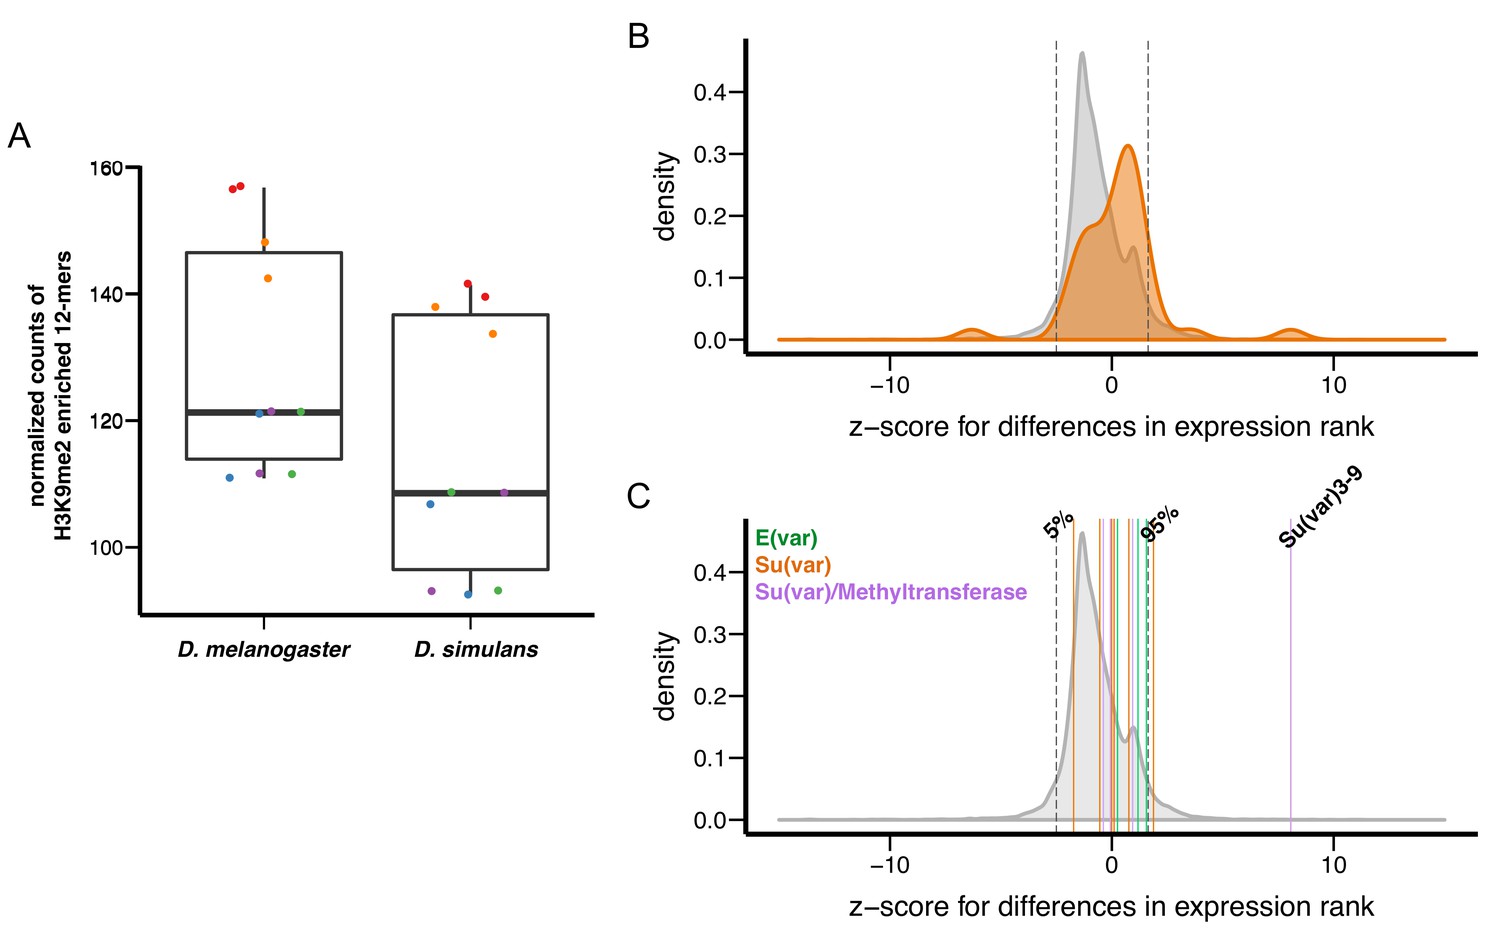
Variation in genetic modifiers of PEV in D. melanogaster and D. simulans.
(A) D. simulans has higher normalized amounts of H3K9me2-enriched 12-mers than D. melanogaster. Raw amounts of H3K9me2-enriched 12-mers were normalized with sequencing coverage in each sample before comparisons (see Materials and methods). Different library preparation methods (see [Kofler et al., 2015]) are denoted with dots of different colors. (B) Compared to genome-wide distributions (shaded gray), known Su(var) genes as a group (orange, 40 genes in total) have higher expression in D. simulans than in D. melanogaster. Positive z-score represents lower expression rank (i.e. higher expression) in D. simulans than in D. melanogaster. Dashed vertical lines represent the top and bottom 5% of transcript level differences genome-wide. (C) Z-score for differences in transcript levels of ten known dosage-dependent E(var) genes (green), Su(var) genes (orange), and histone methyltransferase genes (also Su(var)s) between D. melanogaster and D. simulans are denoted as vertical lines and compared to genome-wide distributions (shaded gray). Dashed vertical lines indicate top and bottom 5% of transcript level differences genome-wide.
-
Figure 9—source data 1
Gene expression level of Su(var) and E(var) genes in D. melanogaster and D. simulans.
- https://doi.org/10.7554/eLife.25762.027
Figure 9—figure supplement 1
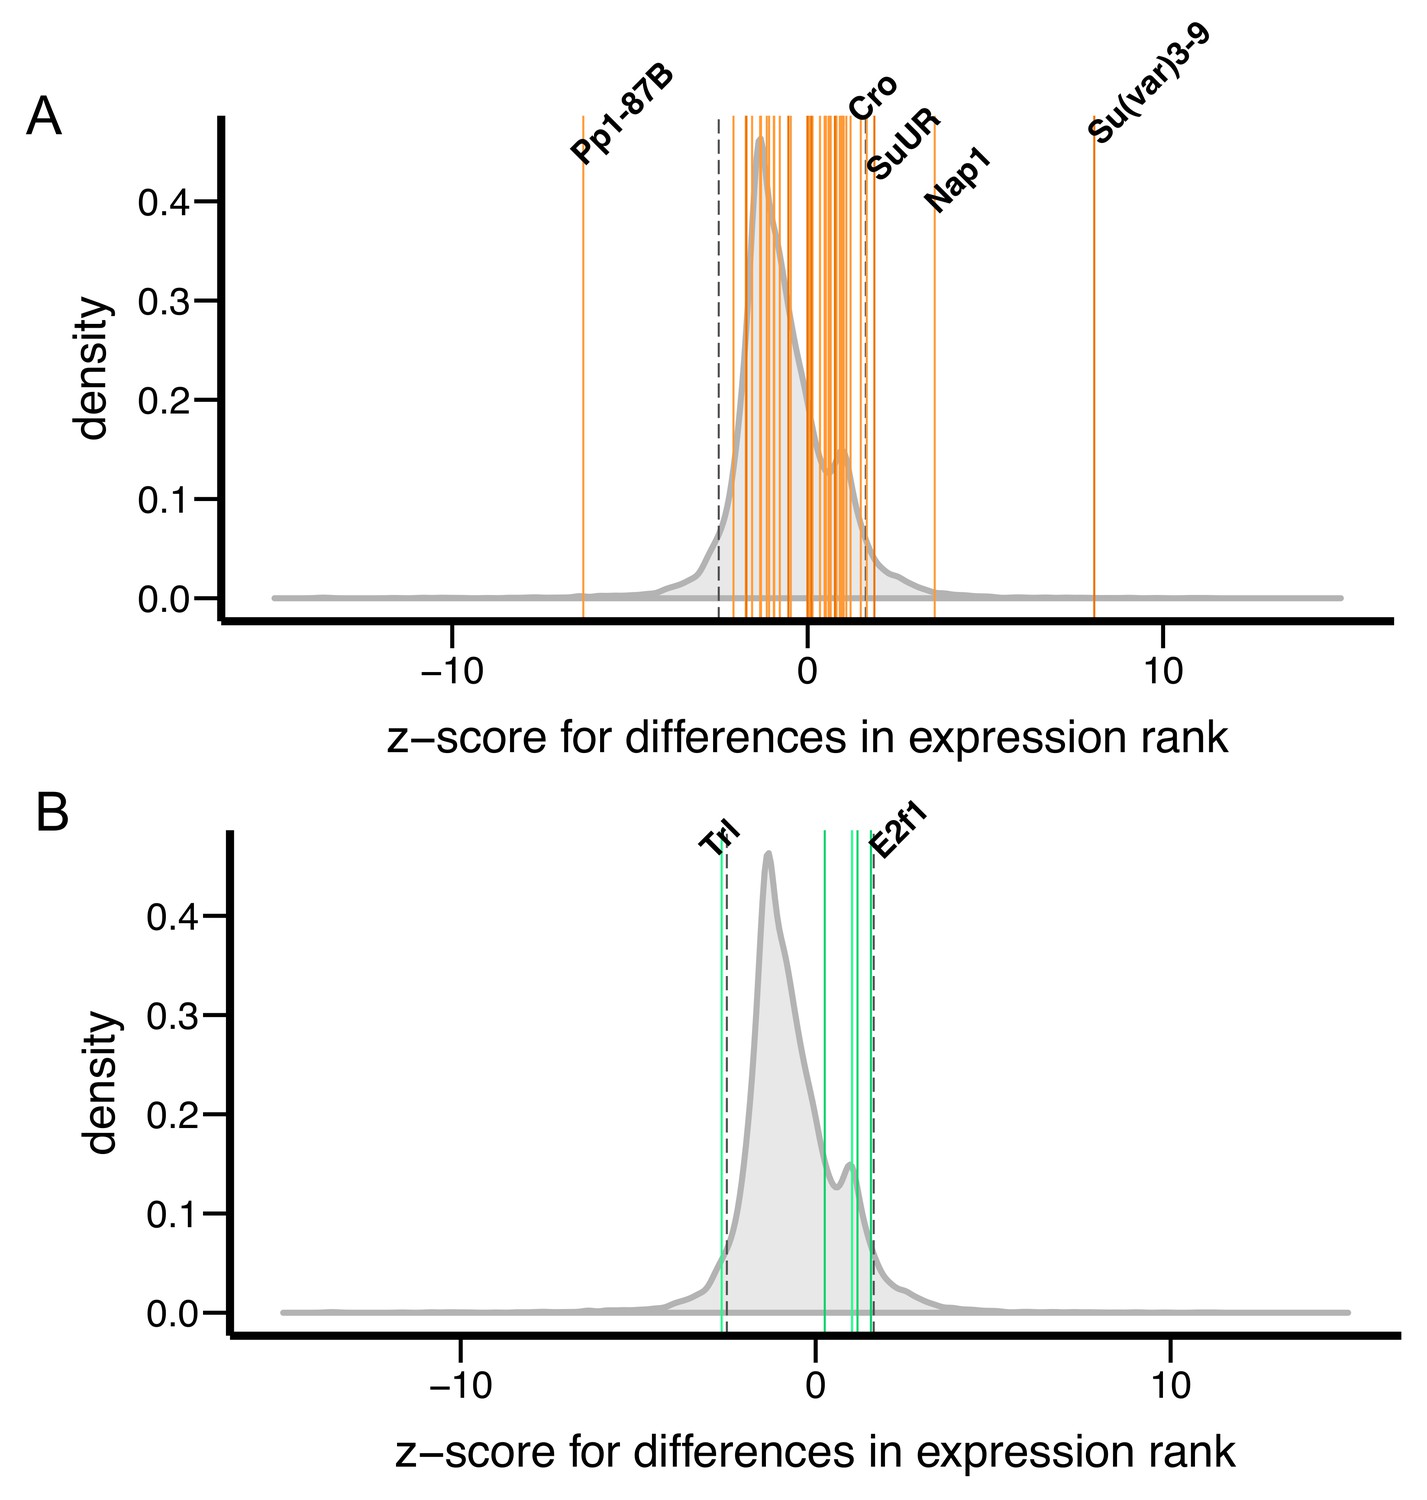
Differences in transcript levels of Su(var) and E(var) genes between D. melanogaster and D. simulans.
Z-scores, which measure differences in transcript levels between D. melanogaster and D. simulans, for (A) 40 Su(var) genes and (B) five E(var) genes are denoted as vertical lines and compared to genome-wide distribution (shaded gray).
Tables
Table 1
Spearman rank correlation tests between properties of TE families and the epigenetic effects of TEs. piRNA amounts were estimated from two studies (two genotypes: w1118 and wK) and siRNA counts were estimated from two studies (Ghildiyal et al., 2008; Czech et al., 2008).
| prop. TE with epigenetic effects | mean extent of H3K9me2 spread | mean % of increase in H3K9me2 enrichment | ||||
|---|---|---|---|---|---|---|
| p-value | ρ | p-value | ρ | p-value | ρ | |
| piRNA amount (w1118) | 5.18E-01 | 0.121 | 1.67E-02 | 0.465 | 1.13E-02 | 0.493 |
| piRNA amount (wK) | 9.99E-01 | 0.000 | 3.41E-03 | 0.553 | 7.09E-03 | 0.521 |
| siRNA counts (Czech et al., 2008) | 2.90E-01 | 0.193 | 4.99E-01 | 0.142 | 1.24E-01 | 0.316 |
| siRNA counts (Ghildiyal et al., 2008) | 6.08E-01 | 0.108 | 7.46E-01 | −0.075 | 1.46E-01 | 0.329 |
| family copy no. | 3.61E-03 | 0.473 | 6.24E-01 | 0.095 | 6.59E-01 | 0.085 |
Table 2
Regression analysis for the associations between TE’s epigenetic effects and population frequencies while accounting for the influence of TE family identity. Population frequencies of individual TE insertion (response variable) were modeled as either dichotomous variable (‘high frequency’ TE or not) or count (TE count). Because the distribution of TE count is overdispersed, TE count was modeled as either ‘quasipoission’ or ‘negative binomial’ in regression analyses. The influence of TE family identity was treated as either fixed or random effect. Also see Table 2—source data 1 for regression coefficients for all TE families.
| Extent of spread | Magnitude of spread | ||||
|---|---|---|---|---|---|
| Response variable | Family identity | p-value | Regression coefficient | p-value | Regression coefficient |
| ‘high frequency’ TE or not | fixed effect | 4.72E-01 | −0.029 | 3.37E-01 | −0.246 |
| random effect | 1.58E-01 | −0.049 | 4.83E-02 | −0.409 | |
| TE count (quasipoisson) | fixed effect | 4.00E-03 | −0.188 | 4.73E-03 | −1.121 |
| random effect | 3.20E-03 | −0.136 | 1.71E-04 | −1.400 | |
| TE count (negative binomial) | fixed effect | 5.25E-04 | −0.151 | 2.31E-04 | −1.041 |
| random effect | 9.19E-05 | −0.138 | 5.49E-05 | −0.986 | |
-
Table 2—source data 1
Regression coefficients for the epigenetic effects of TEs (extent of spread and magnitude of spread) and each TE family.
- https://doi.org/10.7554/eLife.25762.018
Table 3
Comparisons of H3K9me2 enriched 12-mers between D. melanogaster and D. simulans using different normalization and thresholds. Raw counts of H3K9me2 enriched 12-mers were normalized by read coverage of either the orthologous exonic regions or all orthologous genomic regions. ‘Fold enrichment threshold’ is the threshold for a 12-mer to be considered as H3K9me2 enriched in the ChIP-Seq data. ‘% of 12-mers’ is the proportion of H3K9me2 enriched 12-mers among all 12-mers.
| ANOVA p-value | ||||
|---|---|---|---|---|
| normalization | fold enrichment threshold | % of total 12-mers | Species | library preparation method |
| exon reads | 1.5 | 20.21% | 1.29E-04 | 1.43E-07 |
| exon reads | 2 | 12.89% | 8.62E-05 | 1.28E-07 |
| exon reads | 3 | 6.41% | 1.01E-02 | 1.55E-07 |
| all reads | 1.5 | 20.21% | 2.07E-09 | 2.40E-05 |
| all reads | 2 | 12.89% | 5.14E-11 | 1.70E-05 |
| all reads | 3 | 6.41% | 1.60E-03 | 1.20E-02 |
Download links
A two-part list of links to download the article, or parts of the article, in various formats.
Downloads (link to download the article as PDF)
Open citations (links to open the citations from this article in various online reference manager services)
Cite this article (links to download the citations from this article in formats compatible with various reference manager tools)
Pervasive epigenetic effects of Drosophila euchromatic transposable elements impact their evolution
eLife 6:e25762.
https://doi.org/10.7554/eLife.25762


