Notch/Her12 signalling modulates, motile/immotile cilia ratio downstream of Foxj1a in zebrafish left-right organizer
- Universidade Nova de Lisboa, Portugal
- Centro Académico de Medicina de Lisboa, Portugal
- Instituto Gulbenkian de Ciência, Portugal
- MPI of Molecular Cell Biology and Genetics, Germany
- Faculdade de Medicina da Universidade de Lisboa, Portugal
Figures
Figure 1
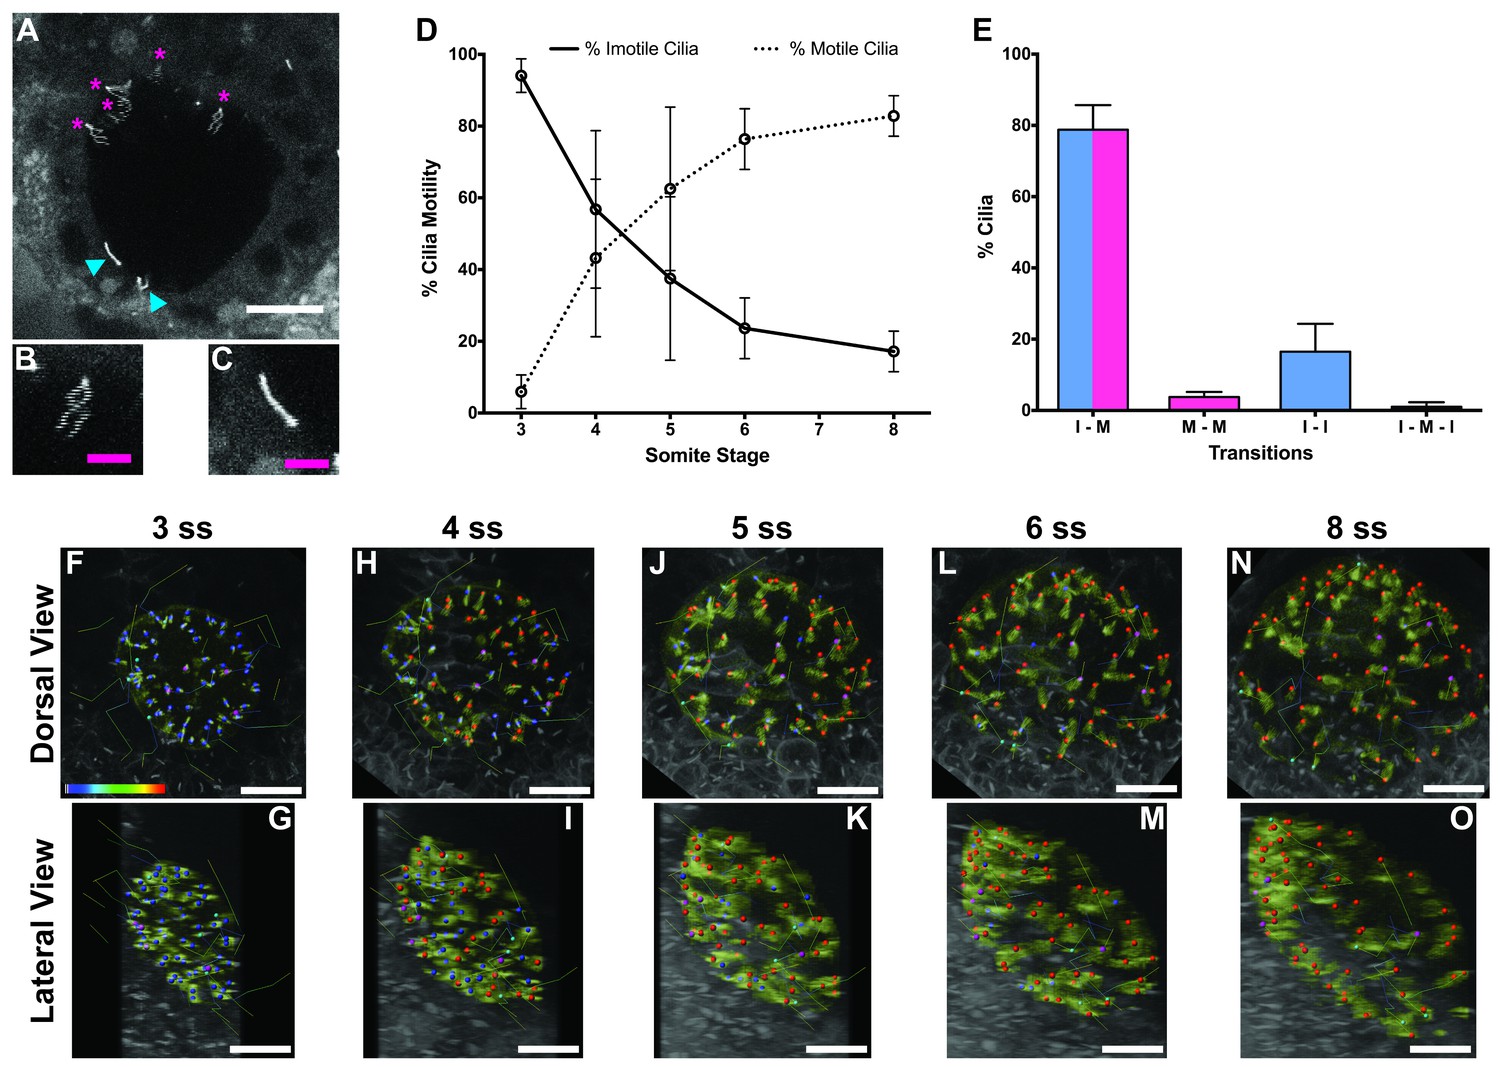
Immotile cilia are specified early in development.
(A) Still from Video 1 representing a wild-type embryo injected with 400 pg Arl13b-GFP at 1 cell stage. Anterior is up and Left is left. Blue arrowheads indicate – Immotile cilia; Magenta stars indicate Motile Cilia. Scale bar represents 20 μm. (B–C) Details of a Motile (B) and Immotile Cilia (C). Scale bar (magenta) represents 5 μm. (D) Changes in the % of Motile and Immotile Cilia in KV during zebrafish development from 3 to 8 somites stage (ne = 5, nc = 294). (E) Types of cilia motility behaviours found during the Time Lapse experiment (from 3 to 8 somites stage). I – M is ‘Immotile to Motile’, M – M is ‘Always Motile’, I – I is ‘Always Immotile’, and I – M – I is ‘Immotile to Motile to Immotile’ (ne = 4, nc = 231). (F–O) Stills from Video 2, the time-lapse video obtained from a Control embryo injected with 400 pg Arl13b-GFP at 1 cell stage. Dorsal view – Anterior is to the top and Left is to left (F, H, J, L, N). Lateral view – Anterior is to the top and Dorsal is to left (G, I, K, M, O). Motile cilia (red), Immotile Cilia (blue), cilia that were always motile (from 3 to 8 ss – purple), cilia that remain always immotile (from 3 to 8 ss – cyan). In all images, scale bar represents 20 μm. ne – number of embryos and nc – number of cilia.
-
Figure 1—source data 1
Contains data about the number of motile and immotile cilia from single embryos along development from 3 ss to 8 ss (n = 4).
- https://doi.org/10.7554/eLife.25165.003
Figure 2 with 3 supplements
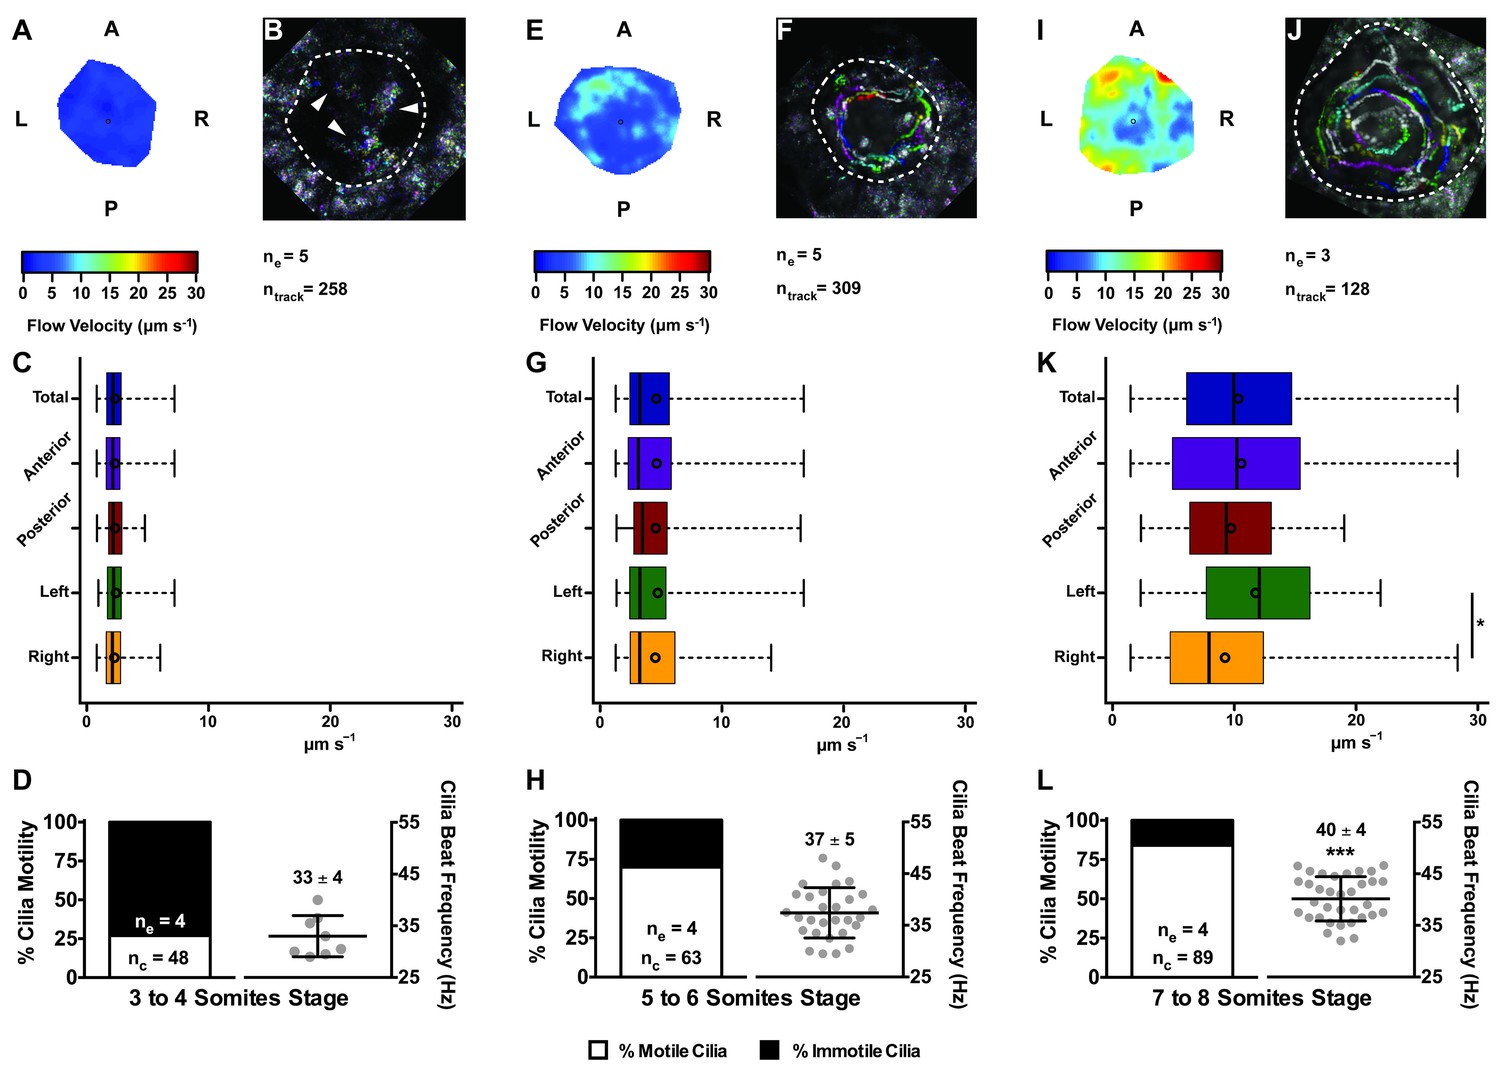
Changes in KV flow and CBF through development observed in uninjected WT embryos.
Data was pooled from embryos at 3–4 (A–D), 5–6 (E–H), and 7–8 (I–L) somites stage. (A, E, I) Heat maps of flow speed showing detailed regions within the KV for pooled embryos in each experimental condition: 3–4 ss (A), 5–6 ss (E), and 7–8 ss (I). The pseudo-colour scale represents flow speed in μm s−1, where red represents high speed versus low speed in blue. (B, F, J) Representative KV particle flow map for a WT embryo at 3–4 ss (B), 5–6 ss (F), and 7–8 ss (J). Each second is represented by a different colour. The particle Brownian motion in (B) is marked with white arrowheads. Anterior is to the top and Left is to left. (C, G, K) Box plots for instantaneous flow speed measured at different locations of the KVs, based on the same data set used to generate the heat maps, in each experimental condition: 3–4 ss (C), 5–6 ss (G), and 7–8 ss (K). Box plots display the median with a vertical line, and the whiskers represent the minimum and maximum values observed. Means are represented as small circles. *p<0.05, Wilcoxon test. (D, H, L) display the %motile and %immotile cilia found in the KV midplane (left panels) and the CBF measured in the motile cilia (right panels) of WT embryos in each experimental condition: 3–4 ss (D), 5–6 ss (H), and 7–8 ss (L). Values for CBF are Mean ±SD, ***p<0.001, ANOVA with Bonferroni's multiple comparisons test. ne – number of embryos; ntracks – number of tracks followed; nc – number of cilia.
-
Figure 2—source data 1
Contains data from the native particles tracked to generate the flow maps on Figure 2.
Shows the evaluation of the motile and immotile cilia by transmitted light microscopy with a high speed video-camera and the corresponding cilia beat frequency for the motile cilia.
- https://doi.org/10.7554/eLife.25165.010
Figure 2—video 1
Wild-type fluid flow at 3 ss.
Movie from 1 WT, non-injected embryo. At this development stage, the native particles only present Brownian motion. Anterior is to the top and Left is to left. 30 frames per second.
Figure 2—video 2
Wild-type fluid flow at 5 ss.
Movie from 1 WT, non-injected embryo. At this development stage the KV presents a homogeneous directional fluid flow. Anterior is to the top and Left is to left. 30 frames per second.
Figure 2—video 3
Wild-type fluid flow at 8 ss.
Movie from 1 WT, non-injected embryo. At this development stage, the directional fluid flow is no longer homogeneous, presenting higher speeds at the anterior-left part of the KV. Anterior is to the top and Left is to left. 30 frames per second.
Figure 3 with 1 supplement
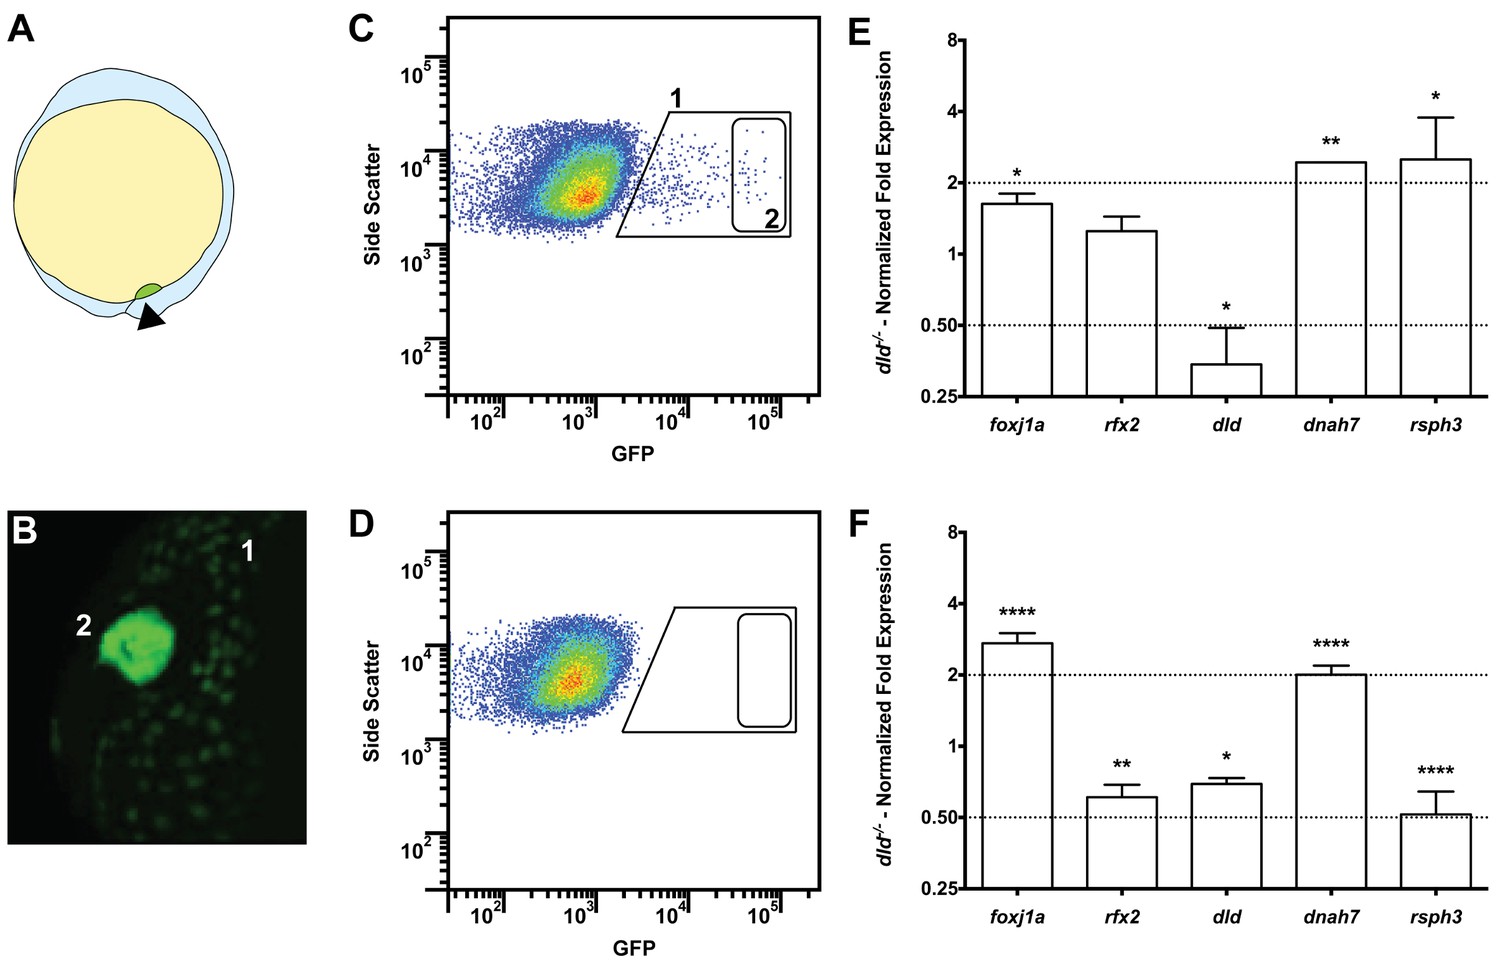
Tissue specific microarray identifies motility genes differentially expressed in dld−/− mutants.
(A) Representation of a zebrafish embryo at Bud stage (10 hpf). The arrowhead shows the tail bud. In green are represented the DFCs. (B) At bud stage, sox17:GFP zebrafish Tg line, the DFCs strongly express GFP (2). At this same stage, endoderm cells also express GFP but at significantly lower levels (1). (C) FACS profiles for sox17:GFP (AB and dld−/−) Tg lines and (D) WT line without GFP for assessing embryo auto-fluorescence. In (C) the cells contained in (1) correspond to the endoderm cells, and the cells contained in (2) correspond to the DFCs. (E) Normalized fold expression (log2) of several motility related genes in dld−/− mutant embryos as determined in the microarray. t-test; *p<0.05, **p<0.01. (F) qPCR validation in normalized fold expression (log2) of the microarray results in the cells selected by FACS as in (C). Welsh t-test or the Mann–Whitney U-test; *p<0.05, **p<0.01, ****p<0.0001.
-
Figure 3—source data 1
Contains data on the relative expression levels of several genes by quantitative PCR.
It shows comparisons between dld−/− mutants and wild type embryos.
- https://doi.org/10.7554/eLife.25165.013
-
Figure 3—source data 2
GO annotation for gene groups obtained with the R package clusterProfiler.
- https://doi.org/10.7554/eLife.25165.014
Figure 3—figure supplement 1
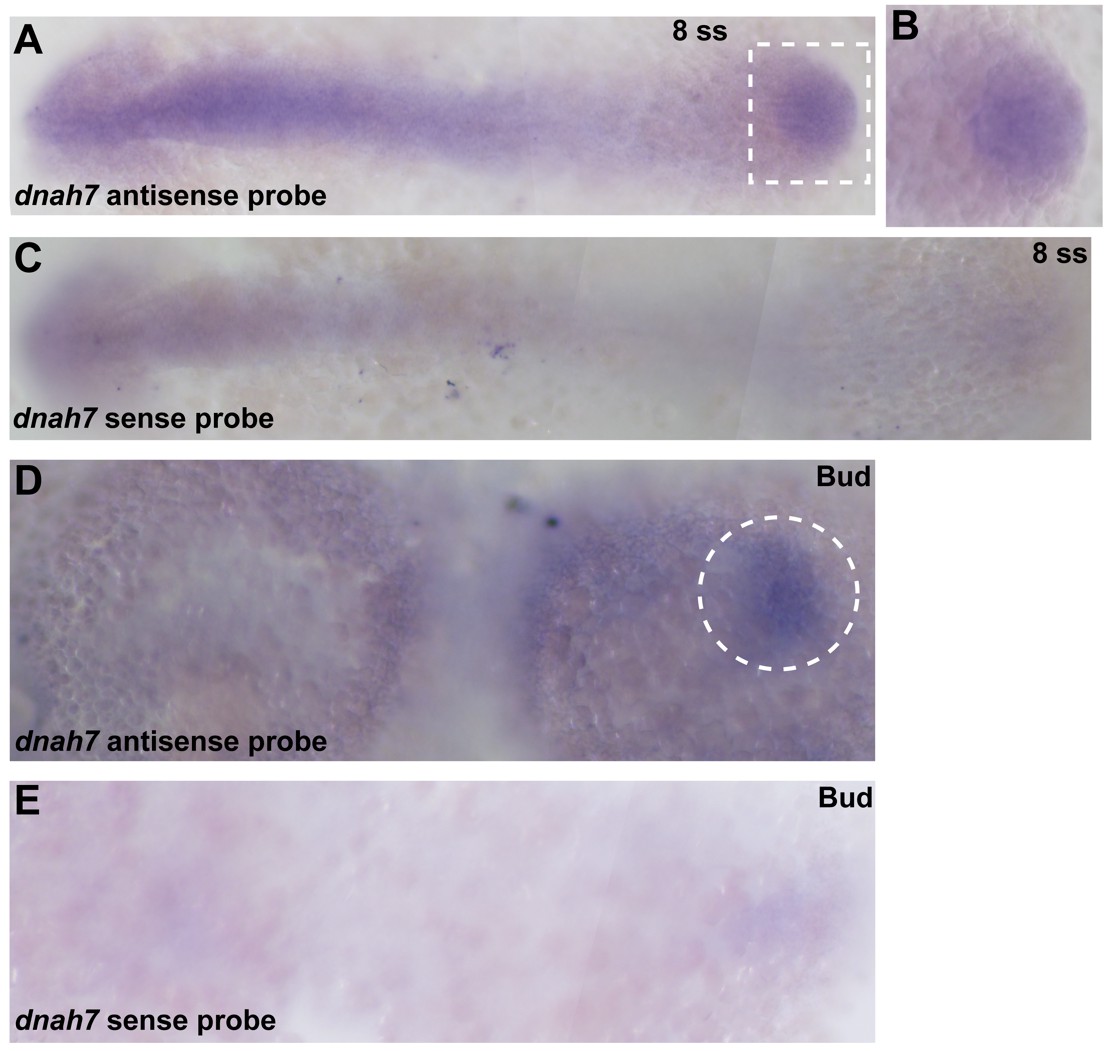
In situ hybridization with dnah7 specific probe in zebrafish embryos.
(A–C) WT 8 ss zebrafish embryo stained with antisense (A–B) and sense (C) dnah7 specific probes. (A) White dotted square delimits the KV, which is detailed in (B). (D–E) WT zebrafish embryos at bud stage, stained with antisense (D) and sense (E) dnah7 specific probes. White dotted line circles the DFCs in (D). In all images Anterior is to left and Posterior is to right.
Figure 4 with 2 supplements
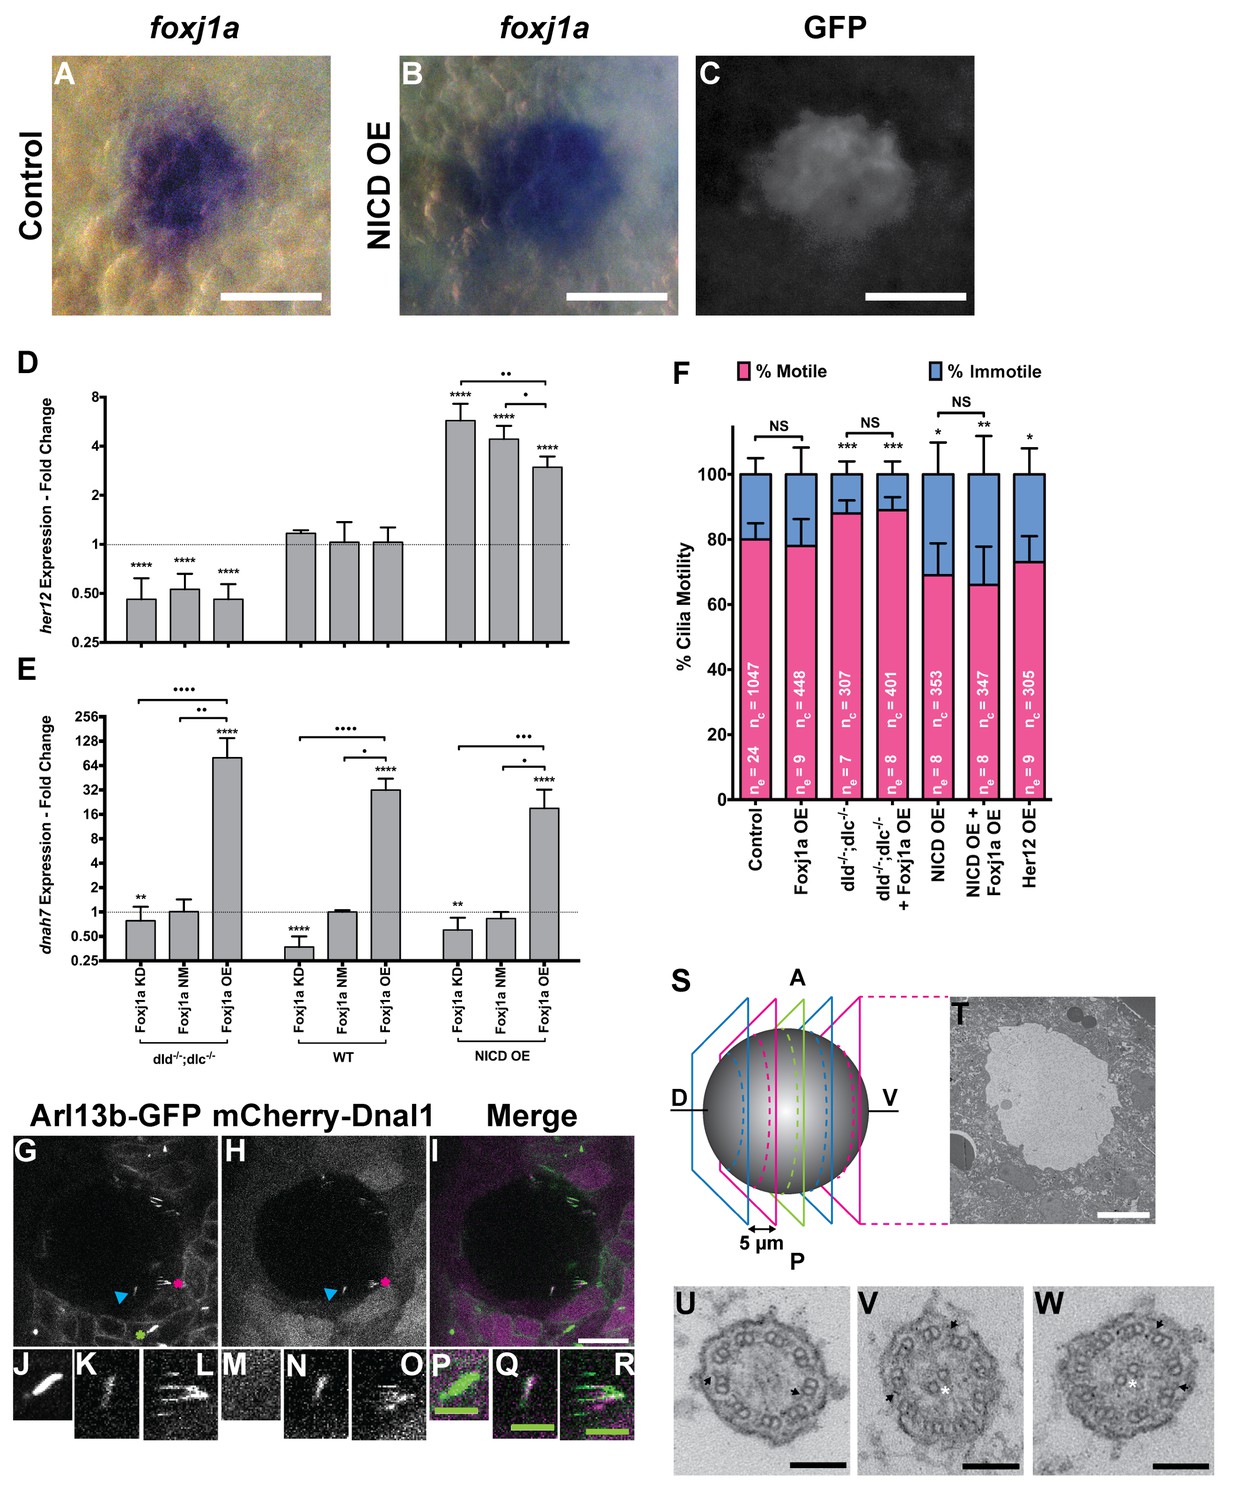
foxj1a is expressed in dorsal forerunner cells structurally specifying all cilia as motile cilia.
(A-C) In situ hybridization with foxj1a at bud stage in the dorsal forerunner cells (DFCs), in a control representative embryo (A) and upon NICD overexpression (B). (C) Performing immune-staining with an antibody anti-GFP in the same embryos revealed co-localization with sox17:GFP, a marker for DFCs at bud stage. (D–E) Fold change (log2) in expression levels of her12 (D), and dnah7 (E) in whole embryos with different Notch Signalling and Foxj1a manipulations at bud stage. dld−/−;dlc−/− – deltaD and deltaC double mutant; WT – Wild Type, non-injected controls; NICD OE – overexpression of Notch Intracellular Domain by injecting NICD mRNA; Foxj1a KD – knock-down of Foxj1a by Morpholino injection; Foxj1a NM – Foxj1a non-manipulation; and Foxj1a OE – overexpression of Foxj1a by injecting foxj1a mRNA. Statistical significance tested with Mann-Whitney U-test (**p<0.01 and ****p<0.0001). Kruscal-Wallis one-way analysis of variance with Dunn’s correction for multiple comparisons was used to determine significant differences between different Foxj1a treatments in the same NS assay (*p<0.05, **p<0.01, ***p<0.001, and ****p<0.0001). (F) Changes in the % of Immotile and Motile Cilia after manipulation of NS and/or of Foxj1a levels, and imaged by Multiphoton fluorescence microscopy at 0.16 frames per second. Unpaired Welch t-test (Control vs Foxj1a OE; Control vs Her12 OE) and one-way ANOVA with Bonferroni’s correction for multiple comparisons (Control vs NICD OE vs NICD OE +Foxj1 a OE; Control vs dld−/−;dlc−/− vs dld−/−;dlc−/− + Foxj1 a OE). *p<0.05; **p<0.01; ***p<0.001. NS stands for non significant. (G–I) Live KV from Arl13b-GFP Tg zebrafish embryo at 8 ss, over-expressing mCherry-Dnal1 (M–O). Of note are the positive GFP and mCherry signals present in both Immotile (K, N, Q) and Motile KV cilia (L, O, R). Primary cilium showed no mCherry signal (J, M, P). In the sample of cilia positive for dnal1-mCherry, we scored 72% motile cilia and 28% immotile cilia (n = 56 cilia in a total of 4 embryos). Scale bars represent 20 μm (white) and 5 μm (green). Blue arrow – immotile cilia; magenta asterisk – motile cilia; green asterisk – primary cilia. Ss -somite stage. (S–W) Transmission electron microscopy (TEM) micrographs of the kupffer’s vesicle from 10 ss wild type zebrafish embryos. (S) Schematics of the sampling methodology sectioning every 5–7 microns to recover full transverse sections such as the one shown in (T). (U-W) Examples of the two types of cilia ultrastructure observed, (U) without visible central pair but showing visible outer and inner dynein arms (arrows) or with visible central pair and dynein arms (U, V).
-
Figure 4—source data 1
Contains data on foxj1a gene expression by in situ hybridization and by qPCR.
- https://doi.org/10.7554/eLife.25165.018
-
Figure 4—source data 2
Relative expression levels of dnah7, her12, dnah9, rfx4 and foxj1a by qPCR for different Notch signalling manipulations.
Contains data and statistical tests for the number of motile cilia per KV.
- https://doi.org/10.7554/eLife.25165.019
Figure 4—figure supplement 1
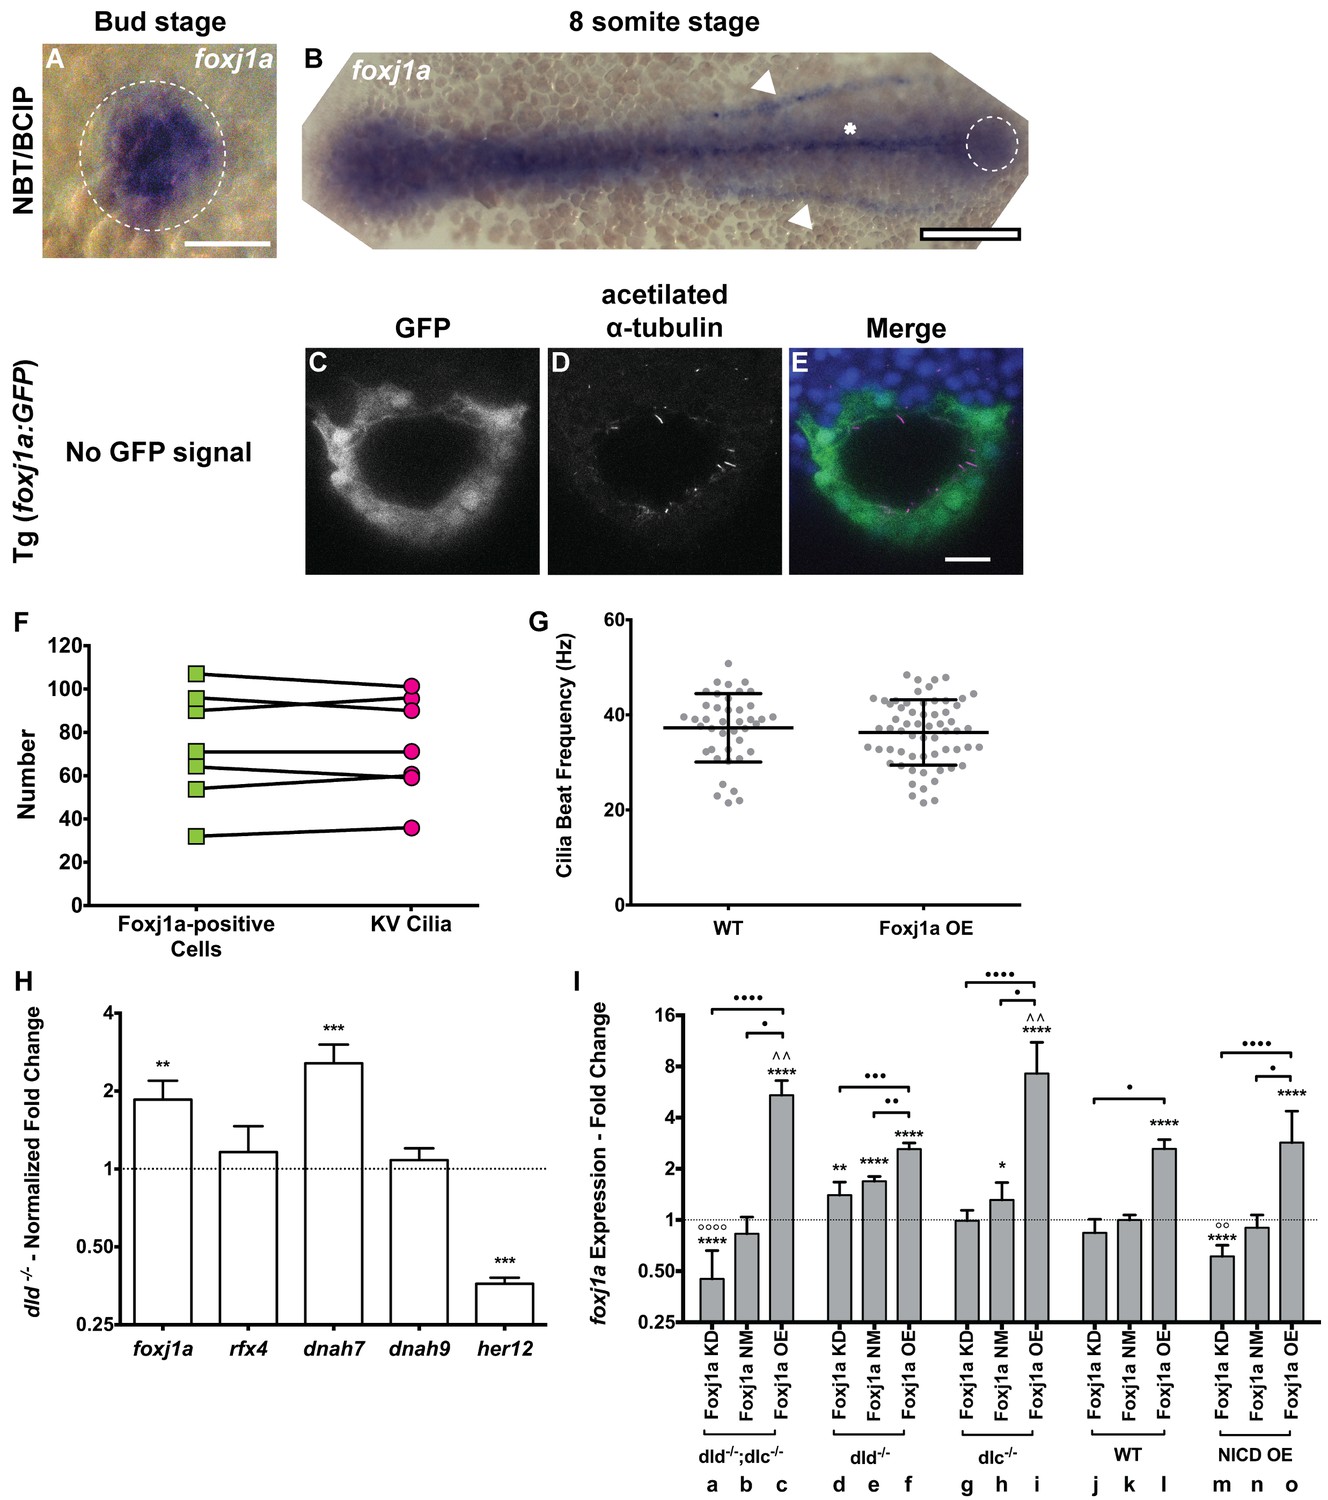
foxj1a expression analysis and loss and gain of function assays.
(A–B) In situ hybridization with foxj1a riboprobe; (A) at bud stage showing the labelled purple dorsal forerunner cells; (B) later at 8 somite-stage showing the purple staining is absent from the KV cells (dotted circle) but is visible in the neural tube (asterisk) and in both pronephros (arrow heads). (C–E) Still from Video 3 representing the immuno-staining of a KV from the transgenic line Foxj1a:GFP. foxj1a-positive KV cells in green (anti-GFP antibody) (C), and KV cilia in magenta (anti-acetylated α-tubulin antibody) (D). (E) Nuclei stained with DAPI. Anterior is to the top and Left is to left. Scale bar represents 20 μm. (F) Relation between the number of foxj1a-positive cells (green ■) and the number of cilia (magenta ●) in zebrafish embryos at 8 ss. Averages were not significantly different (p=0.9479, paired t-test; 8 embryos, 514 cells, 513 cilia). (G) Cilia Beat Frequency (CBF) in WT (37.27 ± 7.202 Hz, 8 embryos, 41 cilia), and in Foxj1a OE (36.30 ± 6.877 Hz, 12 embryos, 61 cilia). p=0.4990, unpaired t-test with Welsh’s correction (averages not significantly different). (H) Transcription levels of several genes in whole zebrafish embryos. Normalized fold change (log2) in expression levels of foxj1a, rfx4, dnah7, dnah9, and her12 in whole embryos at bud stage from the dld−/− mutant. Unpaired t-test with Welsh’s correction; **p<0.01 and ***p<0.001. (I) Transcription levels for foxj1a. Fold change (log2) in expression levels of foxj1a in whole embryos with different Notch Signalling and Foxj1a manipulations at bud stage (a – o). dld−/−;dlc−/− – deltaD and deltaC double mutant; dld−/− – deltaD mutant; dlc−/− – deltaC mutant; WT – Wild Type, non-injected controls; NICD OE – overexpression of Notch Intracellular Domain by injecting NICD mRNA; Foxj1a KD – knock-down of foxj1a by Morpholino injection; Foxj1a NM – Foxj1a no-manipulation; Foxj1a OE – overexpression of Foxj1a by injecting foxj1a mRNA. Statistical significance tested with Mann-Whitney U-test (*p<0.05, **p<0.01, and ****p<0.0001). Kruscal-Wallis one-way analysis of variance with Dunn’s correction for multiple comparisons was used to determine significant differences between different Foxj1a treatments in the same NS assay (*p<0.05,**p<0.01, ***p<0.0001, and ****p<0.0001), and to determine significant differences between different NS treatments in the same Foxj1a assay (Foxj1a KD – **p<0.01, and ****p<0.0001. Foxj1a OE – **p<0.01).
Figure 4—figure supplement 2
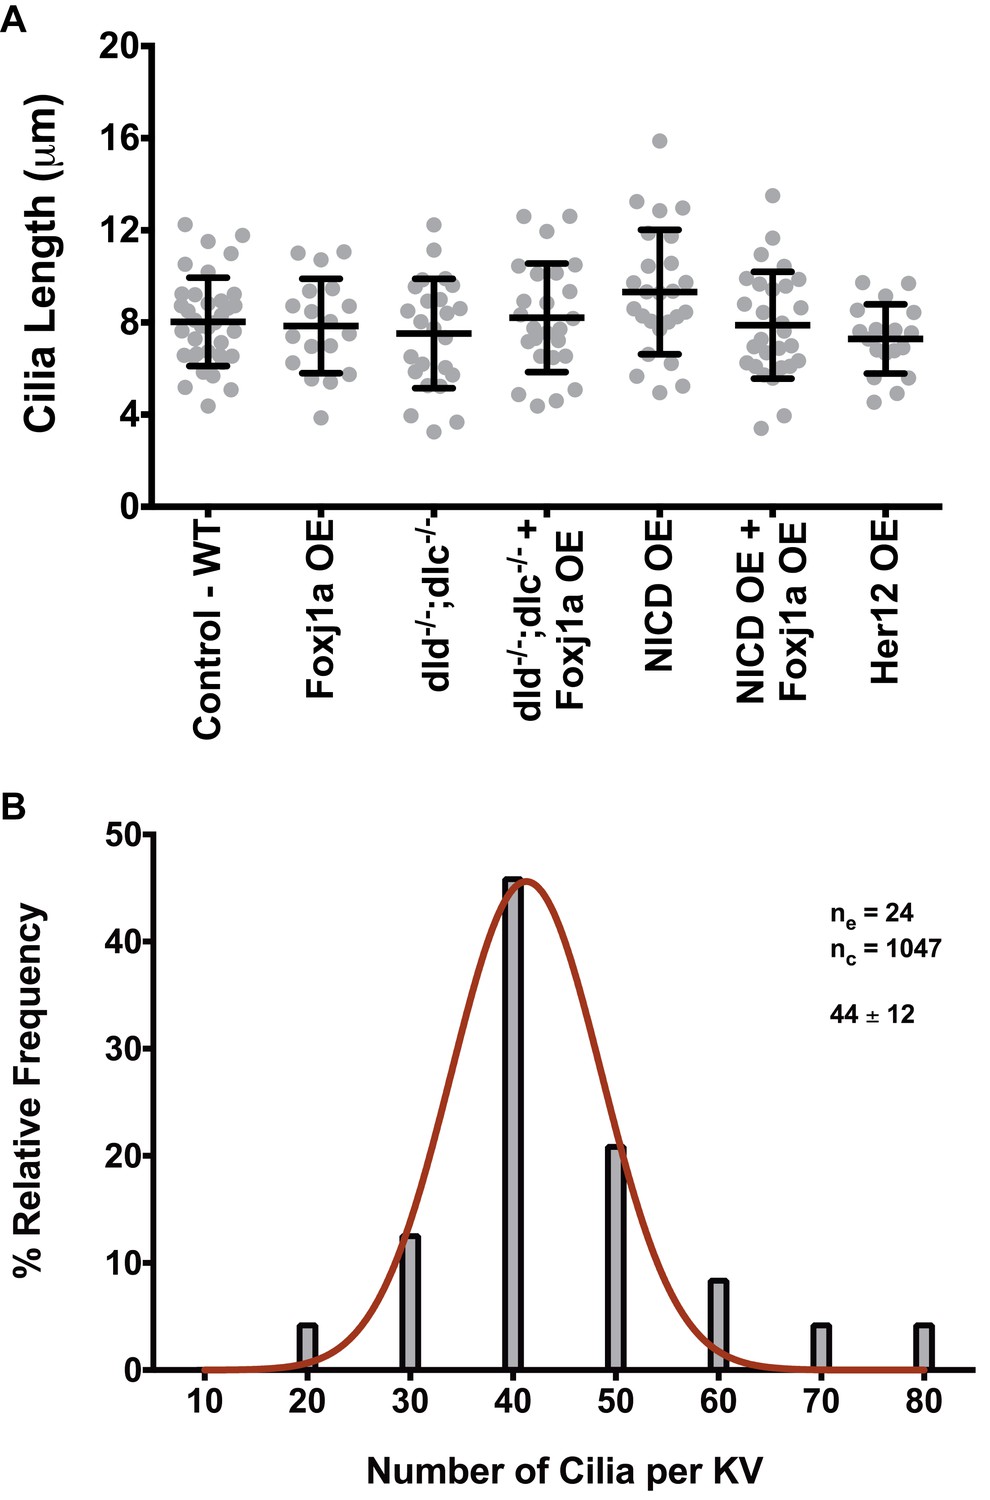
Arl13b-GFP enables live imaging of cilia motility and normalizes cilia length.
(A) KV cilia length was measured in 3D in live imaged KVs, immotile cilia were sampled for each condition from 8 ss embryos expressing arl13b-GFP (400 pg). In total we analyzed: WT – 36 cilia, 11 embryos; Foxj1a OE – 18 cilia, 5 embryos; dld−/−;dlc−/− – 24 cilia, 6 embryos; dld−/−;dlc−/− + Foxj1a OE – 25 cilia, 7 embryos; NICD OE – 29 cilia, 8 embryos; NICD OE +Foxj1 a OE – 24 cilia, 7 embryos; Her12 OE – 18 cilia, 7 embryos. (B) Frequence distribution of the cilia number per KV in a population of WT zebrafish from the AB background. Data was acquired from the WT live embryos at 8 ss used in our assays from Figure 4F. Fiji software was used to visualize and count the number of cilia found in each KV (24 embryos; 1047 cilia). The histogram was fitted with a Gaussian expression (Amplitude = 45.61, Mean = 41.30, SD = 7.318).
Figure 5 with 7 supplements
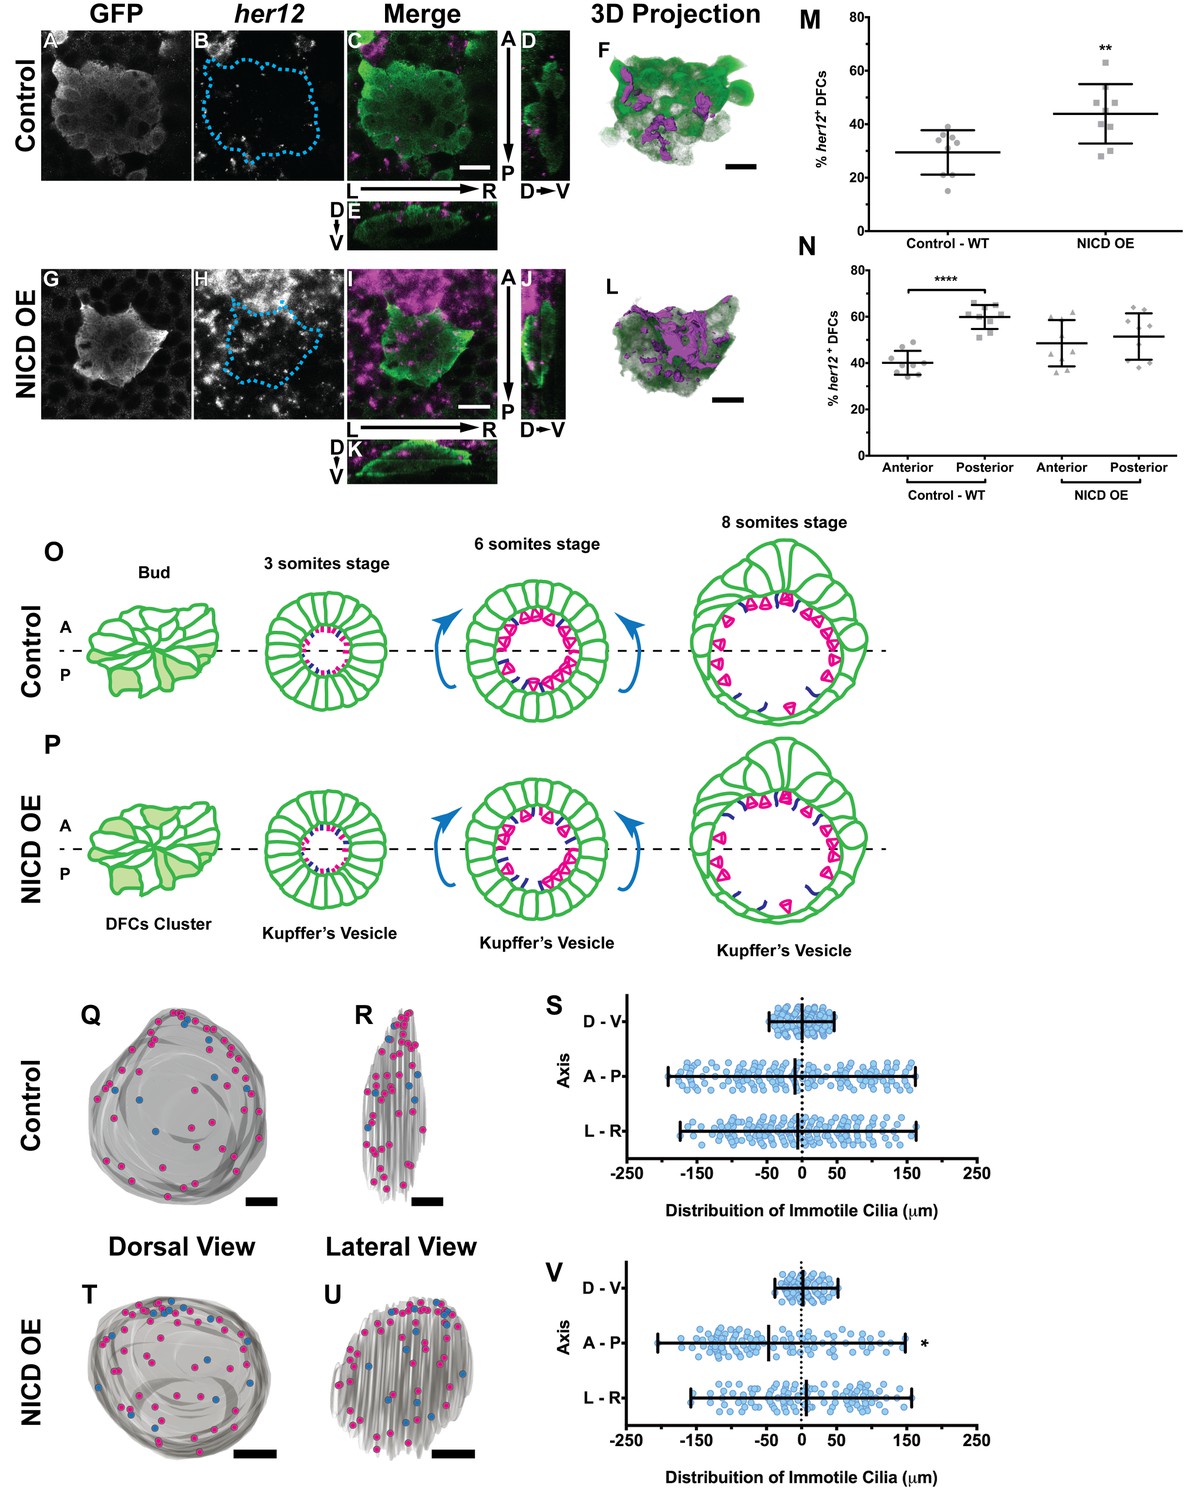
Expression of her12 agrees with future immotile cilia distribution.
In situ hybridization with her12 specific probe in sox17:GFP transgenic embryos at bud stage in Control (A–E) and NICD over-expression embryos (G–K). An antibody anti-GFP was simultaneously used in order to highlight the DFCs (A, G). her12 expression visualized with the Fast Red (Roche) fluorescent precipitate (B, H). In all images, scale bar represents 20 μm. Anterior is to the top and Left is to left. (D–E, J–K) Orthogonal projections emphasising her12 expression in the DFC cluster. (D, J) Anterior is to the top and Dorsal is to left. (E, K) Dorsal is to the top and Left is to left. (M) % her12 positive cells in the DFC cluster in Control (●) and NICD over-expression assay (■). (N) % her12 present in the Anterior or in the Posterior halves of the DFC cluster in Control (●, ■) and NICD over-expression (p, ◆). Unpaired t-test with Welsh’s correction; **p<0.01 and ****p<0.0001. (O–P) Models describing how the cellular reorganization that transforms a DFC cluster into a fully mature KV impacts on the position of the immotile cilia in Control (O) and NICD OE (P) embryos. (Q, R, T, U) 3D projections of representative KVs, where the positions of motile (magenta dots) and immotile cilia (blue dots) are shown for Control (Q–R) and NICD OE (T–U). (Q, T) Dorsal view – Anterior is to the top and Left is to left. (R, U) Lateral view – Anterior is to the top and Dorsal is to left. In all images, scale bar represents 20 μm. (S, V) Distribution of the position of the immotile cilia along the three axes: D – V (Dorsal – Ventral); A – P (Anterior – Posterior); L – R (Left – Right), in Control (S) (17 embryos; 159 cilia) and NICD OE (V) (8 embryos; 107 cilia). Distance from centre represents the distance from the origin of the Cartesian referential (placed at the KV’s centre). *p<0.05, Fisher's Exact Test.
-
Figure 5—source data 1
Contains data on her12 positive DFC number and its anterior posterior location within the DFC cluster.
- https://doi.org/10.7554/eLife.25165.025
-
Figure 5—source data 2
Provides data on the coordinates of immotile cilia denoting posterior to anterior transitions.
- https://doi.org/10.7554/eLife.25165.026
Figure 5—figure supplement 1
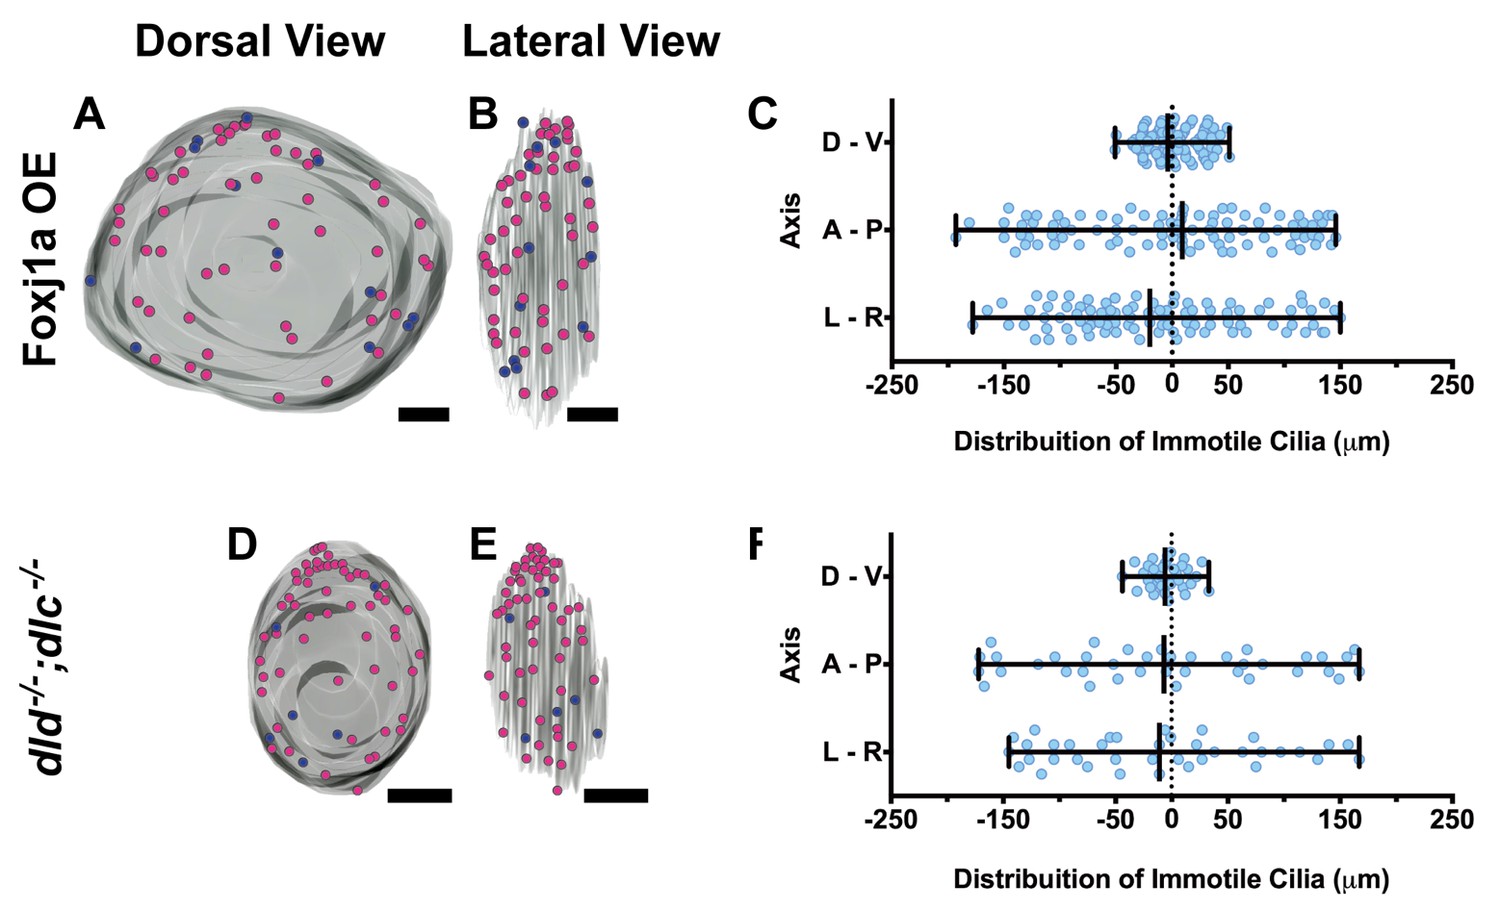
Immotile cilia are homogeneously distributed in the KV.
3D projections of representative KVs, where the position of motile (red dots) and immotile cilia (blue dots) is shown in Foxj1a OE (A–C), and dld−/−;dlc−/− (D–F). (A, D) Dorsal view – Anterior is to the top and Left is to left. (B, E) Lateral view – Anterior is to the top and Dorsal is to left. In all images, scale bar represents 20 μm. (C, F) Distribution of the position of the immotile cilia along the three axes: D – V (Dorsal – Ventral); A – P (Anterior – Posterior); L – R (Left – Right), in Foxj1a OE (C) (9 embryos; 89 cilia), and dld−/−;dlc−/− (F) (7 embryos; 38 cilia). Distance from center represents the distance from the origin of the Cartesian referential (placed at the KV’s center). Fisher's Exact Test, p<0.05.
Figure 5—figure supplement 2
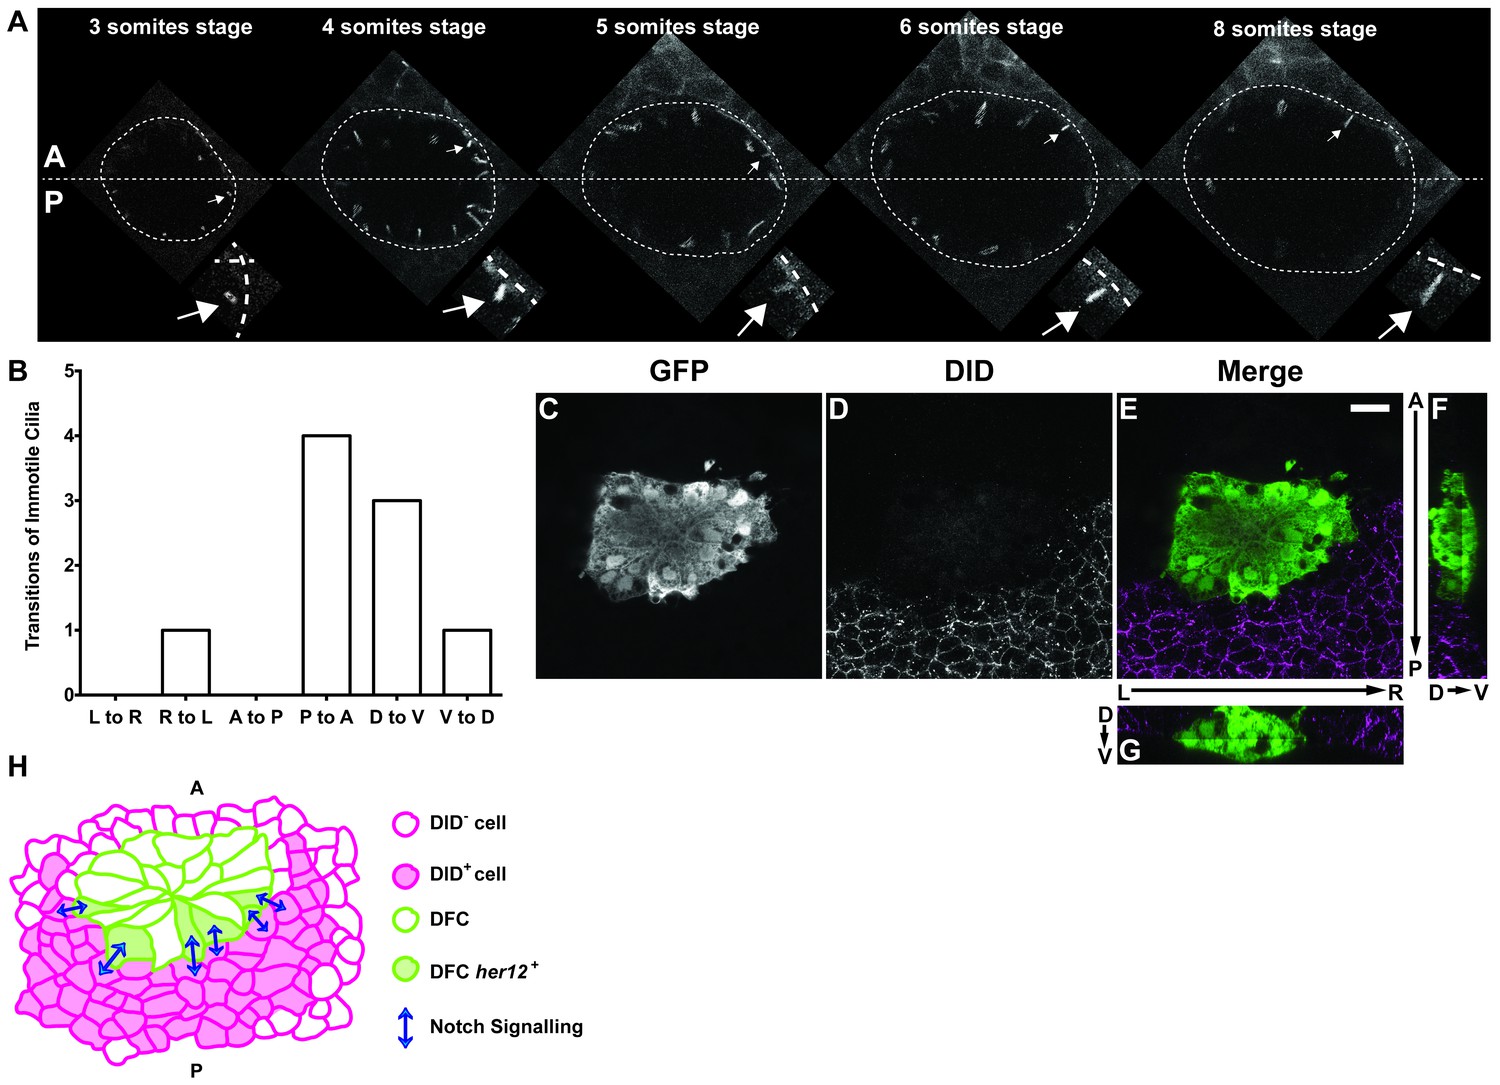
Positions of immotile cilia in the anterior-posterior axis change through development.
(A) Transition of an immotile cilium from a Posterior position to an ever more Anterior position as development of the embryo progresses from 3 ss to 8 ss. (B) Number and type of transitions of Immotile cilia along the three axes (Anterior – Posterior; Dorsal – Ventral; Left – Right) from 3 to 8 somites stage (4 embryos, 9 cilia transitions, 19 immotile cilia tracked). L to R – Left to Right; R to L – Right to Left; A to P – Anterior to Posterior; P to A – Posterior to Anterior; D to V – Dorsal to Ventral; V to D – Ventral to Dorsal. (C–G) Localization of the DlD ligand by immune-histochemistry with an antibody anti-DlD (D) in sox17:GFP transgenic embryos at bud stage in Control. An antibody anti-GFP was simultaneously used in order to highlight the DFCs (C), with the resulting merged image in (E). Scale bar represents 20 μm. Anterior is to the top and Left is to left. (F–G) Orthogonal projections emphasising DLD expression. (F) Anterior is to the top and Dorsal is to left. (G) Dorsal is to the top and Left is to left. (H) Model depicting how the NS is occurring between the DLD positive surrounding cells and the Notch positive DFC in the posterior region of the cluster.
Figure 5—video 1
In situ hybridization + immuno staining with her12 RNA probe and antibody anti-GFP of a cluster of DFCs at bud stage from a sox17:GFP embryo.
In green are the DFCs (sox17:GFP positive cells) highlighted by the anti-GFP antibody. her12 expression is visualized with the Fast Red (Roche) fluorescent precipitate in magenta. Anterior is to the top and Left is to left.
Figure 5—video 2
3D reconstruction of the WT her12 expression in the DFCs cluster at bud stage.
3D reconstruction was performed with Amira software. Anterior is to the top and Left is to left.
Figure 5—video 3
In situ hybridization + immuno staining with her12 RNA probe and antibody anti-GFP of a cluster of DFCs at bud stage from a sox17:GFP embryo injected with 100 pg of NICD mRNA at 1 cell stage.
In green are the DFCs (sox17:GFP positive cells) highlighted by the anti-GFP antibody. her12 expression is visualized with the Fast Red (Roche) fluorescent precipitate in magenta. Anterior is to the top and Left is to left.
Figure 5—video 4
3D reconstruction of her12 expression in the DFCs cluster in an embryo over-expressing NICD at bud stage.
3D reconstruction was performed with Amira software. Anterior is to the top and Left is to left.
Figure 5—video 5
3D reconstruction of the WT DLD localization around the DFCs cluster at bud stage.
3D reconstruction was performed with Amira software. Anterior is to the top and Left is to left.
Figure 6
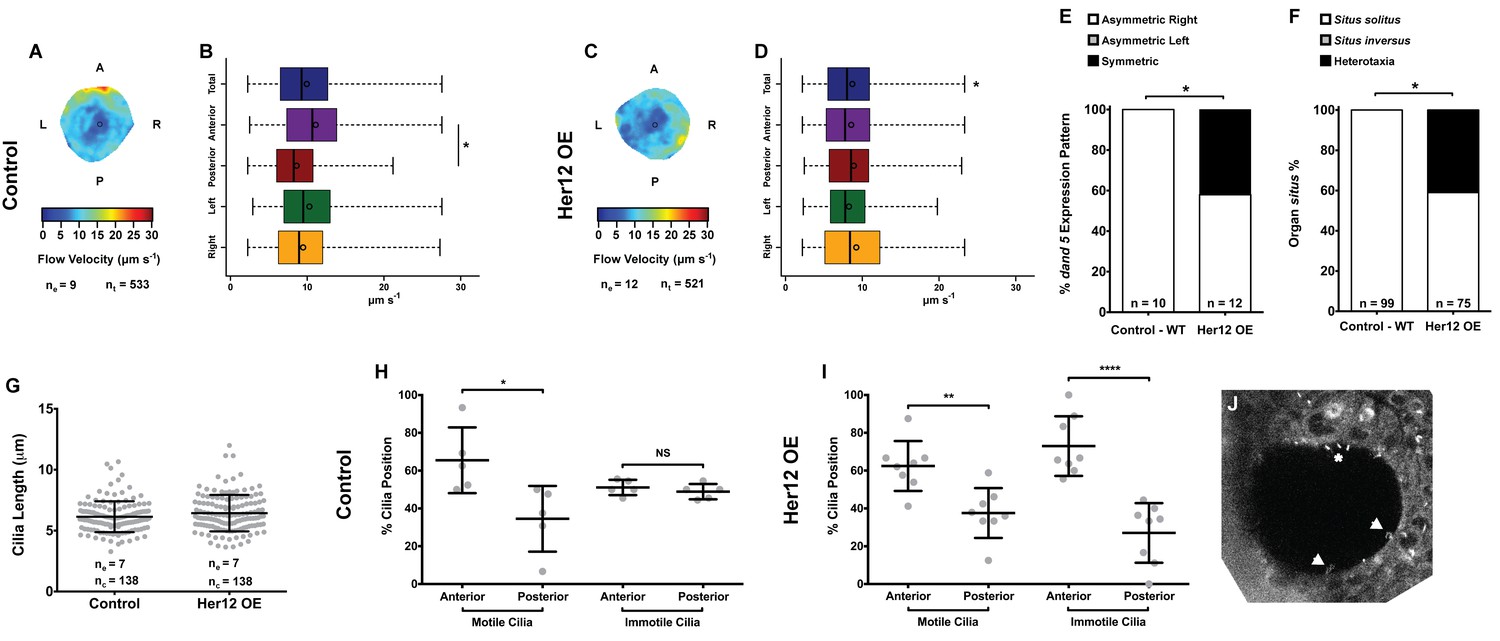
Overexpression of her12 impacts on fluid flow dynamics, dand5 expression pattern and organ situs.
Fluid flow pattern and intensity found in Control (A–B) and in Her12 OE (C–D) embryos. (A, C) Heat maps of flow speed showing detailed regions within the KV for pooled embryos in Control (A) and Her12 OE (C). The pseudo-colour scale represents flow speed in μm s−1, where red represents high speed versus low speed in blue. ne – number of embryos; ntracks – number of tracks followed. (B, D) Box plots for instantaneous flow speed measured at different locations of the KVs, based on the same data set used to generate the heat maps, in Control (B) and Her12 OE (D). Box plots display the median with a vertical line, and the whiskers represent the minimum and maximum values observed. Means are represented as small circles. *p<0.05, Wilcoxon test. (E) Percentages of dand5 expression pattern at 8 ss, as determined by in situ hybridization in the same embryos used to study the fluid flow, in Control and Her12 OE. (F) Organ situs determined by observing the heart position at 30hpf, and the liver and pancreas positions at 53 hpf, by in situ hybridization with a probe for foxa3, in Control and Her12 OE. Situs solitus stands for left heart and liver; Situs inversus stands for right heart and liver; Heterotaxia stands for any other possible combination for the heart and liver position. *p<0.05, Fisher's Exact Test. (G) KV cilia length from 8 somite stage embryos in Control (7 embryos, 138 cilia) and Her12 OE (7 embryos, 138 cilia). The cilia were measured in 3D in fixed samples. (H–I) Immotile and motile cilia distribution along the Anterior – Posterior axis in Control (5 embryos) (H) and Her12 OE (9 embryos) (I) 8 somite stage embryos. Unpaired t-test with Welsh’s correction; *p<0.05 **p<0.01 and ****p<0.0001. (J) Depicts a KV slice where motile (white arrows) and immotile cilia can be observed (white asterisk).
-
Figure 6—source data 1
Provides data on flow speed and CBF upon her12 overexpression.
Shows data for dand5 pattern and organ situs scoring per embryo. Shows the data for cilia length measurements in 3D and the evaluation of motile and immotile cilia localization according to the anterior – posterior axis of each stack of images.
- https://doi.org/10.7554/eLife.25165.033
Author response image 1
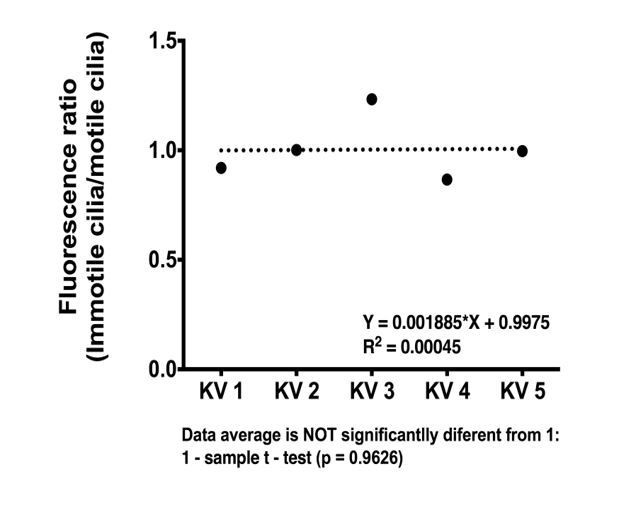
foxj1a::GFP expression levels do not differ significantly between motile and immotile-cell type.
Ratio of average fluorescence intensity values between immotile (total n = 18) and motile cilium cell type (total n = 22) is shown for each KV analyzed (n = 5).
Videos
Video 1
Scan of Wild Type KV showing motile and immotile cilia.
Embryo was injected with 400 pg Arl13b-GFP at 1 cell stage and imaged as described in Figure 1. Anterior is to the top and Left is to left.
Video 2
Time lapse from 3 to 8 somites stage with respective cilia trackings.
Tracking of the cilia was performed with Imaris software. Anterior is to the top and Left is to left.
Video 3
Immuno-staining of a KV of an 8 ss embryo from the transgenic line Foxj1a:GFP.
In blue are the nuclei stained with DAPI; in green the foxj1a positive KV cells; and in magenta are the KV cilia stained with antibody against acetylated α-tubulin. This experiment allowed us to determine if all monociliated KV cells expressed Foxj1a. Anterior is to the top and Left is to left.
Tables
Table 1
Transmitted electron microscopy sampling of cilia from the Kupffer’s vesicle.
https://doi.org/10.7554/eLife.25165.021| # KV | Total number of cilia observed | Central-pair | Dynein arms | Microns covered |
|---|---|---|---|---|
| 1 | 37 | 35 | 37 | 65 |
| 2 | 40 | 39 | 40 | 70 |
| 3 | 24 | 20 | 24 | 58 |
Additional files
-
Supplementary file 1
Microarray data.
Excel file that contains Table S1a - List of 706 genes with significantly altered transcription. This list contains 706 genes with a fold change in transcription higher than 2, in the DFCs from dld−/− mutant zebrafish embryos. Table S1b – List of motility associated genes from the Table S1a that have been associated with cilia in the different model organisms. Analysis performed with Cildb v2. Table S1c – List of primers sequences used for genotyping dld−/− mutant zebrafish embryos and for qPCR validations.
- https://doi.org/10.7554/eLife.25165.034
-
Supplementary file 2
Contains the R script for creating and analysing the flow maps.
- https://doi.org/10.7554/eLife.25165.035
-
Transparent reporting form
- https://doi.org/10.7554/eLife.25165.036
Download links
A two-part list of links to download the article, or parts of the article, in various formats.
Downloads (link to download the article as PDF)
Open citations (links to open the citations from this article in various online reference manager services)
Cite this article (links to download the citations from this article in formats compatible with various reference manager tools)
Notch/Her12 signalling modulates, motile/immotile cilia ratio downstream of Foxj1a in zebrafish left-right organizer
eLife 6:e25165.
https://doi.org/10.7554/eLife.25165


