Cytoneme-mediated cell-cell contacts for Hedgehog reception
- Universidad Autónoma de Madrid, Spain
Figures
Figure 1 with 3 supplements
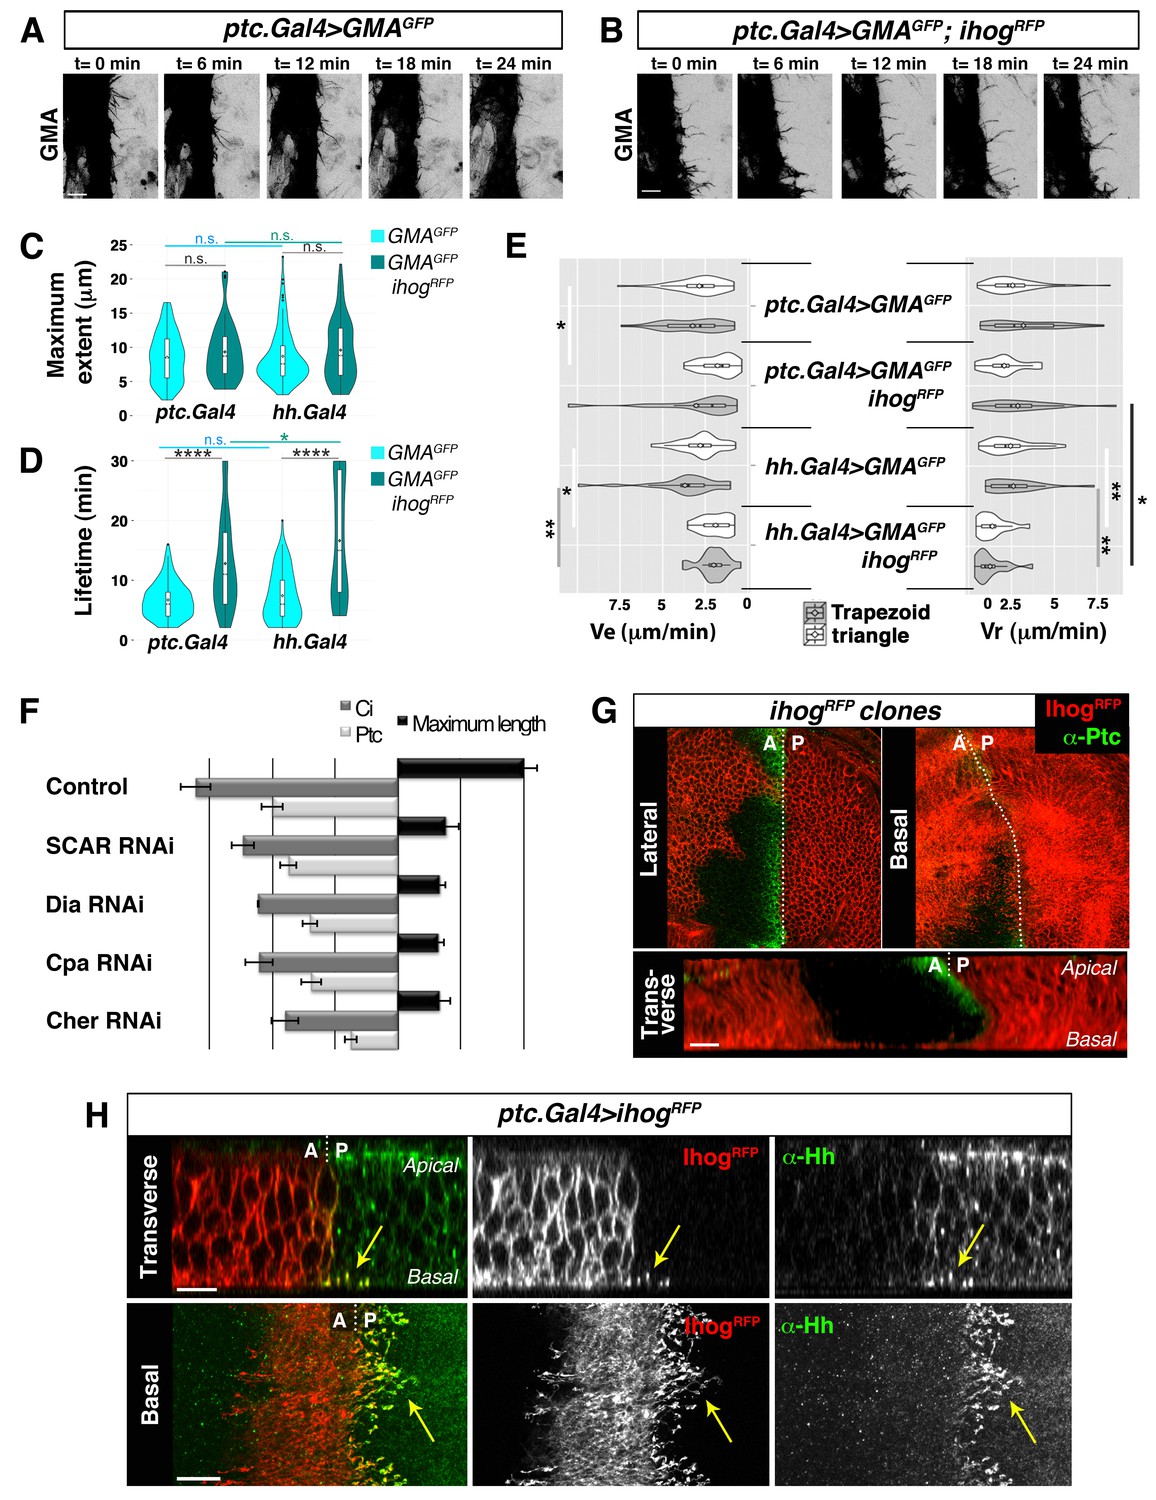
Cytonemes emanating from the A compartment cells.
(A, B) Dynamic behaviour of cytonemes emanating from the A compartment abdominal histoblasts, monitored by the actin cytoskeleton marker GMA-GFP alone (the actin-binding domain of moesin fused to GFP) (A), or co-expressed with Ihog-RFP (B), after 24 hr of expression using the ptc.Gal4 driver. Hh-receiving cells produce highly dynamic filopodia visualized by expressing GMA-GFP (A), which are more stabilized when co-expressing Ihog-RFP (B). (C–E) Violin plots represent filopodia maximum extent (C), lifetime (D), and elongation velocity (Ve) and retraction velocity (Vr) measurements (E). Statistical analysis was done to compare the expression, for 24 hr, of GMA-GFP alone or co-expressed with Ihog-RFP in Hh-receiving cells (ptc.Gal4) or Hh-producing cells (hh.Gal4). Coloured diamonds indicate the mean of the data and black lines the median. *p<0.05, **p<0.01, ***p<10−3, ****p<10−4. Scale bars represent 10 μm. (F) Interfering with A cytonemes extension (by transient co-expression of UAS.ihog-RFP together with UAS.scar-RNAi, UAS.dia-RNAi, UAS.cpa RNAi or UAS.cher-RNAi for 30 hr using the ptc.Gal4 driver) affects the spreading of the Hh gradient in the wing disc, monitored by Ptc and Ci expressions (by transiently expressing the UAS-RNAi lines and not UAS.ihog-RFP for 30 hr). Graph representing the average of 5 discs in 3 independent experiments (error bars represent SDs). (G) Two Ihog-RFP expressing clones induced in the wing pouch, one in the A compartment and another in the P compartment, in lateral, basal and transverse (Z-stack) sections. Note that very distant cells contact at the basal region through cytonemes oriented towards the A/P compartment border (arrow). (H) A ptc.Gal4, tub.Gal80ts>UAS.ihog-RFP wing disc after 24 hr at the restrictive temperature and stained with α-Hh antibody. Note that A compartment cytonemes expressing Ihog-RFP capture Hh produced by the P compartment cells (arrows). The data shown were consistent in at least three independent experiments with an average of 5–10 discs in each experiment. Bars, 10 µm.
Figure 1—figure supplement 1

Phase models based on filopodia dynamics.
(A) 2-Phases ‘triangle’ dynamics. Experimental data from a filopodium extent over time is represented on light blue; its ‘trapezoid’ model curve is represented in black and its ‘triangle’ model curve in grey. Notice that the filopodium dynamics are more similar to the ‘triangle’ model with an elongation and a retraction phase than to the ‘trapezoid’ model. (B) 3-Phases ‘trapezoid’ dynamics. Data from a filopodium extent over time is represented in light blue; its ‘trapezoid’ model curve is represented in black and its ‘triangle’ model curve in grey. Notice that the filopodium dynamics are more similar to the ‘trapezoid’ model with a stationary phase between the elongation and retraction phases than to the ‘triangle’ model.
Figure 1—figure supplement 2

Hh-receiving cells filopodia have similar dynamics to Hh-producing cells.
(A). Table showing the maximum extent (E max), lifetime, and elongation (Ve) and retraction (Vr) velocities of filopodia from Hh-producing and Hh-receiving cells with and without Ihog overexpression. (B–E) Graphs representing GMA filopodia extent over time expressing GMA alone or co-expressed with Ihog in Hh-receiving cells (B, D) or in Hh-producing cells (C, E) respectively. (D’, E’) Five time frames from Video 1B (D’) and Video 2B (E’). GMA filopodia with high levels of Ihog (black arrows) are less dynamic (black curves) than those with lesser levels (grey arrows and grey curves) or absence (cyan arrows and cyan curves) of Ihog. Bars, 10 µm.
Figure 1—figure supplement 3
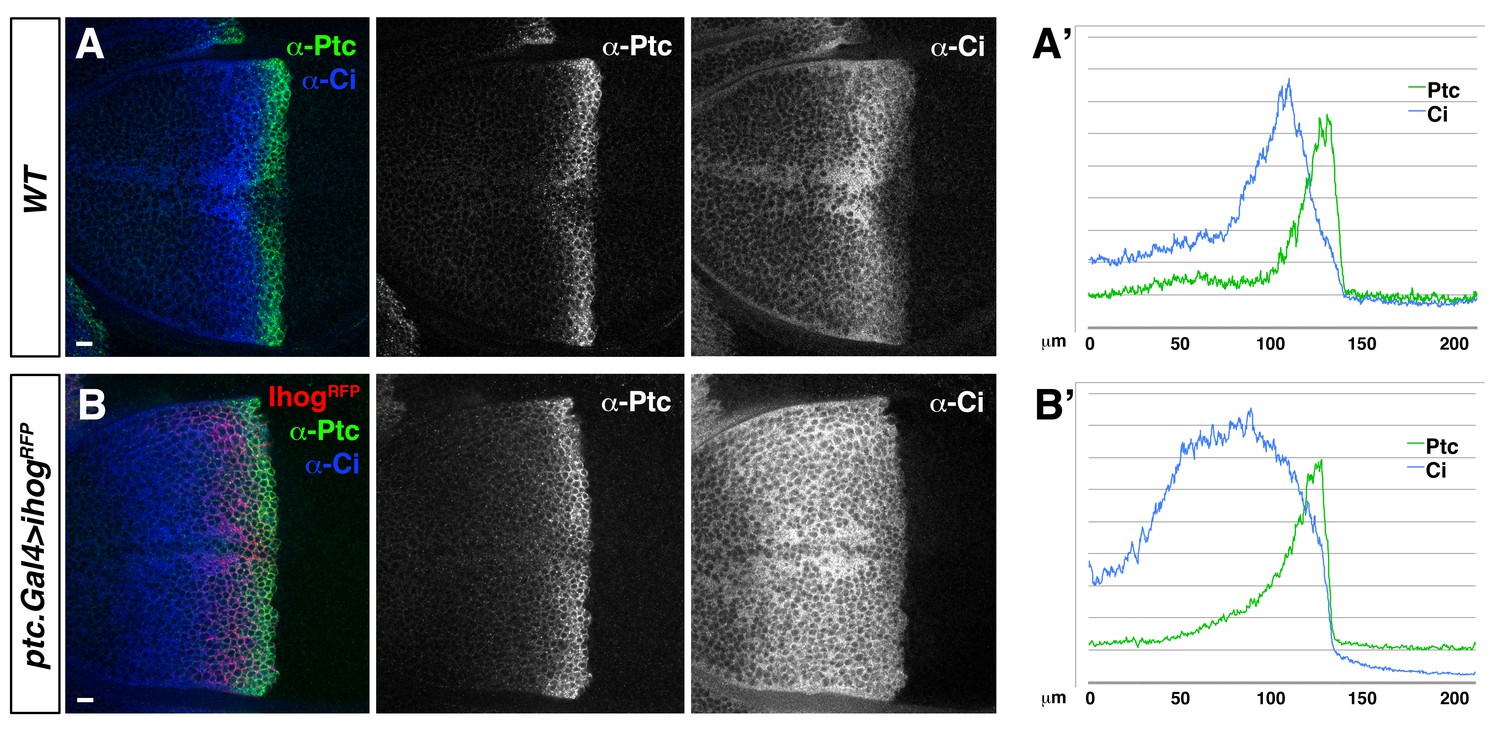
Ihog overexpression in Hh-receiving cells leads to an extended Hh gradient.
(A, B). Lateral sections of a wild type, WT (A) and a ptc.Gal4>UAS.ihog-RFP (B) wing discs after 24 hr at restrictive temperature, co-labelled with α-Ptc and α-Ci antibodies. (A’, B’) Graphs showing plots of fluorescence intensity of Ptc and Ci shown in A (A’) and B (B’). Note the extension of Ptc and Ci domains in response to Ihog overexpression in Hh-receiving cells. The data shown were consistent in at least ten independent experiments with an average of 5–10 discs in each experiment. Bars, 10 µm.
Figure 2 with 1 supplement
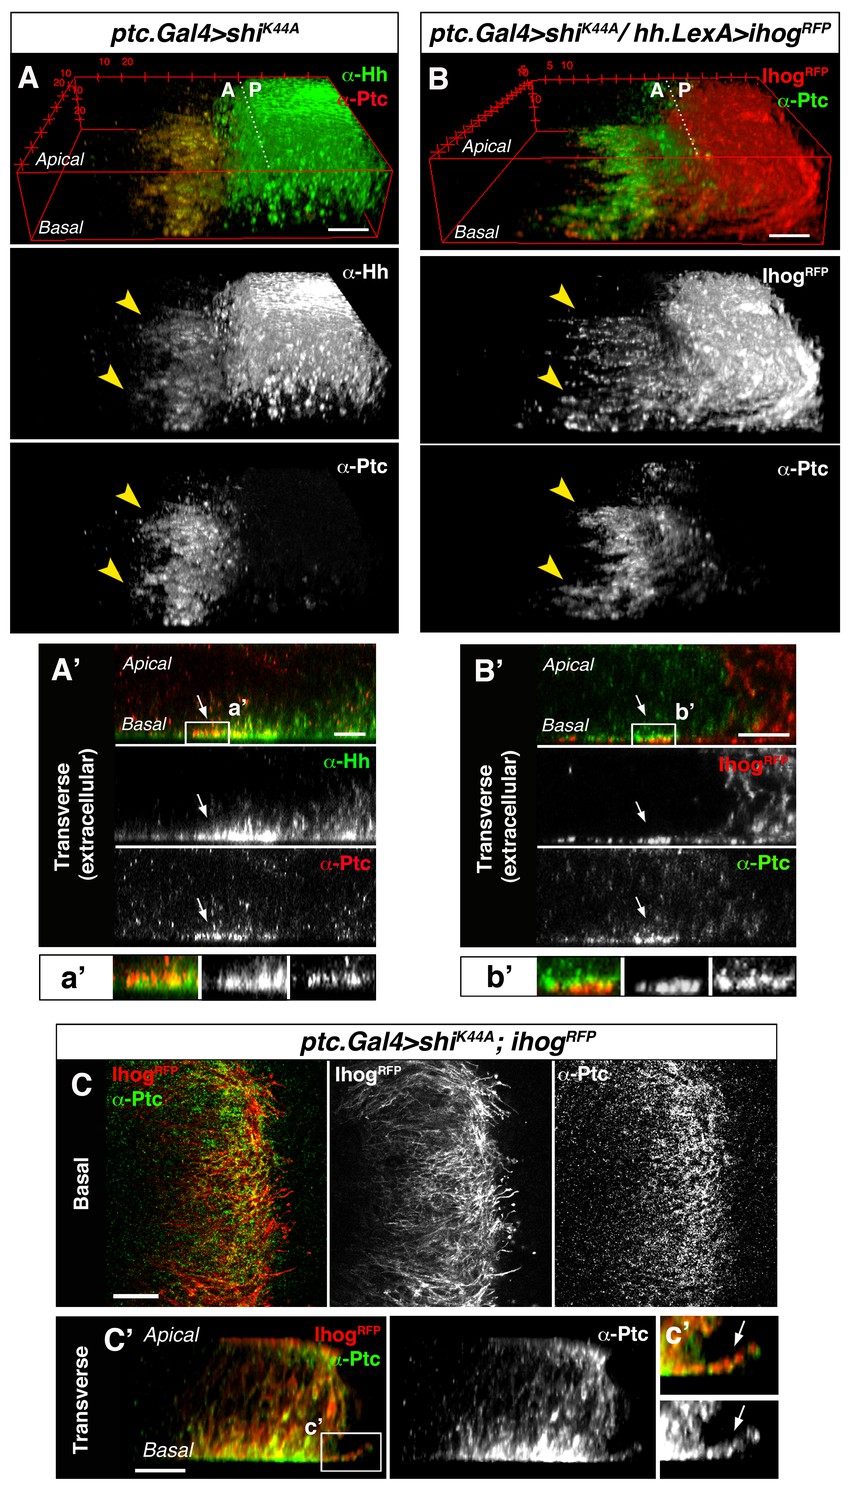
Cytonemes from A and P compartment cells interact during Hh reception.
(A) 3D view of a ptc.Gal4, tub.Gal80ts>UAS.shiK44A wing disc after 12 hr at the restrictive temperature and double stained for Hh and Ptc. Note that Ptc colocalizes with Hh at the basal membranes of the Hh-receiving cells when endocytosis is frozen using a dominant negative form of Dynamin (arrowheads). (A’) Transverse section of an extracellular staining for both Hh and Ptc in a similar wing disc. Note the colocalization of Hh and Ptc in the most basal part of the disc (arrows). (a’) Magnification of A’. (B) 3D view of a ptc.Gal4, tub.Gal80ts>UAS.shiK44A / hh.LexA>LexAop.ihog-RFP wing disc after 12 hr at the restrictive temperature and labelled with α-Ptc antibody. Note Ihog-RFP localization in the P compartment cytonemes and Ptc in the A compartment cytonemes. (B’) Transverse section of a similar wing disc stained for extracellular Ptc. Note the colocalization of Ihog and Ptc in the most basal part of the epithelium (arrows). (b’) Magnification of B’. (C, C’) Basal (C) and transverse (C’) sections of a ptc.Gal4, tub.Gal80ts>UAS.ihog-RFP>UAS.shiK44A wing disc after 12 hr at the restrictive temperature and stained with α-Ptc antibody. (c’) Magnification of C’. Note that when endocytosis is frozen, Ptc is located in A compartment cytonemes labelled with Ihog-RFP (arrow).
Figure 2—figure supplement 1
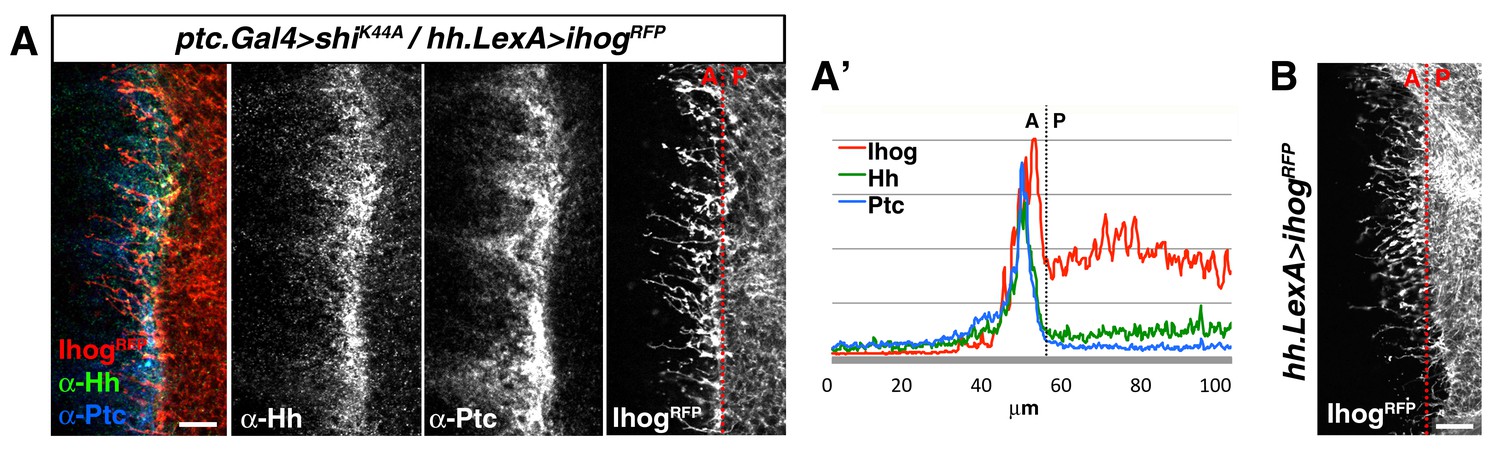
Cytonemes from A and P compartment cells interact during Hh reception.
(A) Basal section of a ptc.Gal4, tub.Gal80ts>UAS.shiK44A / hh.LexA>LexAop.ihog-RFP wing disc after 12 hr at the restrictive temperature before dissection and co-labelled with α-Hh and α-Ptc antibodies. Note Ihog-RFP accumulated in P compartment cytonemes and Ptc and Hh in A compartment cytonemes. (A’) Graph showing a plot of fluorescence intensity of Ihog, Hh and Ptc along the basal surface of the wing disc in A. (B) A hh.LexA>LexAop.ihog-RFP wing disc showing Ihog-RFP in P cytonemes when internalization is not blocked in the A compartment. Bars, 10 µm.
Figure 3 with 1 supplement
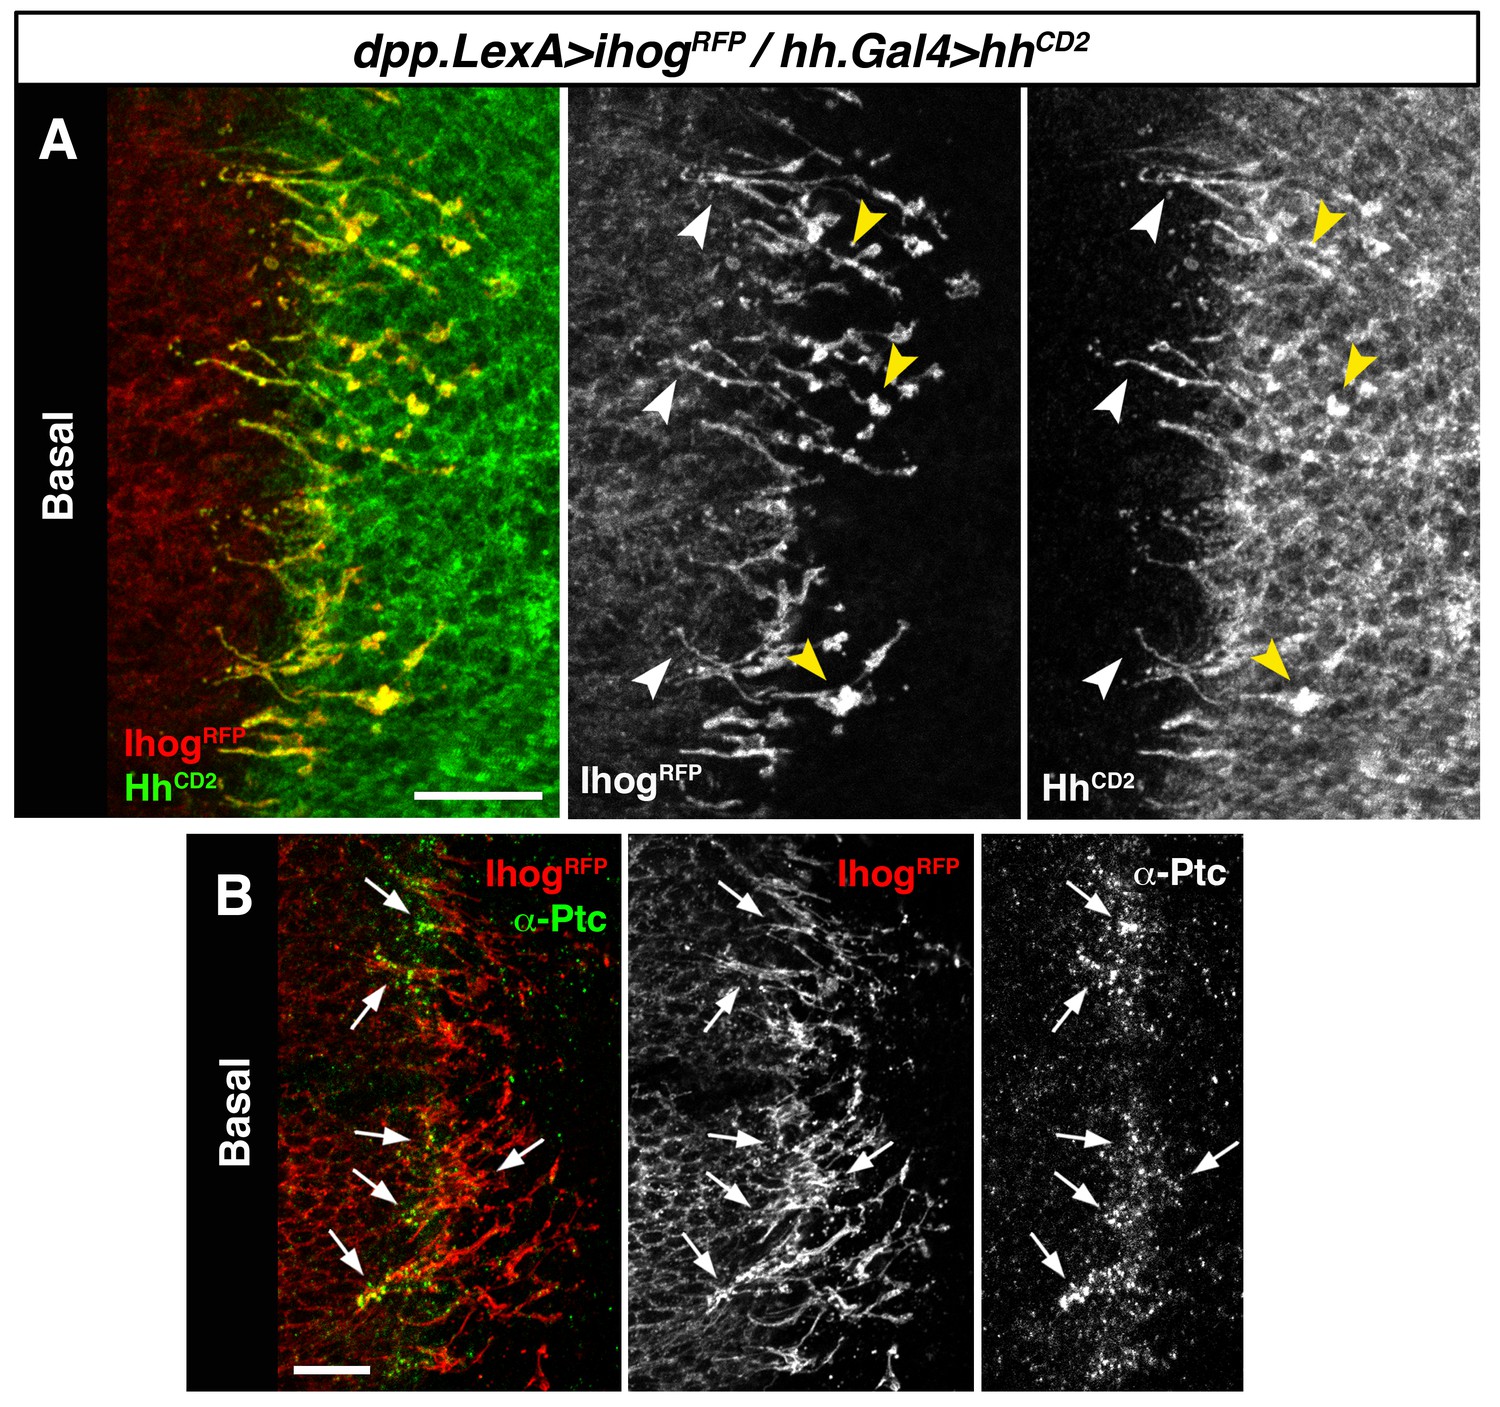
Hh reception at contacts between Hh-sending and Hh-receiving cytonemes.
(A) A dpp.LexA>LexAop.ihog-RFP / tub.Gal80ts, hh.Gal4>UAS.hh-CD2 wing disc grown for 24 hr at the restrictive temperature and labelled with α-CD2 antibody. Observe that Hh-receiving and Hh-CD2-presenting cytonemes interact along their lengths. Higher levels of Ihog are in those A cytonemes that interact with P cytonemes at both sides of the A/P compartment border (white and yellow arrowheads), probably due to the higher stability of these cytonemes. (B) Basal section of a similar wing disc labelled with α-Ptc antibody. Observe the accumulation of Ptc and Ihog at these A cytonemes (arrows), probably because Ptc does not internalize Hh-CD2 so that the whole internalization complex is accumulated at the Hh-receiving cytonemes in the A compartment. The data shown were consistent in at least three independent experiments with an average of 5–10 discs in each experiment. Bars, 10 µm.
Figure 3—figure supplement 1

Hh reception at contacts between Hh-sending and Hh-receiving cytonemes.
(A) The membrane-tethered Hh-CD2 protein is localized in cytonemes in a tub.Gal80ts, hh.Gal4>UAS.hh-CD2 wing disc. (B) A compartment cytonemes interact with Hh-CD2-presenting cytonemes labelled with the actin marker lifeactin-GFP and with α-CD2 antibody in a dpp.LexA>LexAop.ihog-RFP / tub.Gal80ts, hh.Gal4>UAS.hh-CD2, UAS-lifeactin-GFP wing disc. (C) Ihog-RFP is accumulated in A compartment cytonemes that interact with Hh-CD2-presenting cytonemes in a dpp.LexA>LexAop.ihog-RFP / tub.Gal80ts, hh.Gal4>UAS.hh-CD2 wing disc. Note Ihog accumulation in cytonemes crossing the A/P compartment border from A to P and from P to A. (C’) Graph showing a plot of fluorescence intensity of Ihog-RFP, Ptc and Hh (labelled with α-Hh and α-Ptc antibodies) along the basal surface of a wing disc similar to the one in C. (D) A dpp.LexA>LexAop.ihog-RFP wing disc to show that Ihog-RFP is not significantly accumulated in the A compartment cytonemes when Hh-CD2 is not present. (E) Longitudinal section at the A/P compartment border of wing disc with the same genotype as in C, co-labelled with α-Hh and α-Ptc antibodies. Note the accumulation of Ptc, Ihog and Hh-CD2 at the most basal part of the disc epithelium (arrows). (F) Longitudinal section at the A/P compartment border of a dpp.LexA>LexAop.ihog-RFP / tub.Gal80ts, hh.Gal4>UAS.hh-GFP wing disc to compare the behaviour of Hh-GFP with Hh-CD2 shown in E. All larvae (A–F) were grown 24 hr at the restrictive temperature before dissection. The data shown were consistent in at least three independent experiments with an average of 5–10 discs in each experiment. Bars, 10 µm.
Figure 4
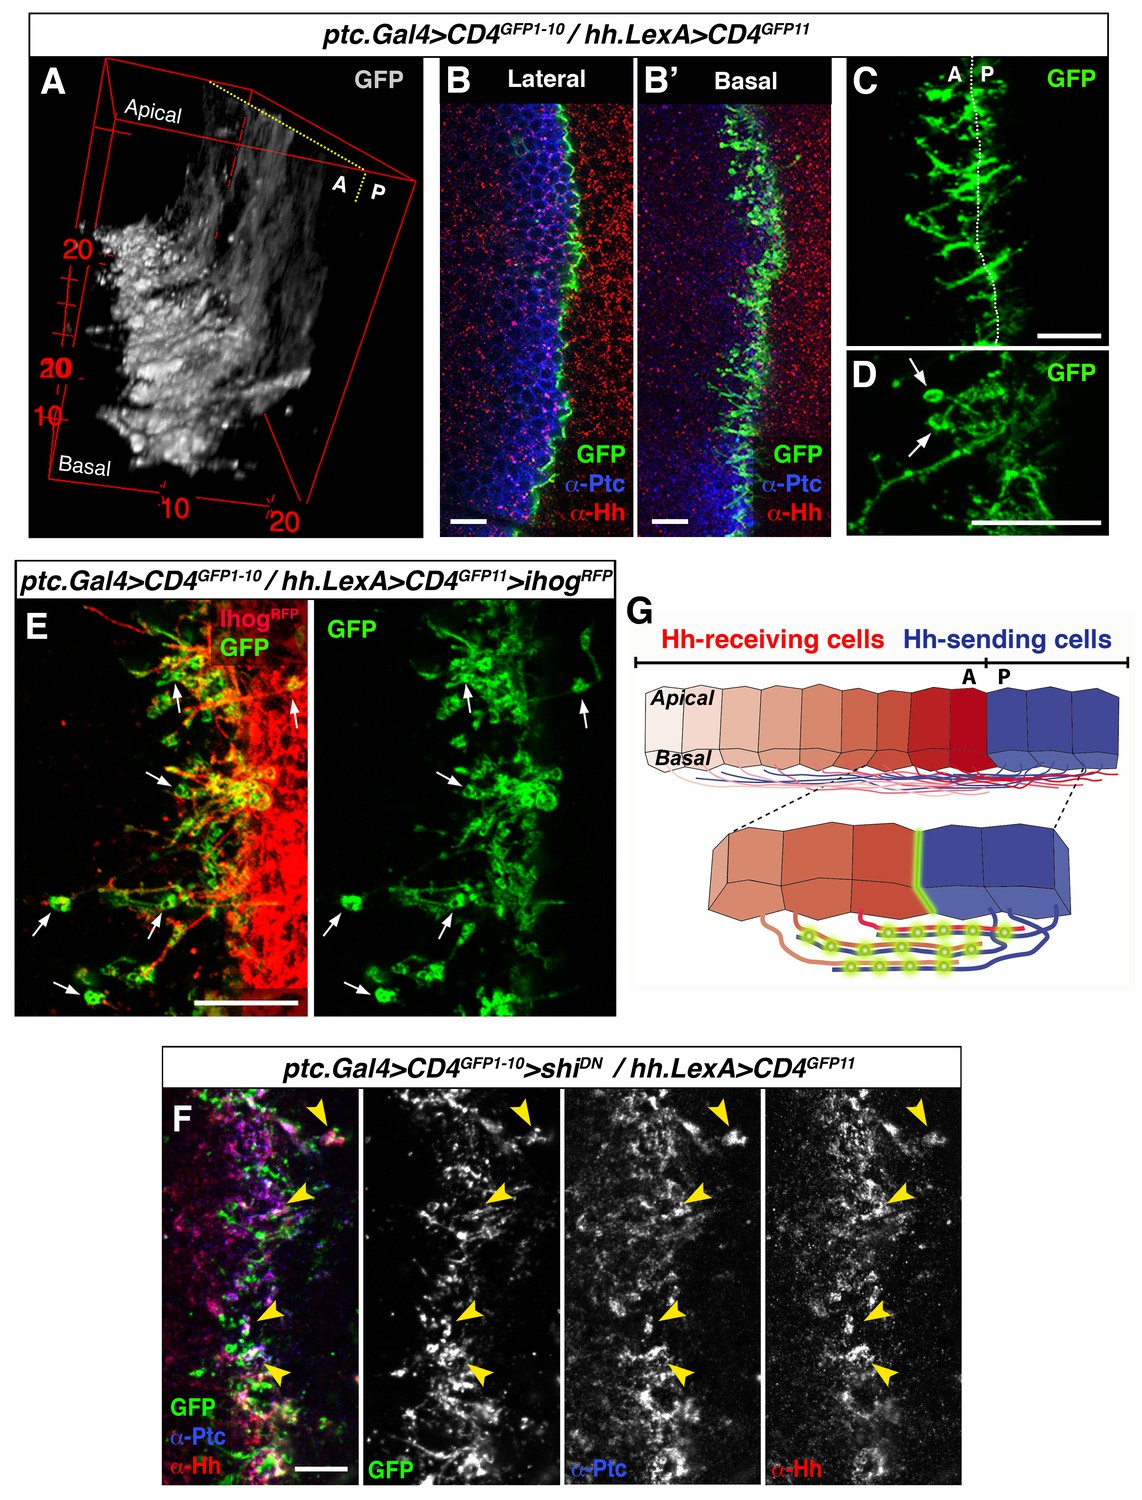
GRASP showing cytoneme-cytoneme interaction at the A/P compartment border.
(A) 3D view of a ptc.Gal4, tub.Gal80ts>UAS.CD4-GFP1-10 / hh.LexA>LexAop.CD4-GFP11 wing disc after 24 hr at the restrictive temperature. (B, B’) A wing disc of the same genotype as in A co-labelled with α-Ptc and α-Hh antibodies. Note the GFP complementation at the A/P compartment border in a lateral (B) and a basal section (B’). (C, D) Basal sections showing GRASP fluorescence in similar wing discs. Cytonemes cross the A/P compartment border from A to P and from P to A (C). Annular rings are visualized along these interacting cytonemes (D, arrows). (E) A ptc.Gal4, tub.Gal80ts>UAS.CD4-GFP1-10 / hh.LexA>LexAop.CD4GFP11>LexAop.ihogRFP wing disc after 24 hr at the restrictive temperature to visualize Ihog labelled cytonemes emanating from the P compartment. Note the GRASP signal in the circular structures attached to cytonemes (arrows). (F) A ptc.Gal4, tub.Gal80ts>UAS.CD4-GFP1-10>UAS.shiK44A / hh.LexA>LexAop.CD4-GFP11 wing disc after 12 hr at the restrictive temperature and co-labelled with α-Hh and α-Ptc antibodies. Note the colocalization of GRASP, Ptc and Hh in the same structures at the most basal part of the disc (arrowheads). (G) Diagram depicting cytoneme interactions at the A/P compartment border. The green colour corresponds to the GRASP signal at the A/P compartment border and also at the specific sites for Hh reception along overlapping cytonemes. The data shown were consistent in at least four independent experiments with an average of 8 discs in each experiment. Bars, 10 µm.
Figure 5 with 3 supplements
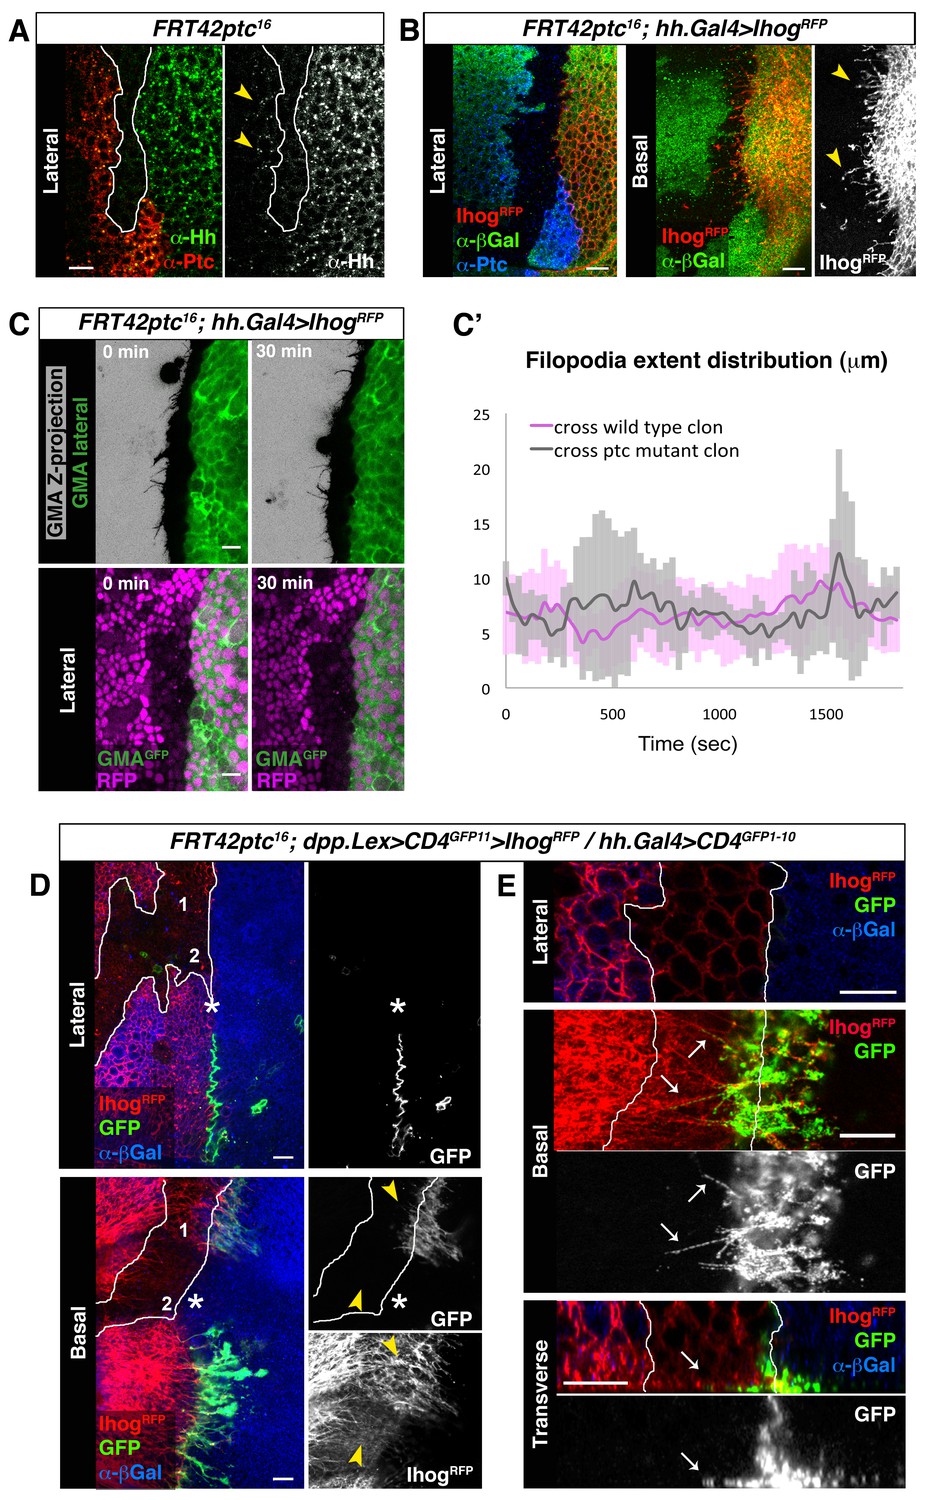
Cytonemes cross ptc−/− mutant clones at the A/P compartment border.
(A) A ptc16 null clone in the A compartment abutting the A/P compartment border of a wing disc co-labelled with α-Hh and α-Ptc antibodies. Note that both Ptc and Hh proteins are detected anterior to the clone in the A compartment (arrowheads). (B) P compartment cytonemes extend through a ptc−/− clone (arrowheads). Lateral and basal sections of a ptc−/− clone (absence of βGal) in the A compartment with Ihog-RFP expression in the P compartment to visualize cytonemes (FRT42D ptc16 / hh.Gal4, tub.Gal80ts>UAS.ihog-RFP wing disc after 24 hr at the restrictive temperature) co-labelled with α-βGal and α-Ptc antibodies. (C) First and last time frames from Video 6 displaying a lateral view of GMA-GFP signal to easily visualize cell perimeters together with a Z-projection of GMA-GFP where filopodia are shown (top panels) or with a lateral view of nuclear RFP to distinguish between wild-type (magenta nuclei) and ptc−/− mutant (absence of magenta nuclei) territories (bottom panels). Scale bars represent 10 μm. (C’) Graph showing extent distribution over time of GMA-GFP filopodia emanating from Hh-producing cells. Notice that there is no difference between filopodia crossing a wild-type (magenta) or a ptc−/− mutant (grey) clone territories. (D) A ptc16 clone induced in the A compartment abutting the compartment border in a dpp.LexA>LexAop.CD4-GFP11>LexAop.ihog-RFP / tub.Gal80ts, hh.Gal4>UAS.CD4-GFP1-10 wing disc after 24 hr at the restrictive temperature and labelled with α-βGal antibody to identify the mutant clone (absence of βGal). Note the GRASP signal is not visualized laterally (asterisk). Note also that basal cytonemes cross the ptc−/− clone in region 1 but not in region 2, and that the GRASP signal is restricted to region 1 and absent from region 2 (arrowheads). E) Another ptc−/− clone induced in a disc with the same genotype as in D showing the interaction between cytonemes from wild type cells anterior to the clone and cytonemes from the P compartment. Note the GRASP signal along basal cytonemes from wild type A compartment cells that traverse the ptc−/− clone (arrows). The data shown were consistent in at least three independent experiments with an average of 5–10 discs in each experiment. Bars, 10 µm.
Figure 5—figure supplement 1
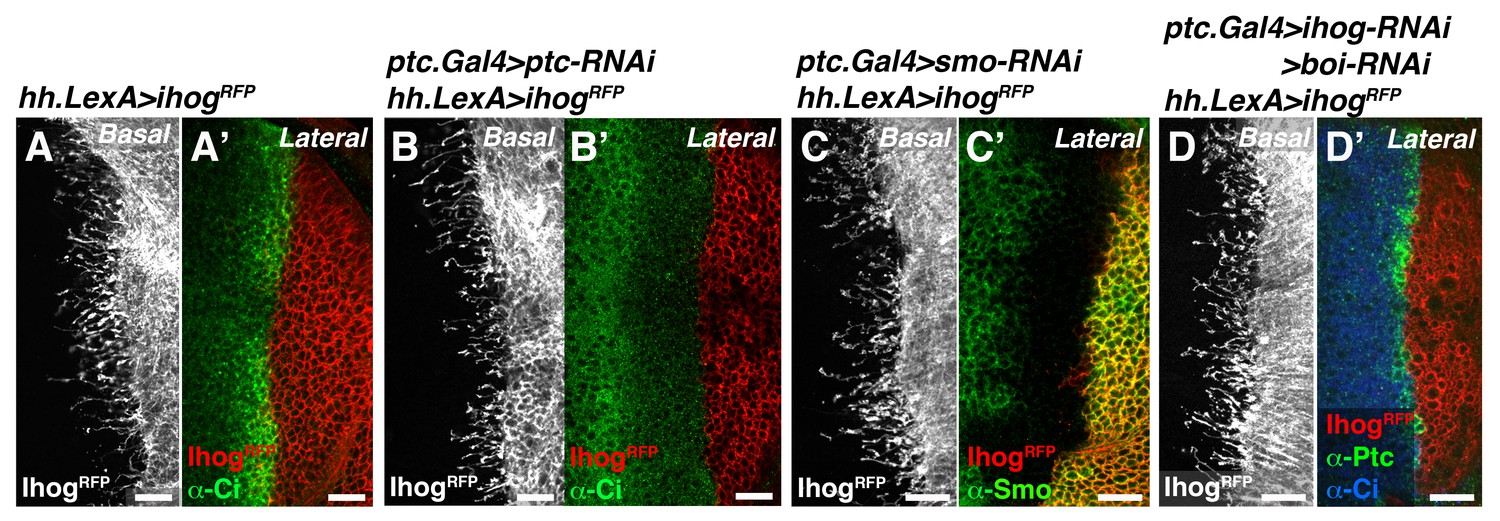
Cytonemes from Hh-producing cells are still formed in mutants that modify Hh reception.
(A, A’) A hh.LexA>LexAop.ihog-RFP wing disc labelled with α-Ci antibody to show Hh signalling (A’). (B, B’) A ptc.Gal4, tub.Gal80ts>UAS.ptc-RNAi; hh.LexA>LexAop.ihog-RFP disc labelled with α-Ci antibody to monitor the full activation of the Hh pathway in the absence of Ptc by the low levels of Ci (B’). Note that cytonemes remain similar independently of the presence of Ptc in the A compartment (A, B). (C, C’) A ptc.Gal4, tub.Gal80ts >UAS.smo-RNAi / hh.LexA>LexAop.ihog-RFP wing disc stained with α-Smo antibody to monitor the degree of Smo knock down. Note that cytonemes are similar with (A) or without (C) the presence of Smo in the A compartment. (D, D’) A ptc.Gal4, tub.Gal80ts >UAS.ihog-RNAi>UAS.boi-RNAi / hh.LexA>LexAop.ihog-RFP wing disc co-labelled with α-Ptc and α-Ci antibodies to monitor the low levels of Hh signalling in the absence of Hh co-receptors Ihog and Boi. Note that cytonemes are similar with (A) or without (D) the presence of both Ihog and Boi in the A compartment. All larvae (A–D) were grown 30 hr at the restrictive temperature before dissection. The data shown were consistent in at least three independent experiments with an average of 5–10 discs in each experiment. Bars, 10 µm.
Figure 5—figure supplement 2

Cytonemes are still present in absence of Hh ligand.
(A) A dpp.LexA>UAS.ihog-RFP wing disc stained withα-Ci antibody to monitor the activation of the Hh pathway. (B) A dpp.LexA>LexAop.ihog-RFP / hhts2 wing disc shows by the low levels of Ci in the A compartment the lack of activation of the Hh pathway. Note that the A compartment cytonemes are not affected in the absence of Hh. (C) An en.Gal4>UAS.ihog-RFP wing disc stained with α-Ci antibody. (D) An en.Gal4>UAS.ihog-RFP / hhts2 wing disc where the absence the Hh signal is monitored by the low levels of Ci activation. (E) An en.Gal4>UAS.CD4-tomato wing disc stained with α-Ci antibody. (F) An en.Gal4>UAS.CD4-tomato / hhts2 wing disc and stained with α-Ci antibody to check the absence the Hh signal. Note that the P compartment cytonemes labelled either by Ihog (D) or CD4 (F) are not affected by the absence of Hh. (G) MARCM ptc16 UAS.ihog-YFP clones induced in A (marked with yellow line) and P compartments of a wing disc and stained with α-Ptc antibody to see the knock down of Ptc and the localization of the anterior clone at the A/P compartment border. Observe that the absence of Ptc does not affect the formation of cytonemes autonomously. Bars, 10 µm.
Figure 5—figure supplement 3
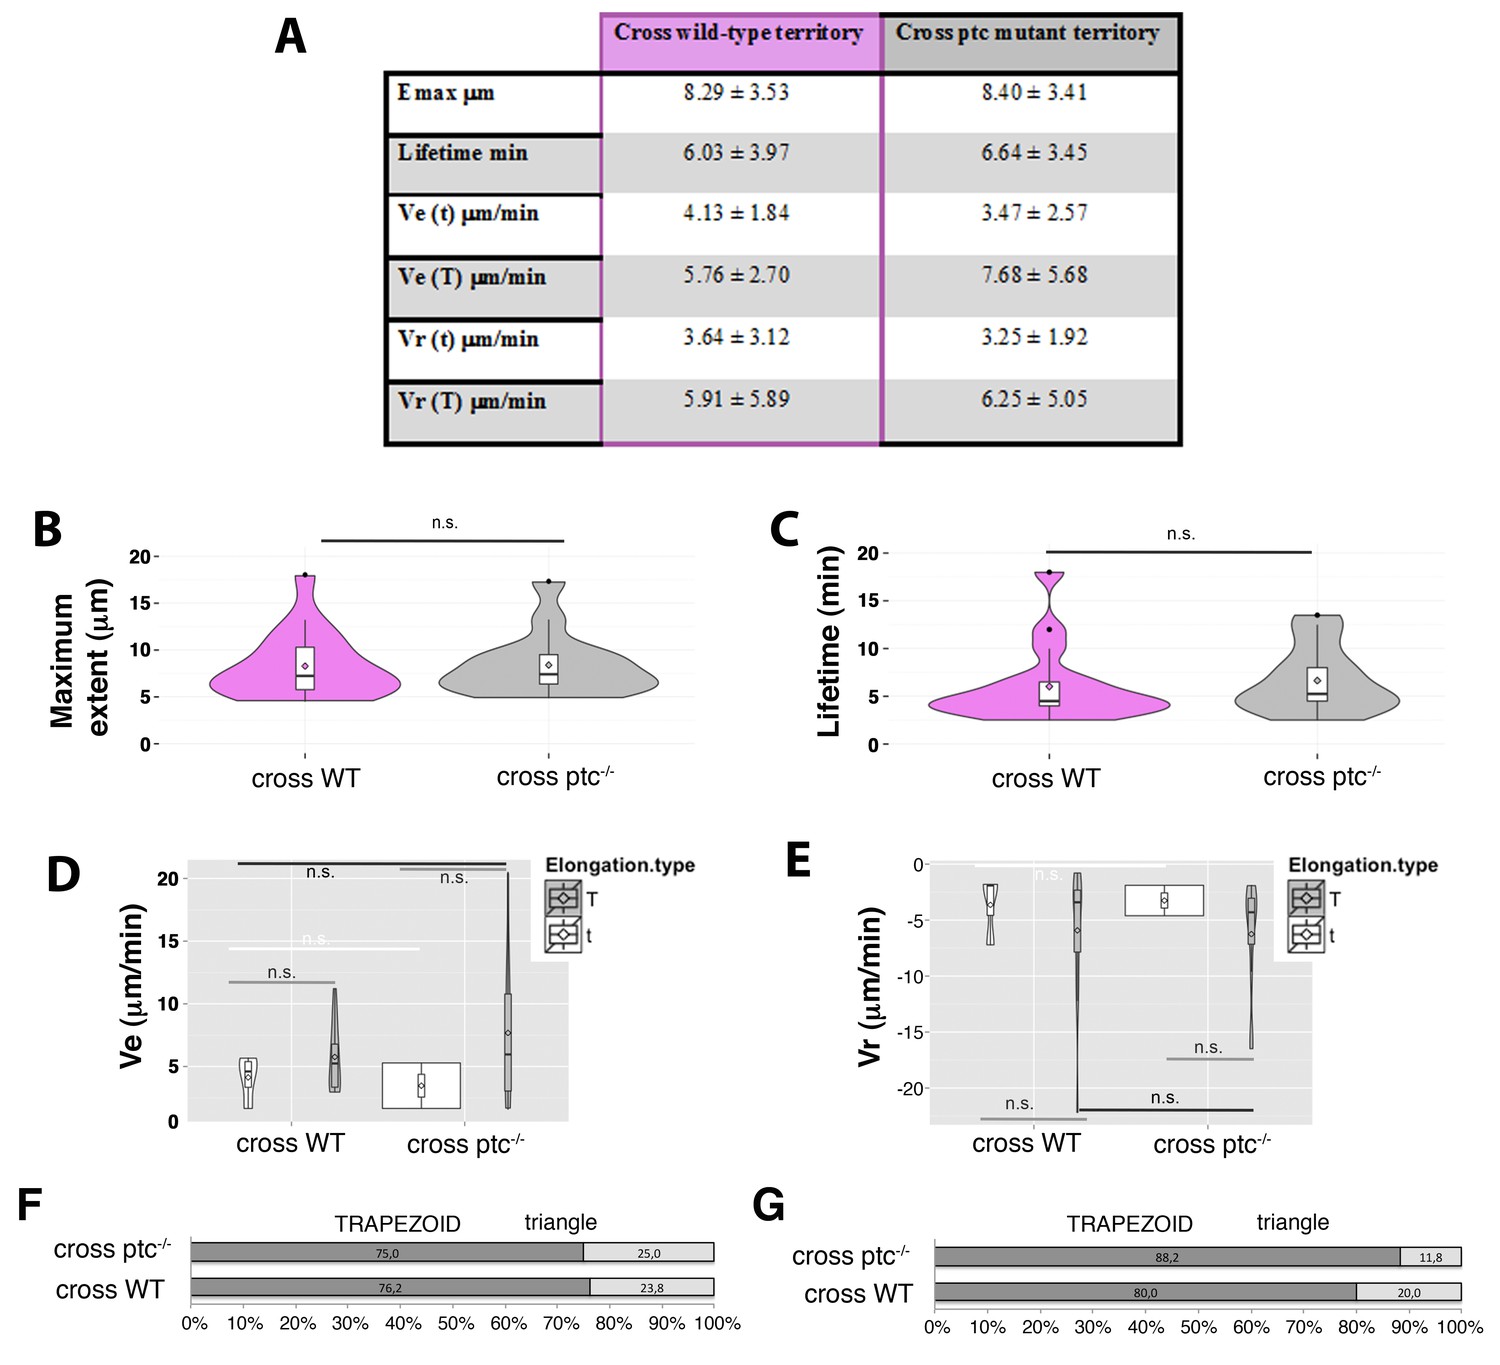
Manual tracking of filopodia arising from Hh-producing abdominal histoblasts cells crossing either a ptc mutant or a wild-type territories.
(A) Table showing the maximum extent (Emax), lifetime, and elongation (Ve) and retraction (Vr) velocities of filopodia from Hh-producing cells crossing wild type and ptc−/− territories to the A compartment. (B, C) Violin plots representing the filopodia Emax (B) and lifetime (C). Notice that there are not significant differences between filopodia crossing ptc mutant or wild-type territories (n.s.). (D, E) Violin plots representing the Ve (D) and Vr (E) as trapezoid (T) or triangle (t) models. (F, G) Percentage graphs representing the type of elongation (F) and retraction (G) velocities of filopodia crossing ptc mutant (ptc−/−) or wild-type (WT) territories.
Figure 6
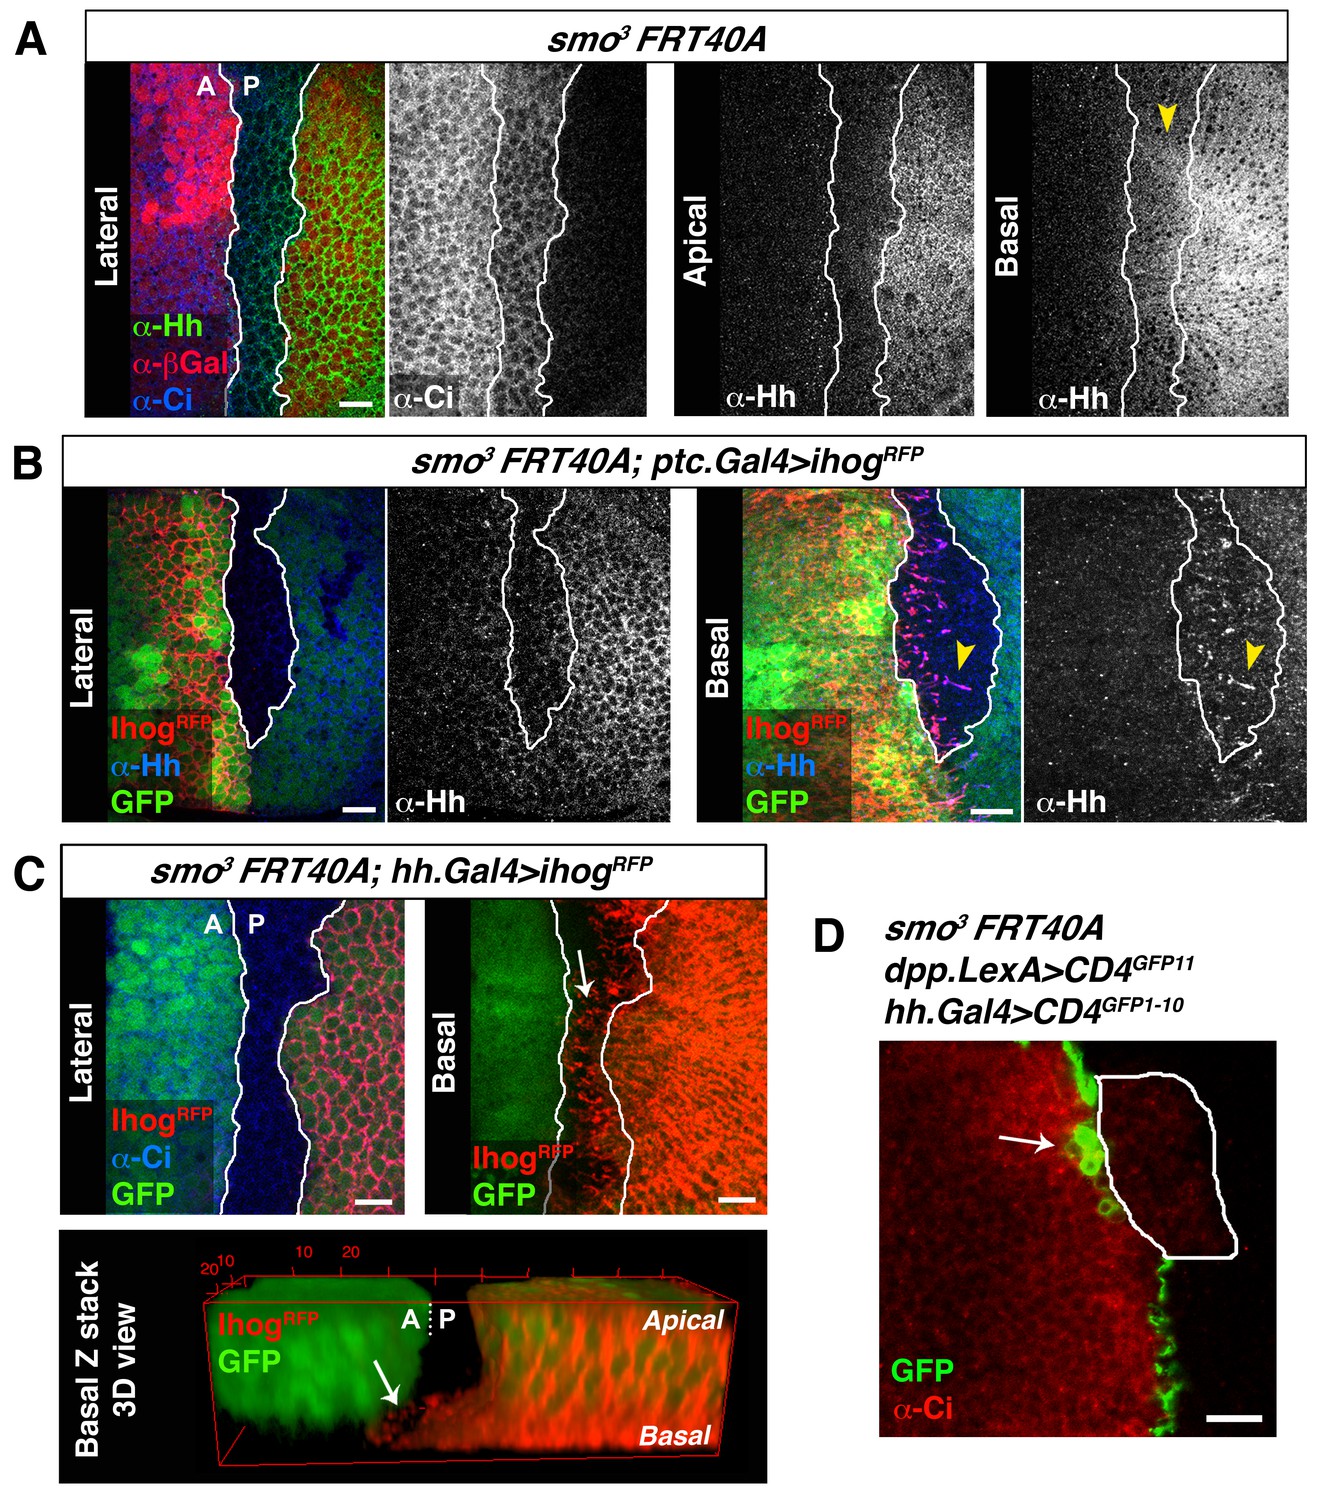
Cytonemes cross smo−/− mutant clones located at the A/P compartment border.
(A) A smo3 mutant clone in a wing disc co-labelled with α-Hh, α-Ci and α-βGal to mark the clone (absence of βGal). The smo−/− clone has an A compartment origin as it expresses low levels of Ci and shows no Hh localization in apical section. Interestingly, in a basal section of this disc Hh is visualized in Ci expressing cells (arrowhead), indicating that Hh moves basally and not apically through a smo3 mutant clone originated in the A compartment. (B) A smo3 mutant clone induced in a wing disc that also expresses Ihog-RFP (smo3 FRT40 / ptc.Gal4, tub.Gal80ts>UAS.ihog-RFP) after 24 hr at the restrictive temperature to visualize cytonemes emanating from cells anterior to the clone. Note that Hh is present in cytonemes from cells located anterior to the clone (arrowheads). (C) A smo3 mutant clone (absence of GFP) induced in the A compartment abutting the A/P compartment border in a disc expressing ihog-RFP in the P compartment (smo3 FRT40A / hh.Gal4, tub.Gal80ts>UAS.ihog-RFP wing disc after 24 hr at restrictive temperature before dissection). Note that cytonemes emanating from P compartment cells cross along the smo−/− mutant clone (arrows). (D) A smo3 clone of A compartment origin, identified by low levels of Ci expression, induced in a background to visualize the GRASP signal (smo3 FRT40A / ptc.Gal4, tub.Gal80t >UAS.CD4-GFP1-10 / hh.LexA>LexAop.CD4-GFP11 wing disc after 24 hr at the restrictive temperature). Note that cells of the clone are integrated in the P compartment and the GRASP signal is located anterior to the smo−/− clone (arrow). The data shown were consistent in at least three independent experiments with an average of 5–10 discs in each experiment. Bars, 10 µm.
Figure 7 with 1 supplement
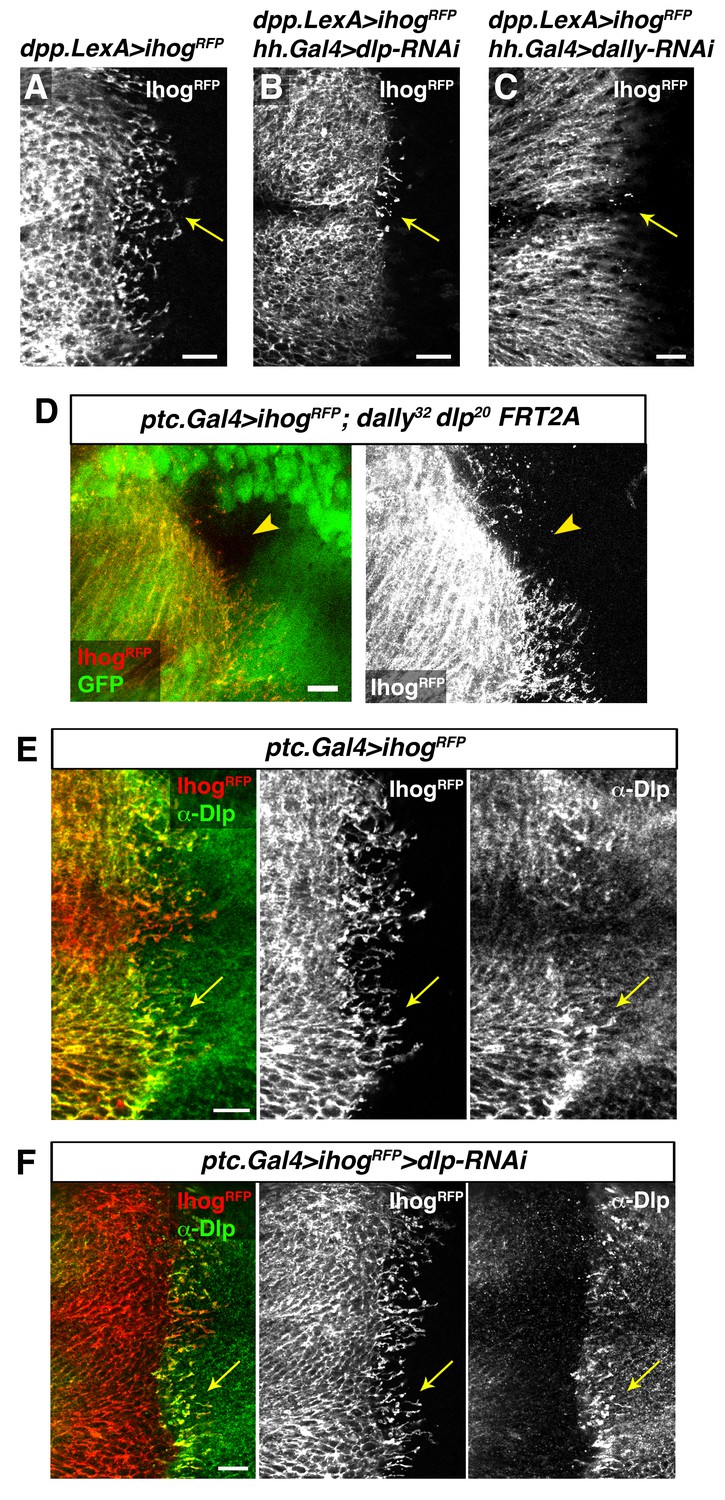
Interaction with glypicans is required for cytoneme stabilization by Ihog in Hh-receiving cells.
(A, B, C) Ihog-RFP labelled cytonemes arising from the A compartment cells (A, dpp.LexA>LexAop.ihog-RFP / tub.Gal80ts) are dependent on the glypicans Dlp (B, dpp.LexA>LexAop.ihog-RFP / tub.Gal80ts, hh.Gal4>UAS.dlp-RNAi) and Dally (C, dpp.LexA>LexAop.ihog-RFP / tub.Gal80ts, hh.Gal4>UAS.dally-RNAi) levels in the P compartment (arrows). All larvae were grown 30 hr at the restrictive temperature before dissection. (D) A dally32 dlp20 FRT2A double mutant clone (absence of GFP) induced in the P compartment and touching the A/P compartment border in a wing disc that expresses ihog-RFP in the receiving cells (ptc.Gal4, tub.Gal80ts>UAS.ihog-RFP) to visualize cytonemes. Note the loss of cytoneme visualization crossing the clone (arrowhead). (E) Endogenous Dlp is accumulated in A compartment cytonemes expressing Ihog-RFP (ptc.Gal4, tub.Gal80ts>UAS.ihog-RFP) after 30 hr at the restrictive temperature (arrows). (F) Wing disc showing that the endogenous Dlp accumulated in A compartment cytonemes belongs to the P compartment cells (arrows), since Dlp has been knocked down in the A compartment (ptc.Gal4, tub.Gal80ts>UAS.ihog-RFP>UAS-dlp-RNAi) after 30 hr at the restrictive temperature before dissection. The data shown were consistent in at least three independent experiments with an average of 5–10 discs in each experiment. Bars, 10 µm.
Figure 7—figure supplement 1
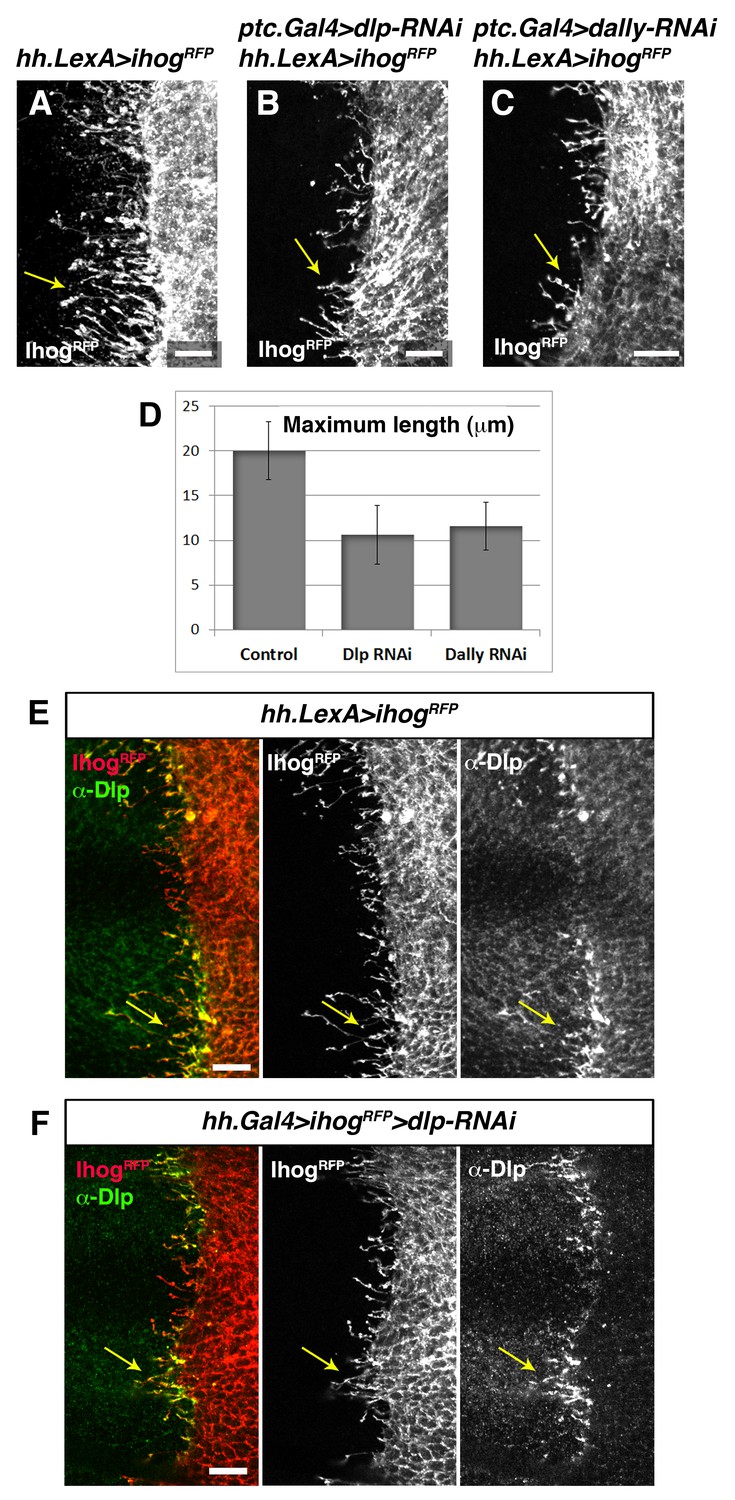
Trans interaction with glypicans is required for cytoneme stabilization by Ihog in Hh-producing cells.
(A, B, C) Ihog-RFP labelled cytonemes arising from the P compartment cells (A, hh.LexA>LexAop.ihog-RFP / tub.Gal80ts) are dependent on the glypicans Dlp (B, ptc.Gal4>UAS.dlp-RNAi, hh.LexA>LexAop.ihog-RFP / tub.Gal80ts,) and Dally (C, ptc.Gal4>UAS.dally-RNAi hh.LexA>LexAop.ihog-RFP / tub.Gal80ts) levels in the A compartment (arrows). All larvae were grown 30 hr at the restrictive temperature before dissection. (D) Graph representing the maximum extent of cytonemes emanating from the P compartment when A compartment cells are mutant either for Dlp or Dally compared with the control wing disc (same genotypes as those show in A, B and C, respectively) (average of 5 discs in 3 independent experiments; error bars represent SDs). Note that the effect on cytoneme abrogation in the P compartment is weaker than in case of cytoneme abrogation in the A compartment (Figure 7). This result is because in this case Ihog is induced during the whole development (hh.LexA is not repressed by Gal80) and the expression of the RNAi to knock down Dlp and Dally is under ptc.Gal4 that is target of the Hh pathway, which is compromised when Ihog is overexpressed in the P compartment (Bilioni et al., 2013). (E) A hh.LexA>LexAop.ihog-RFP wing disc shows the accumulation of the endogenous Dlp in cytonemes extending from P to A compartment (arrows). (F) A hh.Gal4 tub.Gal80ts >UAS.ihog-RFP>UAS.dlp-RNAi wing disc shows that Dlp accumulated in the P compartment cytonemes belongs to the A compartment cells (arrows), because the endogenous Dlp of the P compartment has been knocked down. Larvae in E and F were for 30 hr at restrictive temperature before dissection. The data shown were consistent in at least three independent experiments with an average of 5–10 discs in each experiment. Bars, 10 µm.
Figure 8
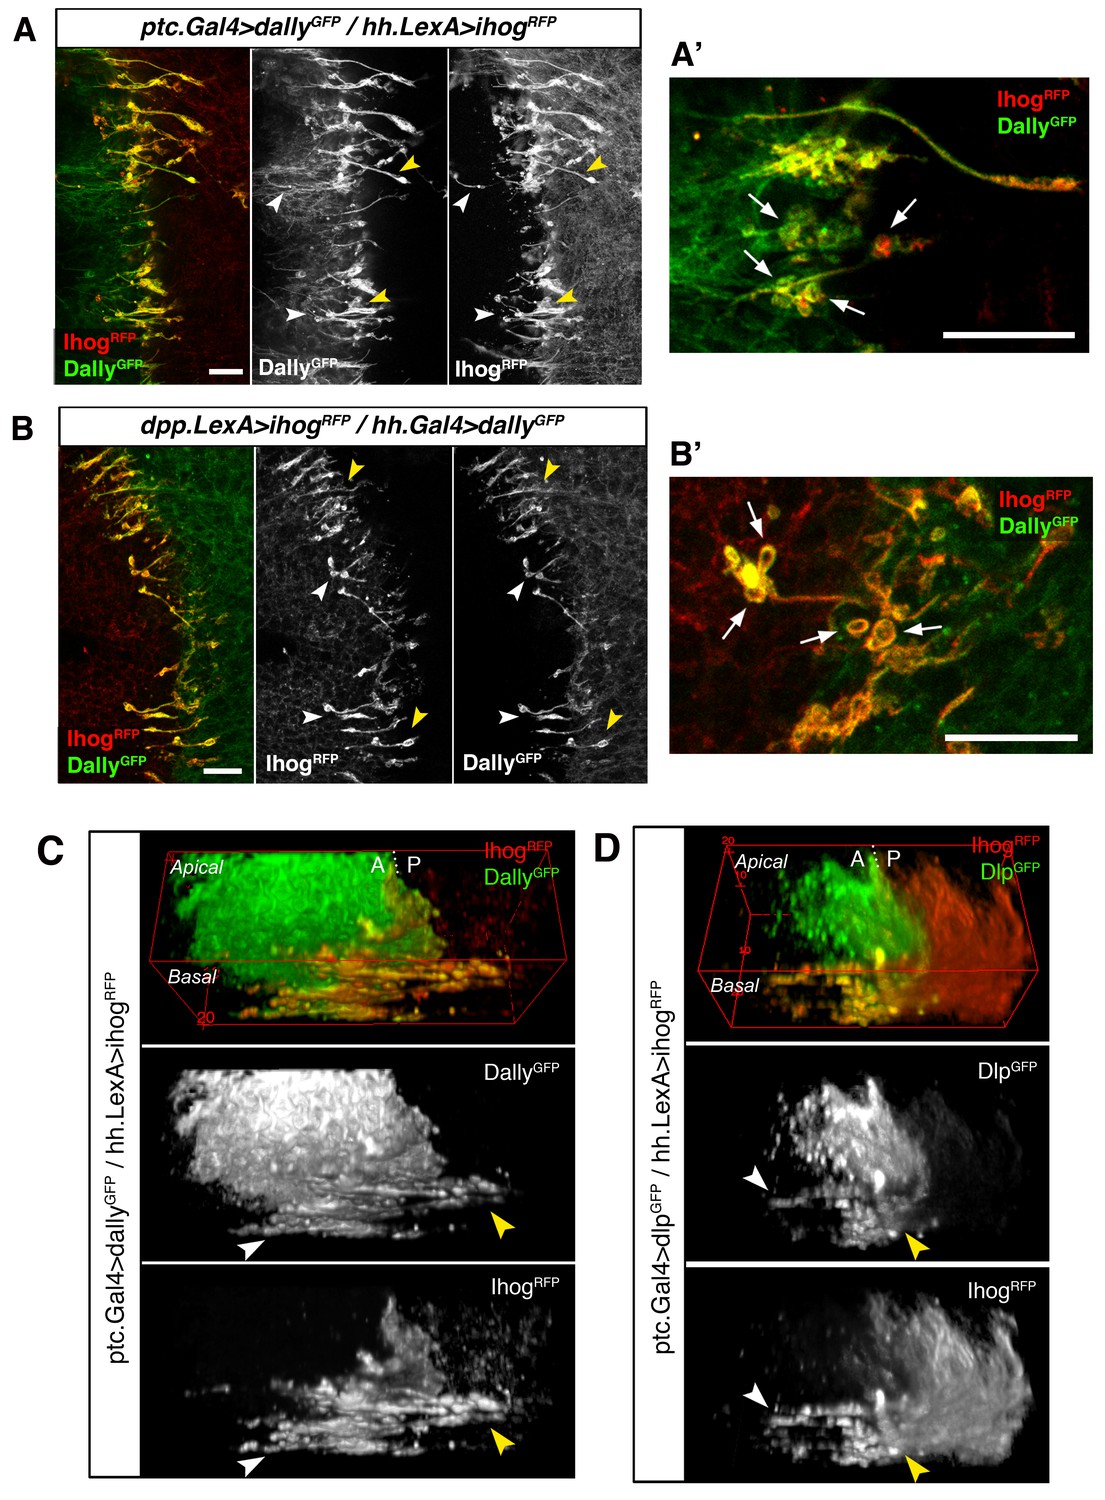
Cytonemes from A and P compartments contact by Ihog-glypicans trans interaction.
(A) Basal P compartment cytonemes expressing Ihog-RFP interact with A compartment cytonemes expressing Dally-GFP (ptc.Gal4, tub.Gal80ts>UAS.dally-GFP / hh.LexA>LexAop.ihog-RFP) at both sides of the A/P compartment border (white and yellow arrowheads). (A’) Enlargement of a similar disc showing annular rings, labelled by Dally-GFP and Ihog-RFP, associated with interacting cytonemes (arrows). (B) Basal A compartment cytonemes expressing Ihog-RFP interact with P compartment cytonemes expressing Dally-GFP (dpp.LexA>LexAop.ihog-RFP / tub.Gal80ts, hh.Gal4>UAS.dally-GFP) at both sides of the A/P compartment border (white and yellow arrowheads). (B’) Enlargement of a similar disc showing ring structures associated with interacting cytonemes, labelled by Dally-GFP and Ihog-RFP (arrows). (C) 3D view of a similar wing disc showing this interaction between basal A and P cytonemes at both sides of the A/P compartment border (white and yellow arrowheads). (D) 3D view of a ptc.Gal4, tub.Gal80ts >UAS.dlp-GFP / hh.LexA>LexAop.ihog-RFP wing disc. P compartment cytonemes expressing Ihog-RFP interact with A compartment cytonemes expressing Dlp-GFP at both sides of the A/P border (white and yellow arrowheads). The larvae from A-D were grown for 24 hr at the restrictive temperature before dissection. The data shown (A–D) were consistent in at least three independent experiments with an average of 5 discs in each experiment. Bars, 10 µm.
Videos
Video 1
Dynamics of filopodia of A compartment abdominal histoblast cells expressing only GMA and co-expressing Ihog.
(A-B) Abdominal histoblasts of pupae with the genotype w; ptc.Gal4 / tubGal80ts; UAS.GMA-GFP /+ (A) and w; ptc.Gal4 / tubGal80ts; UAS.GMA-GFP / UAS.ihog-RFP (B). The actin-binding domain of moesin fused to GFP (GMA-GFP) was expressed during 24 hr in Hh-receiver cells to visualize actin-based filopodia dynamics, easily detected using the inverted grey-scale lookup table tool of Fiji (A). Notice the highly dynamic filopodia emerging from A cells towards P cells. GMA-GFP (B) was co-expressed with Ihog-RFP (B’) in Hh-receiver cells. Observe in the merge panel (B’’) that Ihog-containing filopodia are stabilized while few filopodia with low or no Ihog levels detected are more dynamic. Histoblasts move up (A) and down (B) towards the dorsal midline, not shown because of the high magnification. Anterior is on the left. Pupae were around 30 hr APF (after puparium formation). Movies of 30 min imaging with time intervals between frames of 2 min. Scale bars represent 10 μm.
Video 2
Dynamics of filopodia from P compartment abdominal histoblast cells expressing only GMA and co-expressing Ihog.
(A-B) Abdominal histoblasts of pupae with genotype w; tubGal80ts /+; hh.Gal4 / UAS.GMA-GFP (A) and w; tubGal80ts / UAS.ihog-RFP; hh.Gal4 / UAS.GMA-GFP (B). GMA-GFP was expressed during 24 hr in Hh-producing cells to visualize actin-based filopodia dynamics, easily detected using the inverted grey-scale lookup table tool of Fiji (A). Notice the highly dynamic filopodia emerging from P cells towards A cells. GMA-GFP (B) was co-expressed with Ihog-RFP (B’) in Hh-producing cells. Observe in the merge panel (B’’) that Ihog-containing filopodia are stabilized while few filopodia with low or no Ihog levels detected are more dynamic. Histoblasts move up (A) and down (B) towards the dorsal midline, and this is not shown because of the high magnification. Anterior is to the left. Pupae were around 30 hr APF (after puparium formation). Movies of 30 min imaging with time intervals between frames of 2 min. Scale bars represent 10 μm.
Video 3
Membrane contacts between A and P cell cytonemes.
Z-stack, from apical to basal, of a wing disc showing the GRASP signal pattern between Hh-producing and Hh-receiving cells (ptc.Gal4, tub.Gal80ts>UAS.CD4-GFP1-10/ hh.LexA>LexAop.CD4-GFP11 wing disc after 24 hr at the restrictive temperature). Note the different GFP pattern in apical and basal sections.
Video 4
Ihog overexpressing cytonemes emerging from the A compartment cells accumulate endogenous Hh produced by the P compartment cells.
Z-stack, from apical to basal, of a ptc.Gal4, tub.Gal80ts>UAS.ihogRFP wing disc after 24 hr at restrictive temperature, stained with α-Hh antibody. Note the increase of Hh levels at the basal A compartment cytonemes.
Video 5
Membrane contacts between A and P compartment cells.
Z-stack, from apical to basal, of a wing disc showing the GRASP signal pattern between Hh-producing and Hh-receiving cells (of a ptc.Gal4, tub.Gal80ts>UAS.CD4-GFP1-10/ hh.LexA>LexAop.CD4-GFP11 wing disc after 24 hr at the restrictive temperature). Note the different pattern in apical and basal sections.
Video 6
Cytonemes from the P compartment abdominal histoblasts are able to cross ptc mutant clones and their dynamics do not differ from those crossing wild-type territories.
(A-C) Abdominal histoblasts of a pupa with the genotype y w hs-Flipase122; FRT42D ptc16 / FRT42D ubiRFPnls; hh.Gal4 / UAS.GMA-GFP. GMA-GFP is expressed during all development at 18°C and ptc16 clones were induced doing a heat-shock of 1 hr at 37°C two days before imaging. (A) Merge of nuclear RFP (magenta) and a Z-projection of GMA-GFP (inverted grey-scale lookup table). Hh-producing cell cytonemes labelled with the actin marker GMA (inverted grey-scale lookup table) have the same dynamics and cross normally wild-type (nuclear RFP, magenta) and ptc16 mutant clone (absence of magenta) territories. (B) Merge of the Z-projection of GMA (inverted grey-scale lookup table) and the lateral side (green) to show the morphology of the epithelium. (C) Merge of nuclear RFP (magenta) and GMA in a lateral view (green). Here we visualize the ptc16 mutant clone (absence of magenta) anterior to the A/P boundary. Histoblasts move down towards the dorsal midline, and this is not shown because of the high magnification. Anterior is on the left. Pupa is around 30 hr APF (after puparium formation). Movie of 30 min imaging with a time interval between frames of 30 s. Scale bars represent 10 μm.
Video 7
Filopodia and ptc mutant region manual tracking using MTrackJ.
(A-C) Abdominal histoblasts of a pupae with a y w hs-Flipase122; FRT42D ptc16 / FRT42D ubiRFPnls; hh.Gal4 / UAS.GMA-GFP genotype. GMA-GFP expressed during all development and two days ptc16 clones (induced by heat-shock of 1 hr at 37°C). (A) Z-projection of GMA-GFP using the inverted grey-scale lookup table of ImageJ. (B) Z-projection of GMA-GFP and the tracking of filopodia using the MTrackJ plugin of Fiji, where the fist number refers to the number of filopodium tracked and the second name refers to the base (1) or the tip (2). Each filopodium has a colour and the coloured lines are the base and tip trajectories. Notice that also two dying larval epithelial cells are tracked (orange tracks #165.1 and #165.2). (C) Nuclear RFP (magenta) wild-type nuclei and FRT42D ptc16 mutant clone (absence of magenta) tracked using the first and last region where there is no RFP-positive nuclei just anterior to the A/P boundary (blue tracks #164.1 and #164.2). Histoblasts move down towards the dorsal midline, and this is not shown because of the high magnification. Anterior is on the left. Pupa is around 30 hr APF (after puparium formation). Movie of 30 min imaging with a time interval between frames of 30 s. Scale bars represent 10 μm.
Download links
A two-part list of links to download the article, or parts of the article, in various formats.
Downloads (link to download the article as PDF)
Open citations (links to open the citations from this article in various online reference manager services)
Cite this article (links to download the citations from this article in formats compatible with various reference manager tools)
Cytoneme-mediated cell-cell contacts for Hedgehog reception
eLife 6:e24045.
https://doi.org/10.7554/eLife.24045


