Genetic control of encoding strategy in a food-sensing neural circuit
- King's College London, United Kingdom
- Georgia Institute of Technology, United States
Figures
Figure 1 with 5 supplements
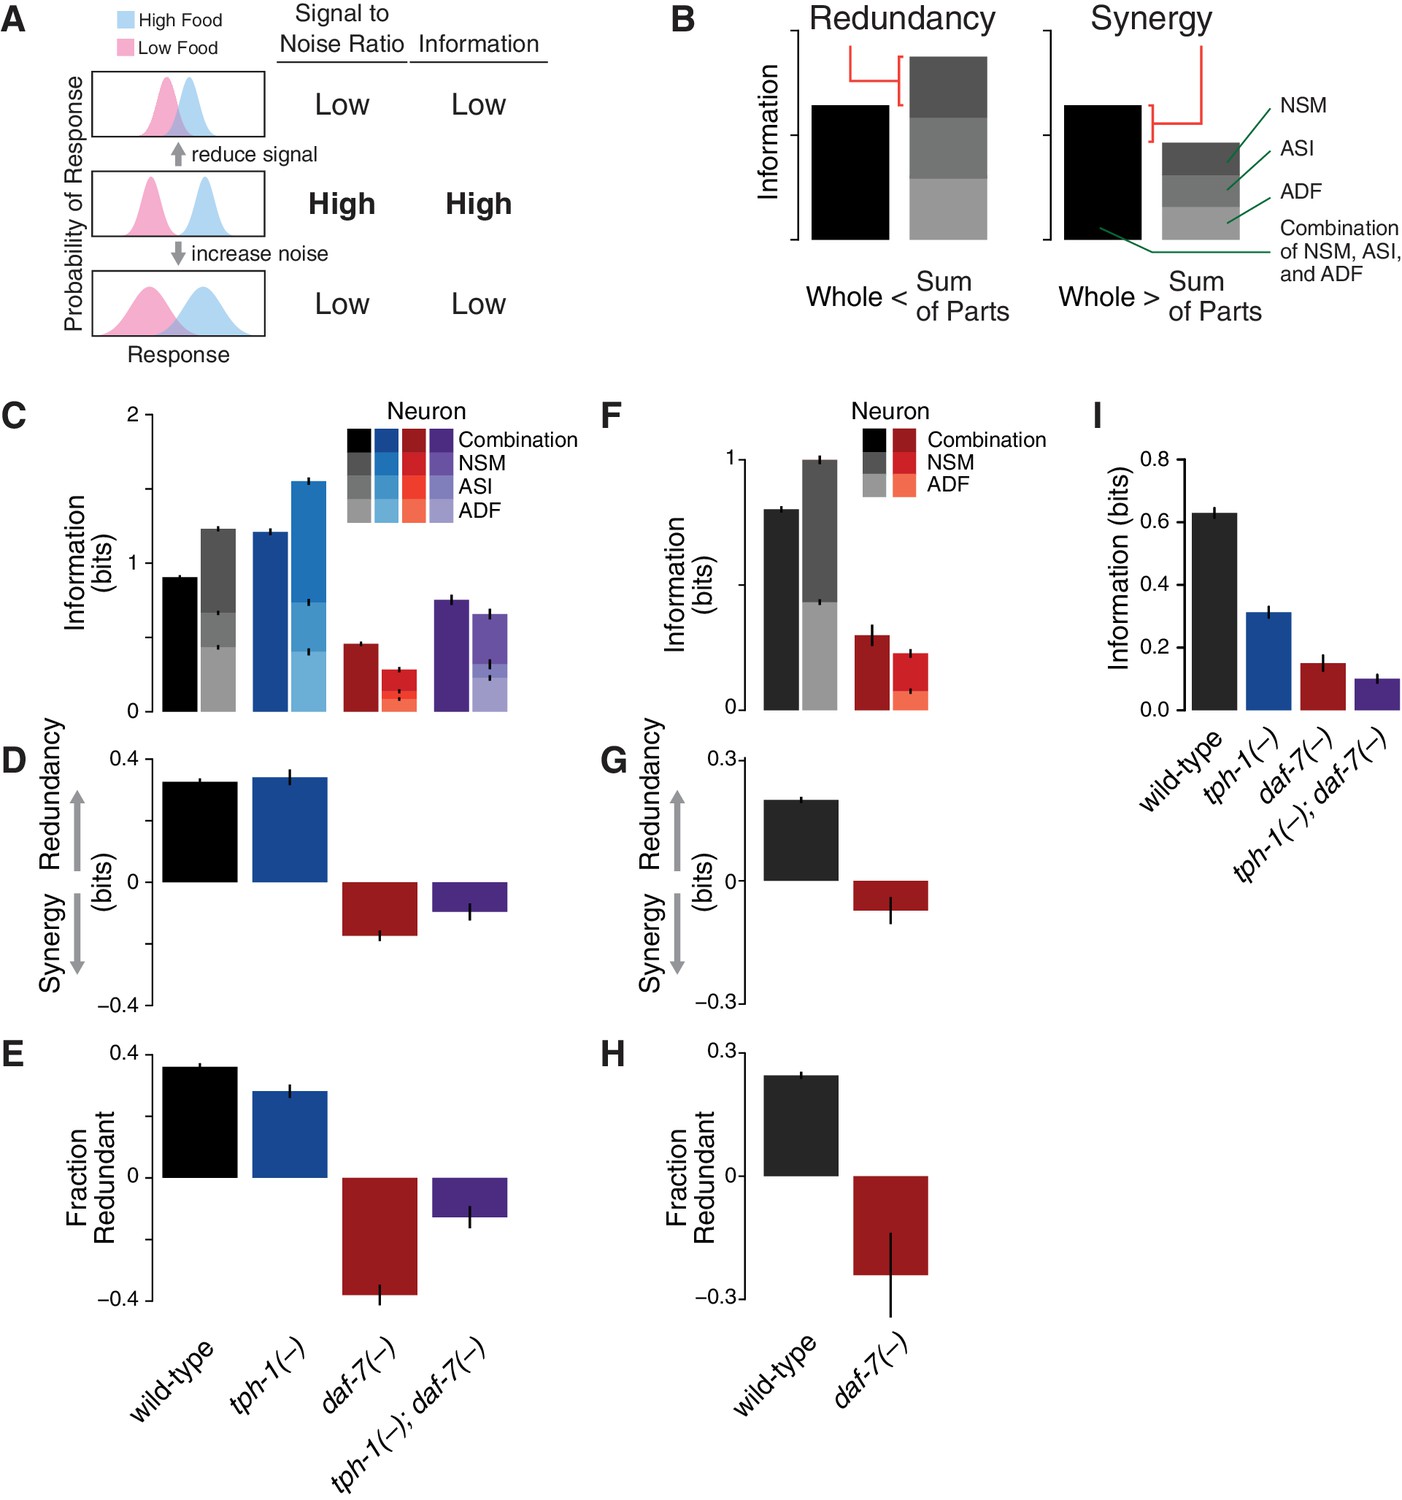
Redundancy and synergy in a gene expression code.
(A) Information content depends on the overlap between gene expression distributions under different environmental conditions, which in turn depends on both the response magnitude (signal) and the variability across the population (noise). (B) Diagrams illustrating redundancy versus synergy, calculated as the difference between the whole (combinatorial information in NSM/ASI/ADF; darkest bar) and the sum of parts (information in NSM + ASI + ADF; stacked bars). (C–E) Analysis of redundancy and synergy based on tph-1 expression in ADF and NSM, and daf-7 expression in ASI. Genotype color key: Wild-type (black), tph-1(-) (blue), daf-7(-) (red), and tph-1(-); daf-7(-) (purple). (C) Effect of tph-1(-) and daf-7(-) mutations on food encoding in the whole circuit (darkest bars) and the sum of parts (lighter stacked bars). (D) Effect of tph-1(-) and daf-7(-) on redundancy and synergy among ADF, NSM, and ASI, as defined in Equation 2 and (B). As described in Equation 2 and in the main text, redundancy and synergy are indicated by positive and negative R values, respectively. (E) Fraction of redundant or synergistic information in ADF, NSM, and ASI, which is the amount of redundancy or synergy in (D) normalized to the information encoded. (F–H) Analysis of redundancy and synergy only in the tph-1 expressing neurons, ADF, and NSM. (F) Effect of daf-7(-) in the information encoded by tph-1 expression in ADF and NSM (darkest bars) and the sum of their parts (lighter stacked bars). (G) Effect of daf-7(-) on redundancy/synergy of ADF and NSM. (H) Fraction of redundant or synergistic information in tph-1 expression in ADF and NSM, which is the amount of redundancy or synergy in (G) normalized to the total information encoded from (F). (I) Loss of tph-1 and daf-7 degrades information about food abundance at the level of lifespan responses.
-
Figure 1—source data 1
Information and redundancy across genotypes.
(Tab 1) Combinatorial mutual information in the NSM/ASI/ADF neural circuit (‘Whole’ column) and the individual mutual information in ADF, ASI and NSM neurons across different genotypes. (Tab 2) Combinatorial information in the NSM and ADF neurons (‘Whole’ column) and the individual information in ADF and NSM neurons in wild-type and daf-7(-) strains. (Tab 3) Mutual information in the lifespan response of different genotypes. All values are presented as bits error.
- https://doi.org/10.7554/eLife.24040.003
-
Figure 1—source data 2
Fluorescence values for animals carrying both Pdaf-7::mCherry and Pdaf-7::Venus across four food levels for Figure 1—figure supplement 2.
- https://doi.org/10.7554/eLife.24040.004
-
Figure 1—source data 3
Optimal input distributions for ADF, ASI and NSM neurons across genotypes (data for Figure 1—figure supplement 3).
Optimal input distributions obtained by maximizing the information encoded individually by ADF, ASI, and NSM neurons. Values are presented as probabilities uncertainty.
- https://doi.org/10.7554/eLife.24040.005
-
Figure 1—source data 4
Validation of information and redundancy estimates for Figure 1—figure supplement 4.
(Tab 1) Information (MI/channel capacity) and redundancy encoded by food-responsive gene expression in wild-type animals computed using different methodologies for density estimation. From left to right: plug-in method, least squares cross-validation, and smoothing cross-validation (kernel density estimation with fixed bandwidth selection), balloon estimator (kNN), Jack-knife correction of sample size bias. (Tab 2) Jack-knife analysis for information and redundancy across all genotypes. Values are calculated using a fraction of the total dataset indicated in first column.
- https://doi.org/10.7554/eLife.24040.006
-
Figure 1—source data 5
Information, redundancy, and optimal input distribution by food level across genotypes.
Data for Figure 1—figure supplement 5. Mutual information of ADF, ASI, and NSM neurons, redundancy and optimal input distribution of the whole circuit by food level across genotypes.
- https://doi.org/10.7554/eLife.24040.007
Figure 1—figure supplement 1
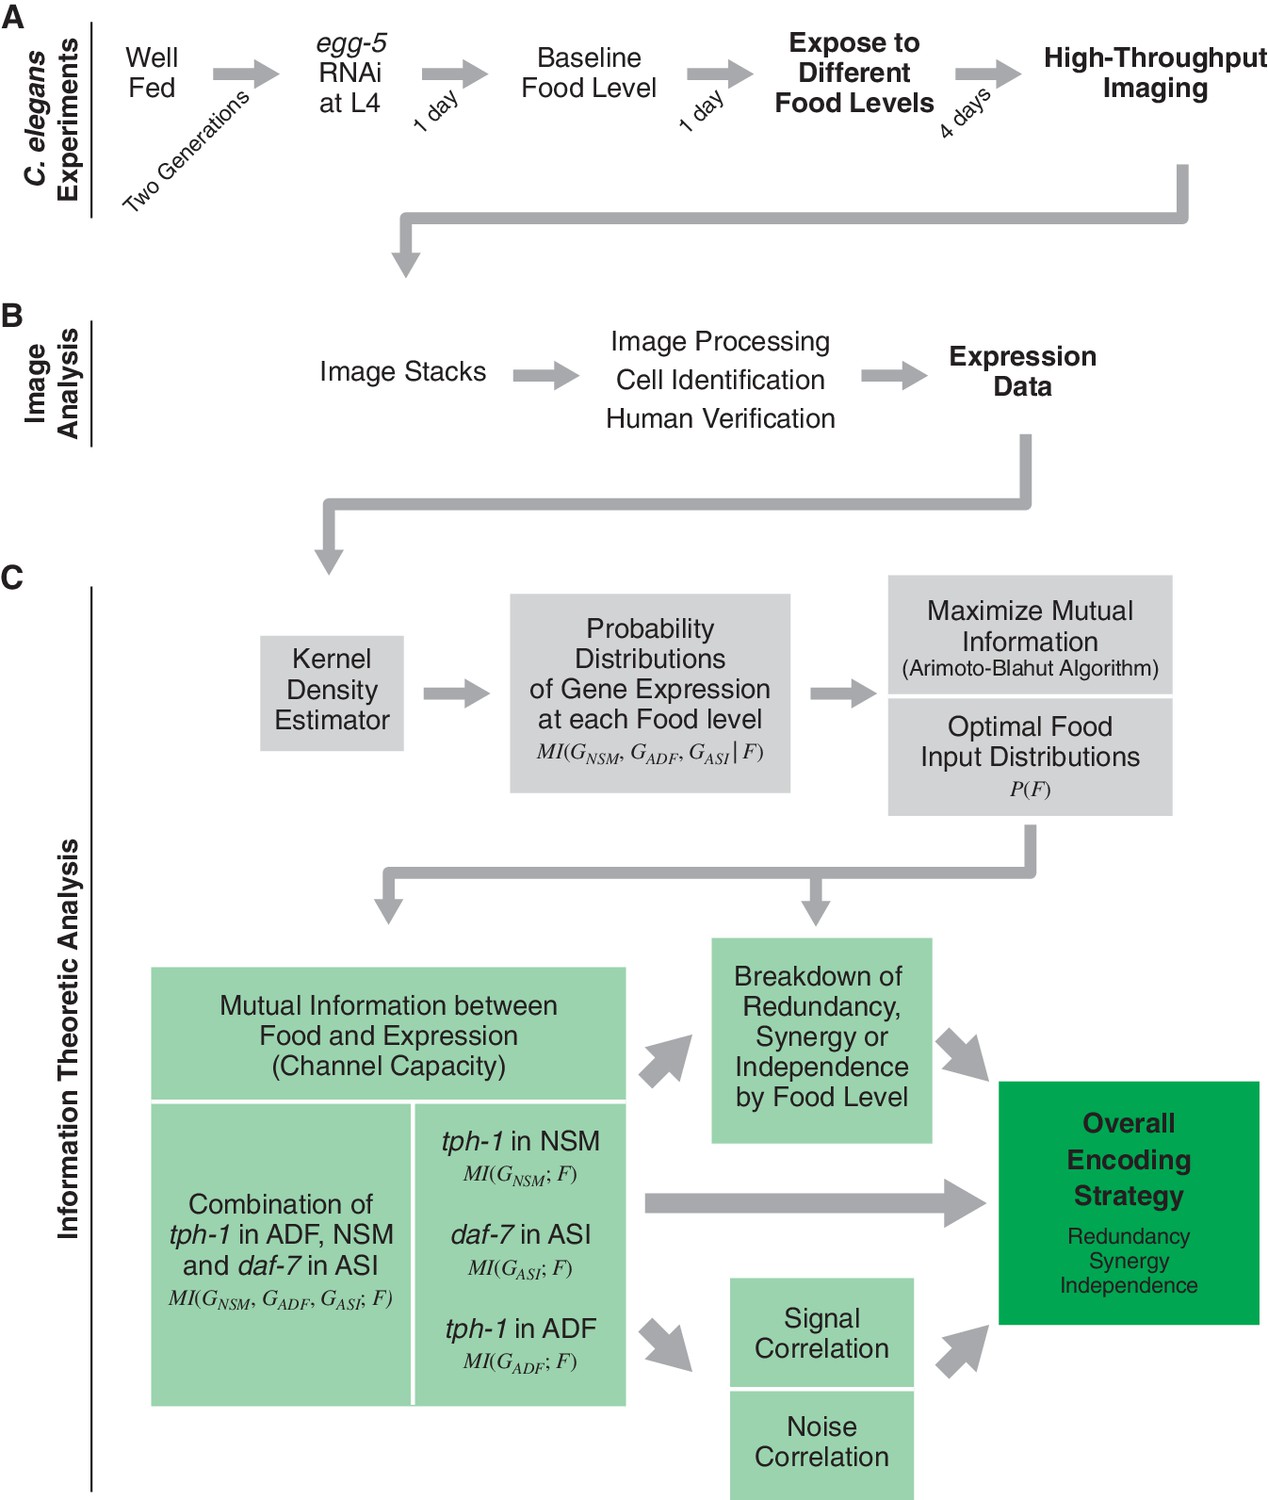
Schematic of experimental and analytical workflow.
(A) Experimental procedure for imaging gene expression responses to different food levels in adult C. elegans. Animals carrying fluorescent reporters were cultured and exposed to six food levels. A custom microfluidics-based platform was used for quantitative high-throughput imaging of the reporters. (B) Image analysis pipeline to identify individual neurons and quantify their fluorescence. (C) Information theoretic analysis for dissecting coding strategy in multicellular gene expression circuits. We first used a kernel density estimator to obtain gene expression response probabilities from our data. Next, we obtained theoptimal food distributions and the maximal mutual information between food stimuli and gene expression response. This analysis highlights the relationships between several parameters that describe the multi-neuron gene expression responses (light green boxes) and their contributions to the overall encoding strategy (dark green box).
Figure 1—figure supplement 2
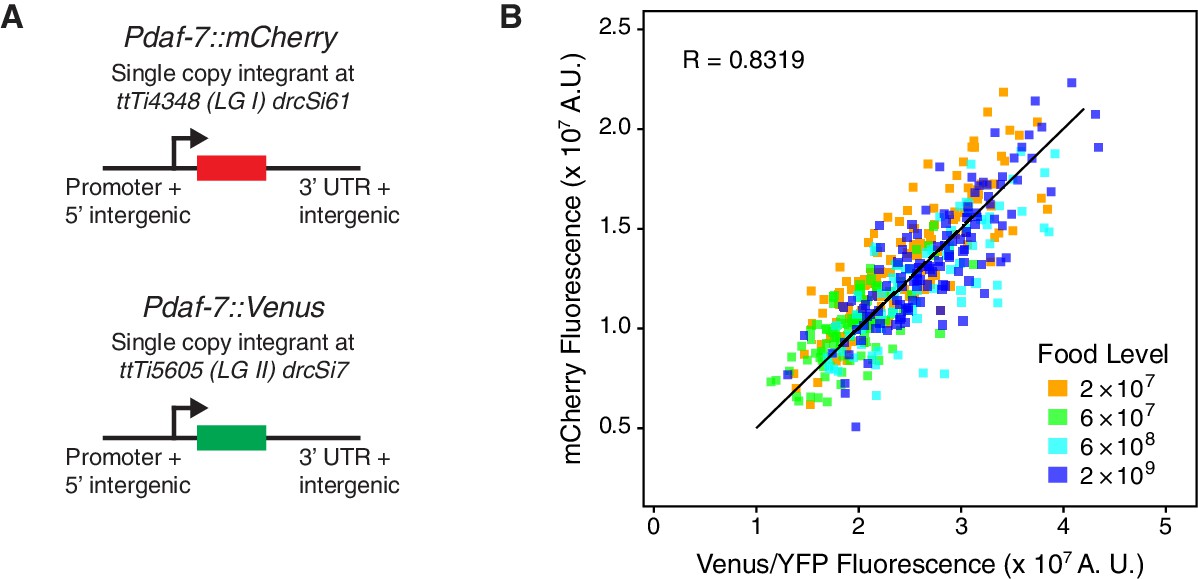
Experimental variability.
(A) Animals carrying Pdaf-7::mCherry and Pdaf-7::Venus at different genomic locations were used to estimate experimental variability. (B) The strain described in (A) was shifted to four different food levels (legend) and then imaged simultaneously for mCherry and Venus fluorescence. The graph shows a good correlation between mCherry and Venus reporter expression (). A total of 400 animals were imaged in this experiment.
Figure 1—figure supplement 3
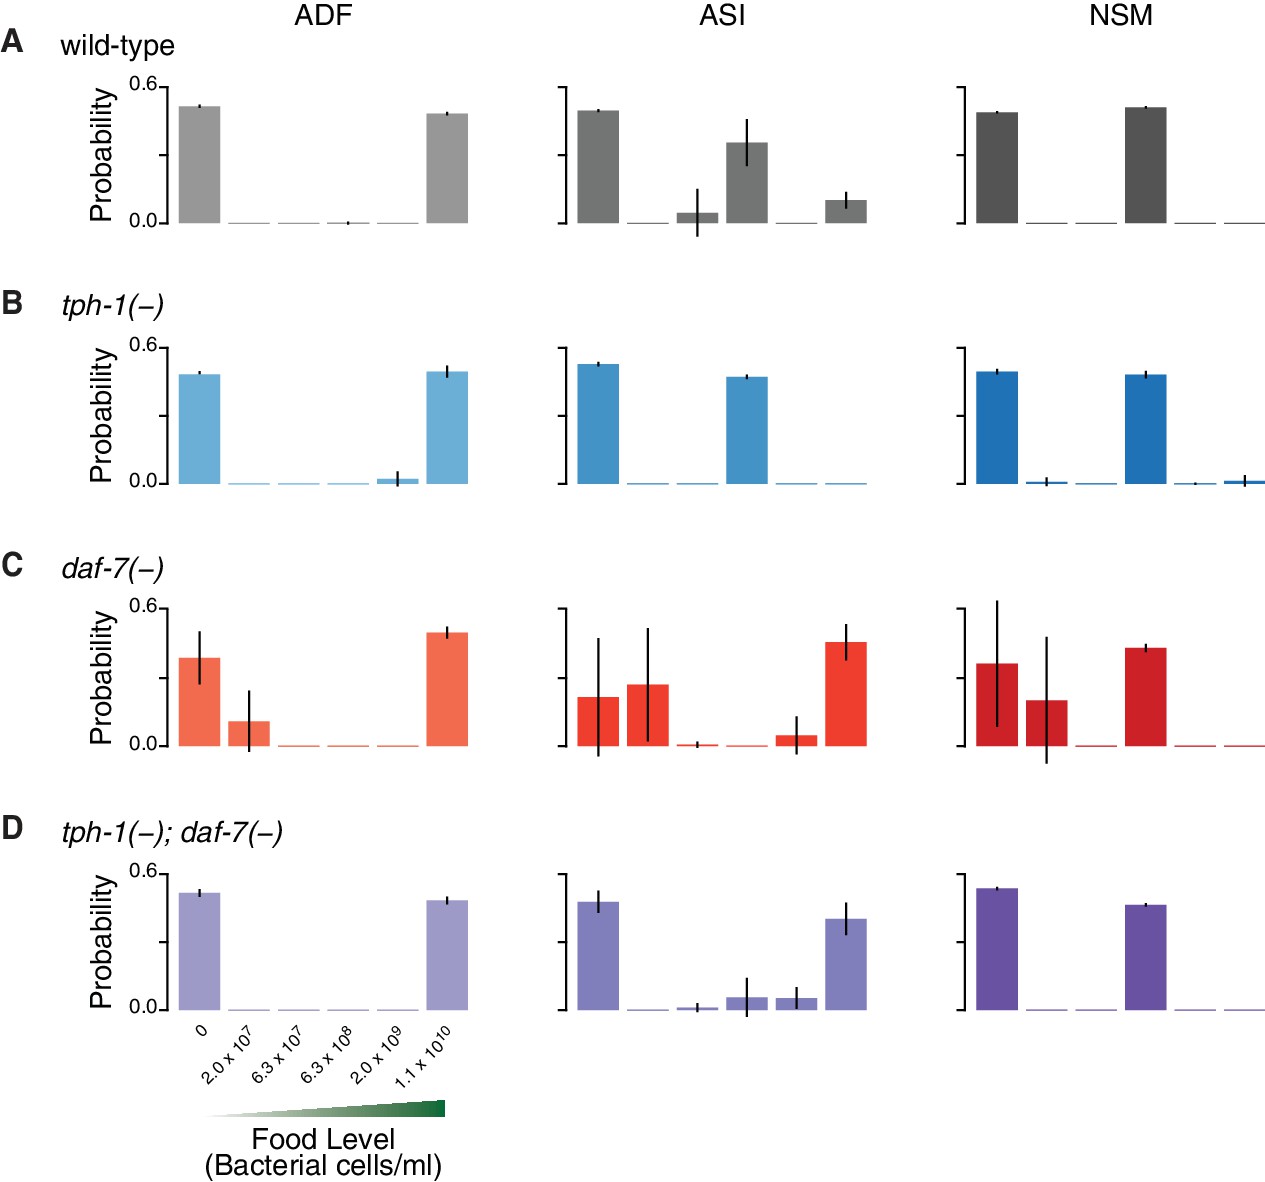
Neurons differ in their optimal input distributions.
Optimal input distributions obtained by maximizing the information encoded individually by ADF, ASI and NSM neurons qualitatively differ. This feature may allow different neurons to detect different food input levels to broaden the sensory range of the whole circuit. The optimal input distribution for each neuron also differ by genotype: (A) wild-type, (B) tph-1(-) mutants, (C) daf-7(-) mutants, and (D) tph-1(-); daf-7(-) double mutants. Uncertainties are obtained from sampling the 80% of the data and taking the standard deviation.
Figure 1—figure supplement 4
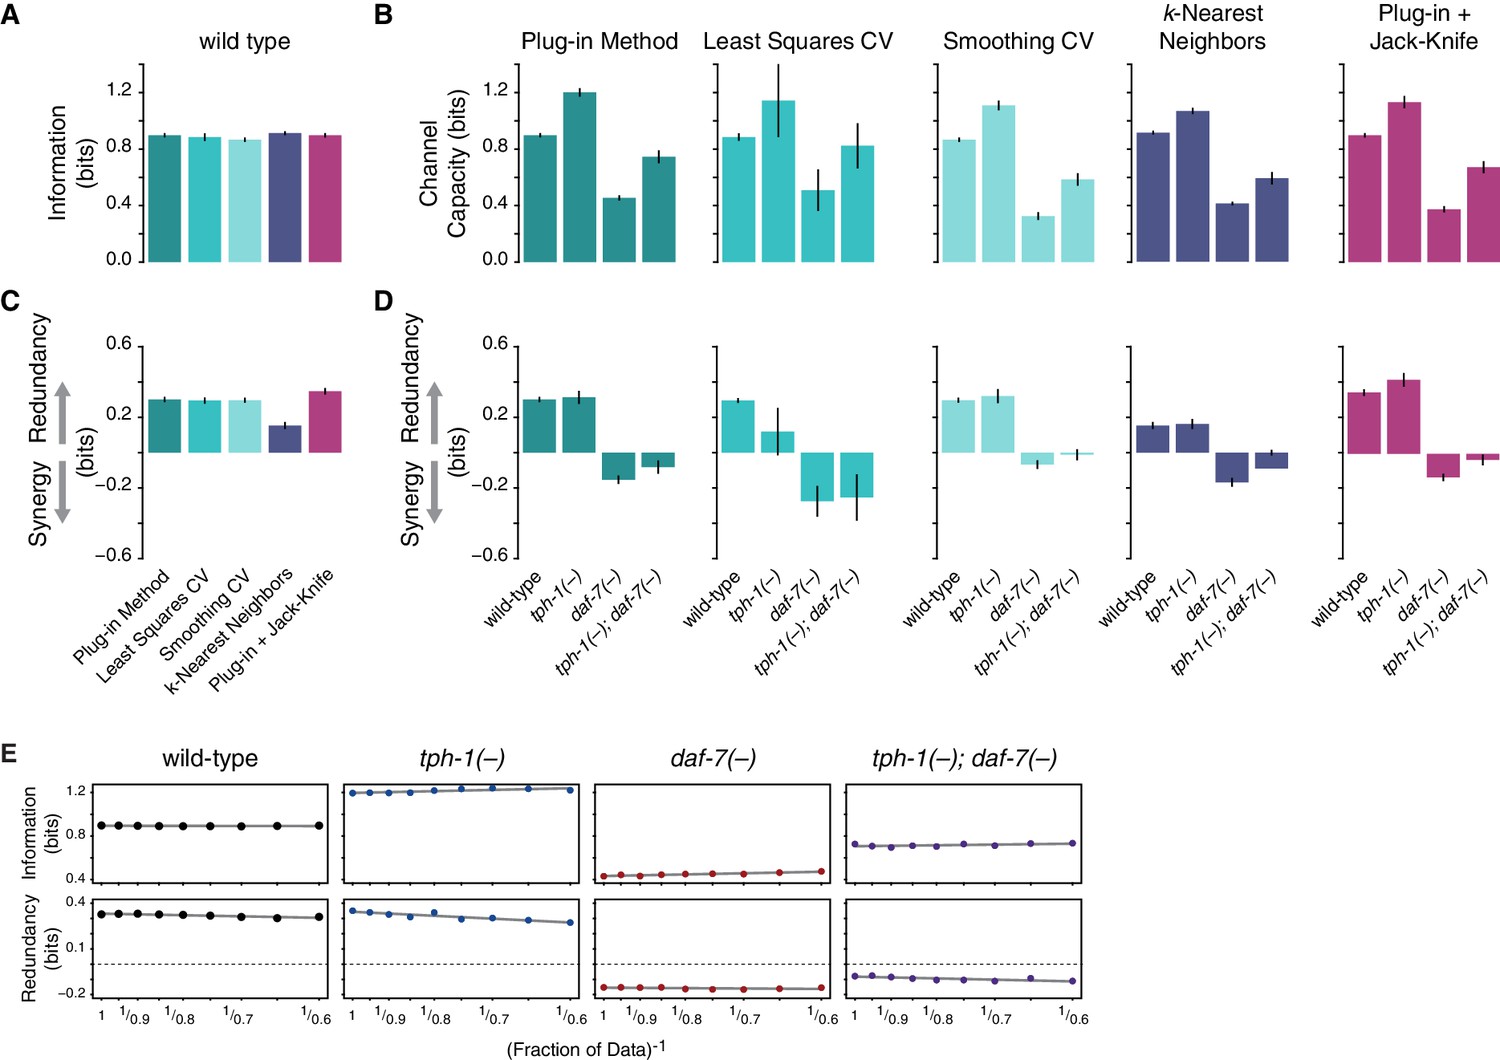
Robustness of information theoretic analyses.
(A) Information (MI/channel capacity) encoded by food-responsive gene expression in wild-type animals computed using different methodologies for density estimation. From left to right: plug-in method, least squares cross-validation, and smoothing cross-validation (kernel density estimation with fixed bandwidth selection), balloon estimator (kNN), Jack-knife correction of sample size bias. All this methods result in similar information values. (B) Information encoded by food-responsive gene expression in wild-type, tph-1(-), daf-7(-), and tph-1(-); daf-7(-) animals. The relative changes in information between different approaches do not display significant differences. (C) and (D) illustrate the same analysis for redundancy. The switch from redundancy in wild-type to synergy in daf-7(-) is consistently present for all the methodologies used. (E) Details of jack-knife analysis for information and redundancy across all genotypes. Information and redundancy values are calculated using a fraction of the total data indicated in the -axis. Dashed line (bottom) indicates a redundancy value of zero, separating redundancy and synergy. Both information and redundancy are stable to the sample size, as indicated by the flat lines of best fit. Error bars are standard deviation derived from sampling 80% of the data.
Figure 1—figure supplement 5

Information and redundancy by food level.
(A) The sum of information encoded by ADF, ASI, and NSM for each food level across different genotypes is indicated by stacked bars. Information in each neuron is indicated by the legend (bottom right). Dashed lines indicate the information encoded by the combinatorial gene expression in the whole circuit, which is constant across food levels (see Supplemental Materials and methods for mathematical details). (B) Redundancy values across food levels for each genotype. (C) The optimal distribution of food input that maximizes information encoded by the whole circuit.
Figure 2
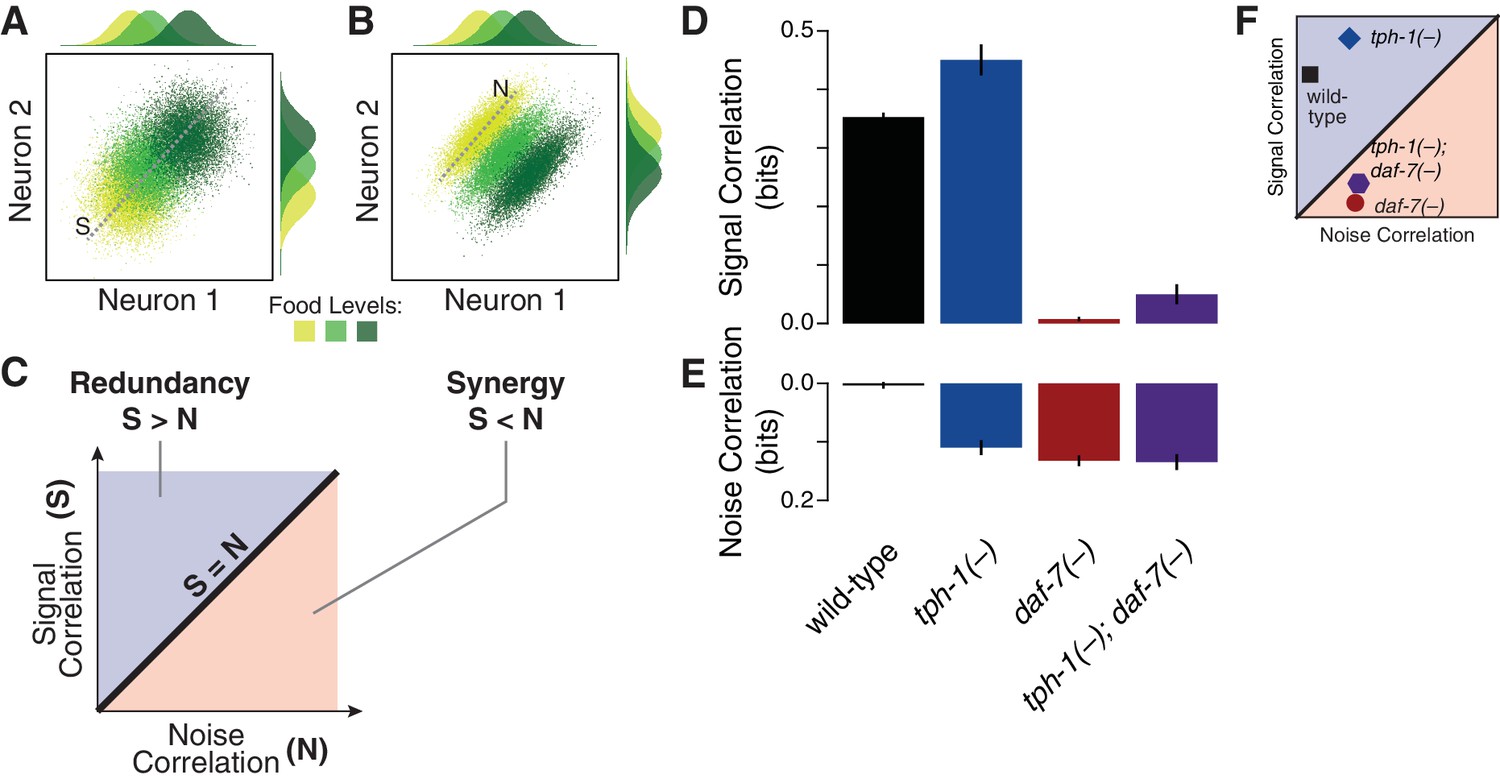
Signal and noise correlations influence redundancy and synergy.
(A–B) Hypothetical expression distributions of two neurons at three food levels, illustrating signal and noise correlations and their effects on redundancy (Schneidman et al., 2003). Centre: their 2D distributions. Top and side: the distributions of each neuron. Signal correlation between two neurons across three food levels, and noise correlation at one selected food level are denoted by dotted lines marked ‘S’ and ‘N’ in (A) and (B), respectively. (C) shows how signal and noise correlations are related to redundancy and synergy as previously established (Schneidman et al., 2003). When signal correlations are higher (A), each neuron provides similar information (top and side distributions), reflecting redundancy. When noise correlations are higher (B), the combinatorial expression shows reduced overlaps and contains more information than individual neurons, providing synergy. (D–E) The effects of daf-7 and tph-1 on redundancy and synergy are explained by their effects on the signal correlation (D) and noise correlation (E). (F) Signal and noise correlation in each genotype and their relation to redundancy and synergy as indicated in (C).
-
Figure 2—source data 1
Signal and noise correlations across genotypes.
- https://doi.org/10.7554/eLife.24040.014
Figure 3 with 1 supplement

Interplay between noise and correlation affects redundancy.
(A) Heat maps showing redundancy when correlation and noise are scaled from their baseline values in wild-type and mutants. Redundancy values are indicated by legend. Contour lines denote equal redundancy. The number of contour lines crossed along each axis indicates the sensitivity to that parameter. (B) The steps leading from genes to coding strategy.
Figure 3—figure supplement 1
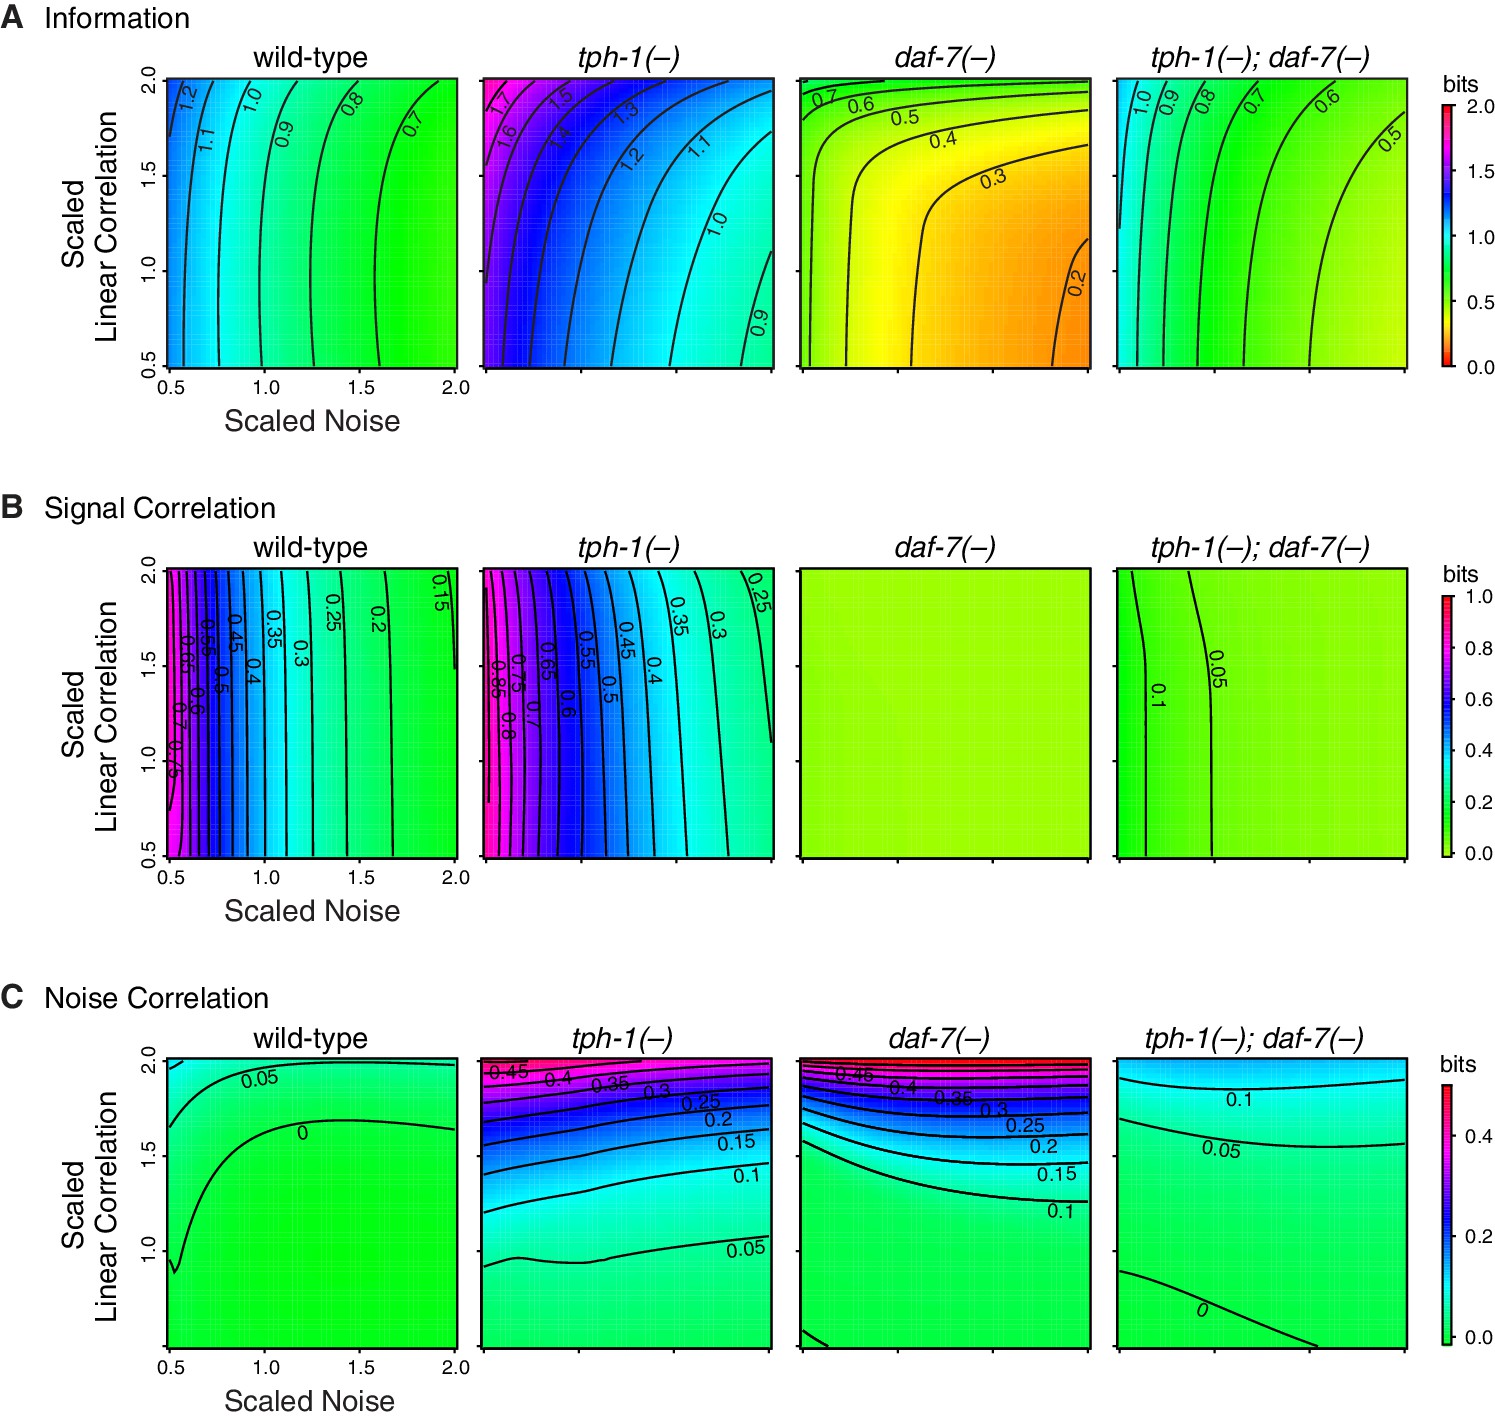
Sensitivity analysis of channel capacity, signal, and noise correlation.
Heat maps showing how channel capacity (A), signal correlation (B) and noise correlation (C) vary under a rescaling of the baseline covariance matrix. For this analysis, response distributions were modeled using multivariate normal distributions (see Appendix).
Figure 4 with 1 supplement
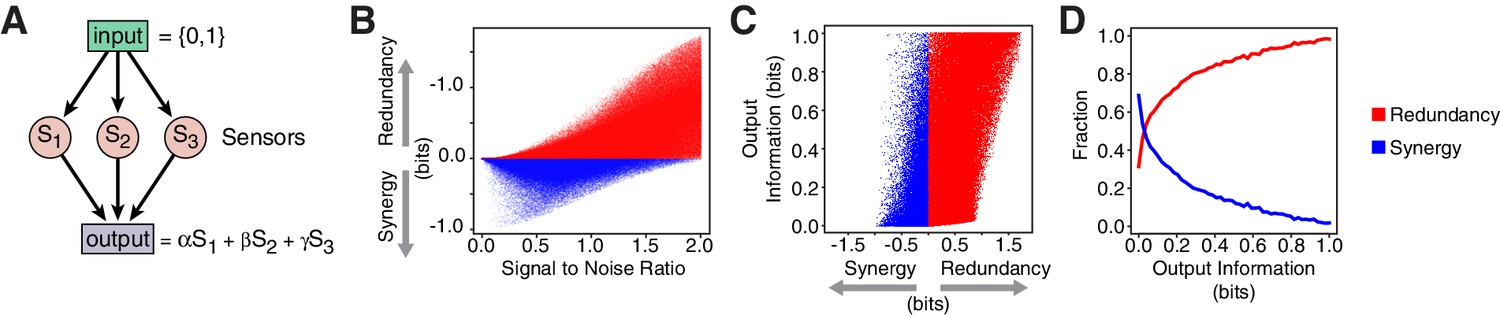
Computational model reveals advantages of redundancy.
(A) Model for information encoding and transmission, where three sensors activate one target that integrates their signals linearly (see Appendix). (B) Effect of signal-to-noise ratio on coding strategy. (C) Effect of coding strategy on transmitted information. (D) Sensors that transmit more information tend to use redundancy.
Figure 4—figure supplement 1

Gaussian model of sensory neurons and information transmission.
(A) Illustration of the model. represent single sensors receiving information from the binary input. The sensor response is then combined linearly by the output. (B) The joint sensor response distribution is modeled as a three-dimensional Gaussian centered at input-dependent average values. (C, D, E, F) display the result of the numerical analysis of the model. Each point represents a specific choice of the parameters used in the model. For all sampled parameter sets (), we obtained the relevant information-theoretic measures shown. Red and blue colors are used to distinguish redundant and synergistic regimes, respectively. (G) The sampled conditions sliced according to dynamic range () and noise () (left). Redundant configurations populating the low signal-to-noise ratio () provide typically low information. becomes a discriminant between redundancy and synergy when applying a non-zero cutoff to the information encoded by the sensors (right). (H) Fraction of redundant/synergistic configurations obtained by in the numerical exploration of the model (left). When sensors are required to encode a minimum level of information, parametric configurations with low are forced to be synergistic, providing a rational for the coding strategy switch observed in daf-7(-).
Download links
A two-part list of links to download the article, or parts of the article, in various formats.
Downloads (link to download the article as PDF)
Open citations (links to open the citations from this article in various online reference manager services)
Cite this article (links to download the citations from this article in formats compatible with various reference manager tools)
Genetic control of encoding strategy in a food-sensing neural circuit
eLife 6:e24040.
https://doi.org/10.7554/eLife.24040


