Kinetic modeling predicts a stimulatory role for ribosome collisions at elongation stall sites in bacteria
- Fred Hutchinson Cancer Research Center, United States
Figures
Figure 1
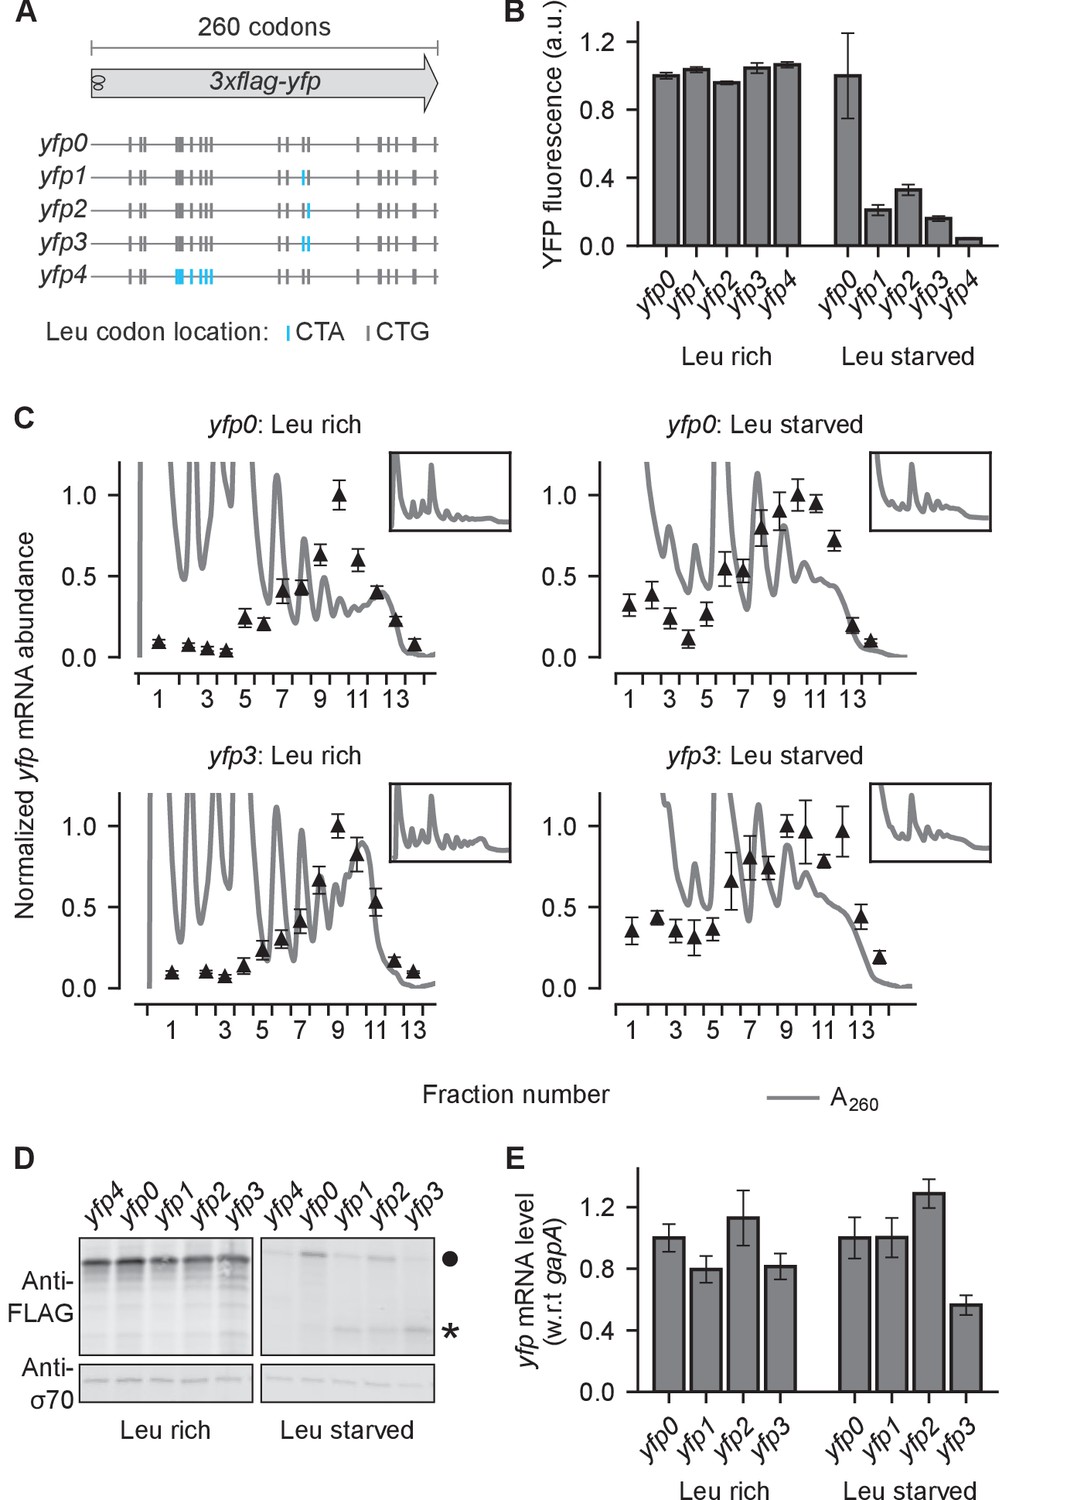
Effect of ribosome stalling on measured protein level, mRNA level, and polysome occupancy.
(A) Schematic of ribosome stalling reporters used in B–E. Blue vertical lines show the location of CTA Leu codons that cause ribosome stalling during Leu starvation in E coli. Locations of CTG Leu codons that do not induce ribosome stalling are shown in grey. For experiments in B–E, reporters were induced either in Leu-rich growth medium for 20 min or Leu-starvation medium for 60 min. Schematic of a ribosome with 30 nt footprint is shown for reference. (B) YFP fluorescence normalized by that of yfp0 in each condition. Error bars represent standard error over triplicate cultures. (C) Triangles indicate yfp mRNA levels in polysomes fractionated through a sucrose gradient, and measured by quantitative RT-PCR spanning the CTA codons. Absorbance at 260 nm (A260) is shown in grey with magnified Y axis to highlight polysome profiles. X axis ticks delineate polysome fractions used for the corresponding qPCR measurement. An in vitro transcribed luciferase mRNA was spiked in for normalizing the mRNA levels by each fraction’s volume. Error bars represent standard error of qPCR over triplicates. Inset: Polysome profiles showing full monosome peak. (D) Top panel: Western blot against the 3xFLAG epitope at the N-terminus of YFP reporter. Circle indicates the size of the full length 3xFLAG-YFP product. Star indicates the size of truncated product expected from abortive termination of ribosomes at CTA codons in yfp1–yfp3. Bottom panel: Western blot against the RNA polymerase σ70 subunit shown as a loading control. (E) yfp mRNA levels normalized by that of yfp0 in each condition. An endogenous mRNA, gapA, was used for internal normalization. Error bars represent standard error of qPCR over triplicates.
Figure 2
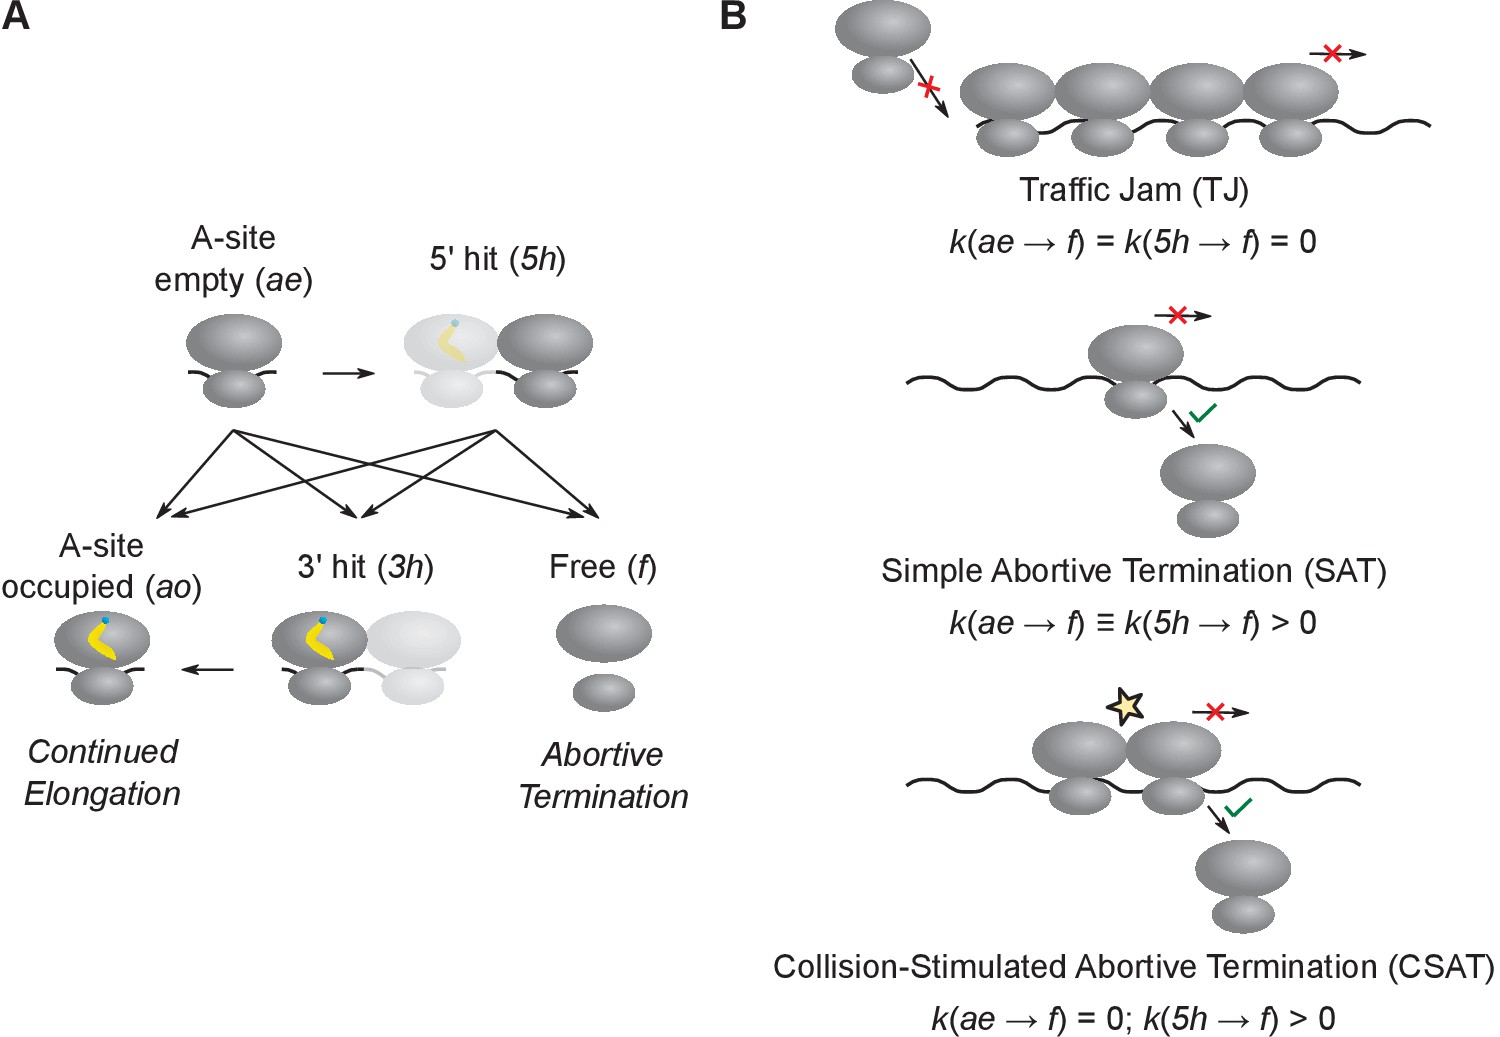
Computational modeling of ribosome kinetics at stall sites.
(A) Distinct ribosome states that were considered during computational modeling of each elongation cycle. (B) Schematic of the three kinetic models of stalled ribosomes considered in this work. The three equations indicate the rate of abortive termination from the A-site empty (ae) and the 5’ hit (5h) states in the three different kinetic models. The rate of abortive termination from the A-site occupied (ao) and 3’ hit (3h) states is zero in all three models.
Figure 3
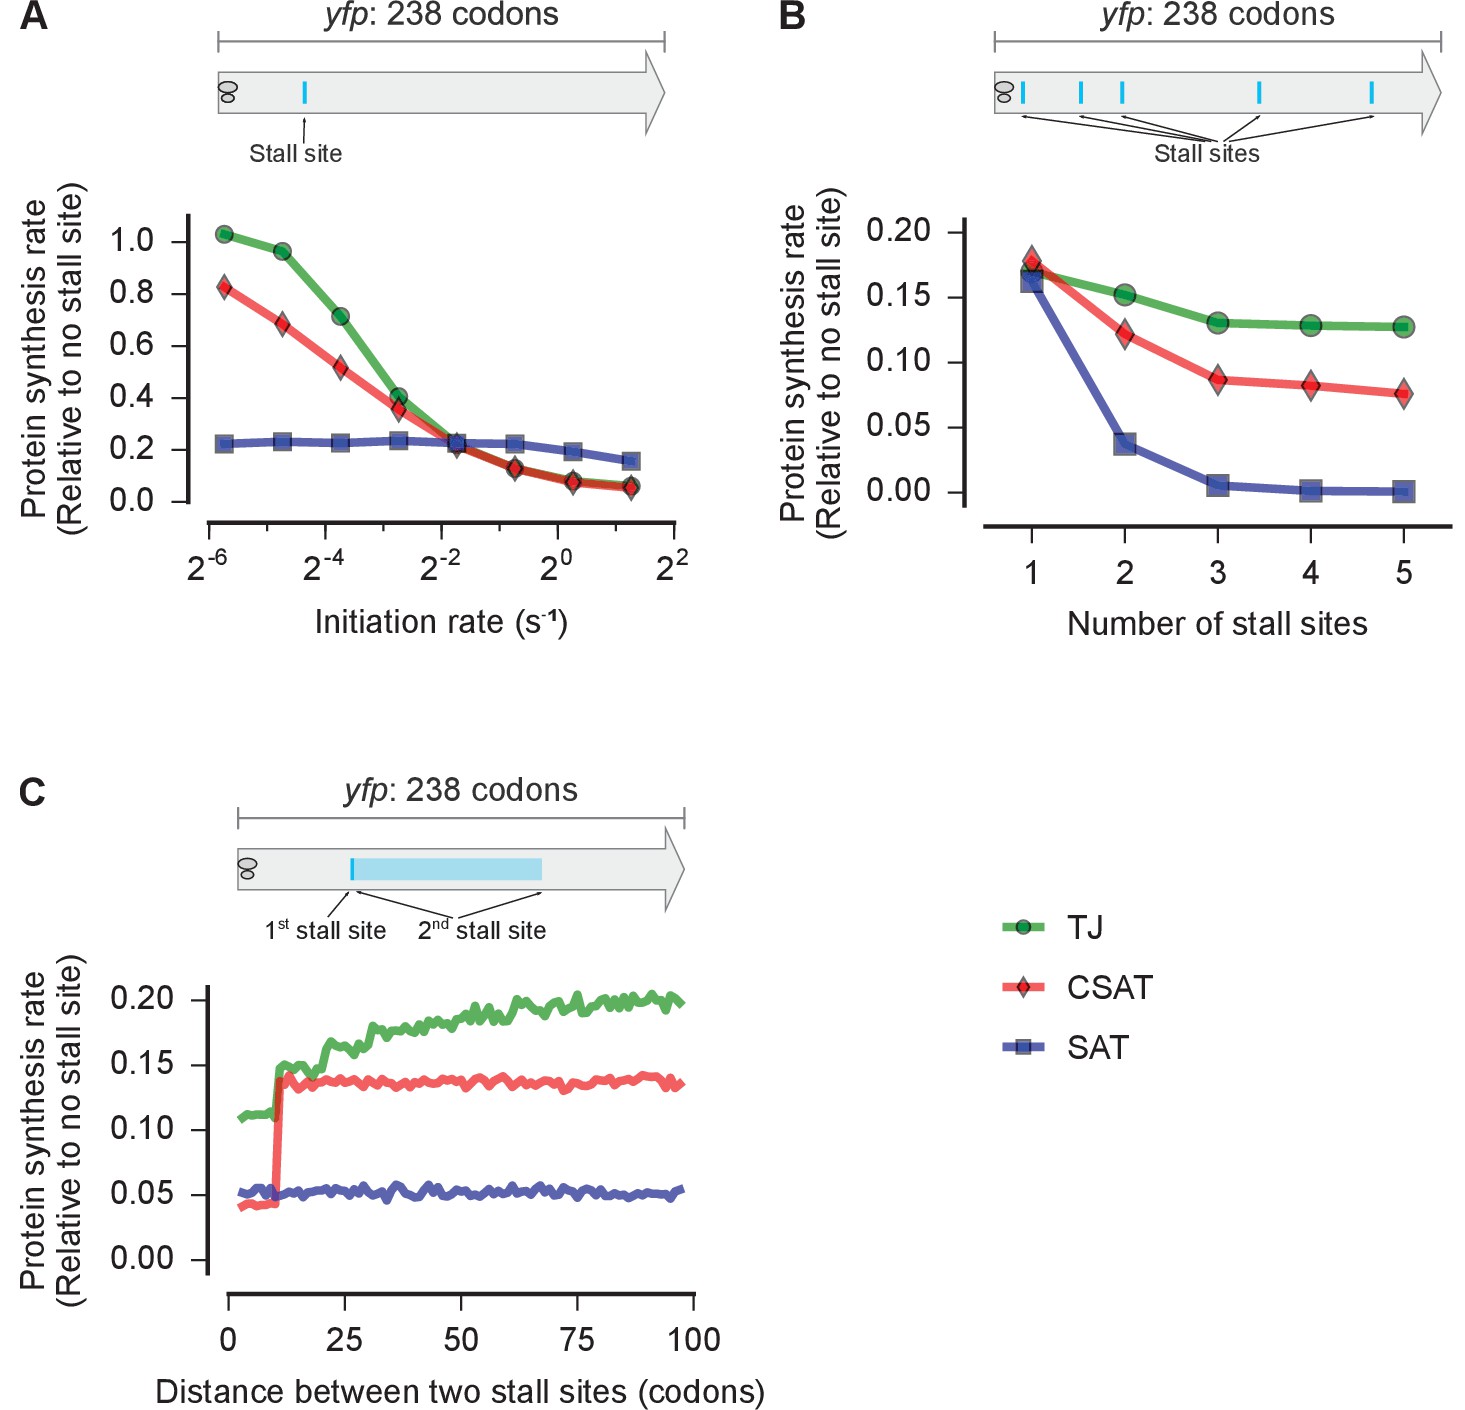
Distinct predictions from three kinetic models.
Predicted effect on protein synthesis rate upon varying the initiation rate (A), the number of ribosome stall sites (B), and the distance between two stall sites (C) of a yfp mRNA. The schematics indicate the locations of the stall sites along yfp in our simulation. In B, the stall sites were incrementally added from 5’ to 3’ of the mRNA. In C, the second stall site was located 1 to 100 codons away from the first stall site. Protein synthesis rate for each mRNA is defined as the number of YFP molecules produced per unit time and is shown relative to a yfp mRNA without stall sites. The duration of stalling in each model was chosen so that the decrease in protein synthesis rate caused by a single stall site was equal in the three models when the initiation rate is 0.3 s-1. k(ae→f)≡k(5h→f)=1 s-1 in the SAT model, and k(ae→f)=0, k(5h→f)=1 s-1 in the CSAT model. Other simulation parameters are in Supplementary file 1.
Figure 4 with 1 supplement

Predicted vs. measured YFP synthesis rates during Leu starvation upon variation in initiation rate.
yfp reporters with a single CTA codon and one of five initiation regions are shown in the schematic. X axis – Measured YFP synthesis rate during Leu-rich growth was used as a proxy for the translation initiation rate. Y axis – Predicted and measured YFP synthesis rates during Leu starvation are shown relative to a yfp mRNA without CTA codon. The Leu position 18 is labeled by its order of occurrence along yfp relative to the start codon (22 Leu codons total), and corresponds to the 201st codon in yfp. Error bars indicate standard error over triplicate cultures. Simulation parameters are shown in Supplementary file 2. RMS error % is the root mean square error between predictions from each model and measured YFP synthesis rate, normalized by the average measured value. RMS error was calculated for initiation region mutants 1, 2, 3 and 5.
Figure 4—figure supplement 1
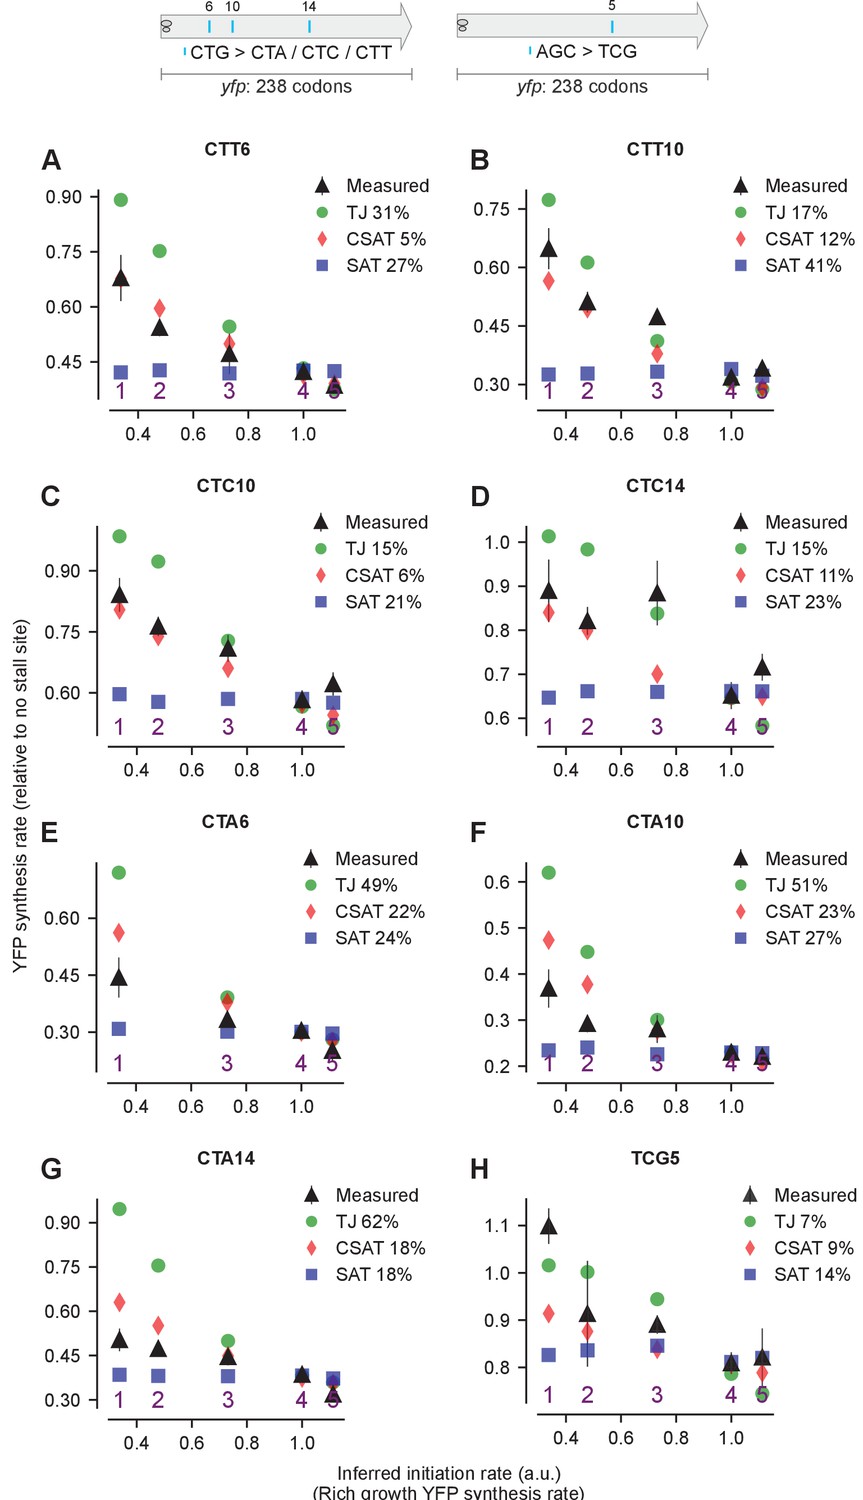
Predicted and measured YFP synthesis rates during Leu starvation (A-G) or Ser starvation (H) from yfp reporters with a single stall-inducing codon and one of five initiation region variants in Figure 4 (labeled 1–5).
Each panel represents data for initiation rate variants having the indicated stall-inducing codon (Leu CTT, CTC, or CTA; Ser TCG) at one of three different Leu codon locations or one Ser codon location along yfp. The Leu or Ser positions are labeled by their order of occurrence along yfp relative to the start codon (22 Leu codons, 8 Ser codons total). The location of the sixth, 10th, and 14th Leu codons along yfp are shown in the left schematic; the fifth Ser codon is shown in the right schematic. X axis, Y axis, RMS error % and simulation parameters are as shown in the main figure.
Figure 5 with 1 supplement
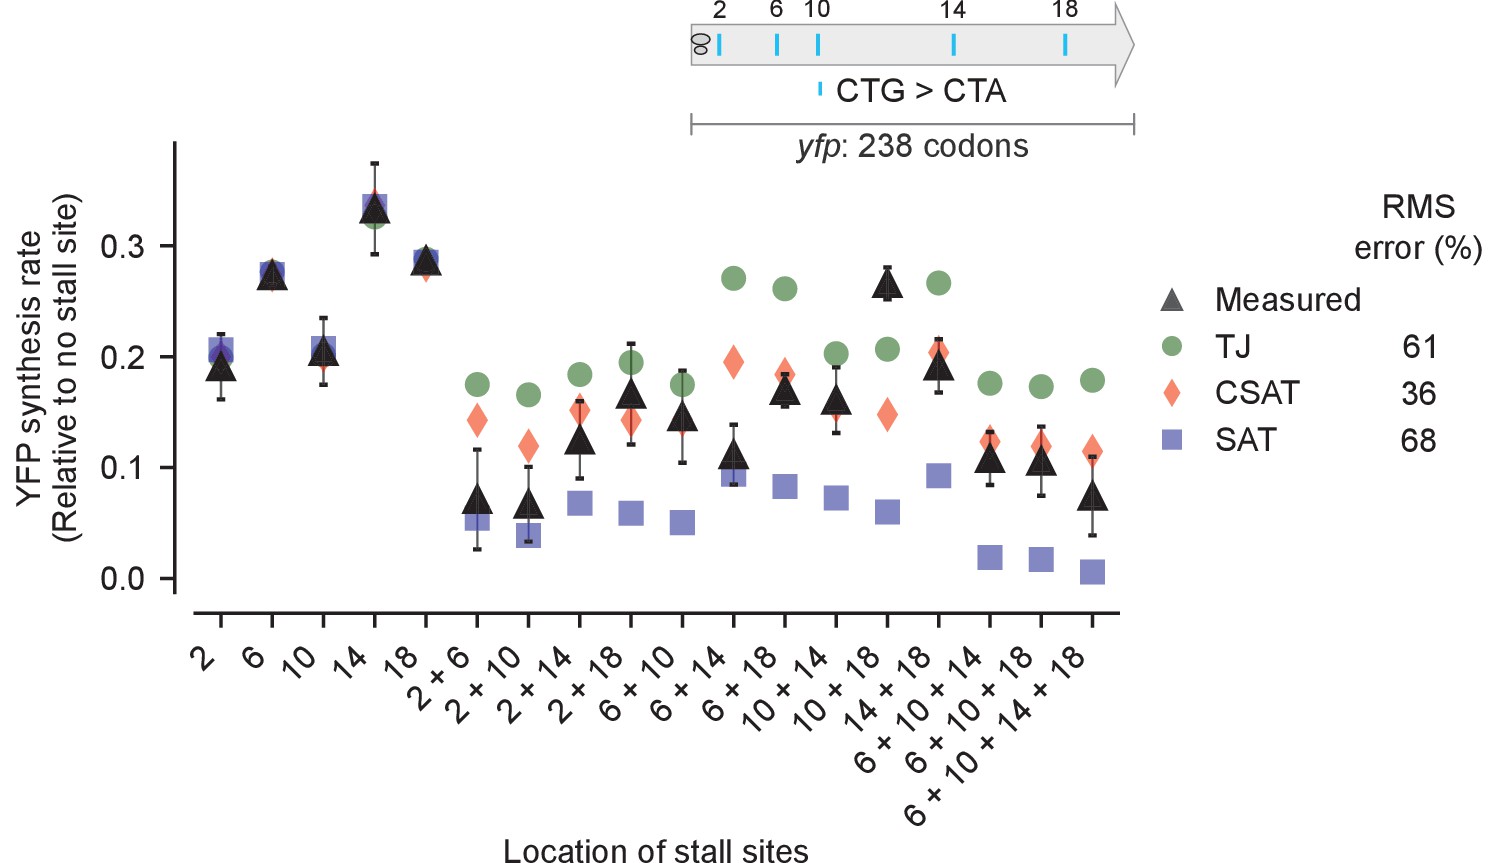
Predicted vs. measured YFP synthesis rates during Leu starvation upon variation in number of stall sites.
yfp reporters having one to four CTA codons at the five Leu positions in yfp are shown in the schematic. X axis – location of CTA codons in each of the yfp variants. Y axis – Predicted and measured YFP synthesis rates during Leu starvation are shown relative to a yfp mRNA without CTA codon. The Leu positions are labeled by their order of occurrence along yfp relative to the start codon (22 Leu codons total), and correspond to the following codon positions along yfp: 2: 15, 6: 46, 10: 68, 14: 141, 18: 201. Error bars indicate standard error over triplicate cultures. Simulation parameters are shown in Supplementary file 3. RMS error % is the root mean square error between predictions from each model and measured YFP synthesis rate, normalized by the average measured value. RMS error was calculated only for mutants with multiple CTA codons.
Figure 5—figure supplement 1
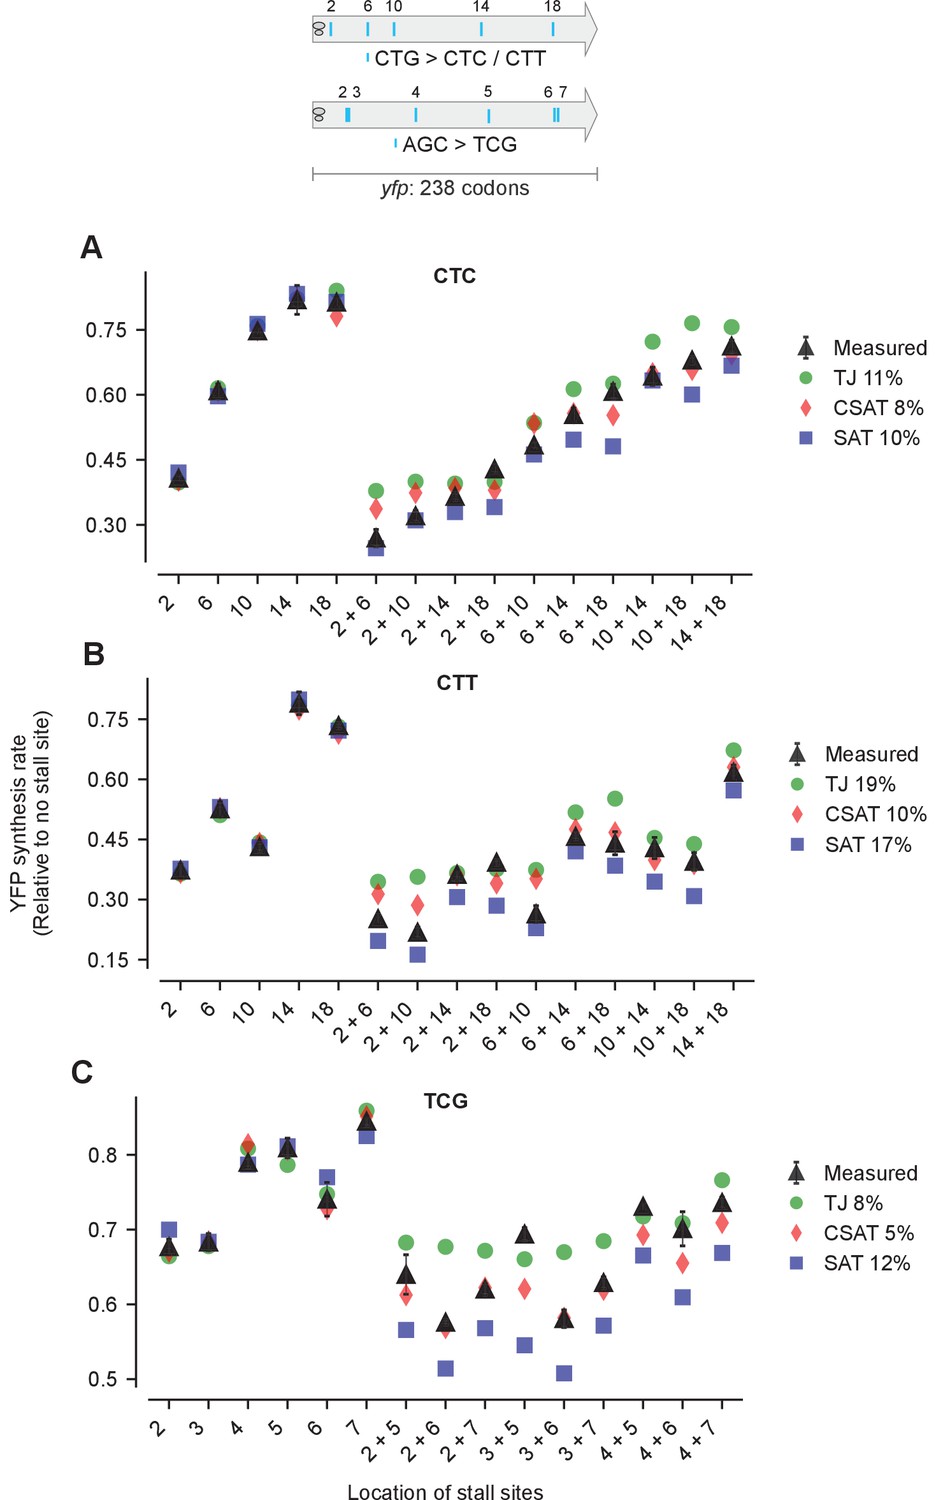
Predicted and measured YFP synthesis rates during Leu starvation (A-B) or Ser starvation (C) from yfp reporters having stall-inducing codons CTC (A), CTT (B), or TCG (C) at one or two among either five Leu positions shown in the upper schematic or six Ser positions in yfp in the lower schematic.
The Leu or Ser positions are labeled by their order of occurrence along yfp relative to the start codon (22 Leu codons, 8 Ser codons total). X axis, Y axis, RMS error % and simulation parameters are as shown in the main figure.
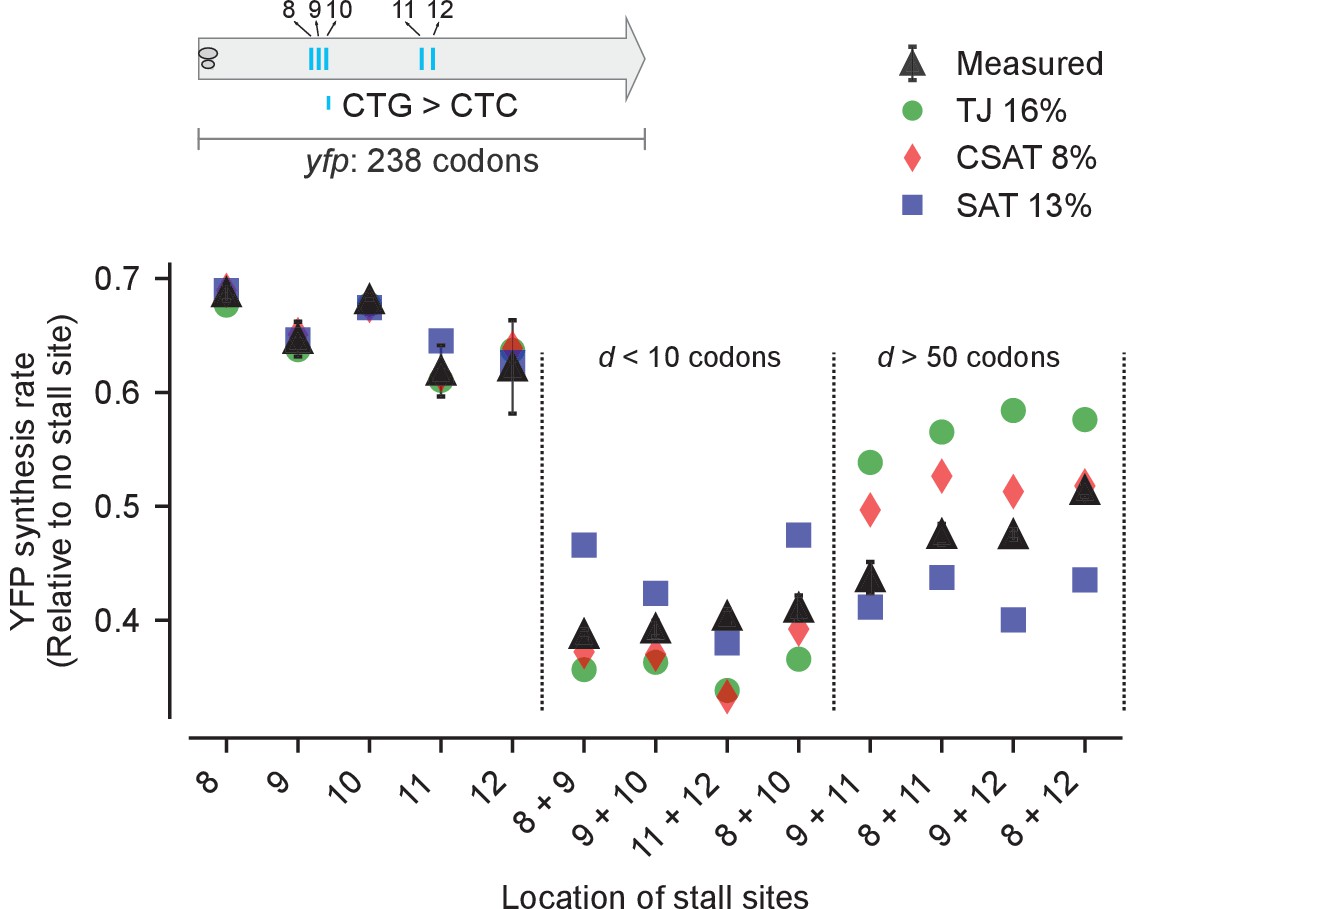
Figure 6 with 1 supplement

Predicted vs. measured YFP synthesis rates during Leu starvation upon variation in distance between stall sites.
yfp variants with two CTA codons are arranged by increasing value of d, the distance between the CTA codons. X axis – location of CTA codons in each of the yfp variants. Y axis – Predicted and measured YFP synthesis rates during Leu starvation are shown relative to a yfp mRNA without CTA codon. The Leu positions are labeled by their order of occurrence along yfp relative to the start codon (22 Leu codons total), and correspond to the following codon positions along yfp: 8: 60, 9: 64, 10: 68, 11: 119, 12: 125, 13: 137, 14: 141. Error bars indicate standard error over triplicate cultures. Simulation parameters are shown in Supplementary file 4. RMS error % is the root mean square error between predictions from each model and measured YFP synthesis rate, normalized by the average measured value. RMS error was calculated only for mutants with two CTA codons.
Figure 6—figure supplement 1
Predicted and measured YFP synthesis rates during Leu starvation from yfp reporters having CTC codons at one or two among five Leu positions in yfp shown in the schematic.
X axis, Y axis, RMS error % and simulation parameters are as shown in the main figure.
Figure 7
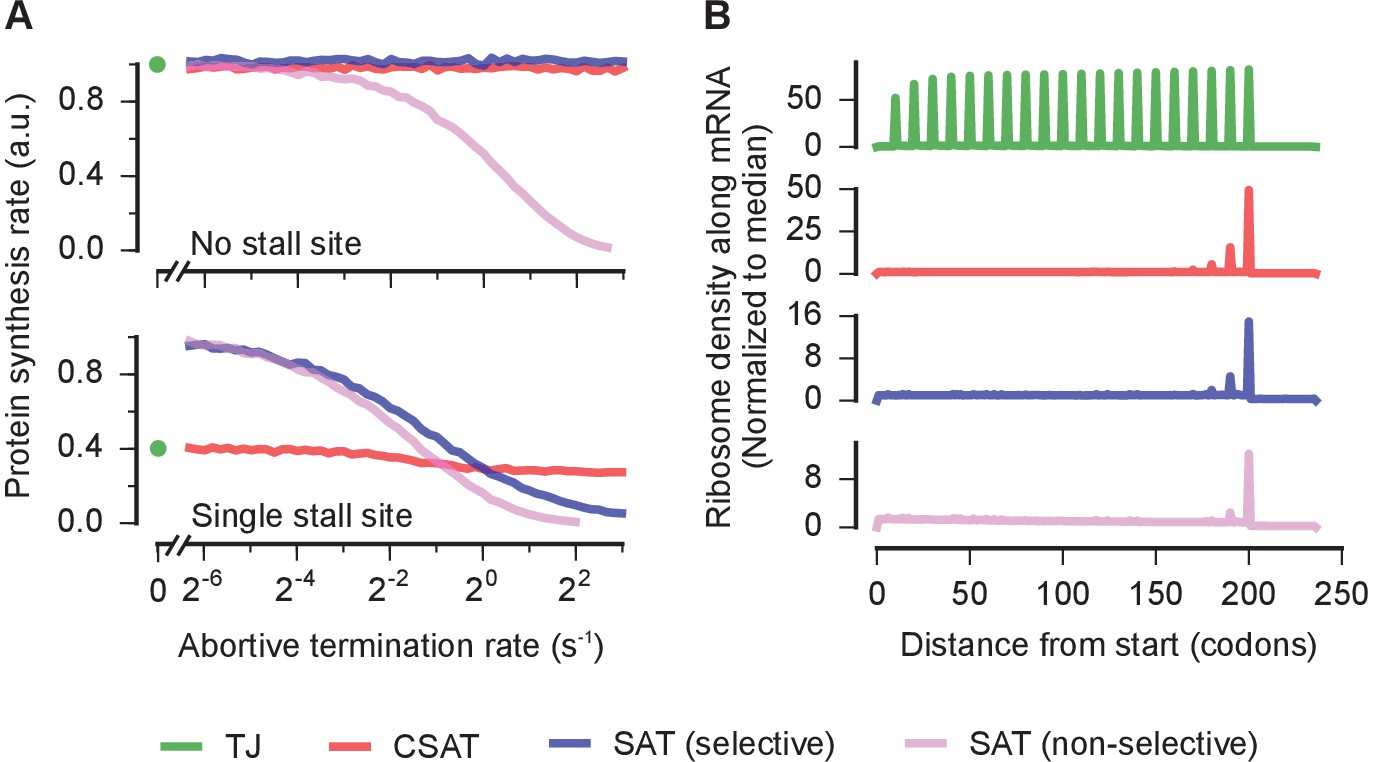
Selectivity, robustness, and ribosome density in the collision-stimulated abortive termination model.
(A) Predicted effect of varying the abortive termination rate on protein synthesis rate from a yfp mRNA having no stall site (top panel) or a single stall site (bottom panel). The TJ model corresponds to an abortive termination rate of zero, and is shown as a single point at the left. The selective SAT model has non-zero abortive termination rate at only the codon corresponding to the stall site. The non-selective SAT model has non-zero abortive termination rate at all codons along the yfp mRNA. Overlapping curves for CSAT and SAT (selective) models in the top panel were manually offset for clarity. (B) Predicted ribosome occupancy on a yfp mRNA with a single stall site at the 201st codon. Ribosome occupancy is normalized by its median value across the mRNA. Simulation parameters are shown in Supplementary file 5.
Author response image 1
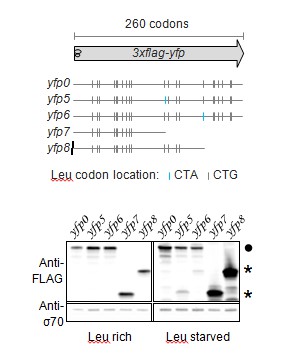
Western blot to demonstrate abortive termination at stall-inducing codons during leucine starvation
https://doi.org/10.7554/eLife.23629.019
Author response image 2
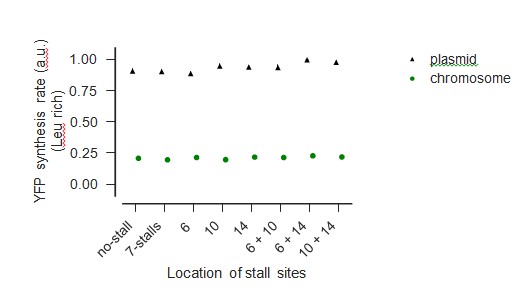
Comparison of measured YFP levels when expressed from chromo- some and plasmid during Leu-rich growth
https://doi.org/10.7554/eLife.23629.020
Author response image 3

Comparison of measured YFP levels when expressed from chromo- some and plasmid during Leu starvation
https://doi.org/10.7554/eLife.23629.021
Author response image 4
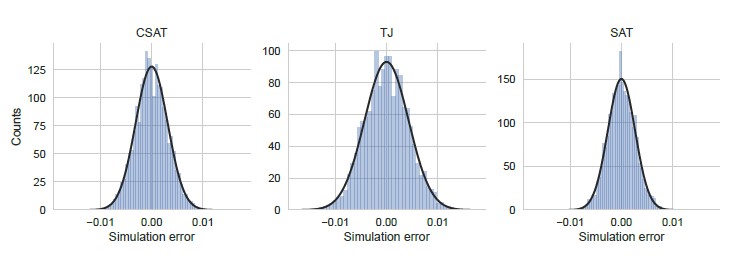
Distribution of simulation error.
Simulation error was calculated as the deviation of the YFP synthesis rate from the mean across an ensemble of 5000 identically simulations for each of the three kinetic models considered in the manuscript. The yfp mutant in the simulation had two CTA stall sites at Leu2 and Leu14 as shown in Figure 5. YFP synthesis rate was calculated relative to the no-stall control. Black line indicates a Gaussian fit.
Author response image 5
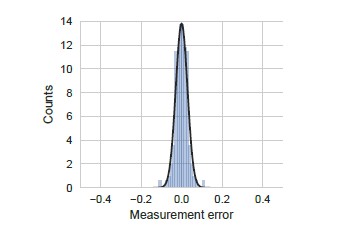
Distribution of measurement error.
Measurement error was calculated as the standard error of the mean measured YFP synthesis rate for all the yfp mutants used in our manuscript (N=115). We note that even though standard error is strictly positive, we have duplicated and inverted the duplicated part in the definition of measurement error for ease of comparison with other errors. YFP synthesis rate was calculated relative to the no-stall control. Black line indicates a Gaussian fit.
Author response image 6

Distribution of modeling error.
Modeling error was calculated as the residual difference between the mean prediction for YFP synthesis rate from each of the three kinetic models and the measured YFP synthesis rate for the corresponding yfp mutant (N=94). YFP synthesis rate for both the modeling prediction and the measured value was calculated relative to the no-stall control. Black line indicates a Gaussian fit.
Additional files
-
Supplementary file 1
Simulation parameters for Figure 3
- https://doi.org/10.7554/eLife.23629.012
-
Supplementary file 2
Simulation parameters for Figure 3 (including Figure supplement)
- https://doi.org/10.7554/eLife.23629.013
-
Supplementary file 3
Simulation parameters for Figure 5 (including Figure supplement)
- https://doi.org/10.7554/eLife.23629.014
-
Supplementary file 4
Simulation parameters for Figure 6 (including Figure supplement)
- https://doi.org/10.7554/eLife.23629.015
-
Supplementary file 5
Simulation parameters for Figure 7
- https://doi.org/10.7554/eLife.23629.016
-
Supplementary file 6
Parameters common to all simulations
- https://doi.org/10.7554/eLife.23629.017
-
Supplementary file 7
List of strains and plasmids
- https://doi.org/10.7554/eLife.23629.018
Download links
A two-part list of links to download the article, or parts of the article, in various formats.
Downloads (link to download the article as PDF)
Open citations (links to open the citations from this article in various online reference manager services)
Cite this article (links to download the citations from this article in formats compatible with various reference manager tools)
Kinetic modeling predicts a stimulatory role for ribosome collisions at elongation stall sites in bacteria
eLife 6:e23629.
https://doi.org/10.7554/eLife.23629


