Planar cell polarity signaling coordinates oriented cell division and cell rearrangement in clonally expanding growth plate cartilage
- California Institute of Technology, United States
- University of Southern California, Keck School of Medicine, United States
- University of Southern California, United States
Figures
Figure 1 with 1 supplement
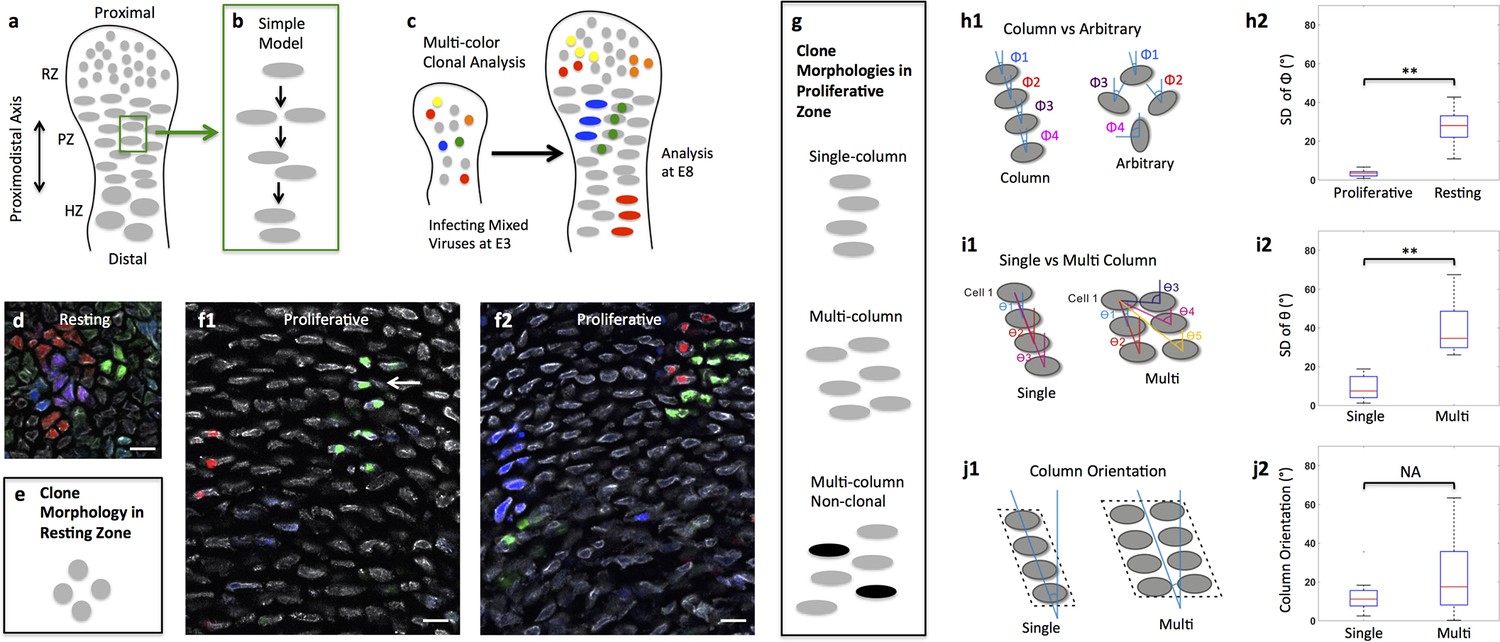
Diversity of clone morphology in growth plate cartilage.
(a) Schematic diagram of growth plate cartilage. The tissue is comprised of three major growth zones along its proximodistal axis: resting (RZ), proliferative (PZ), and hypertrophic (HZ). The progenitor resting chondrocytes are spherical and dispersed whereas proliferative cells are ellipsoidal and more regularly arranged. The enlarged hypertrophic cells are terminally differentiated and are subsequently replaced by osteoblasts. (b) A simple model to explain column formation of proliferative cells involves oriented division orthogonal to the proximodistal axis followed by cell rearrangement. (c) The principle of viral-based multicolor clonal analysis. A mixture of recombinant replication-incompetent avian (RIA) retrovirus with distinct fluorescent markers is injected into chicken limb buds. If the simple model is correct, only single columns with distinct and uniform monocolor should be visualized in cartilage. (d–g) Distinct clone morphologies in the resting and the proliferative zones. Frozen tissue sections infected with RIA viruses expressing CFP (blue), GFP (green), membrane-GFP, mCherry (red) and H2B-mCherry (red) were counterstained with phalloidin Alexa-647 (gray), and imaged using confocal microscopy (d, f). Some clones displayed magenta or cyan due to viral coinfection of progenitor cells. While the growth direction of resting clones was arbitrary (d) (n = 30), proliferative clones were arranged in either single or multi-columns that appeared to be mainly in the growth direction (f1, f2) (n = 46). Some multi-columns were intermingled with neighboring clones (white arrow, f1). Schematic diagrams were drawn to highlight different clone morphologies (e, g). (h) Quantitative characterization of clone morphology. For individual clones with more than two cells, the angle (Φ) between the minor axis of each cell relative to the tissue proximodistal axis was measured (h1). The mean Φ in the proliferative and resting regions was 12° and 42°, respectively. See also Figure 1—figure supplement 1. The standard deviation (SD) of Φ in the proliferative zone was 3° (h2) (n = 18), smaller than cell orientation (12°), demonstrating these cells stacked in rows. See also Figure 1—source data 1. (i) Distinguishing single and multi-columns. Within individual proliferative columns, the orientation (θ) between the topmost cell (cell 1) and all the other cells was quantified (i1). Using 12° as a threshold, if the SD of θ was lower than this value, the column was grouped as a single column (n = 29); otherwise, we called it complex one (n = 20) (i2). See also Figure 1—source data 2. (j) Column orientation analysis. A polygon was drawn along the borders of columns, and the orientation of the major axis of the polygon to the proximodistal axis was measured (j1). While most single columns were generally parallel to the growth direction (mean orientation was 11.77°) (n = 21), multi-columns were slightly shifted with higher variations (mean orientation was 22.82°) (n = 21) (j2). See also Figure 1—source data 3. Scale bars: 15 μm. ** denotes p<0.01, NA denotes not significant (Wilcoxon Rank-Sum Test).
-
Figure 1—source data 1
Quantitative characterization of clone morphology in wild-type tissues.
- https://doi.org/10.7554/eLife.23279.005
-
Figure 1—source data 2
Distinguishing single and multi-columns in wild-type tissues.
- https://doi.org/10.7554/eLife.23279.006
-
Figure 1—source data 3
Column orientation analysis in wild-type tissues.
- https://doi.org/10.7554/eLife.23279.007
Figure 1—figure supplement 1
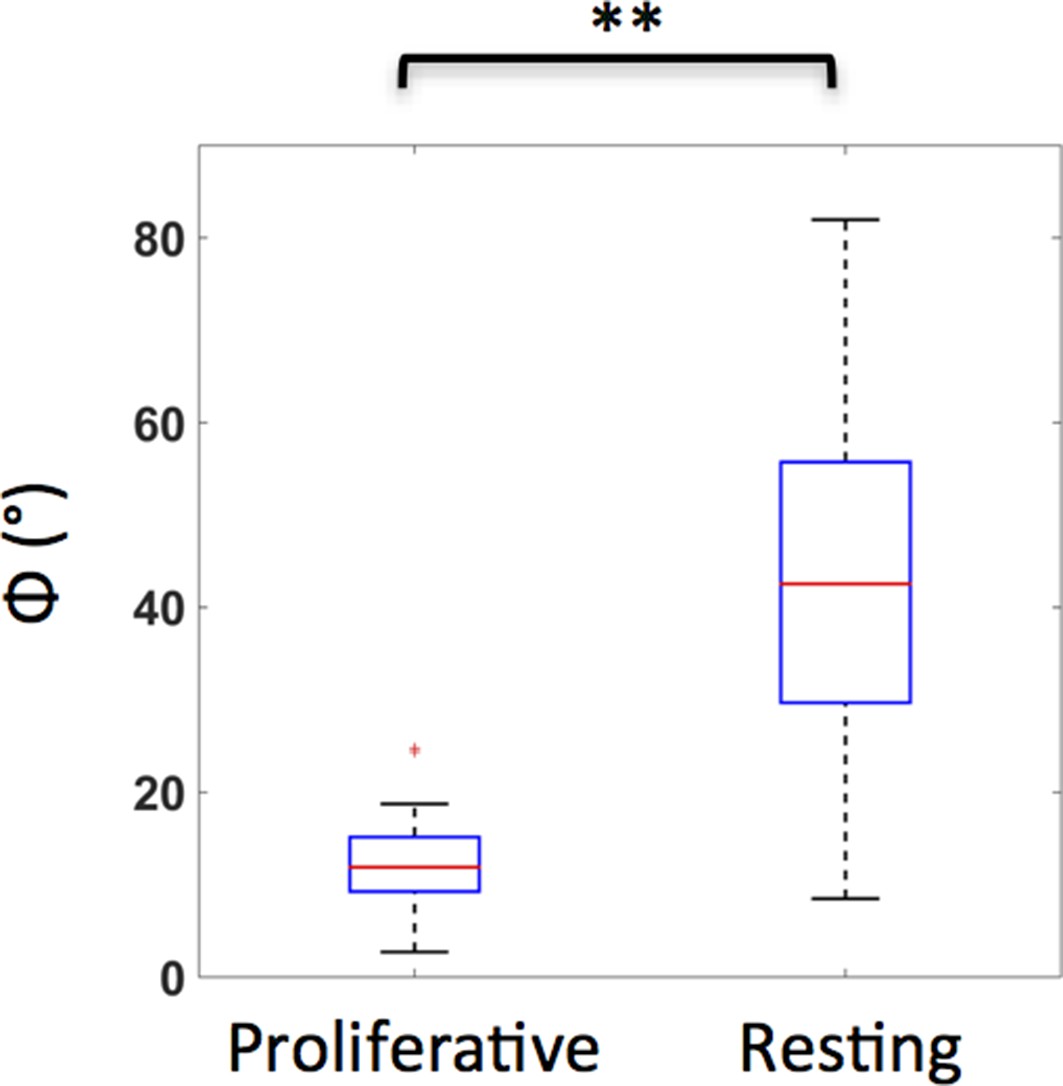
Resting and proliferative chondrocytes exhibit distinct orientations.
The angles (Φ) between the minor axes of the cells and the tissue proximodistal axis were measured, as illustrated in Figure 1h1. While the proliferative cells were generally parallel to the proximodistal axis (Average Φ was about 12°) (n = 20), the orientations of resting cells were arbitrary (Average Φ was about 43°, with larger standard deviation) (n = 28). See also Figure 1—figure supplement 1—source data 1.
-
Figure 1—figure supplement 1—source data 1
Characterizing chondrocyte cell orientation in wild-type tissues.
- https://doi.org/10.7554/eLife.23279.004
Figure 2 with 2 supplements
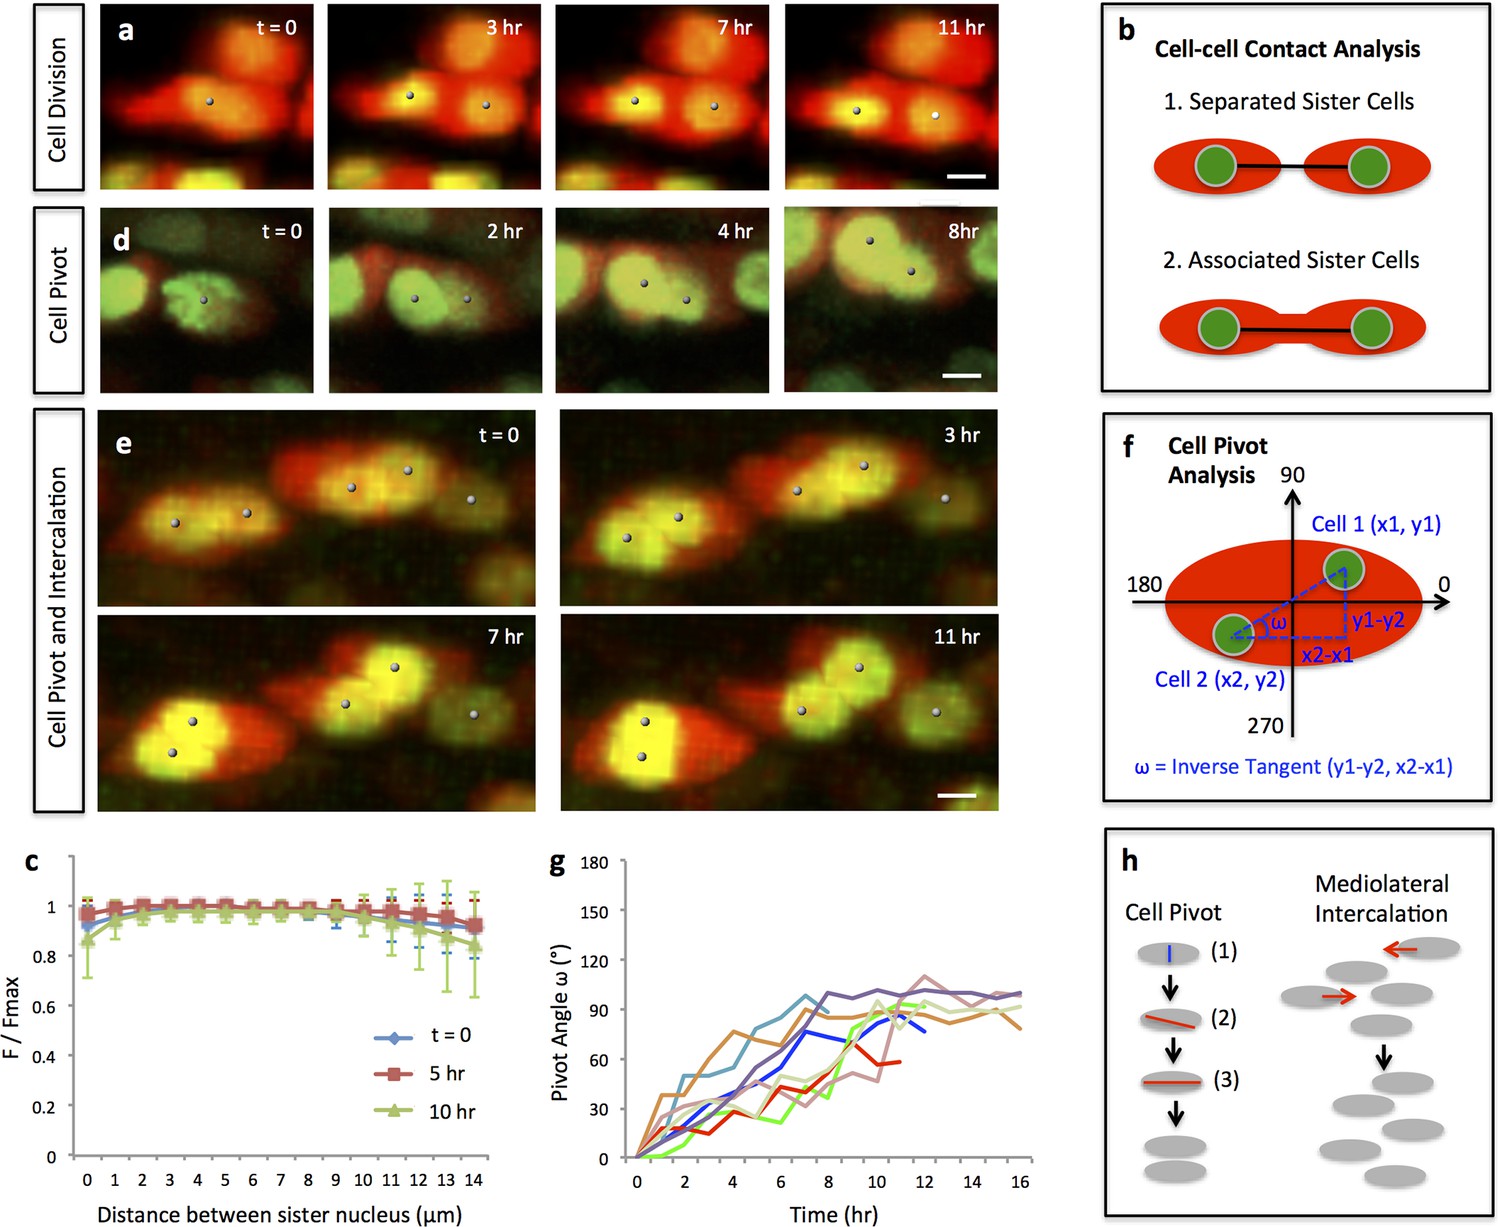
Single and multi-columns are generated by distinct cell rearrangements.
(a) Oriented cell division in the proliferative zone. Live imaging was performed on the chick metacarpal explants expressing H2B-GFP (green) and mCherry (red) via replication-competent avian retroviral (RCAS) infection. Sister cells appeared to be positioned orthogonal to the tissue proximodistal axis and physically coupled after cytokinesis. See also Figure 2—figure supplement 1. (b, c) Quantitative analysis of sister cell contact. Polyline kymograph analysis of the cytoplasmic mCherry intensity (red) was conducted between the nucleus of two sister cells (green). The intensity was divided by the maximum intensity found alone the line for normalization (F/Fmax). For individual dividing pairs, T = 0 was the time when two daughter nuclei formed. If sister cells separate later (b-1), the F/Fmax curve should display an inversed bell shape; if the F/Fmax curve remains flat, it means the two cells are physically associated (b-2). This method confirmed sister cells remained in contact 10 hr after cytokinesis (n = 5) (c). See also Figure 2—source data 1. (d, e) Snapshots of cell pivot and mediolateral intercalation in the proliferative zone. In d, one mother cell produced two daughters started to rearrange their relative positions (The signal intensity of the images in d was adjusted from the corresponding movie to present nucleus morphologies more clearly). In e, on the left, two laterally aligned sister cells (cell doublets) reorganized their orientations and consequently stacked into a single column; on the right, three cells underwent intercalation: they were arranged laterally positioned at time 0; afterwards, the right and left intercalated toward the middle at 11 hr. (f) Schematic diagram to show the calculation of pivot angle (ω) that is between the plane of sister cells and the mediolateral axis of the tissue. Imaging software IMARIS was used to generate the coordinates of the cells (x, y) that were further applied to the provided equation to calculate ω at different time points. (g) Sister cells underwent pivot. ω of individual sister pairs was plotted against time and presented as individual lines in the graph. T = 0 was the time when sister cells were started to be observed, and ω at this time point was normalized to 0° for the ease of comparison. Most pairs (7/8) were initially aligned lateral to each other (low ω at time 0) and then underwent pivot (progressive increase of ω) into a single column (ω was between 70–100°) along the tissue proximodistal axis (n = 8). The maximal limit of y axis was set to 180° because the pivot angles of some cells were larger than 90°. Noticeably, one pair underwent partial pivot for about 50° only (red line). See also Figure 2—source data 2. (h) Schematic diagrams showing how distinct types of cell rearrangements generating corresponding columns: cell pivot behavior produces single columns whereas intercalation refines multi-columns. The blue and red lines stand for cleavage furrow and post-cleavage furrow, respectively. Scale bars: 4 μm.
-
Figure 2—source data 1
Quantitative analysis of sister cell contact in wild-type tissues.
- https://doi.org/10.7554/eLife.23279.014
-
Figure 2—source data 2
Quantitative analysis of cell pivot in wild-type tissues.
- https://doi.org/10.7554/eLife.23279.015
Figure 2—figure supplement 1
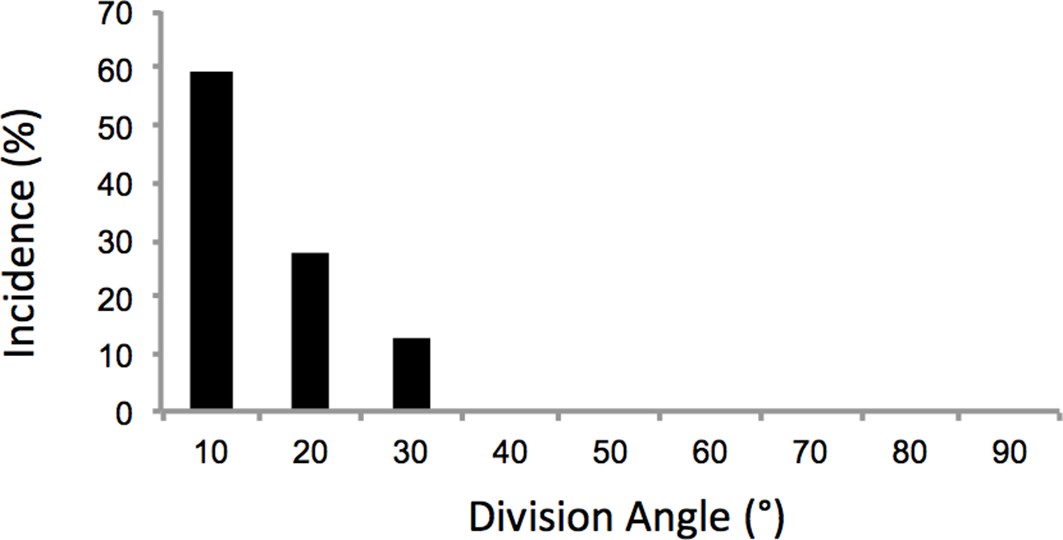
Oriented cell division in the proliferative zone.
Based on the time-lapse images of dividing cells (Figure 2a), the angles between the plane of the sister cells immediately after cytokinesis and the mediolateral axis of the tissue were calculated. The results showed orthogonal division to proximodistal axis (n = 32). The y axis of the graph is the percentage of cells. See also Figure 2—figure supplement 1—source data 1.
-
Figure 2—figure supplement 1—source data 1
Characterizing cell division orientation in wild-type tissues.
- https://doi.org/10.7554/eLife.23279.016
Figure 2—figure supplement 2
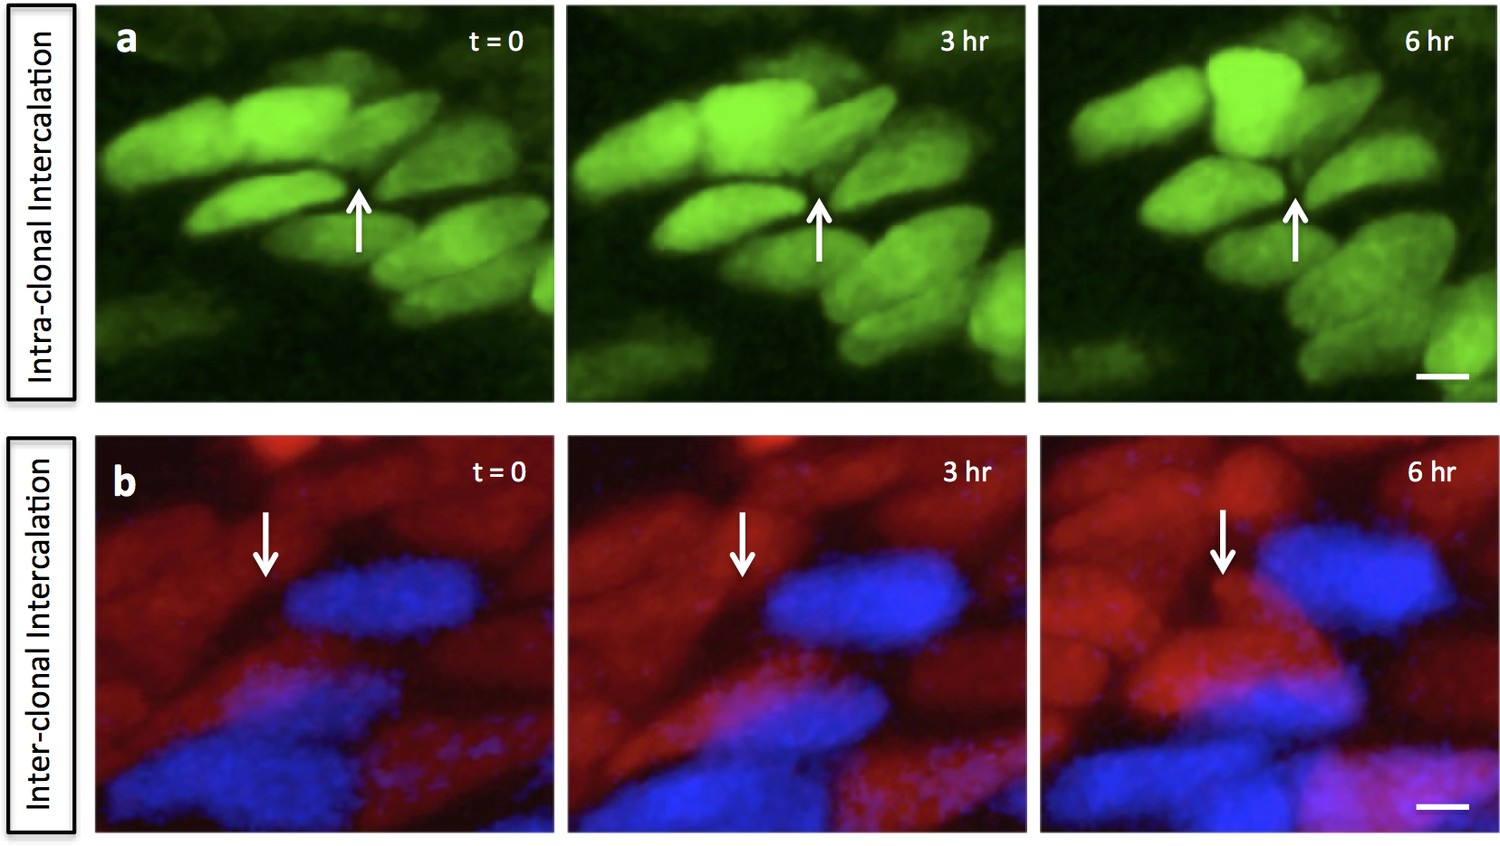
Mediolateral intercalation in the proliferative zone.
In the chick metacarpals clonally labeled with distinct fluorophores via RIA infection, partial intercalation was observed inside one GFP (green) clone (white arrows) (n = 8) (a), and between mCherry (red) and CFP (blue) clones (white arrows) (n = 2) (b). Scale bars: 4 μm.
Figure 3 with 2 supplements
Oriented cell division and cell pivot are differentially regulated by PCP signaling.
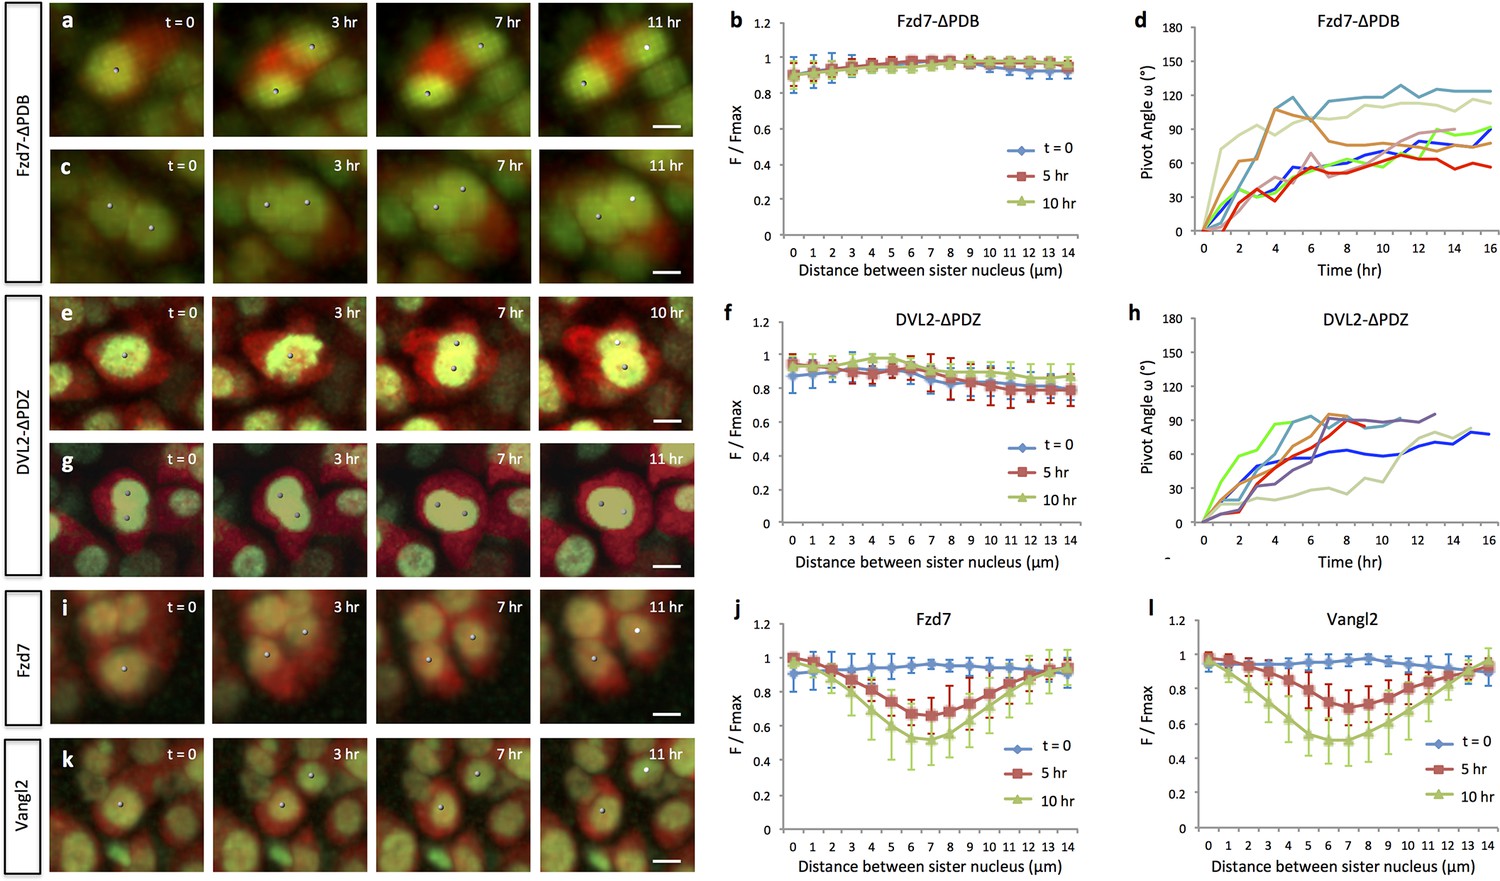
(a, b) Misoriented division and physical coupling of sister cells in the presence of Fzd7-ΔPDB. Live imaging was performed on the chick metacarpals expressing H2B-GFP (green), mCherry (red) and Fzd7-ΔPDB via RCAS infection (a). mCherry intensity analysis confirmed the sister cells were connected after cytokinesis (n = 5) (b). See also Figure 3—source data 1. (c, d) Normal pivot behavior of Fzd7-ΔPDB expressing cells. Among 18 cell doublets, seven pairs underwent pivot to form single stacks. Though their division orientation was not along the mediolateral axis (See also Figure 3—figure supplement 2), these orientation (T = 0) was normalized to 0° for the ease of comparison with wild-type cells in Figure 2g. Note one pair underwent partial rearrangement after division (red line). See also Figure 3—source data 2. (e–h). In the tissues with exogenous DVL2- ΔPDZ, sister cells were associated after cytokinesis (e, f) (n = 5) and 35% cell doublets were rearranged (g, h) (n = 20). The signal intensity of the images in g was adjusted from the corresponding movie to present nuclei morphologies more clearly. See also Figure 3—source data 3, Figure 3—source data 4. (i–l) In the tissues expressing Fzd7 (i, j) or Vangl2 (k, l), cells did not divide along the mediolateral axis (i, k), and were separated within 5 hr after cytokinesis (n = 5 for both cases) (j, l). No rearrangement was observed between cell doublets in the presence of Fzd7 (n = 18) or Vangl2 (n = 16). See also Figure 3—source data 5, Figure 3—source data 6. Scale bars: 4 μm.
-
Figure 3—source data 1
Quantitative analysis of sister cell contact in Fzd7-ΔPDB expressing tissues.
- https://doi.org/10.7554/eLife.23279.022
-
Figure 3—source data 2
Quantitative analysis of cell pivot in Fzd7-ΔPDB expressing tissues.
- https://doi.org/10.7554/eLife.23279.023
-
Figure 3—source data 3
Quantitative analysis of sister cell contact in DVL2-ΔPDZ expressing tissues.
- https://doi.org/10.7554/eLife.23279.024
-
Figure 3—source data 4
Quantitative analysis of cell pivot in DVL2-ΔPDZ expressing tissues.
- https://doi.org/10.7554/eLife.23279.025
-
Figure 3—source data 5
Quantitative analysis of sister cell contact in Fzd7 expressing tissues.
- https://doi.org/10.7554/eLife.23279.026
-
Figure 3—source data 6
Quantitative analysis of sister cell contact in Vangl2 expressing tissues.
- https://doi.org/10.7554/eLife.23279.027
Figure 3—figure supplement 1
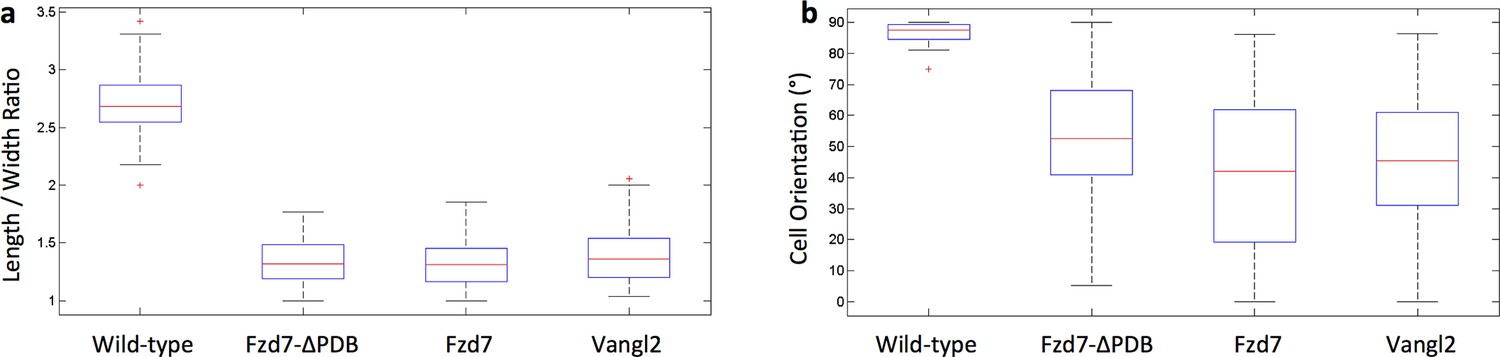
Chondrocytes with perturbed PCP activity display abnormal morphologies.
(a) The ratio between the major and minor axes of the cells was calculated to characterize cell shape. In contrast to the ellipsoidal wild-type cells, the cells expressing Fzd7-ΔPDB, Fzd7 or Vangl2 were morphologically more isotropic. (b) While wild-type cells were oriented orthogonal to the proximodistal axis, the cells expressing Fzd7-ΔPDB, Fzd7 or Vangl2 exhibited more variations. See also Figure 3—figure supplement 1—source data 1.
-
Figure 3—figure supplement 1—source data 1
Characterizing cell orientation in wild-type, Fzd7, Fzd7-ΔPDB or Vangl2 expressing tissues.
- https://doi.org/10.7554/eLife.23279.020
Figure 3—figure supplement 2
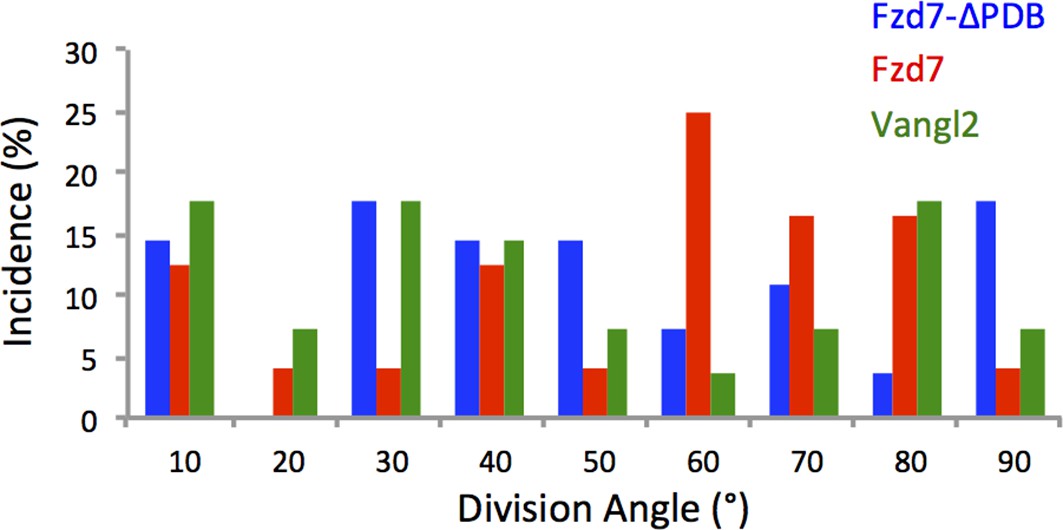
Chondrocytes with perturbed PCP activity display misoriented division.
Based on the time-lapse images of dividing cells (Figure 3a, (e,I and k), quantitative analysis revealed arbitrary division orientation of the cells expressing Fzd7-ΔPDB (n = 27), Fzd7 (n = 24) and Vangl2 (n = 28) with significant difference to wild-type cells. ** denotes p<0.01 (Watson's U2 test). See also Figure 3—figure supplement 2—source data 1.
-
Figure 3—figure supplement 2—source data 1
Characterizing cell division orientation in Fzd7-ΔPDB, Fzd7 or Vangl2 expressing tissues.
- https://doi.org/10.7554/eLife.23279.021
Figure 4

Clonal analysis confirms the roles of PCP signaling.
(a) Recombinant viruses RIA-Fzd7-ΔPDB-T2A-CFP, RIA-Fzd7-ΔPDB-T2A-mCherry and RIA-Fzd7-ΔPDB-T2A-YFP were mixed and injected into chick limb buds; at later stages, clone morphologies were examined in the frozen cartilage sections. An arbitrarily arranged clone (blue, a1), single-row clone with normal (red, a1) or shifted (yellow, a1) orientation, multi-row clones (a2) were observed. (b–d) Quantitative analysis of Fzd7-ΔPDB positive clone morphology. The same method in Figure 1h–j was applied. Briefly, the standard deviation (SD) of the angles between clonally related cells to the tissue proximodistal axis (Φ) was calculated to identify stacked (n = 22) (SD <12°) and arbitrarily arranged clones (n = 14) (SD >12°) (b). Within each stacked clone, we further measured the SD of θ, the orientation of the topmost cell relative to all the other cells. The results showed that these clones exhibited either single (n = 22) or complex (n = 12) width (c) and they were not parallel to the proximodistal axis (d) (n = 13 and 8 for single and multiple stacks, respectively). See also Figure 4—source data 1, Figure 4—source data 2, Figure 4—source data 3. (e, f) In the tissues expressing Fzd7-T2A-CFP, Fzd7-T2A-mCherry and Fzd7-T2A-YFP at clonal density, the clonally related cells appeared to be arbitrarily oriented without forming stacks (e). Consistently, the SD of the angles between these cells to the proximodistal axis (Φ) was larger than 12° (n = 16) (f). See also Figure 4—source data 4. (g) Schematic diagrams to illustrate different cell pivot behaviors under various perturbation conditions. With low PCP activity, cells divide in a misoriented manner followed by sister cell association and pivot. In contrast, with enhanced PCP activity, while cells still undergo misoriented divisions, the sister cells become separated and fail to rearrange. Scale bars: 15 μm. ** denotes p<0.01, NA denotes not significant (Wilcoxon Rank-Sum Test).
-
Figure 4—source data 1
Quantitative characterization of clone morphology in Fzd7-ΔPDB expressing tissues.
- https://doi.org/10.7554/eLife.23279.031
-
Figure 4—source data 2
Distinguishing single and multiple stacks in in Fzd7-ΔPDB expressing tissues.
- https://doi.org/10.7554/eLife.23279.032
-
Figure 4—source data 3
Stack orientation analysis in Fzd7-ΔPDB expressing tissues.
- https://doi.org/10.7554/eLife.23279.033
-
Figure 4—source data 4
Quantitative characterization of clone morphology in Fzd7 expressing tissues.
- https://doi.org/10.7554/eLife.23279.034
Figure 5 with 1 supplement
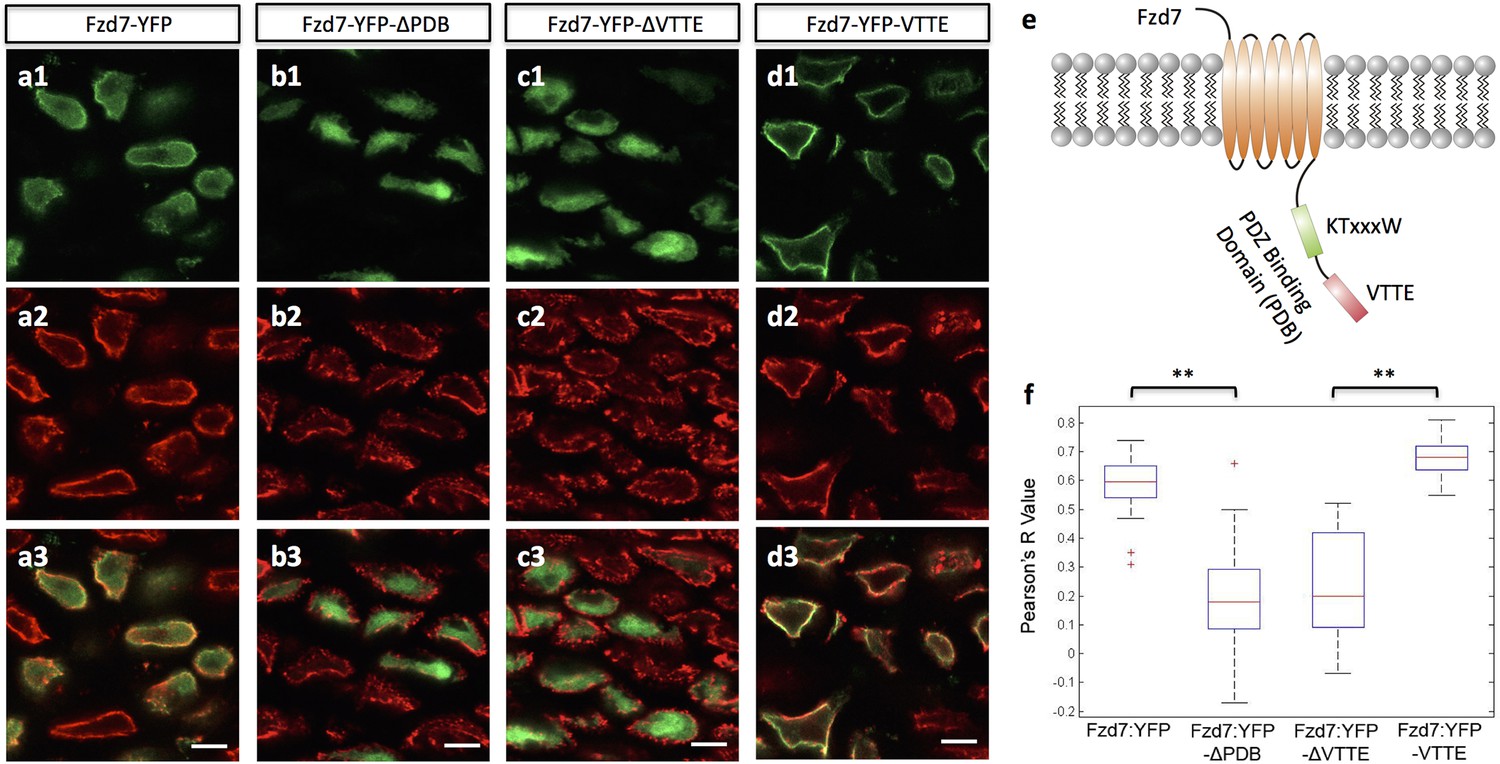
The subcellular localization of Frizzled-7 is determined by its PDB domain.
(a–d) VTTE motif is essential to the membrane localization of Fzd7. Chick humerus expressing different versions of Fzd7-YFP (green) was sectioned and counterstained with phalloidin Alexa-647 (red). Fzd7 was expressed in the cytoplasm and on the membrane (a) (n = 20), but was constrained to the cytoplasm when lacking its PDB domain (b) (n = 29). Removing the VTTE motif from and adding it onto Fzd7 promoted protein cytoplasmic and membrane localization, respectively (c, d) (n = 15 and 33 in d and e, respectively). See also Figure 5—figure supplement 1. (e) Schematic diagram of the PDB domain of Fzd7: two motifs KTxxxW and VTTE are predicted to bind to other signaling proteins. (f) Subcellular localization of different Fzd7 mutants were examined by calculating Pearson correlation coefficient to quantify the colocalization between YFP and phalloidin (one represents perfect correlation and −1 represents perfect anti-correlation). See also Figure 5—source data 1. Scale bars: 5 μm. ** denotes p<0.01(Wilcoxon Rank-Sum Test).
-
Figure 5—source data 1
Pearson correlation analysis of Fzd7 mutants and phalloidin colocalization.
- https://doi.org/10.7554/eLife.23279.041
Figure 5—figure supplement 1
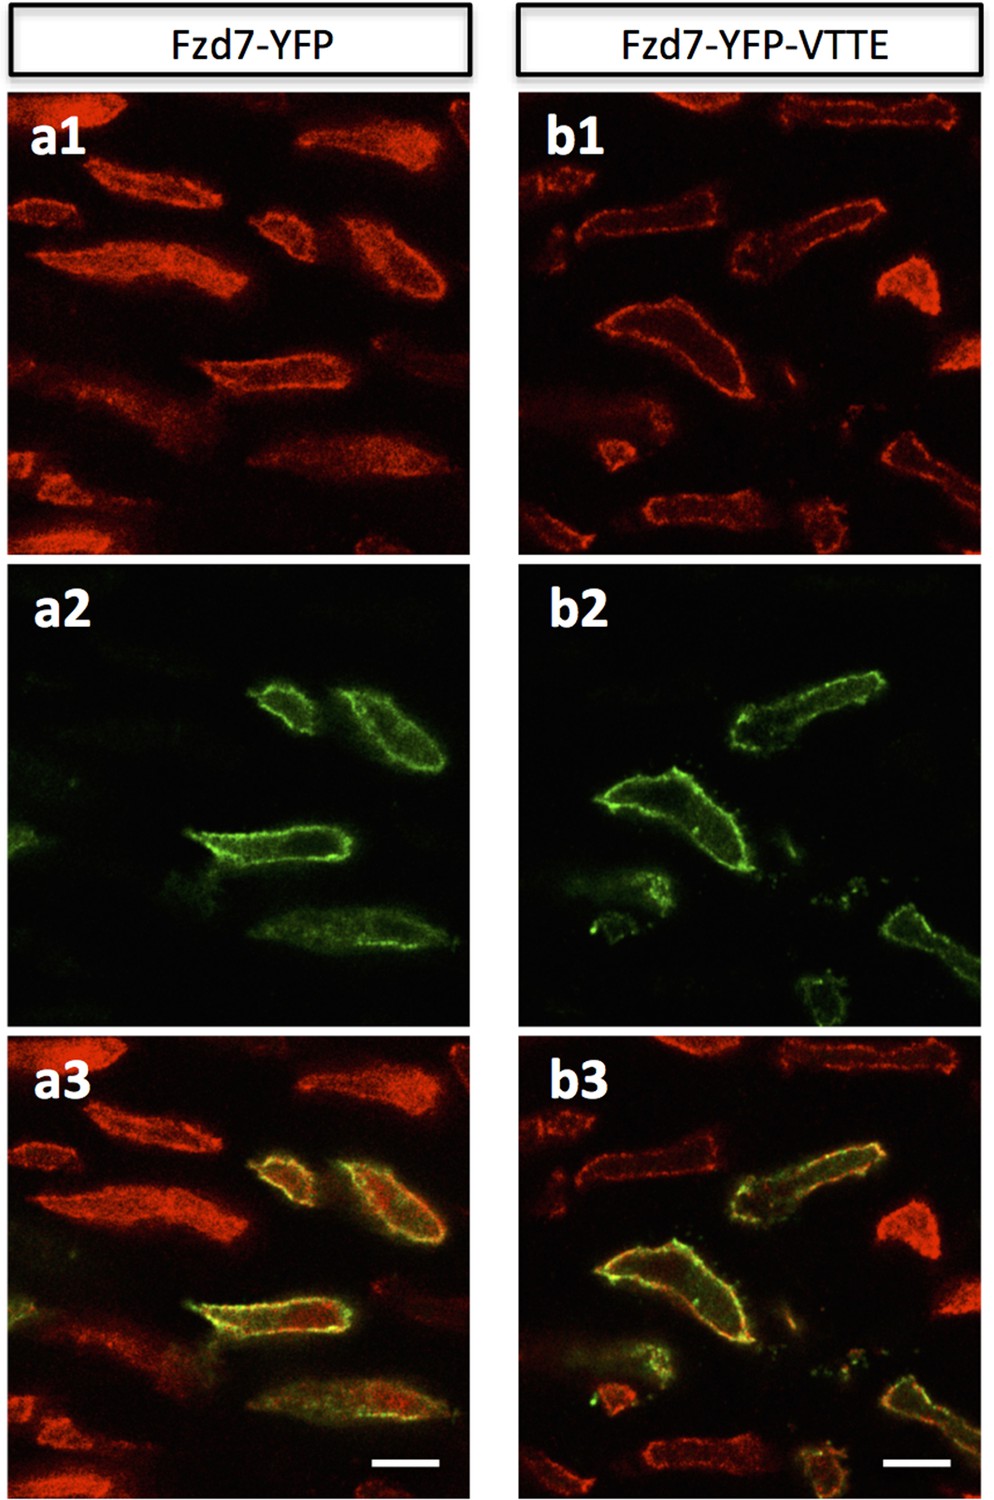
Ectopic expressed Fzd7 and Fzd7-VTTE are bound to cell membrane.
Chick humerus expressing membrane-RFP (red) in combination with either Fzd7-YFP (green) (a) or Fzd7-YFP-VTTE (green) (b) was sectioned and imaged. In both cases, the fusion protein was bound to the membrane. Scale bars: 5 μm.
Figure 6 with 3 supplements
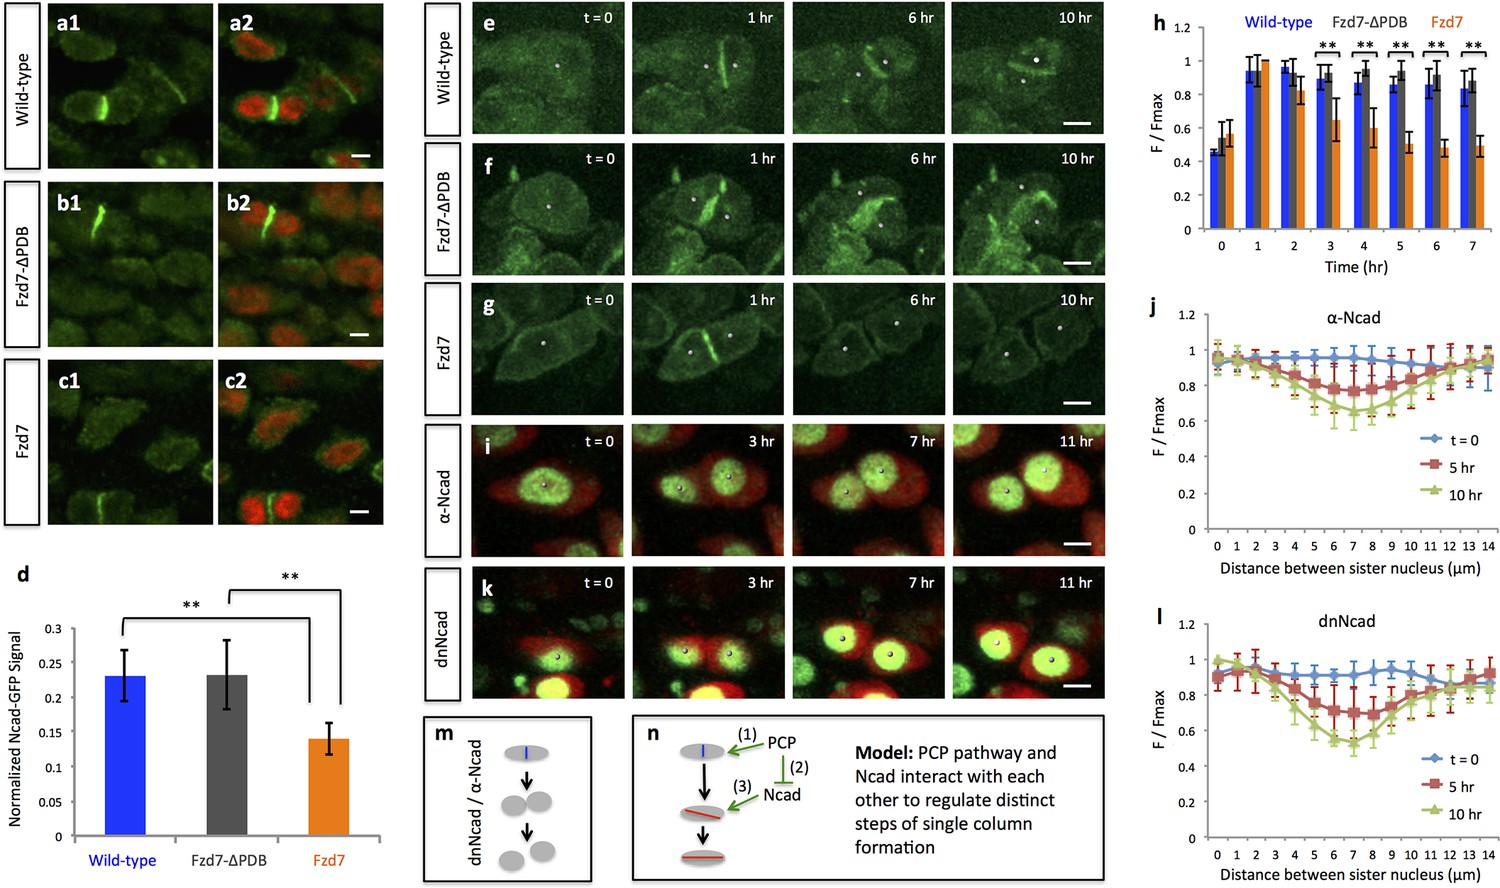
PCP signaling controls cell pivot by maintaining the local concentration of N-Cadherin.
(a–d) Immunofluorescence with α-N-Cadherin (Ncad) antibody (green) and DAPI (red) in the frozen sections of wild-type tissues demonstrated that Ncad was present both on the membrane and in the cytoplasm, particularly enriched in cell-cell junctions (a). These patterns appeared to be unchanged in Fzd7-ΔPDB (b) or Fzd7 expressing cells (c). However, junctional Ncad in Fzd7 positive tissues was reduced (c). This was confirmed by normalizing junctional Ncad intensity to total Ncad intensity in each pair of sister cells (d) (n = 10, 10, eight for wild-type, Fzd7-ΔPDB, and Fzd7 tissues, respectively). See also Figure 6—source data 1. (e–g) In the chick metacarpals expressing Ncad-GFP (green) via RCAS infection, live imaging revealed that the fusion protein was enriched in the interface of sister cells in wild-type tissues (e) (n = 6) and tissues coexpressing Fzd7-ΔPDB (n = 6) over time (f). In contrast, in the presence of Fzd7, Ncad was initially concentrated in the junctions but then diminished as the cytoplasmic bridge between sister cells disconnected (g) (n = 7). (h) Quantifying Ncad-GFP expression along the post-cleavage furrow. GFP intensity was measured every one hour after cell division (T = 1 hr was the time when junctional Ncad-GFP was started to be observed) and normalized by dividing the maximal intensity during the time course (F/Fmax). Changes of cumulative F/Fmax showed that Ncad-GFP signal in Fzd7 expressing cells dropped about 50% 5 hr after cytokinesis. See also Figure 6—source data 2. (i–l) The normal function of Ncad is required for maintaining sister cell contact. Live imaging was performed on H2B-GFP (green) and mCherry (red) positive tissues cultured in the medium with α-Ncad antibody (1:10 dilution) (i), demonstrating the disengagement of sister cells (j) (n = 5). Similar cell behaviors were observed in the tissues expressing H2B-GFP (green) and a dominant-negative mutant of Ncad fused to mCherry through T2A sequence (red) (k, l) (n = 5). The signal intensity of the images in i was adjusted from the corresponding movie to present nuclei morphologies more clearly. In both cases, no complete pivoting was observed in cell doublets (n = 15 and 20 for α-Ncad antibody and dnNcad-T2A-mCherry, respectively). See also Figure 6—source data 3, Figure 6—source data 4. (m) Schematic diagram to show functional blocking of Ncad causes sister cells to separate. (n) Schematic diagram to summarize the roles of PCP signaling and junctional Ncad in regulating single column formation: (1) the absolute level PCP signaling is essential for oriented cell division, (2) PCP signaling reduces Ncad enrichment at the post-cleavage furrow, (3) normal junctional Ncad function is required for cell association and pivot. Scale bars: 4 μm. ** denotes p<0.01; * denotes p<0.05 (Wilcoxon Rank-Sum Test).
-
Figure 6—source data 1
Fluorescence intensity measurement of endogenous junctional Ncad in wild-type tissues.
- https://doi.org/10.7554/eLife.23279.050
-
Figure 6—source data 2
Fluorescence intensity measurement of junctional Ncad-GFP in wild-type, Fzd7-ΔPDB or Fzd7 expressing tissues.
- https://doi.org/10.7554/eLife.23279.051
-
Figure 6—source data 3
Quantitative analysis of sister cell contact in the tissues treated with α-Ncad antibody.
- https://doi.org/10.7554/eLife.23279.052
-
Figure 6—source data 4
Quantitative analysis of sister cell contact in dnNcad expressing tissues.
- https://doi.org/10.7554/eLife.23279.053
Figure 6—figure supplement 1
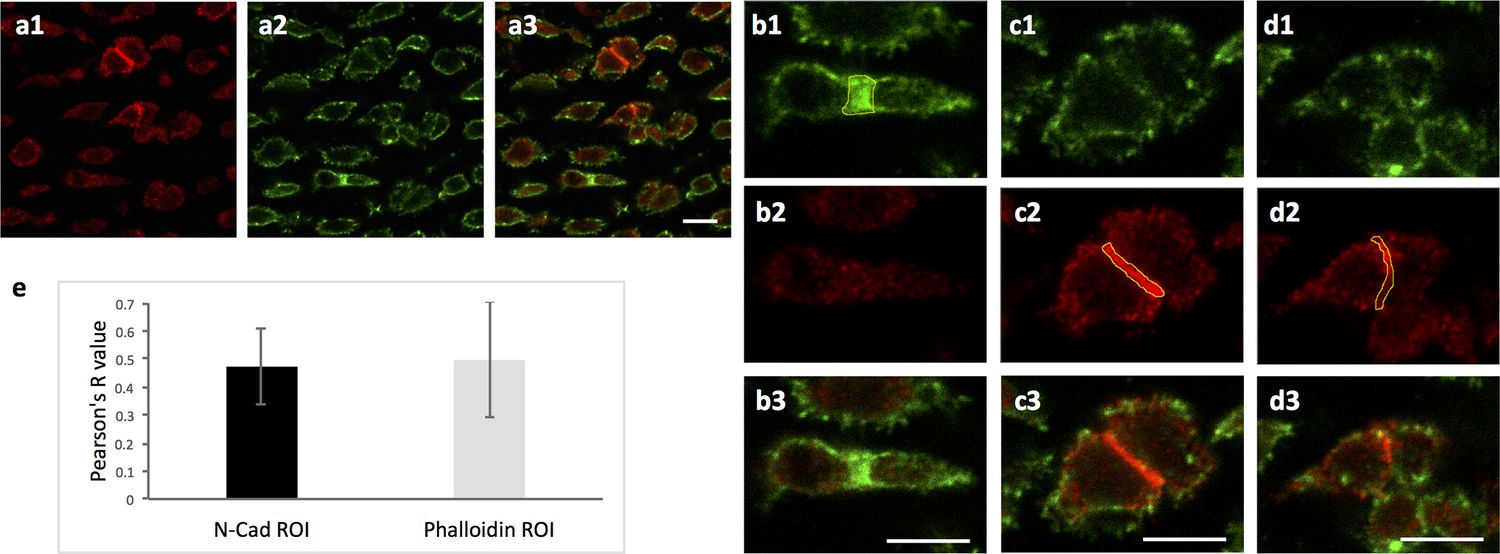
Ncad is enriched in the post-cleavage furrow of dividing cells.
(a) Chick humerus was sectioned and stained with both α-Ncad antibody and phalloidin Alexa-647. One representative image was presented to show the localization of Ncad (a1) and contractile ring (a2). (b–d) Enlarged images of sister cells in (a). In the cleavage furrow highlighted by actin-rich contractile ring (b1), Ncad was not strongly expressed (b2), whereas this protein was concentrated between the cells with weak junctional phalloidin signal (c, d). Polygons (yellow) were drawn along the border of strong phalloidin (b1) or Ncad (c2, d2) to select the regions of interest (ROI) for fluorescence intensity analysis. (e) Pearson correlation coefficients between of Ncad and phalloidin signal in the ROI were calculated to evaluate colocalization of Ncad and cleavage furrow. In the graph, the black column represented the ROI with high Ncad signal in which the colocalization analysis was performed (n = 23); the light grey column was vise versa (n = 20). In either case, the colocalization efficiency was below 0.5 (1 represents perfect correlation, 0 represents no correlation, −1 represent perfect anti-correlation). Taken together, it shows this protein is not enriched in the cleavage furrow, but likely in the post-cleavage furrow instead. See also Figure 6—figure supplement 1—source data 1. Scale bars: 7 μm.
-
Figure 6—figure supplement 1—source data 1
Pearson correlation analysis of junctional Ncad and phalloidin signal in wild-type tissues.
- https://doi.org/10.7554/eLife.23279.046
Figure 6—figure supplement 2

Perturbing PCP activity does not affect Ncad transcription.
Double DNA in situ hybridization against Fzd7 (green) and Ncad (red) and was performed in the frozen cartilage sections sparsely expressing either Fzd7 (a) (n = 25) or Fzd7-ΔPDB (b) (n = 23) via low-titer RCAS infection. In both cases, the expression level of Ncad mRNA appeared to be normal when compared with the uninfected chondrocytes within the same context. Scale bars: 12 μm.
Figure 6—figure supplement 3

Ncad-GFP intensity analysis confirms sister cell association.
Based on the live imaging of Ncad-GFP expressing cells (Figure 6e–g), polyline kymograph analysis seen in Figure 2b was applied to quantify GFP intensity across sister cells (a). T = 1 hr was the time when Ncad-GFP was started to be observed between sister cells. The F/Fmax curve in wild-type (n = 6) (b), Fzd7-ΔPDB (n = 6) (c) and Fzd7 (n = 7) (d) positive tissues was presented. Before cell division (T = 0 hr), Ncad distribution was generally uniform in the cells, as demonstrated by the flat profile of the blue lines. Shortly after division (T = 5 hr), Ncad-GFP was enriched in the junction, as suggested by the bell-shaped profile of the red and green lines. Later on (T = 10 hr), while junctional enrichment of Ncad was still maintained in wild-type (b) and Fzd7-ΔPDB (c) expressing cartilage, it vanished in Fzd7 expressing tissues (d). The dual-small-peak profile of the purple line confirms the premature separation of sister cells. See also Figure 6—figure supplement 3—source data 1, Figure 6—figure supplement 3—source data 2, Figure 6—figure supplement 3—source data 3.
-
Figure 6—figure supplement 3—source data 1
Cell-cell contact analysis in Ncad-GFP expressing tissues.
- https://doi.org/10.7554/eLife.23279.047
-
Figure 6—figure supplement 3—source data 2
Cell-cell contact analysis in Ncad-GFP and Fzd7-ΔPDB expressing tissues.
- https://doi.org/10.7554/eLife.23279.048
-
Figure 6—figure supplement 3—source data 3
Cell-cell contact analysis in Ncad-GFP and Fzd7 expressing tissues.
- https://doi.org/10.7554/eLife.23279.049
Videos
Video 1
Live imaging of oriented cell division in the chick metacarpal expressing H2B-GFP (green) and mCherry (red).
The snapshots of the segmented cells (white dots) were presented in Figure 2a. Scale bar: 7 μm
Video 2
Live imaging on the chick metacarpal expressing H2B-GFP (green) and mCherry (red).
One mother cell generated two daughter cells that underwent partial pivot. The snapshots of the segmented cells (white dots) were presented in Figure 2d. Scale bar: 7 μm
Video 3
Live imaging of two pivoting cells (left) and three intercalating cells (right) in the chick metacarpal expressing H2B-GFP (green) and mCherry (red).
The snapshots of the segmented cells (white dots) were presented in Figure 2e. Scale bar: 7 μm
Video 4
Live imaging of misoriented cell division in the chick metacarpal expressing H2B-GFP (green), mCherry (red) and Fzd7-ΔPDB.
After division, the sister cells remained connected to each other. The snapshots of the segmented cells (white dots) were presented in Figure 3a. Scale bar: 7 μm
Video 5
Live imaging of two pivoting cells in the chick metacarpal expressing H2B-GFP (green), mCherry (red) and Fzd7-ΔPDB.
The snapshots of the segmented cells (white dots) were presented in Figure 3c. Scale bar: 7 μm
Video 6
Live imaging of misoriented cell division in the chick metacarpal expressing H2B-GFP (green), mCherry (red) and DVL2-ΔPDZ.
After division, the sister cells were still associated. The snapshots of the segmented cells (white dots) were presented in Figure 3e. Scale bar: 7 μm
Video 7
Live imaging of two pivoting cells in the chick metacarpal expressing H2B-GFP (green), mCherry (red) and DVL2-ΔPDZ.
The snapshots of the segmented cells (white dots) were presented in Figure 3g. Scale bar: 7 μm
Video 8
Live imaging of misoriented cell division and sister cell separation in the chick metacarpal expressing H2B-GFP (green), mCherry (red) and Fzd7.
The snapshots of the segmented cells (white dots) were presented in Figure 3i. Scale bar: 7 μm
Video 9
Live imaging of misoriented cell division and sister cell separation in the chick metacarpal expressing H2B-GFP (green), mCherry (red) and Vangl2.
The snapshots of the segmented cells (white dots) were presented in Figure 3k. Scale bar: 7 μm
Video 10
Live imaging on the chick metacarpal expressing Ncad-GFP (green).
The fusion protein was enriched in the post-cleavage furrow after cytokinesis and during the whole process of cell pivot. The snapshots of the segmented cells (white dots) were presented in Figure 6e. Scale bar: 7 μm
Video 11
Live imaging of sister cell separation in the H2B-GFP (green) and mCherry (red) expressing cartilage incubated in the medium containing an antibody against Ncad.
The snapshots of the segmented cells (white dots) were presented in Figure 6i. Scale bar: 7 μm
Video 12
Live imaging of sister cell separation in the chick metacarpal expressing H2B-YFP (green) and a dominant-negative mutant of Ncad (dnNcad) fused to mCherry with T2A sequence.
The snapshots of the segmented cells (white dots) were presented in Figure 6k. Scale bar: 7 μm
Video 13
Live imaging on the chick metacarpal expressing Ncad-GFP (green) and Fzd7-ΔPDB.
Ncad-GFP was concentrated between sister cells during their rearrangement. The snapshots of the segmented cells (white dots) were presented in Figure 6f. Scale bar: 7 μm
Video 14
Live imaging on the chick metacarpal expressing Ncad-GFP (green) and Fzd7.
Ncad-GFP was initially concentrated at cell-cell contact and subsequently reduced as sister cells separated. The snapshots of the segmented cells (white dots) were presented in Figure 6g. Scale bar: 7 μm
Video 15
Live imaging on the chick metacarpal expressing membrane-GFP (green) and GFP (green) via RIA infection.
Intercalation occurred inside a GFP clone. The snapshots of the segmented cells (white dots) were presented in Figure 2—figure supplement 2a. Scale bar: 7 μm
Video 16
Live imaging on the chick metacarpal expressing CFP (blue), mCherry (red) and H2B-mCherry (red) via RIA infection.
Intercalation occurred between CFP positive and mCherry positive clones. The snapshots of the segmented cells (white dots) were presented in Figure 2—figure supplement 2b. Scale bar: 7 μm
Download links
A two-part list of links to download the article, or parts of the article, in various formats.
Downloads (link to download the article as PDF)
Open citations (links to open the citations from this article in various online reference manager services)
Cite this article (links to download the citations from this article in formats compatible with various reference manager tools)
Planar cell polarity signaling coordinates oriented cell division and cell rearrangement in clonally expanding growth plate cartilage
eLife 6:e23279.
https://doi.org/10.7554/eLife.23279


