Mechanistic insights into neurotransmitter release and presynaptic plasticity from the crystal structure of Munc13-1 C1C2BMUN
- University of Texas Southwestern Medical Center, United States
- Charité-Universitätsmedizin Berlin, Germany
- Huazhong University of Science and Technology, China
Figures
Figure 1 with 5 supplements
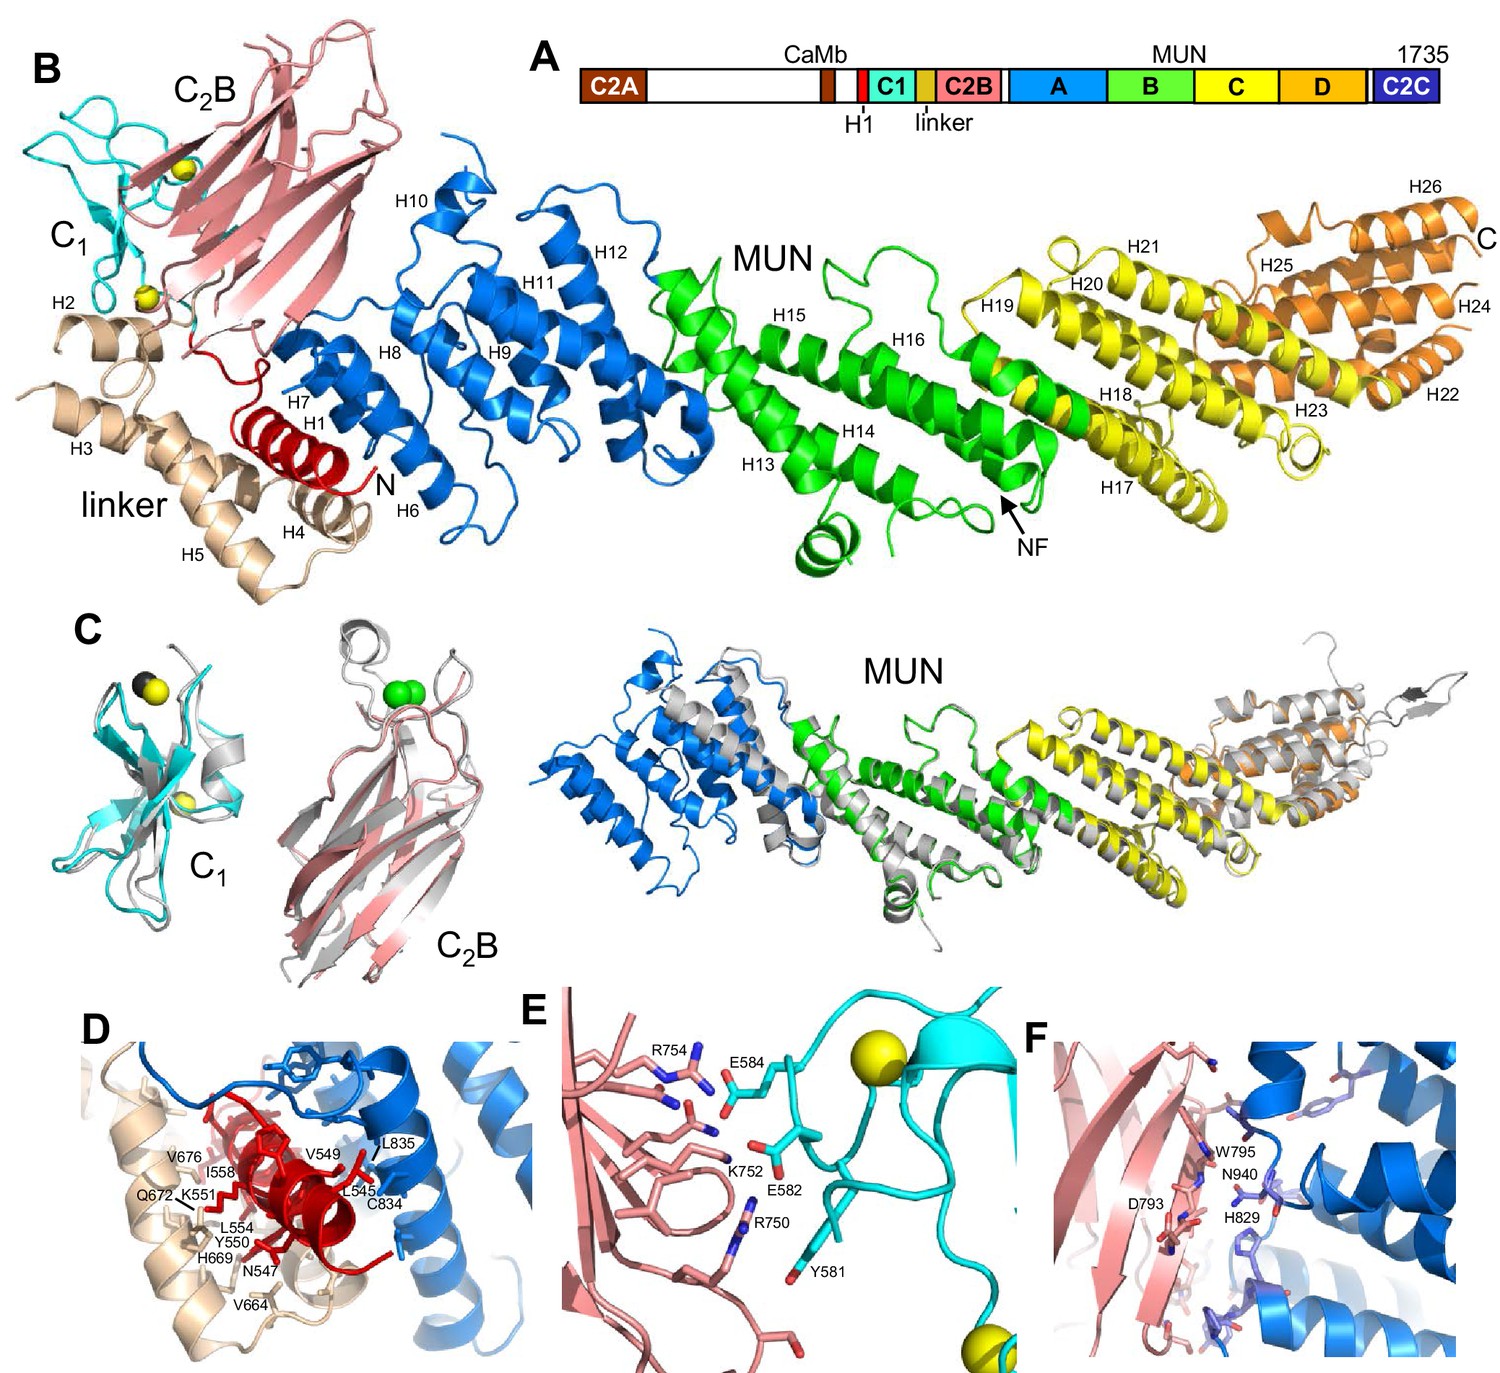
Crystal structure of Munc13–1 C1C2BMUN.
(A) Domain diagram of rat Munc13–1, with A-D corresponding to the four subdomains of the MUN domain. CaMb = calmodulin-binding sequence. (B) Ribbon representation of the structure of Munc13–1 C1C2BMUN color-coded as in the domain diagram. Helices are numbered and labeled. The position of the NF sequence involved in opening syntaxin-1 is indicated. The Zn2+ ions bound to the C1 domain are shown as yellow spheres. (C) Superimposition of the structures of the Munc13–1 isolated C1 domain (PDB code 1Y8F), Ca2+-bound C2B domain (PDB code 3 KWU) and our refined structure of the almost complete MUN domain with the structures of these domains in the crystal structure of C1C2BMUN [r.m.s.d. between equivalent Cα atoms are 1.15 (45 Cα atoms), 0.35 (85 Cα atoms) and 0.96 (465 Cα atoms), respectively]. Ca2+ ions of the C2B domain structure are shown as green spheres. D-F. Interfaces of helix H1 with the linker helices and with the MUN domain (D), of the C1 domain with the C2B domain (E) and of the C2B domain with the MUN domain (F). Selected sides chains in the interfaces, including those that were mutated, are indicated.
Figure 1—figure supplement 1

Zn2+ ions in the C1 domain of C1C2BMUN.
Superimposed on the atoms is the anomalous difference map colored in magenta mesh and contoured at the 3σ level. The map was calculated from data with resolution limits of 49.9–6.0 Å, collected at the zinc K-absorption edge. (A) C1 domain of chain A. (B) C1 domain of chain B.
Figure 1—figure supplement 2
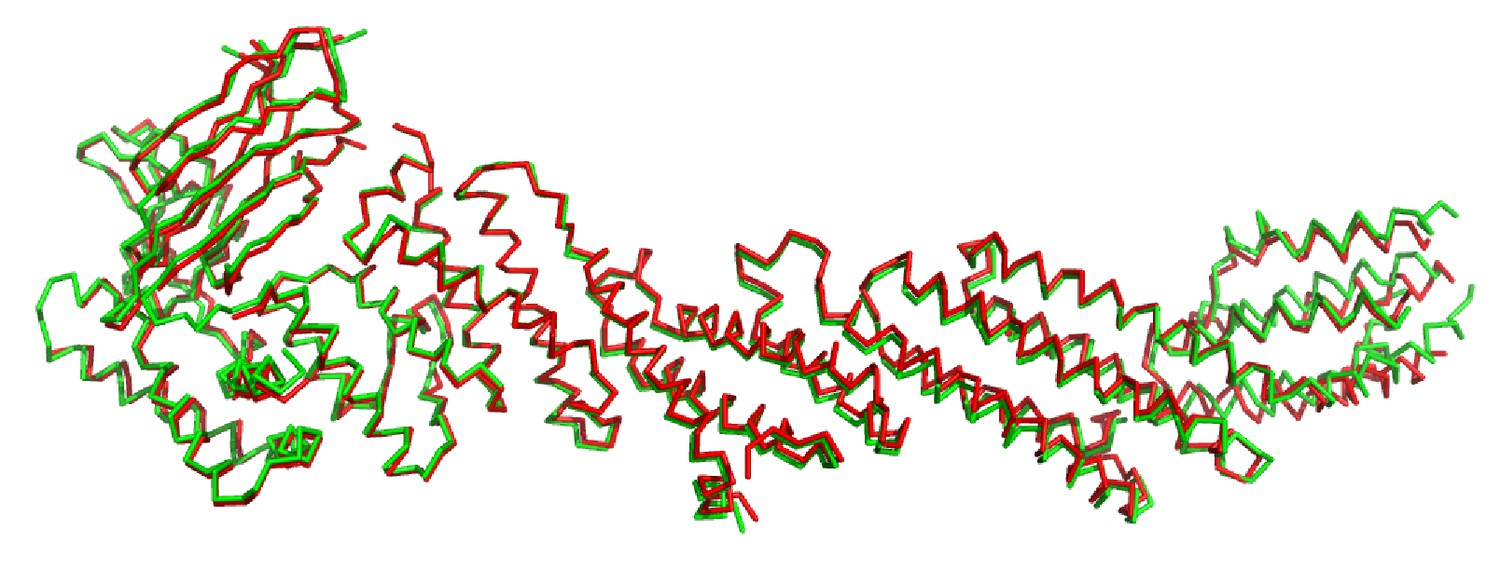
Comparison of chains A (green) and B (red) of C1C2BMUN.
Superposition of 809 C-α carbon atoms resulted in an r.m.s.d. of 1.51 Å.
Figure 1—figure supplement 3
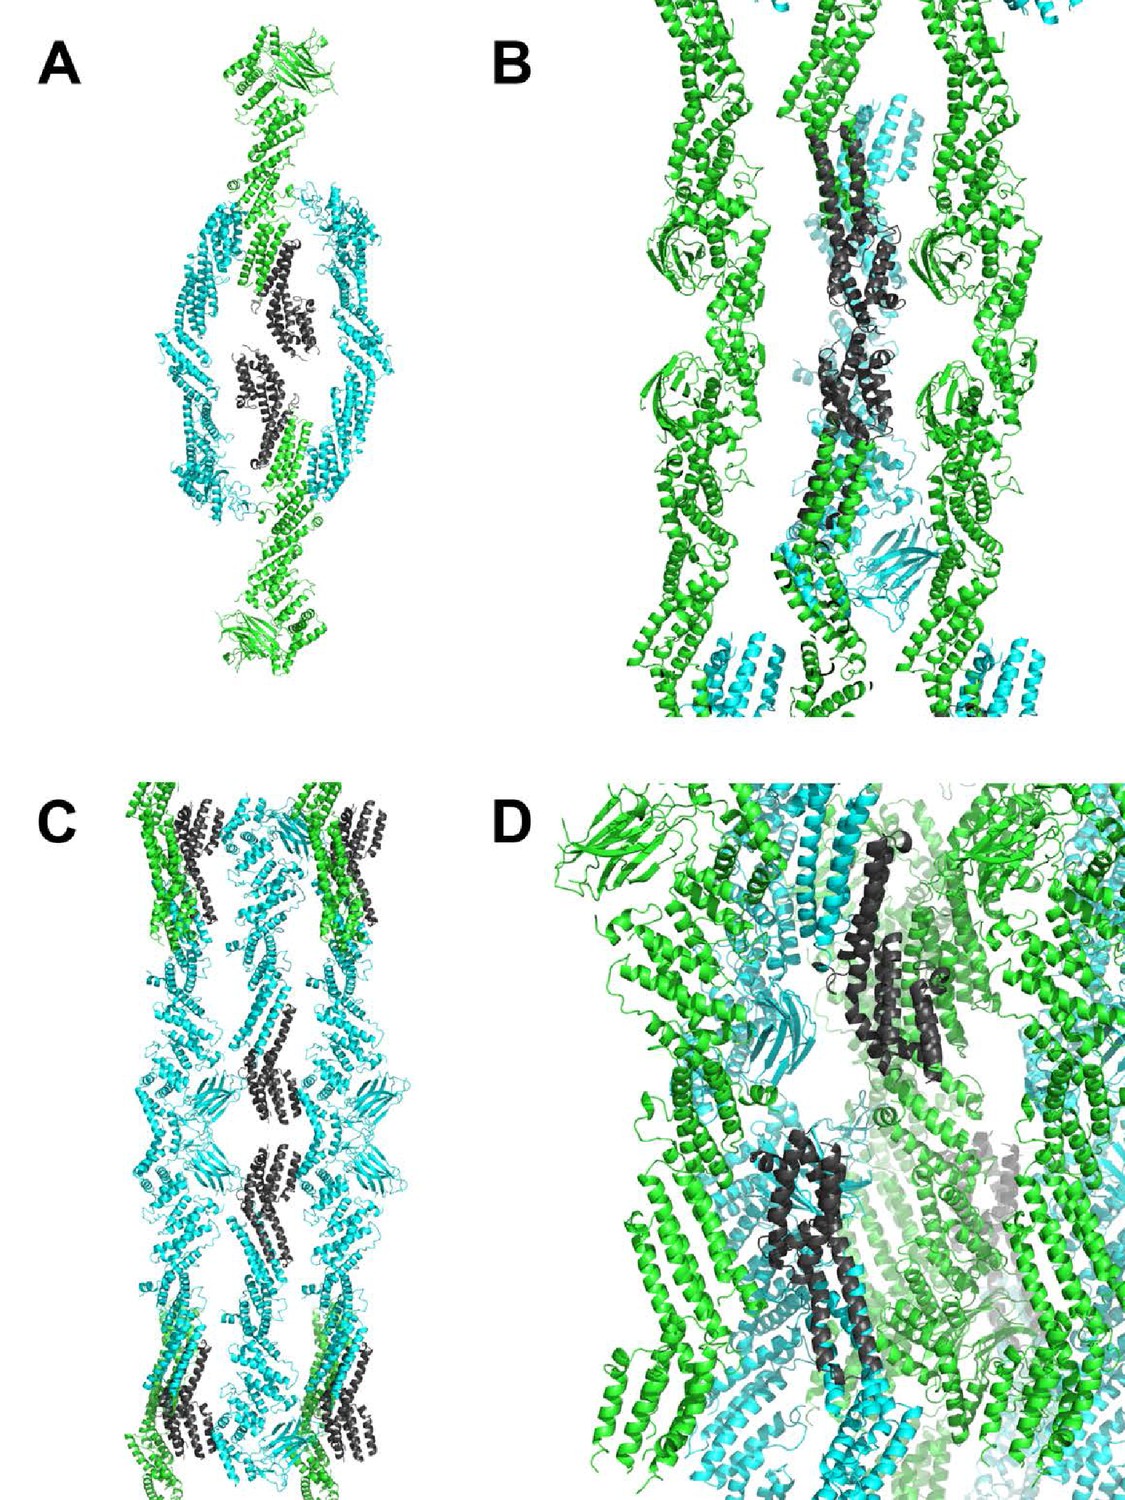
Lattice contacts for C1C2BMUN domains, C2 symmetry.
Chain A is shown in green, chain B in cyan. In all panels, monomers in the foreground were removed for clarity. (A, B) Shown in dark grey are residues 1255–1517 of chain A. The view shown in B is rotated 90 degrees and zoomed in from that shown in A. (C, D) Shown in dark grey are residues 1255–1514 of chain B. The view shown in D is rotated 90 degrees and zoomed in from that shown in C.
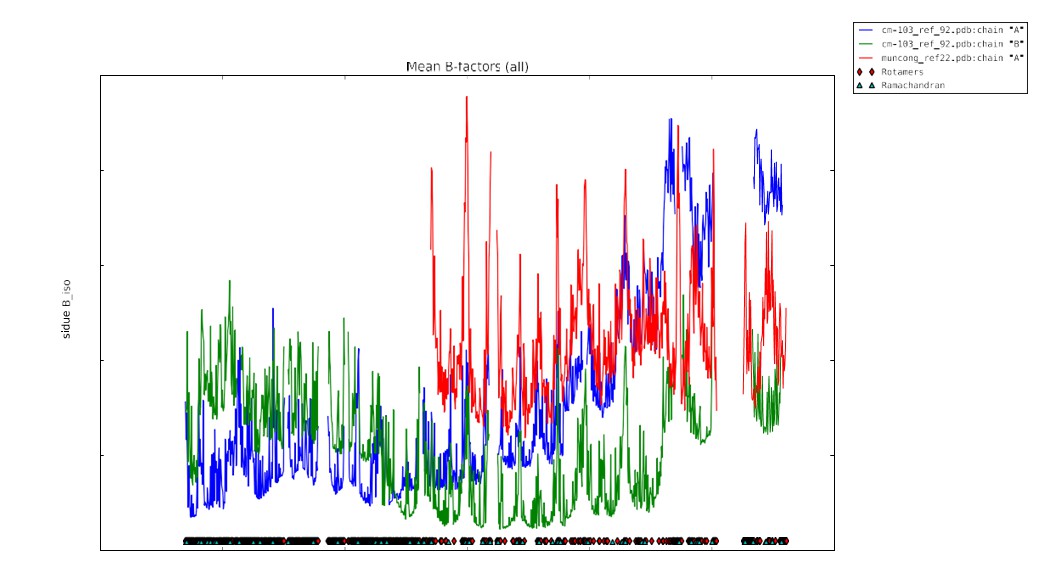
Figure 1—figure supplement 4
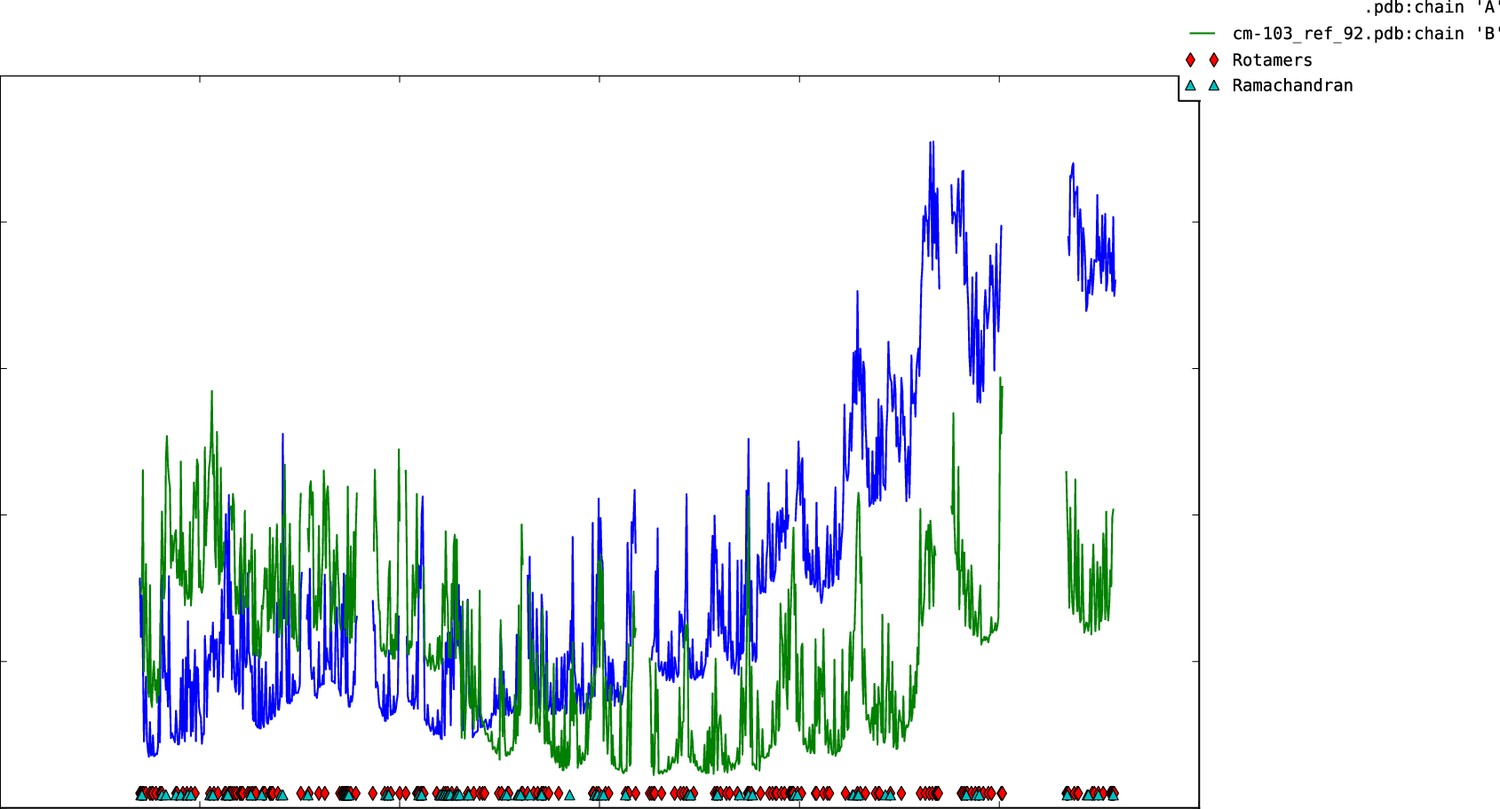
Plot of mean atomic displacement parameters (B-factors) versus residue number for the C1C2BMUN fragment.
Chain A is shown in blue and chain B in green.
Figure 1—figure supplement 5
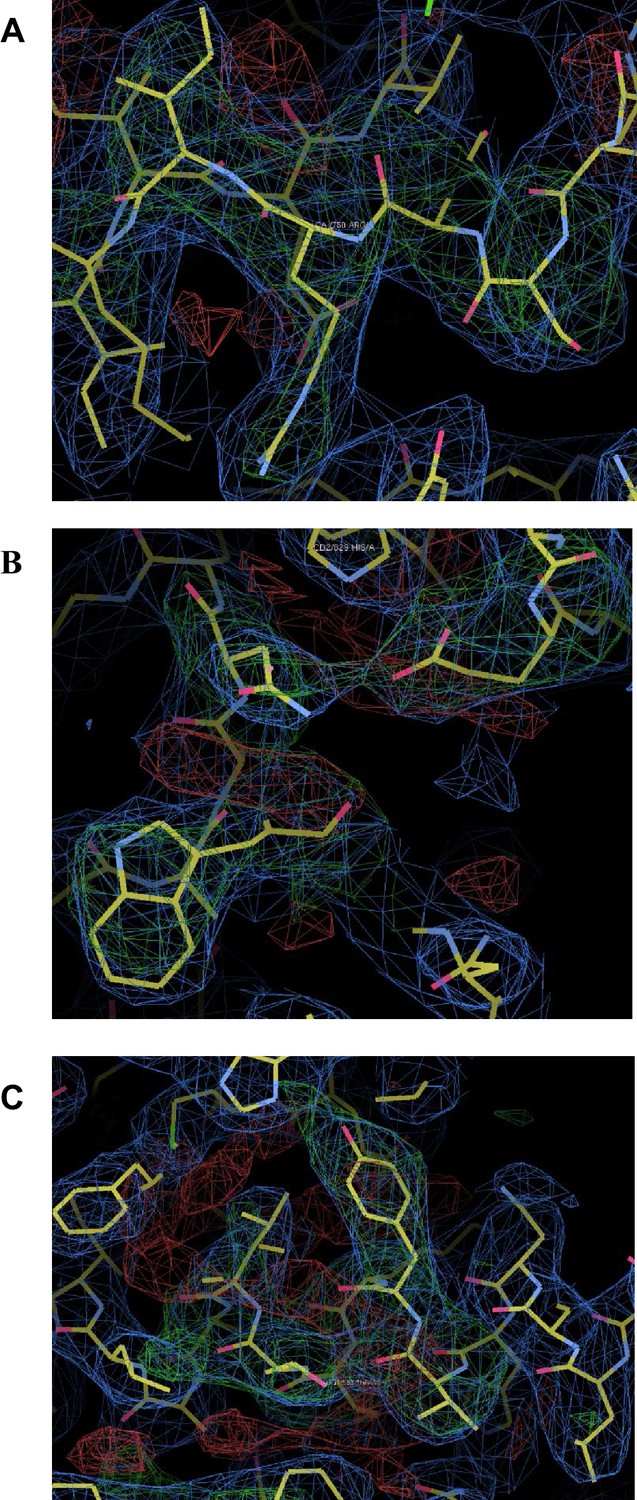
Omit maps for domain interfaces where mutations were made.
(A) Superimposed on the refined coordinates for the C1C2BMUN structure is the omit map (mFo-DFc, green) contoured at the 3σ level. Residues A748-A752 (Ser748, Asp749, Arg750, Ile751, Lys752) were omitted from the C1C2BMUN structure in order to calculate the map. Shown in blue is the 2mFo-DFc map (blue) contoured at the 1σ level. (B) Superimposed on the refined coordinates for the C1C2BMUN structure is the omit map (mFo-DFc, green) contoured at the 3σ level. Residues Trp795, Glu885 and Asn940 of chain A were omitted from the C1C2BMUN structure in order to calculate the map. Shown in blue is the 2mFo-DFc map (blue) contoured at the 1σ level. (C) Superimposed on the refined coordinates for the C1C2BMUN structure is the omit map (mFo-DFc, green) contoured at the 3σ level. Residues Val549, Tyr550, Lys551, Lys552, Thr 553 and Leu554 of chain A were omitted from the C1C2BMUN structure in order to calculate the map. Shown in blue is the 2mFo-DFc map (blue) contoured at the 1σ level.
Figure 2
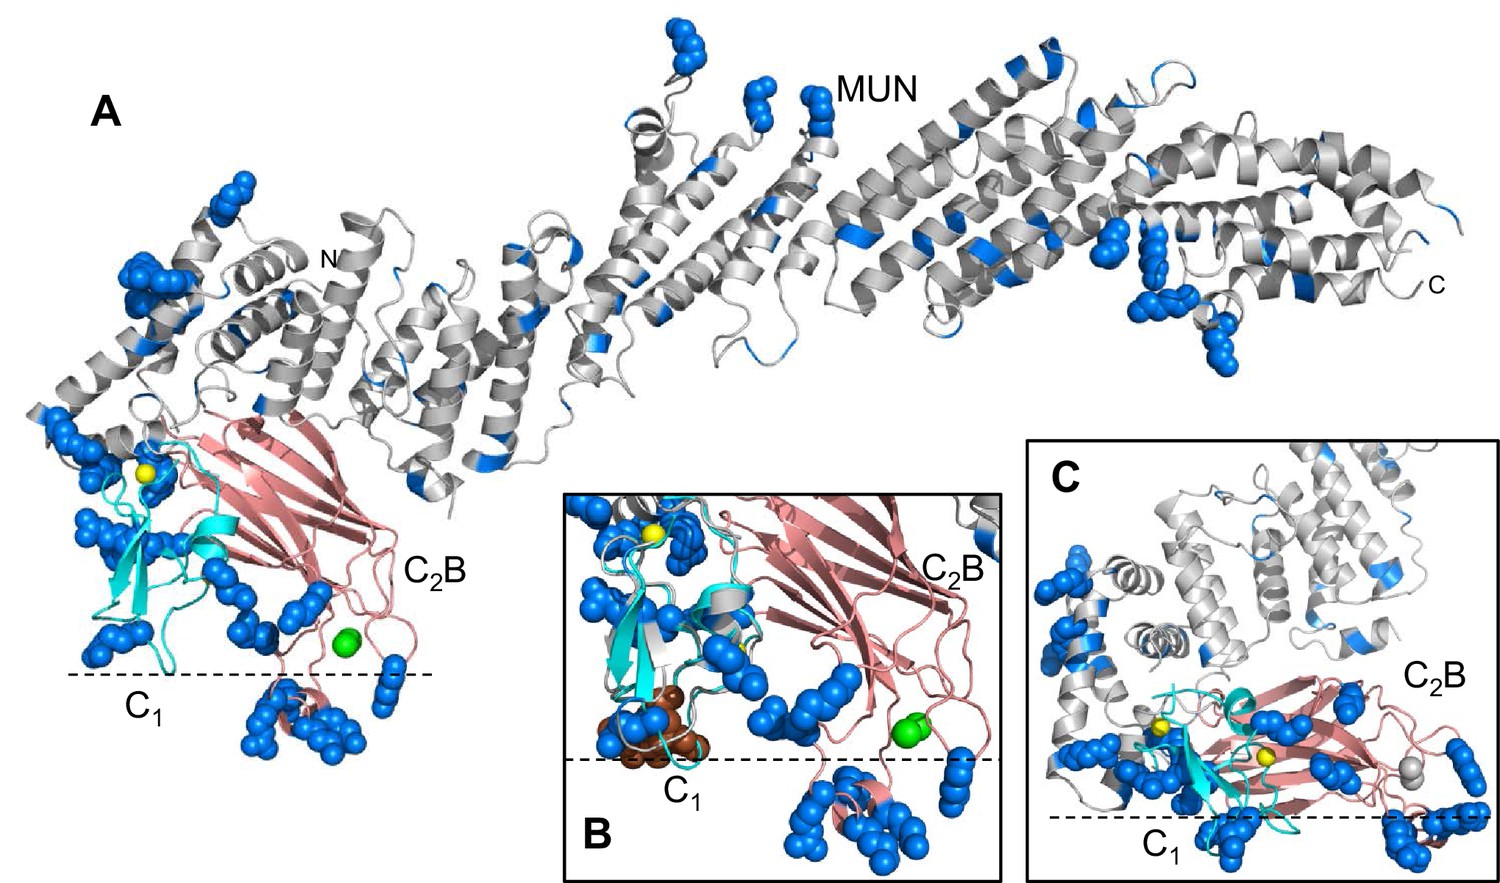
Distribution of basic residues clusters in C1C2BMUN.
(A) Ribbon diagram of C1C2BMUN where the C1 and C2B domains were replaced with the structures of the isolated C1 domain (cyan; PDB code 1Y8F) and the isolated Ca2+-bound C2B domain (salmon; PDB code 3 KWU) (Shin et al., 2010) to include basic residues that are not observed in the structure of C1C2BMUN, likely because they are disordered. Arginine and lysine side chains are shown as blue spheres. The Zn2+ ions in the C1 domain are shown as yellow spheres and two Ca2+ ions bound to the C2B domain are shown as green spheres. Note that the two Ca2+ ions are not observed in the C1C2BMUN structure, which was crystallized in the absence of Ca2+. (B) Close up of the structure of C1C2BMUN as shown in A, but including a phorbol ester drawn as brown spheres. The position of the phorbol ester is based on superimposing the C1 domain of C1C2BMUN with the phorbol-ester bound structure of the PKC-δ C1B domain (PDB code 1PTR) (Zhang et al., 1995). The dashed line indicates the expected approximate location of the plasma membrane bound to the C1 domain through DAG and to the Ca2+-bound C2B domain through PIP2. (C) Close up of the same region of C1C2BMUN but shown in another orientation with a region containing multiple basic side chains (most from the C1 and C2B domains) at the bottom. The Ca2+-binding sites of the C2B domain are shown in gray to symbolize that the sites are not occupied. The dashed line indicates a potential localization of the plasma membrane resulting from binding of this basic face to PS, which is sufficient for binding of C1C2BMUN to liposomes even in the absence of Ca2+, DAG and PIP2 (Liu et al., 2016).
Figure 3 with 1 supplement
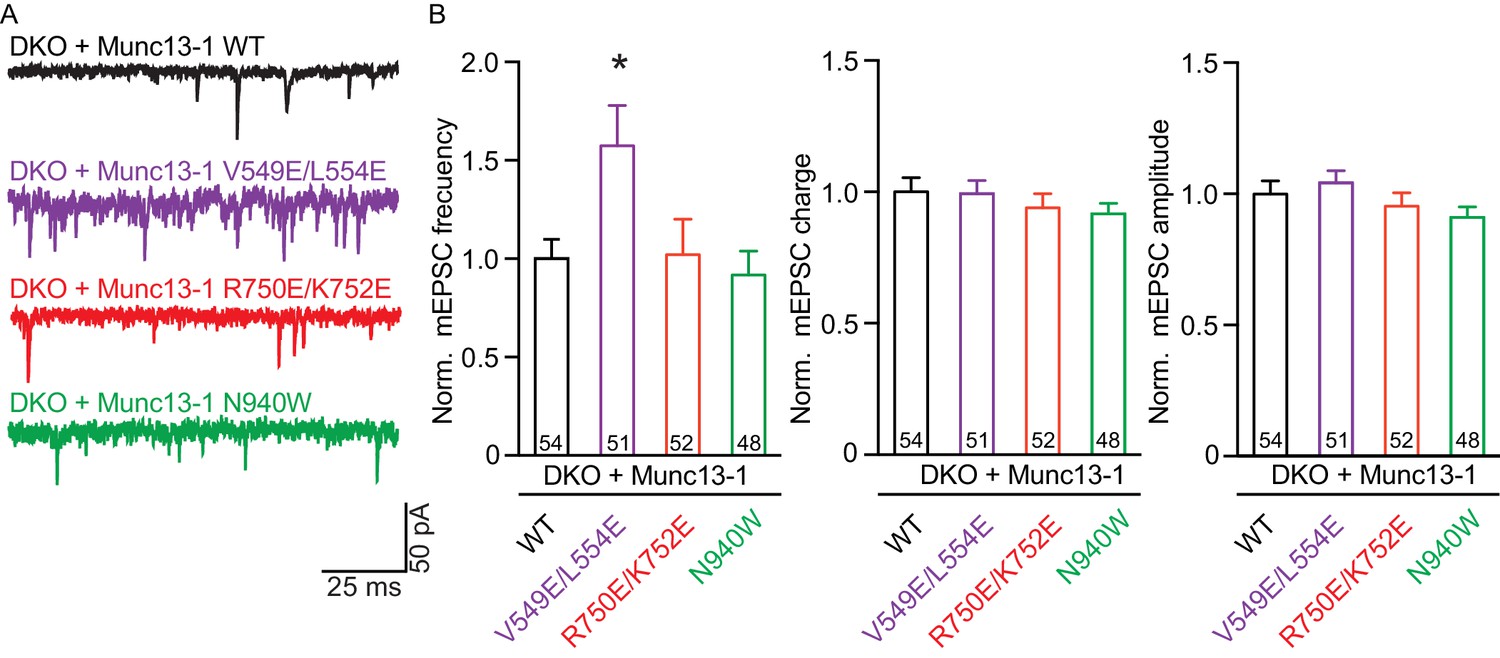
Effect on spontaneous release in synapses expressing Munc13–1 mutants that disrupt the C1C2BMUN domain interfaces.
(A) Representatives traces of spontaneous release on synapses from Munc13-1/2 DKO rescued with the respective Munc13–1 WT and mutants indicated above. (B) Plots of mEPSC frequency, charge and amplitudes of Munc13–1 mutants normalized to corresponding Munc13–1 WT. Numbers in plots are n values for each group. Error bars represent SEM. Significance and p values were determined by comparison with the corresponding WT using the unpaired Student's t test: Mann-Whitney. *p<0.05.
Figure 3—figure supplement 1
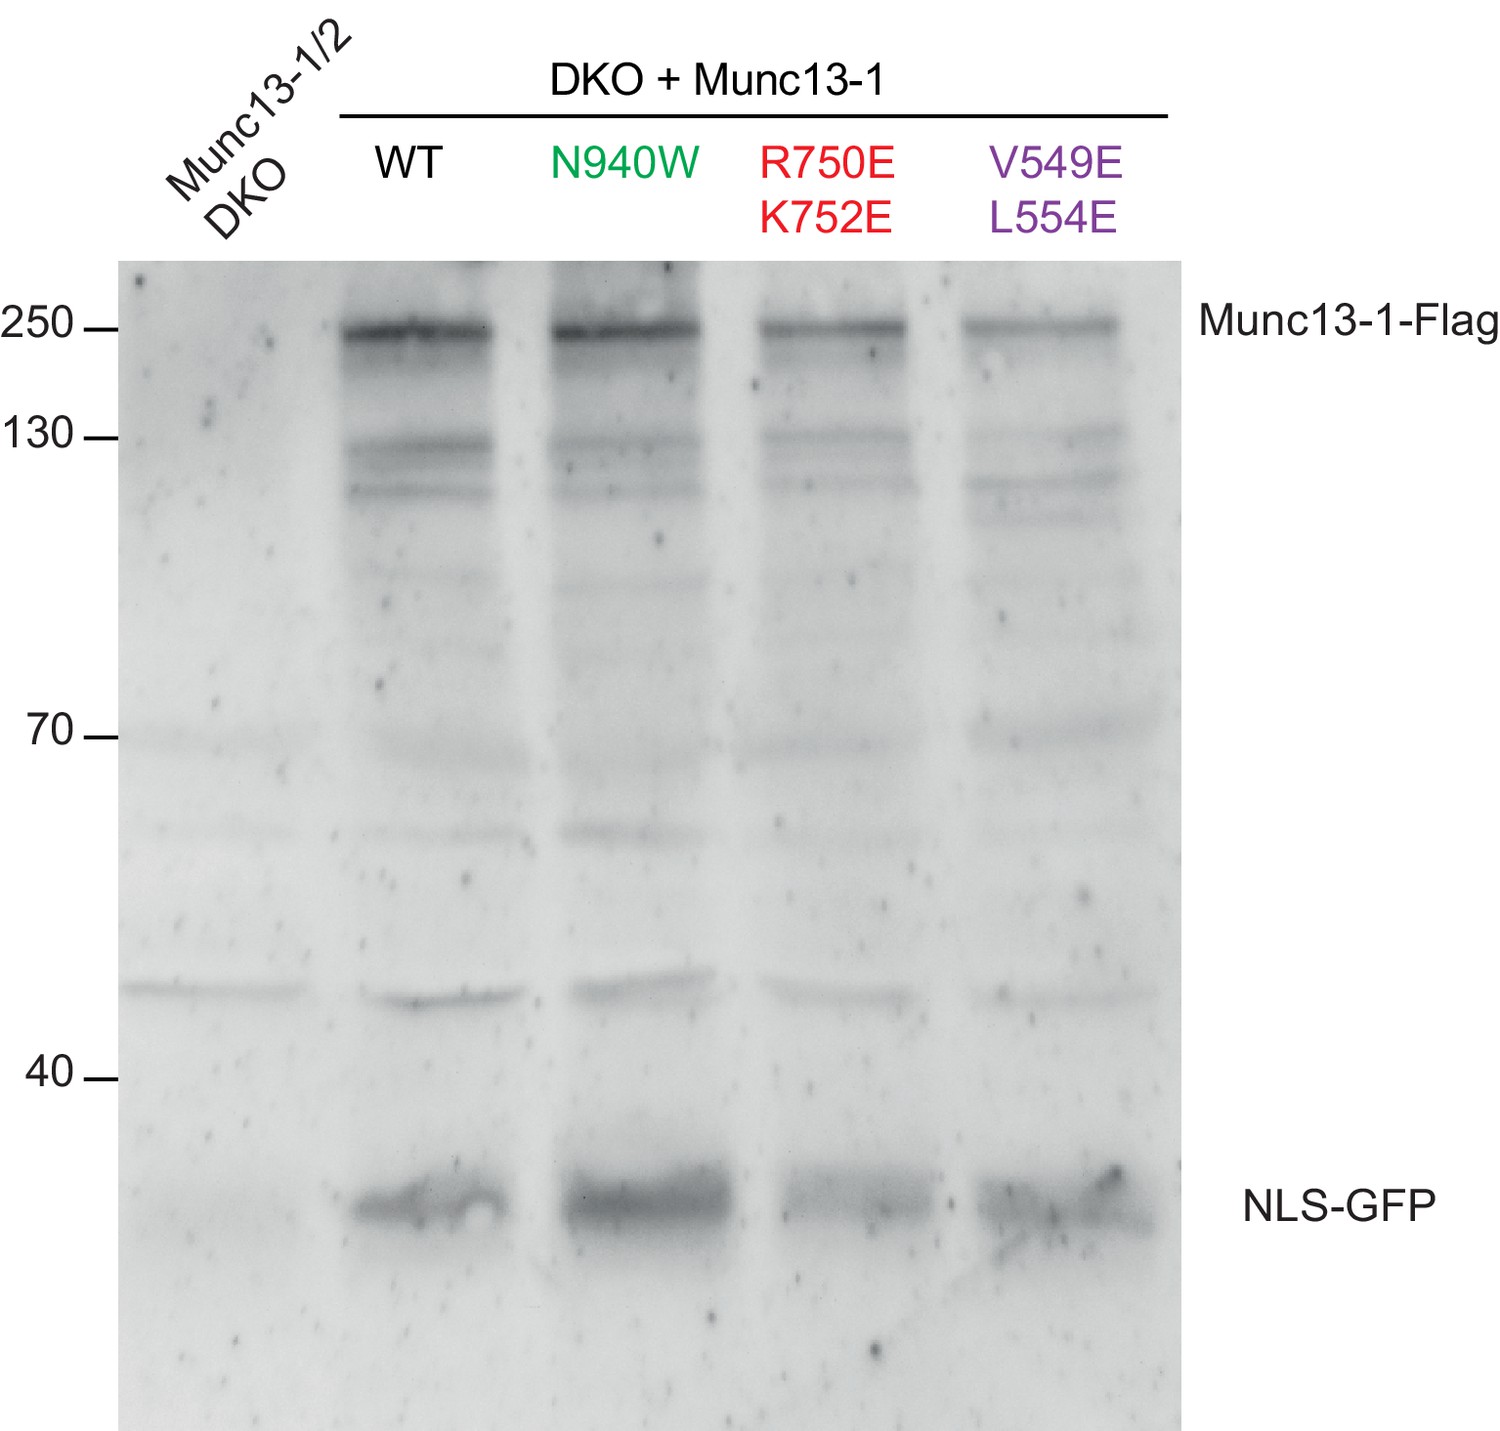
Detection of protein expression from Munc13-1/2 DKO hippocampal neurons.
Sample immunoblot of Munc13-1/2 DKO neurons rescued with Munc13–1 WT or Munc13–1 point mutants indicated in the top. Signal at 250 kDa corresponds to the expected Munc13–1-flag, and the signal at around 30 kDa indicates the cleaved product NLS-GFP. Lane 1 shows the lack of expression of the protein Munc13–1-flag or NLS-GFP in untransfected Munc13-1/2 DKO neurons as a negative control. Lanes 2–5 show the protein expression of all Munc13–1 proteins used. 30 µg of proteins from the lysates were used. Molecular weights (kDa) are indicated on the left side.
Figure 4
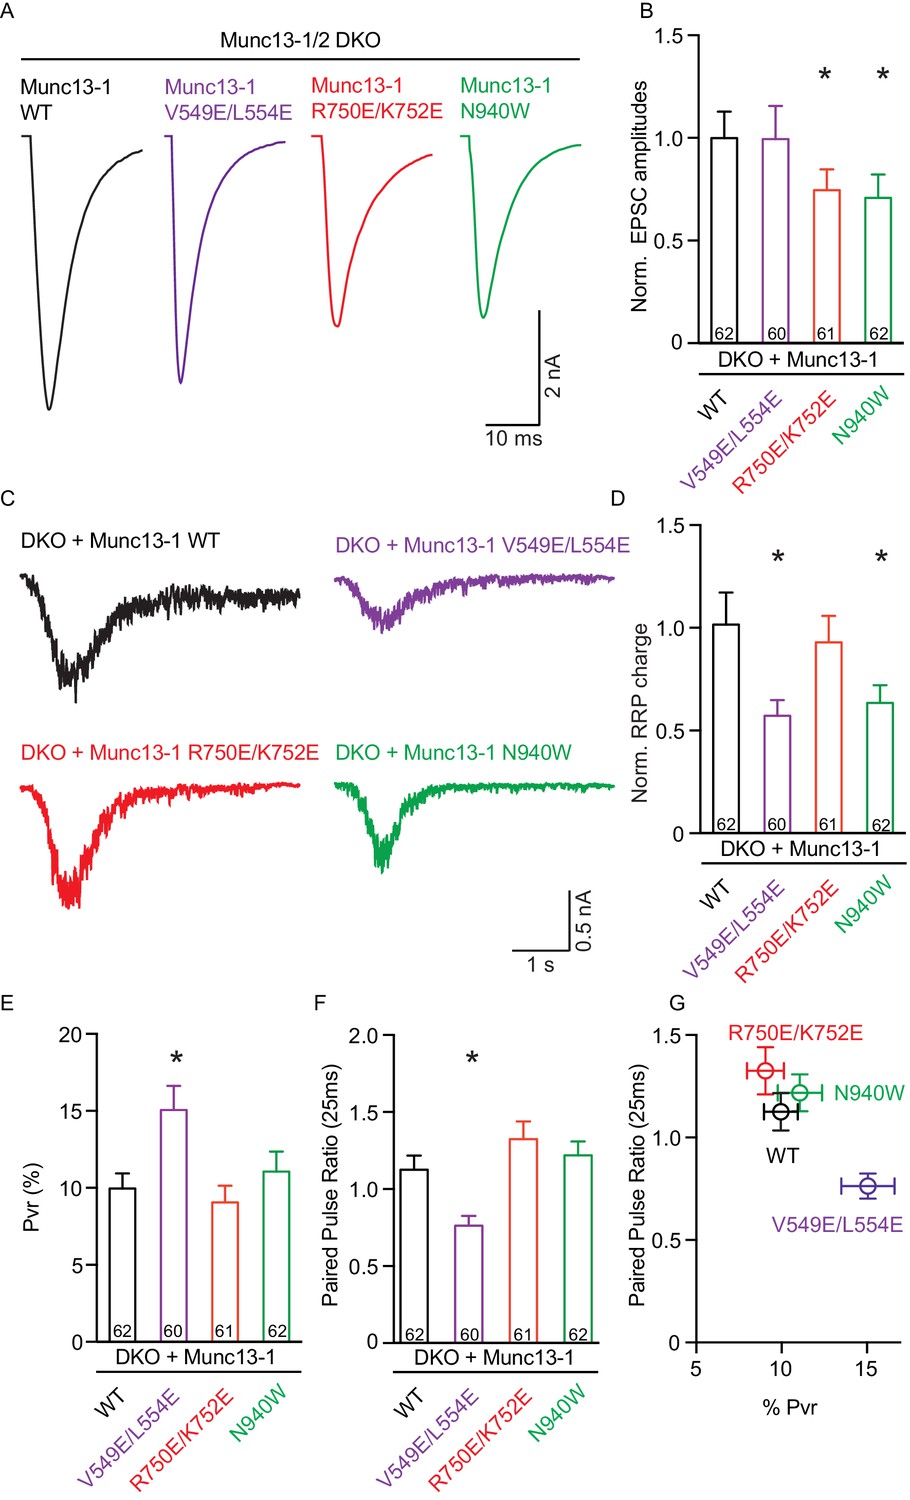
Single action potential evoked synaptic transmission, ready releasable pool and release probability consequences by the disruption of the C1C2BMUN domain interfaces.
(A) Representatives traces of AP-evoked EPSC amplitudes recorded form Munc13-1/2 DKO and DKO neurons rescued with Munc13–1 WT and mutants as indicated above. (B) Plot of AP-evoked EPSC amplitudes of Munc13–1 disrupting C1C2BMUN domain interfaces mutants normalized to corresponding Munc13–1 WT. (C) Representative traces of synaptic responses induced by 500 mM sucrose from Munc13-1/2 DKO neurons rescued with the respective Munc13–1 WT and mutants indicated above. (D) Plot of RRP charge of Munc13–1 mutants normalized to corresponding Munc13–1 WT data. (E) Plot of pvr for WT mutant Munc13–1s. (F) Plot showing the average paired-pulse ratios calculated from 2 AP-evoked EPSC amplitudes with a interstimulus interval of 25 ms. (G) Correlation between pvr and paired-pulse ratios from DKO neurons rescued with Munc13–1 WT and mutants. Numbers in plots are n values for each group. Error bars represent SEM. Significance and p values were determined by comparison with the corresponding WT using the unpaired Student's t test: Mann-Whitney. *p<0.05.
Figure 5
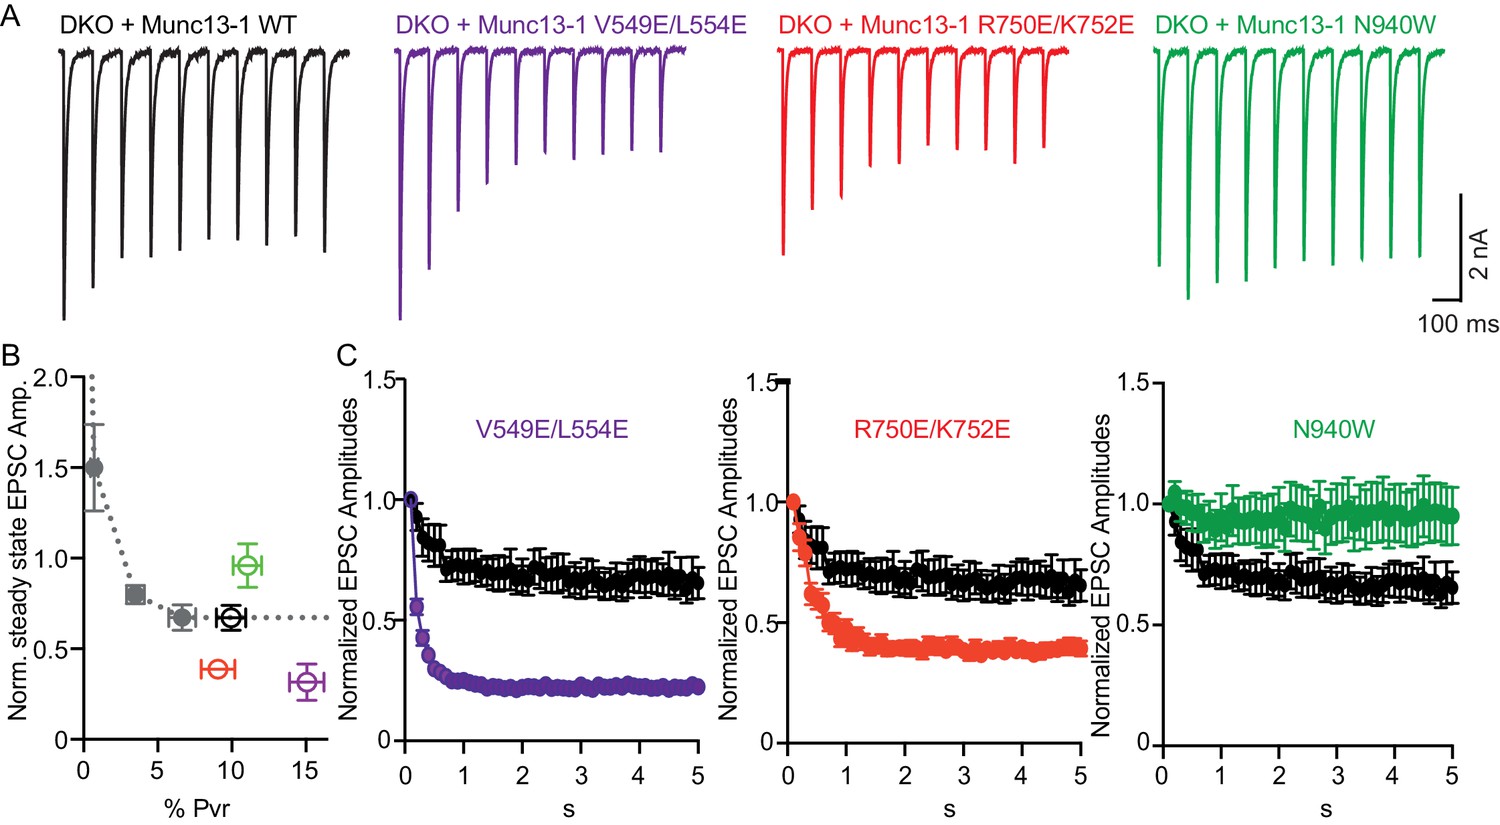
Difference in sustained release during a high-frequency action potential train upon disruption of C1C2BMUN domain interfaces.
(A) Exemplary traces of EPSCs evoked by 10 Hz stimulation trains of Munc13-1/2 DKO neurons rescued with WT and mutant Munc13–1s. (B) Correlation between the amount of steady-state EPSC amplitudes at the end of the 10 Hz train and vesicular release probability. Dotted gray curve provides the correlation of steady-state depression and the release probability by applying AP trains at various external Ca2+ concentrations in WT neurons. (C) Analysis of 50 EPSC amplitudes evoked at 10 Hz, which were normalized to the first EPSCs and plotted over time. WT control (black circles) is identical in all three groups.
Figure 6
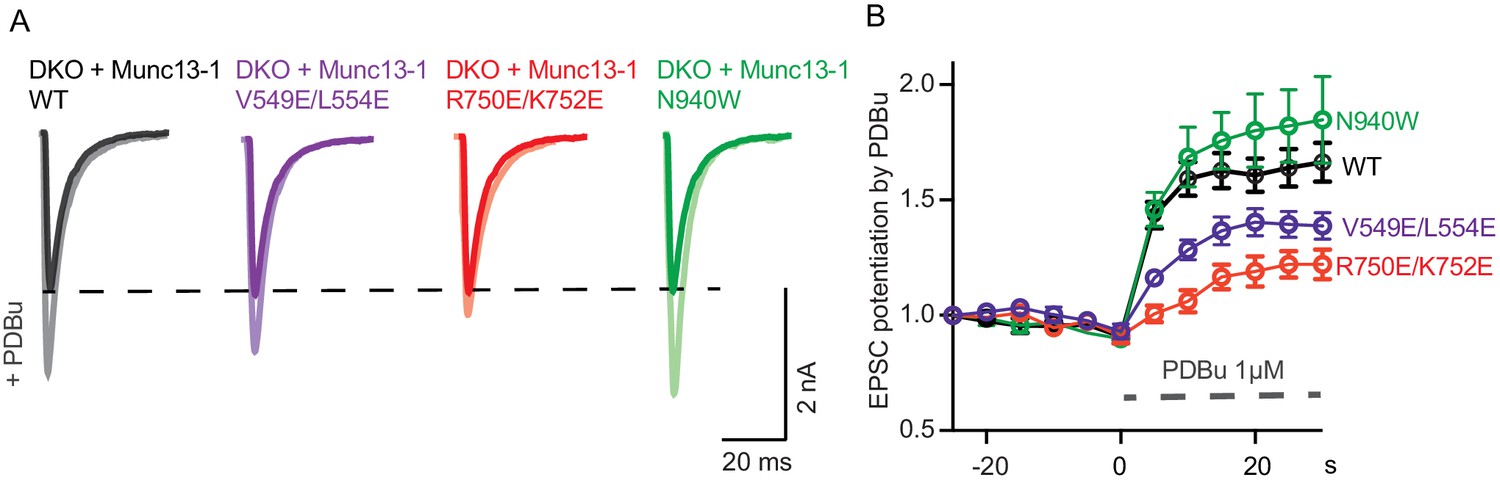
Effect of mutations that disrupt the C1C2BMUN domain interfaces on the potentiation of release caused by the activation of the C1 domain by phorbol ester.
(A) Exemplary EPSC traces (dark colors) from WT and mutant groups and their corresponding EPSCs after PDBu application (light colors). (B) Potentiation of EPSC amplitudes by 1 μM PDBu evoked at 0.2 Hz in Munc13-1/2 DKO neurons expressing WT or mutants. The relative PDBu potentiation was calculated by normalizing the EPSC amplitude in PDBu with the presiding EPSC recorded in control extracellular solution. The solid symbols represent the normalized EPSC values in each time point (± SEM).
Figure 7
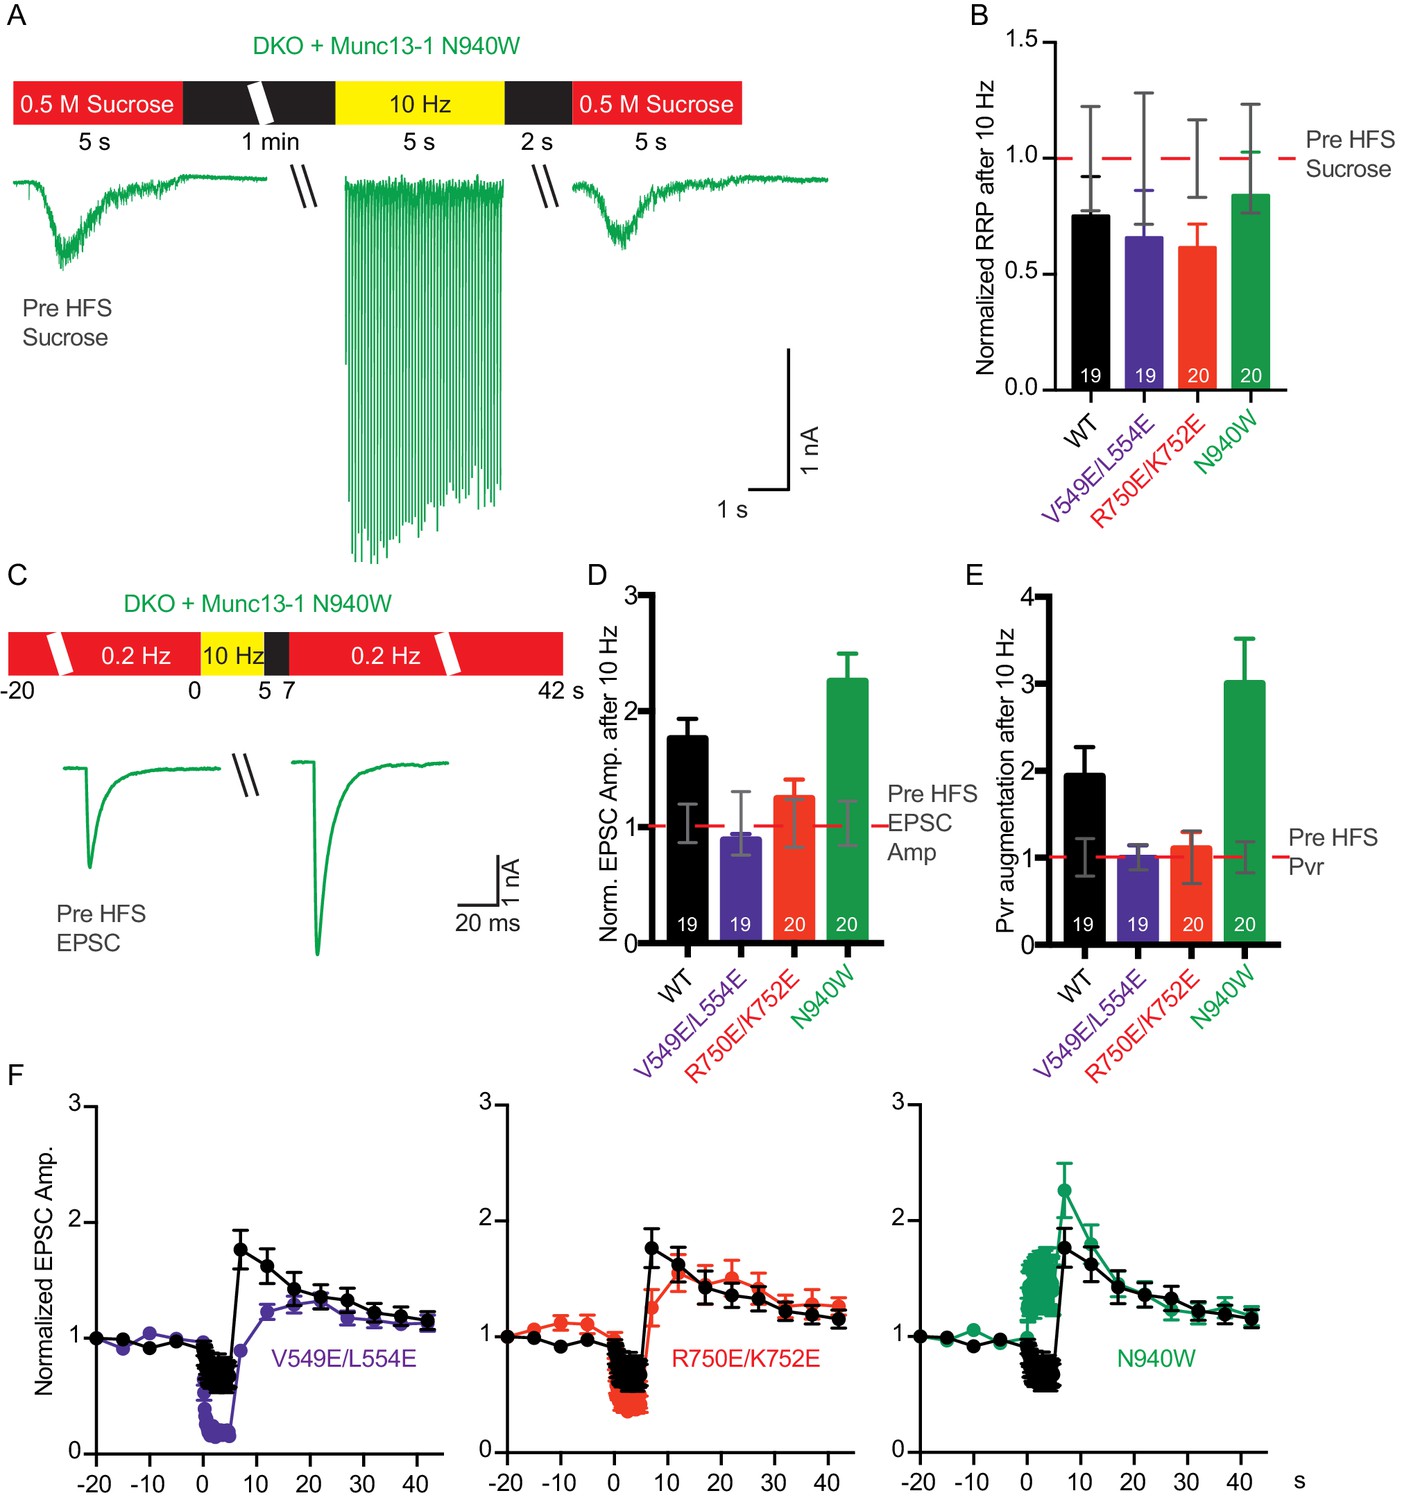
Effect of mutations that disrupt the C1C2BMUN domain interfaces on the potentiation of release caused by high-frequency stimulation.
(A) Schematic diagram illustrating experimental design and example traces of synaptic responses induced by 500 mM sucrose from Munc13-1/2 DKO rescued with Munc13–1 N940W mutant before and after a 10 Hz action potential train. (B) Normalized summary plot of RRP charge of Munc13-1/2 DKO neurons rescued with the respective Munc13–1 WT and mutants indicated below. The RRP charges from the different groups were normalized to corresponding RRP charge recorded 1 min before the 10 Hz train (dashed red line). (C) Schematic diagram illustrating experimental design and example traces of EPSCs from Munc13-1/2 DKO rescued with Munc13–1 N940W mutant before and after a 10 Hz action potential train. (D) Normalized plot of AP-evoked EPSC amplitudes of Munc13-1/2 DKO neurons rescued with the respective Munc13–1 WT and mutants indicated below. The EPSC amplitudes were normalized to the corresponding EPSC recorded before the 10 Hz train (doted red line). (E) Plot of the estimated Pvr of Munc13-1/2 DKO neurons rescued with the respective Munc13–1 WT and mutants indicated below normalized to the corresponding Pvr before high-frequency stimulation (preHFS) (doted red line). (F) Normalized EPSC amplitudes of Munc13-1/2 DKO neurons rescued with the respective Munc13–1 WT and mutants indicated in each graph, in response to a low-frequency stimulus train (0.2 Hz) that is interrupted by a 5 s 10 Hz stimulus train, as outlined in panel (C). Numbers in plots are n values for each group. Error bars represent SEM.
Figure 8 with 3 supplements
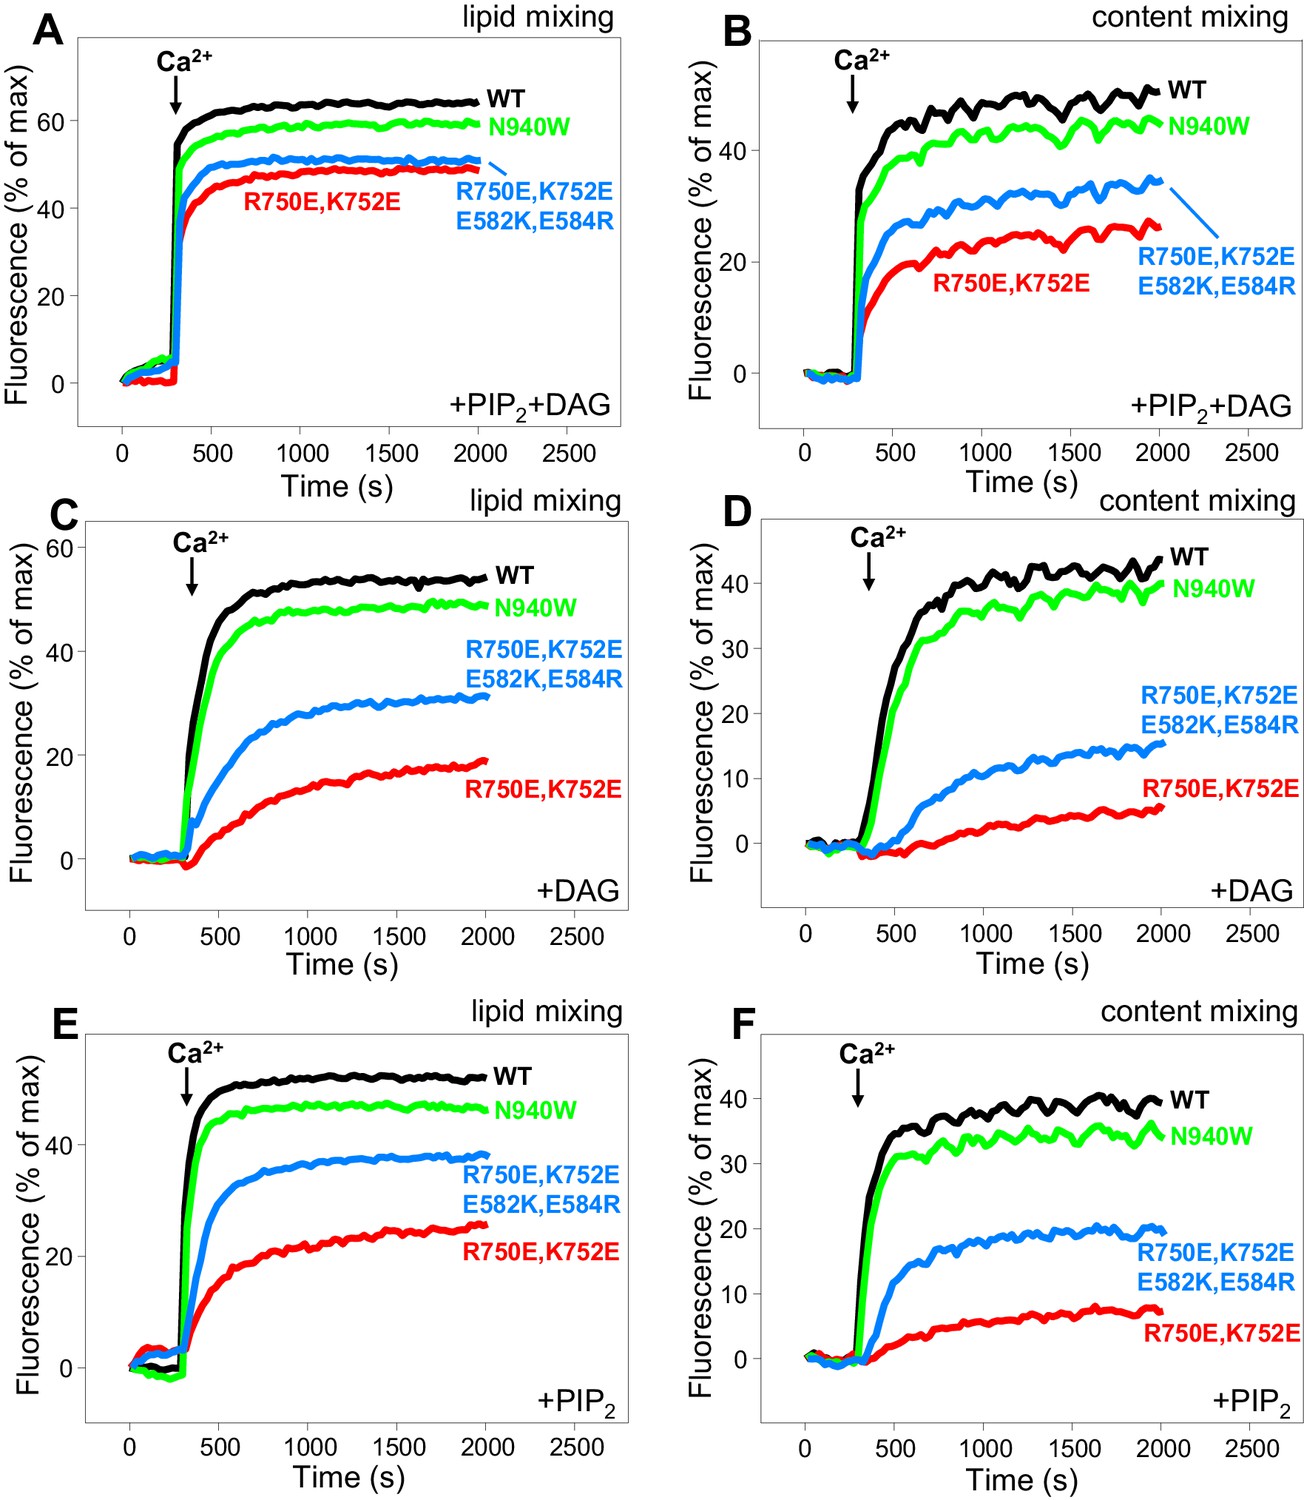
Effects of mutations that disrupt C1C2BMUN interfaces on membrane fusion in reconstitution assays.
Lipid mixing (A,C,E) between V- and T-liposomes was measured from the fluorescence de-quenching of Marina Blue-labeled lipids and content mixing (B,D,F) was monitored from the development of FRET between PhycoE-Biotin trapped in the T-liposomes and Cy5-Streptavidin trapped in the V-liposomes. The assays were performed in the presence of Munc18–1, NSF-αSNAP and WT or mutant Munc13–1 C1C2BMUNC2C fragments as indicated. Experiments were started in the presence of 100 μM EGTA and 5 μM streptavidin, and Ca2+ (600 μM) was added after 300 s.
Figure 8—figure supplement 1

Dependence of liposome fusion on Munc13–1 C1C2BMUNC2C, DAG and PIP2.
Lipid mixing (A) between V- and T-liposomes was measured from the fluorescence de-quenching of Marina Blue-labeled lipids and content mixing (B) was monitored from the development of FRET between PhycoE-Biotin trapped in the T-liposomes and Cy5-Streptavidin trapped in the V-liposomes. The T-liposomes contained DAG and PIP2, or DAG, or PIP2, as indicated. The assays were performed in the presence of Munc18–1, NSF-αSNAP and Munc13–1 C1C2BMUNC2C, except for a control lacking Munc13–1 C1C2BMUNC2C to show its requirement for membrane fusion. Experiments were started in the presence of 100 μM EGTA and 5 μM streptavidin, and Ca2+ (600 μM) was added after 300 s.
Figure 8—figure supplement 2
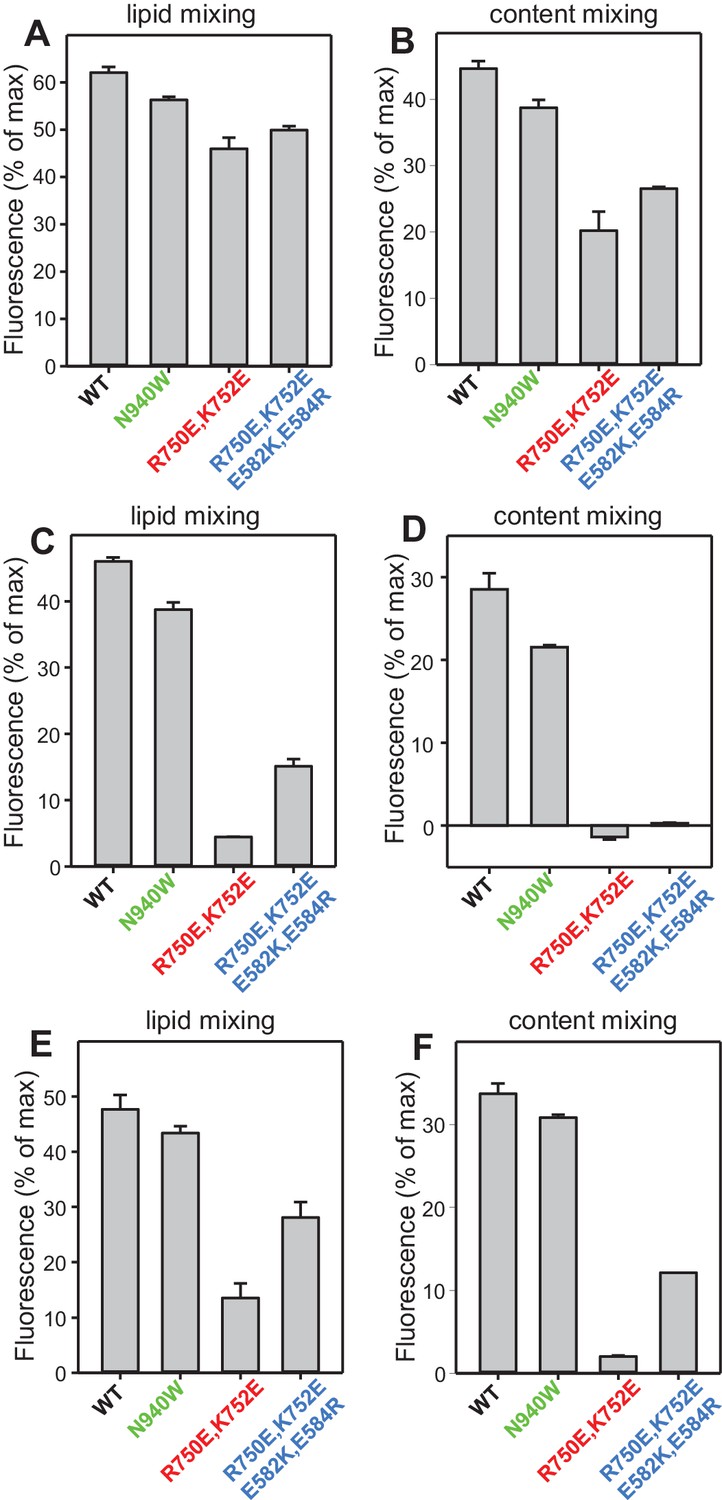
Quantification of the lipid and content mixing experiments of Figure 8.
Panels (A–F) correspond to panels (A–F) of Figure 8, respectively. Bars represent averages of the normalized fluorescence observed after 500 s (200 s after Ca2+ addition) in experiments performed at least in triplicate. Error bars represent standard deviations.
Figure 8—figure supplement 3
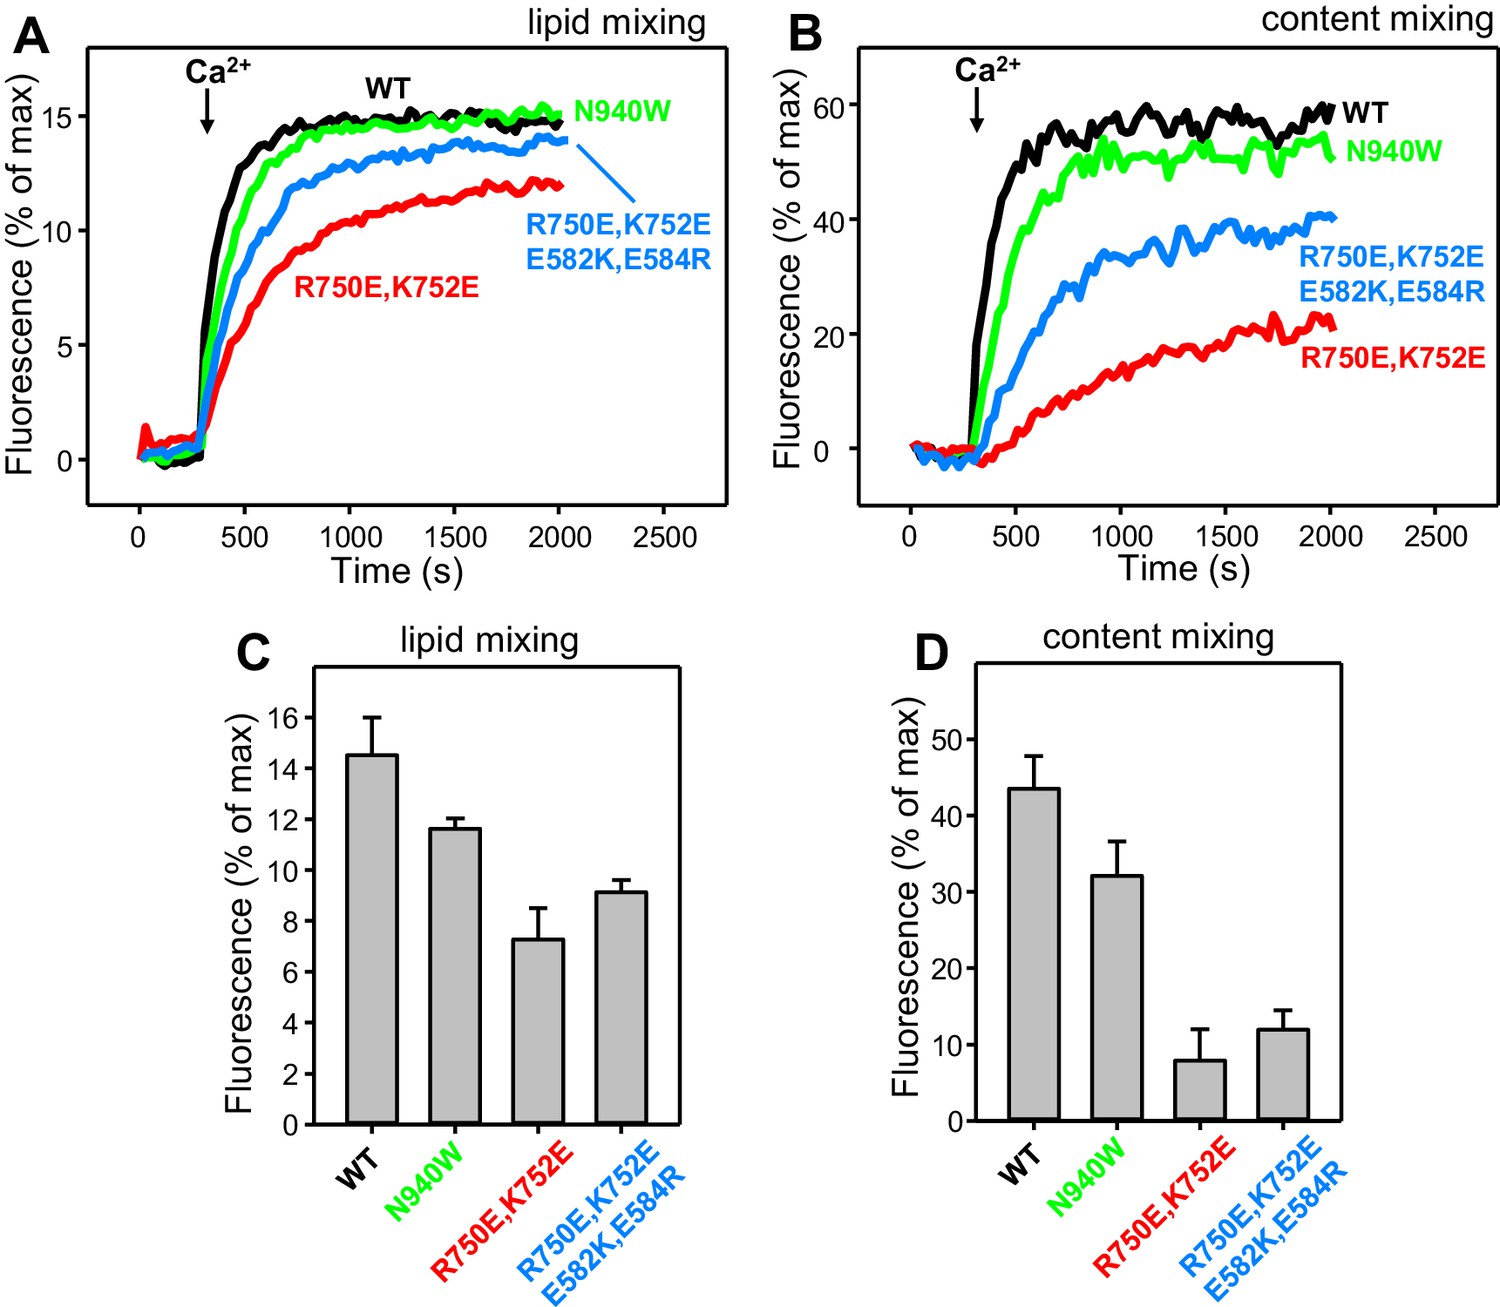
Effects of mutations that disrupt C1C2BMUN interfaces on membrane fusion in reconstitution assays including synaptotagmin-1.
Lipid mixing (A) between V-liposomes containing synaptotagmin-1 and T-liposomes was measured from the fluorescence de-quenching of Marina Blue-labeled lipids and content mixing (B) was monitored from the development of FRET between PhycoE-Biotin trapped in the T-liposomes and Cy5-Streptavidin trapped in the V-liposomes. The assays were performed in the presence of Munc18–1, NSF-αSNAP and WT or mutant Munc13–1 C1C2BMUNC2C fragments as indicated. Experiments were started in the presence of 100 μM EGTA and 5 μM streptavidin, and Ca2+ (600 μM) was added after 300 s. (C–D) Quantification of the lipid and content mixing experiments of panels (A–B). Bars represent averages of the normalized fluorescence observed after 500 s (200 s after Ca2+ addition) in experiments performed at least in triplicate. Error bars represent standard deviations.
Figure 9
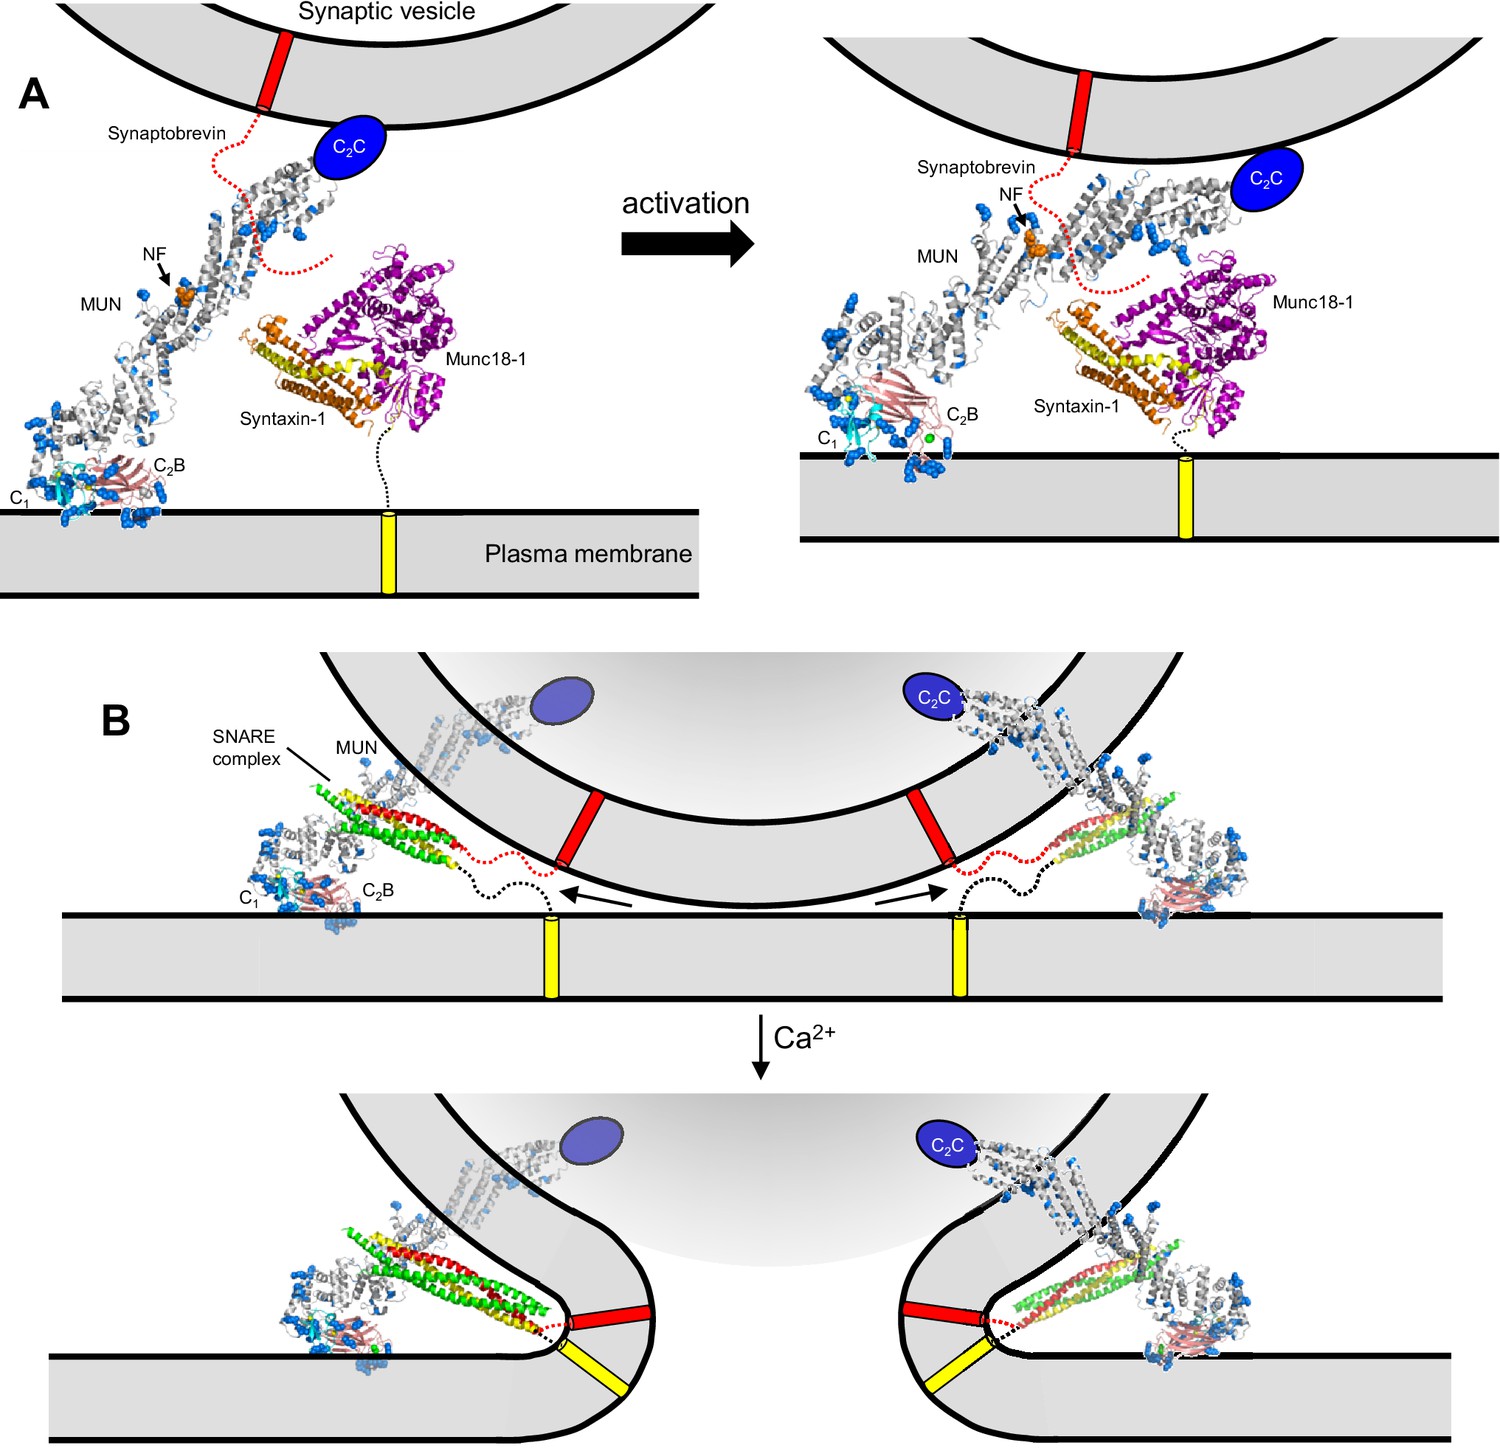
Models of neurotransmitter release inspired by the structure of C1C2BMUN and our functional data.
(A) C1C2BMUNC2C is represented by the structure of C1C2BMUN, with the C2B domain replaced by the structure of the isolated Ca2+-bound C2B domain (colored in salmon), and by a blue ellipse corresponding to the C2C domain. C1C2BMUNC2C is shown bridging the two membranes through interactions of the vesicle membrane with the C2C domain and the plasma membrane with the basic surface formed by the C1 and C2B domains (left panel) or with the DAG-binding region of the C1 domain and the Ca2+-binding region of the C2B domain (right panel) (see Liu et al., 2016). Arginine and lysine side chains are shown as blue spheres. The C1 domain ribbon is in cyan and Zn2+ ions are shown as yellow spheres. The two Ca2+ ions bound to the C2B domain are shown as green spheres on the right; on the left, they are shown as gray spheres to represent that the sites are not occupied. The NF sequence involved in opening syntaxin-1 (Yang et al., 2015) is represented by orange spheres. The closed syntaxin-1-Munc18–1 complex (PDB code 3C98) is shown to scale to allow comparison of its size with that of C1C2BMUN. The C-terminus of the syntaxin-1 SNARE motif and the cytoplasmic region of synaptobrevin are shown as dashed curved lines, and their transmembrane regions are represented by cylinders. B. C1C2BMUNC2C is represented as in A but, instead of being located between the two membranes, is bridging the two membranes from a peripheral location. The model must be visualized in three dimensions, such that the C2C domain is bound to the outer surface of the vesicle membrane rather than inserted into the vesicle lumen. On the right side, the C2C domain is in the front, whereas in the left side the C2C domain is in the back of the vesicle, which is represented by a semitransparent gray surface. In both panels, C1C2BMUNC2C is shown in the orientation proposed for the activated state induced during repetitive stimulation, where binding to the plasma membrane is mediated by the DAG-binding region of the C1 domain and the Ca2+-binding region of the C2B domain. The SNARE complex (PDB code 1N7S) (Ernst and Brunger, 2003), with the SNARE motifs in green for SNAP-25, in red for synaptobrevin and in yellow for syntaxin-1, is shown partially assembled at the top and fully assembled at the bottom. The arrows in the top panel are meant to illustrate that complete assembly of the C-terminus of the SNARE complex might pull the membranes radially outwards, which could create strong membrane tension to trigger membrane fusion. See text for further details.
Author response image 1
Author response image 2

Author response image 3
Author response image 4

Author response image 5
Author response image 6
Author response image 7
Author response image 8
Author response image 9
Author response image 10
Author response image 11
Author response image 12
Author response image 13

Tables
Table 1
Data collection and refinement statistics.
| Data collection | ||||
|---|---|---|---|---|
| Crystal | Ta LIII-edge peak* | Zn K-edge peak* | MUN domain | Native |
| Space group | C2 | C2 | P21212 | C2 |
| Cell constants (Å,°) | 171.70 Å, 82.93 Å, 201.59 Å, 90.0°, 115.32°, 90.0° | 174.72 Å, 84.55 Å, 202.10 Å, 90.0°, 115.11°, 90.0° | 114.1 Å, 270.9 Å, 47.7 Å, 90.0°, 90.0°, 90.0° | 176.13 Å, 86.34 Å, 202.13 Å, 90.0°, 115.54°, 90.0° |
| Wavelength (Å) | 1.25489 | 1.28218 | 0.979 | 0.97931 |
| Resolution range (Å) | 42.73–4.50 (4.64–4.50) | 49.81–4.00 (4.07–4.00) | 39.02–2.90 (2.97–2.90) | 45.60–3.35 (3.41–3.35) |
| Unique reflections | 12,839 (620) | 21,415 (961) | 33,802 (2,770) | 37,636 (1,363) |
| Multiplicity | 3.6 (2.8) | 3.8 (2.5) | 5.4 (5.1) | 3.9 (3.3) |
| Data completeness (%) | 93.1 (64.4) | 94.3 (86.4) | 99.3 (98.7) | 93.9 (68.9) |
| Rmerge (%)† | 3.1 (40.0) | 10.1 (100.0) | 6.9 (63.4) | 5.6 (69.2) |
| Rpim (%)‡ | 1.8 (25.7) | 5.7 (76.5) | NA | 3.1 (38.8) |
| CC1/2 (outermost resolution shell) | 0.974 | 0.490 | NA | 0.809 |
| I/σ(I) | 25.0 (0.8) | 30.0 (2.1) | 27.3 (1.95) | 20.7 (1.3) |
| Wilson B-value (Å2) | 85.4 | 104.7 | ||
| Wilson B-value, sharpened (Å2)§ | 32.6 | 209.2 | NA | 49.6 |
| Refinement statistics | ||||
| Resolution range (Å) | 39.02–2.90 (2.98–2.90) | 45.60–3.35 (3.46–3.35) | ||
| No. of reflections Rwork/Rfree | 33,801/1,712 (2,634/136) | 29,935/1,490 (752/34) | ||
| Data completeness (%) | 99.2 (98.0) | 75.3 (22.0) | ||
| Atoms (non-H protein/Zn2+/Cl−) | 4286/NA/NA | 13,597/4/2 | ||
| Rwork (%) | 22.8 (34.5) | 25.4 (32.7) | ||
| Rfree (%) | 25.3 (35.2) | 29.0 (44.5) | ||
| R.m.s.d. bond length (Å) | 0.002 | 0.003 | ||
| R.m.s.d. bond angle (°) | 0.499 | 0.610 | ||
| Mean B-value (Å2) (chain A/chain B/ Zn2+/Cl−) | 101.6/NA/NA | 78.8/53.2/44.4/8.2 | ||
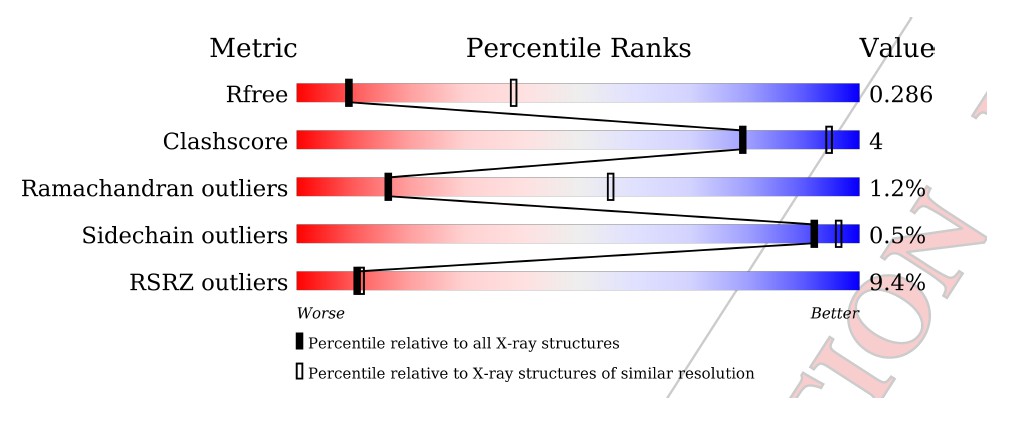
| Ramachandran plot (%) (favored/additional/disallowed)# | 95.3/3.9/0.8 | 92.1/6.7/1.2 | ||
| Clashscore/Overall score# | 2.57/1.37 | 3.51/1.62 | ||
| Maximum likelihood coordinate error | 0.38 | 0.41 | ||
| Missing residues | 933–941, 1041–1049, 1524–1531 | A: 529–540, 704–707, 759–773, 801–807, 821–823, 923–928, 1038–1052, 1191–1196, 1342–1352, 1404–1469, 1518–1531. B: 529–541, 626-630, 703–708, 743–745, 759–774, 802–806, 820–824, 925–929, 1038–1050, 1338–1352, 1405–1467, 1516–1531. | ||
-
Data for the outermost shell are given in parentheses.
-
*Bijvoet-pairs were kept separate for data processing.
-
†, where the outer sum (h) is over the unique reflections and the inner sum (i) is over the set of independent observations of each unique reflection.
-
‡, where nh is the number of observations of reflections h.
-
§B-factor sharpening was performed in the autocorrection mode of HKL-3000 (Borek et al., 2013).
-
#As defined by the validation suite MolProbity (Chen et al., 2010).
Download links
A two-part list of links to download the article, or parts of the article, in various formats.
Downloads (link to download the article as PDF)
Open citations (links to open the citations from this article in various online reference manager services)
Cite this article (links to download the citations from this article in formats compatible with various reference manager tools)
Mechanistic insights into neurotransmitter release and presynaptic plasticity from the crystal structure of Munc13-1 C1C2BMUN
eLife 6:e22567.
https://doi.org/10.7554/eLife.22567


