Requirement of myomaker-mediated stem cell fusion for skeletal muscle hypertrophy
- Cincinnati Children’s Hospital Medical Center, United States
Figures
Figure 1 with 1 supplement
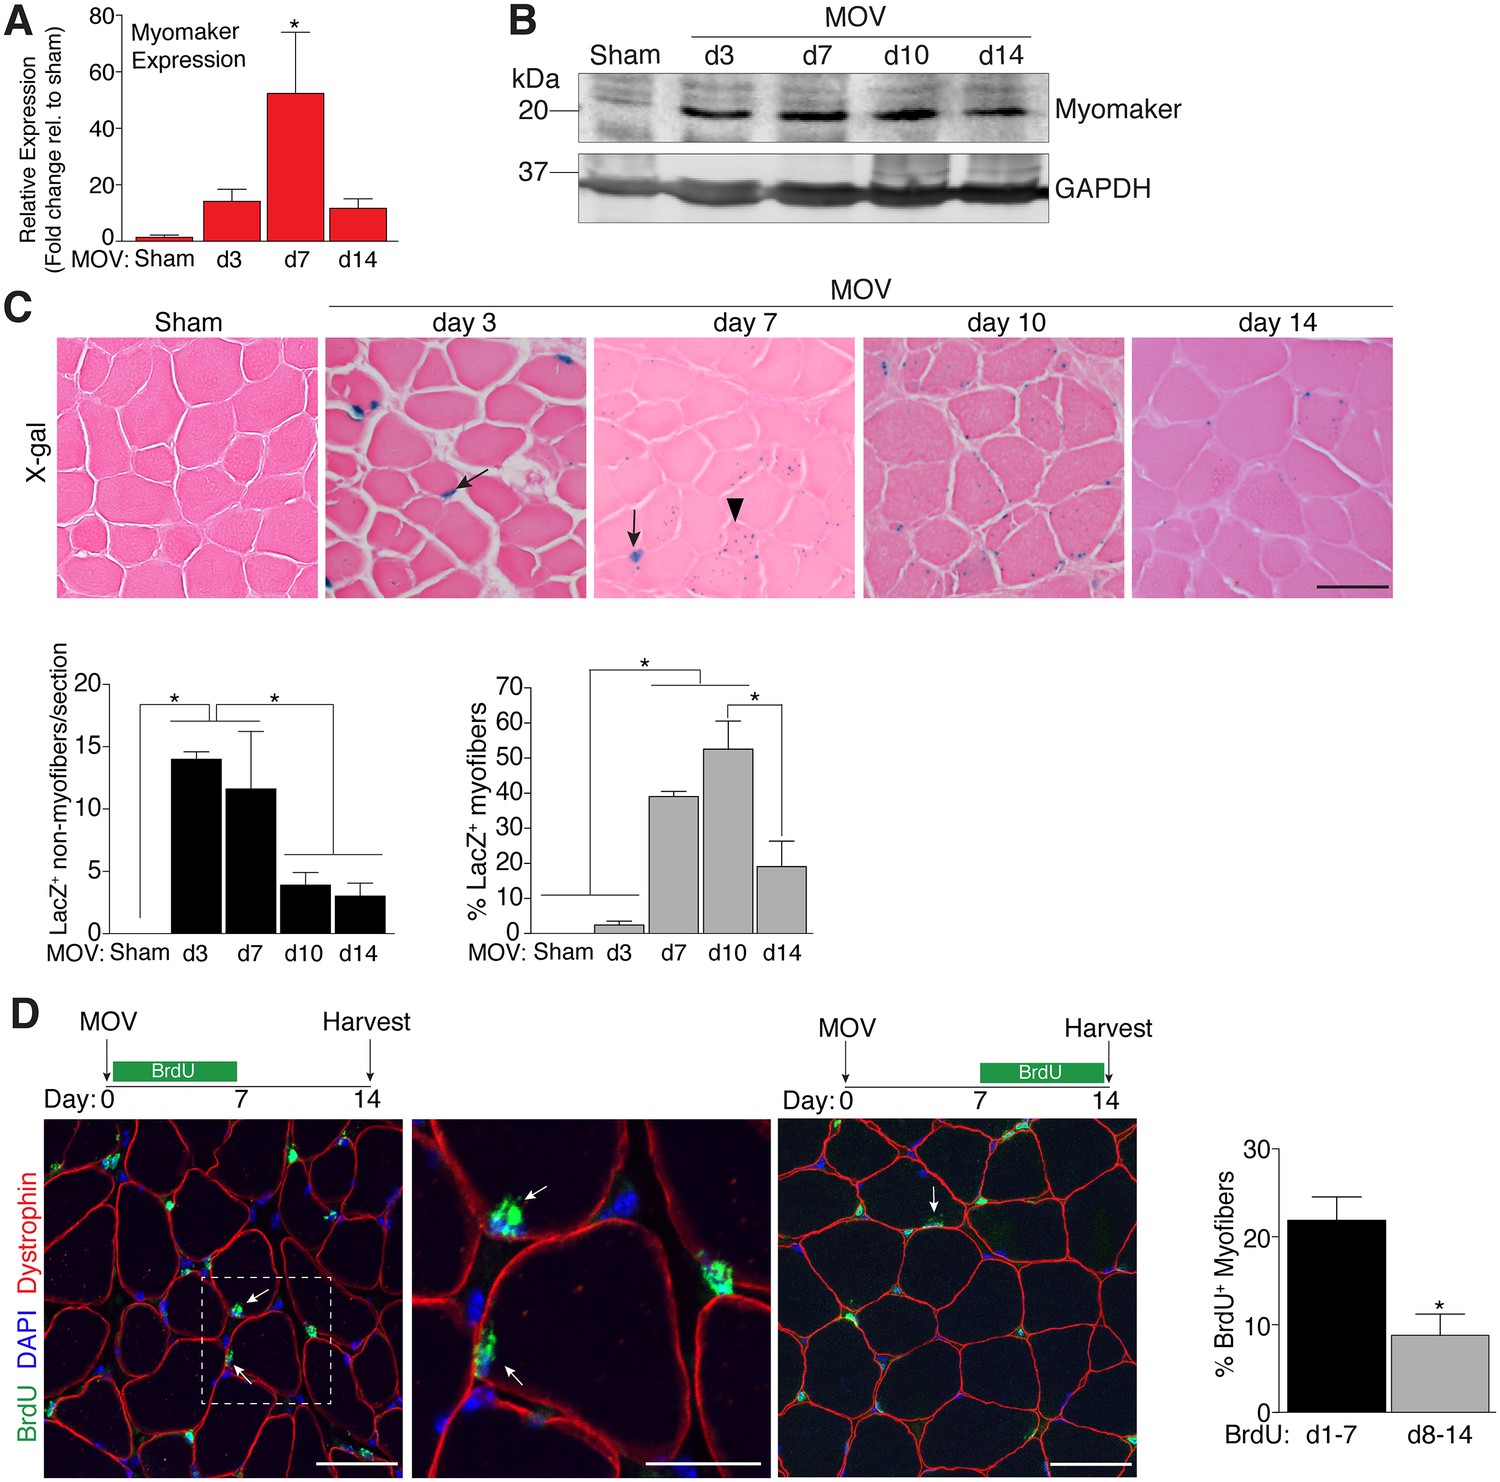
Regulation of myomaker activation and fusion during load-induced hypertrophy.
Myomaker expression at various time points after MOV was assessed by qPCR (A), and western blot analysis (B), showing induction of myomaker at all stages of MOV (n = 2–4 mice). (C) Tmem8cLacZ/+ mice were subjected to MOV and plantaris sections were X-gal stained at multiple time points after surgery. LacZ, a surrogate for myomaker expression, was observed in MPs (arrows) during the early stages of MOV, and in myofibers (arrowheads) in the later stages of MOV. Quantification of the number of LacZ+ non-myofibers indicates myomaker is robustly activated in MPs at day 3 and day 7 of MOV but the number is reduced at day 10 and day 14 (n = 3–5 mice). Quantification of LacZ+ myofibers demonstrates the majority of expression occurs at day 7 and day 10 after MOV (n = 2500–4,100 myofibers from 3–5 independent mice). (D) Fusion of MPs with myofibers was assessed by labeling proliferating cells with BrdU and tracking their incorporation into a myofiber, identified by immunostaining with a dystrophin antibody. Mice were subjected to MOV and treated with BrdU during the initial 7 days or the last 7 days after MOV. Fusion was scored as a BrdU+ nucleus within a dystrophin+ myofiber as depicted by the arrows. Quantification of the percentage of myofibers containing a BrdU+ nucleus shows an increased labeling of fusion competent satellite cells during the first 7 days of MOV, which correlates with the highest expression of myomaker in satellite cells (n = 380–1,511 myofibers from 3–9 independent mice). Data are represented as mean ± SEM, *p<0.05. Scale bars: 50 μm, except inset in (D) which represents 25 μm.
Figure 1—figure supplement 1
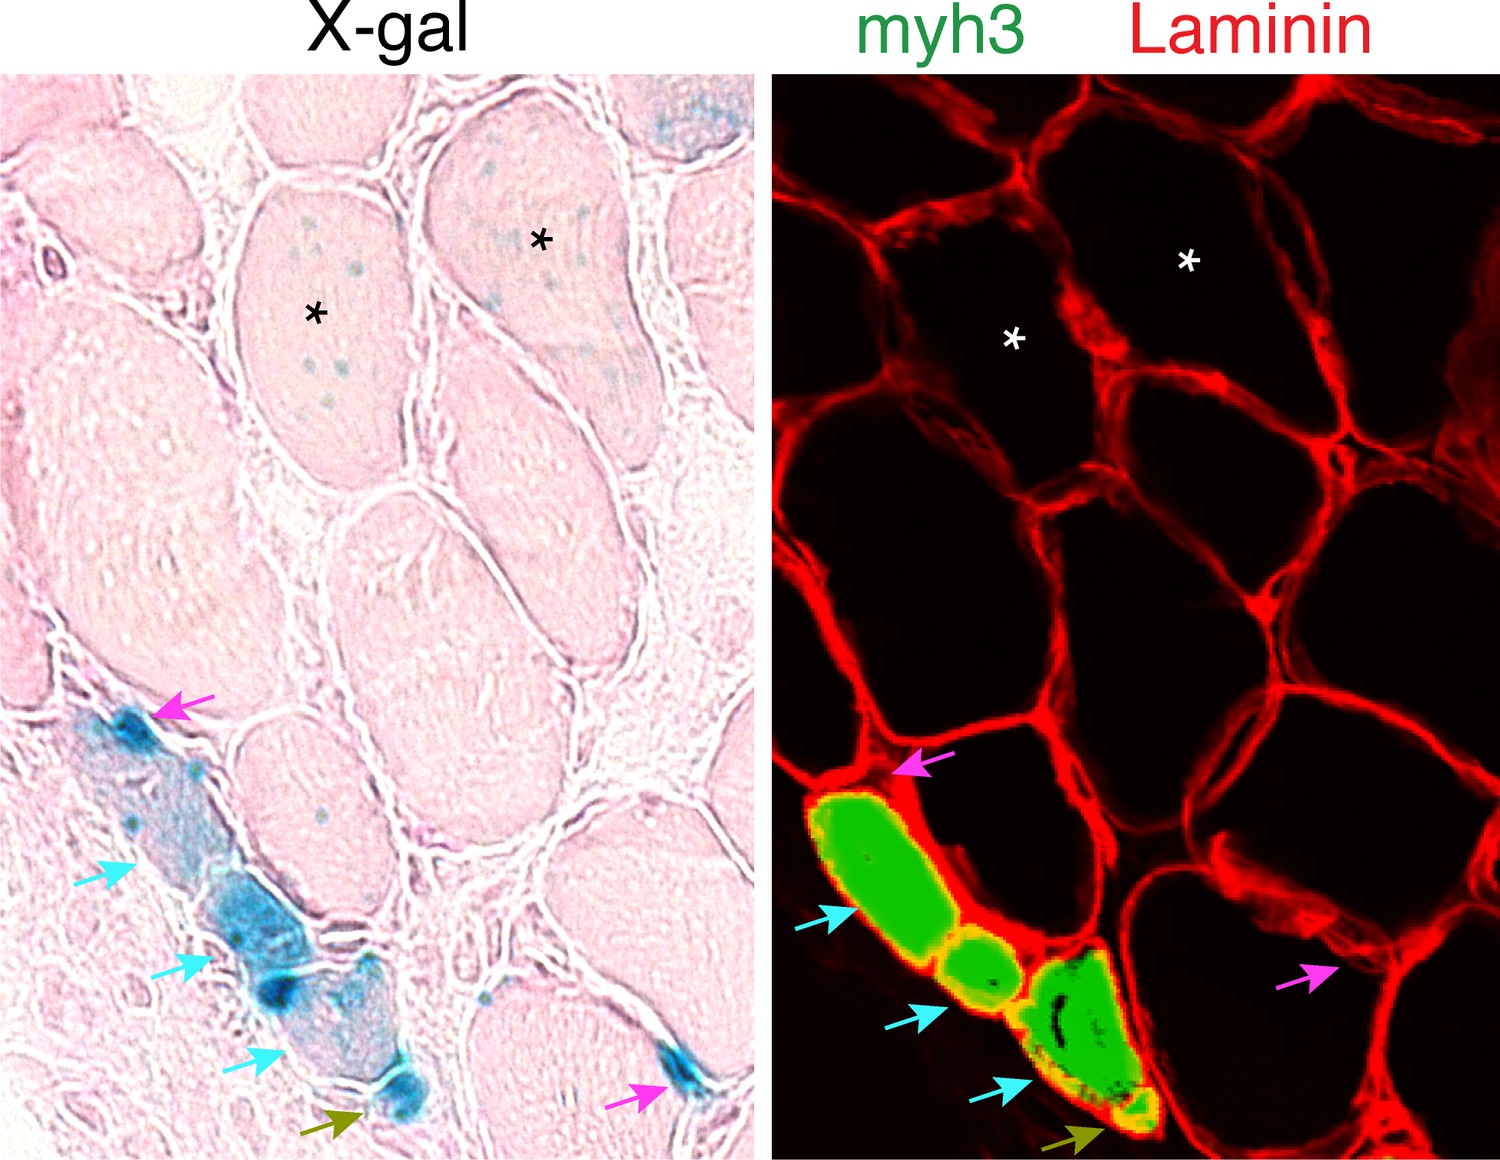
Day 7 MOV serial sections were stained with x-gal or immunostained with laminin and embryonic myosin (myh3) antibodies.
Two populations of LacZ+ myofibers were observed. One exhibited punctate x-gal and was myh3- (stars) thus representing existing fibers that have fused with a MP. The second myofiber population exhibited stronger x-gal staining and was myh3+ (blue arrows) and these represent de novo myofibers. We also observed two different populations of small cells exhibiting x-gal staining, which we classify as non-myofiber. The first population was LacZ+ myh3+ (green arrows) which indicate differentiated myocytes, whereas LacZ+ myh3- (magenta arrows) depict myogenic progenitors.
Figure 2 with 3 supplements
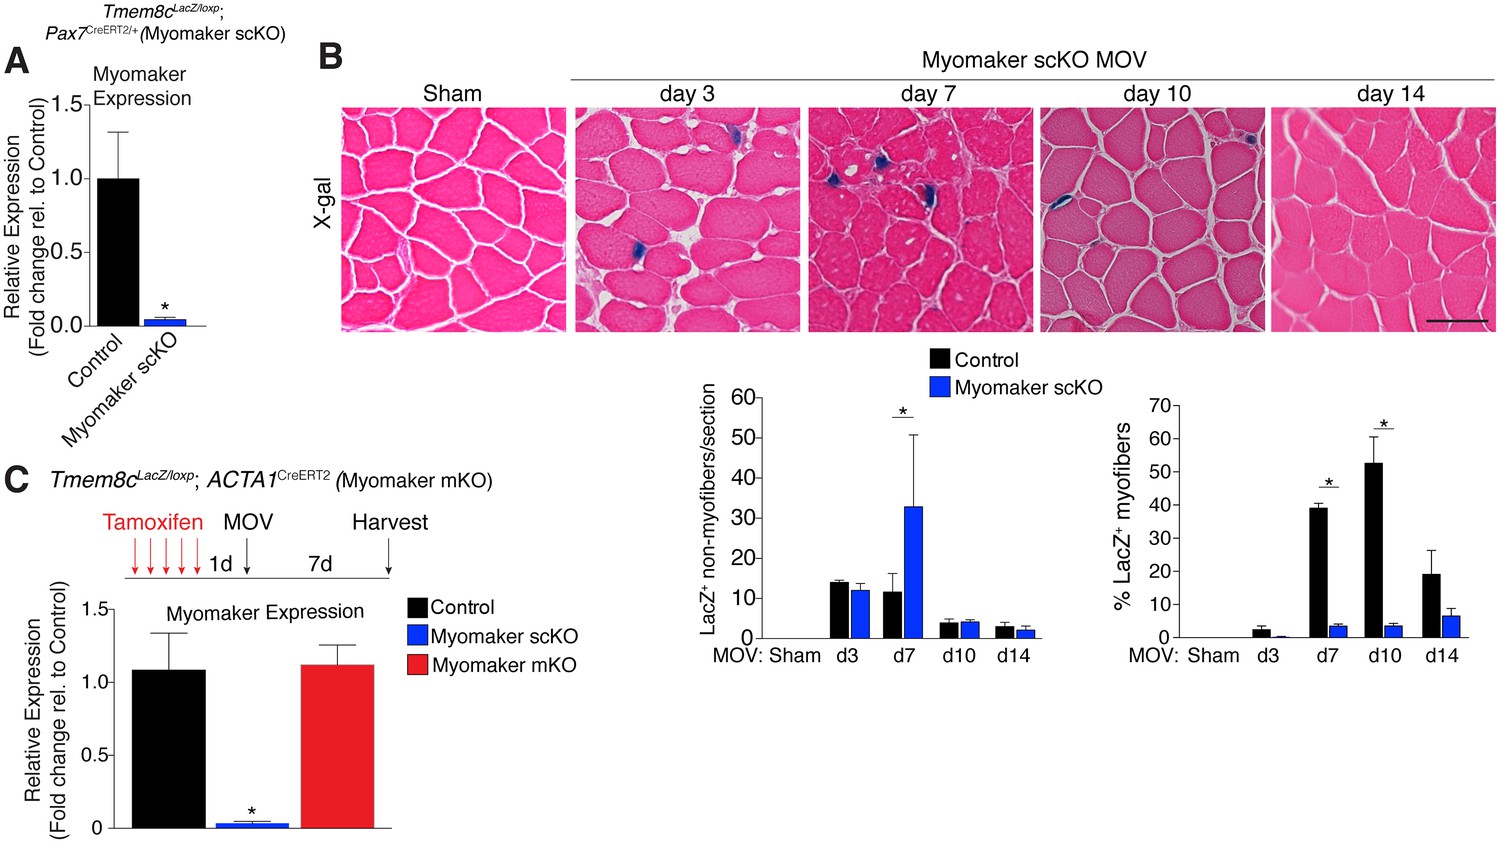
Myomaker is mainly expressed in MPs and not myofibers during MOV.
(A) Tmem8cLacZ/loxP; Pax7CreERT2/+ mice (myomaker scKO) were treated with tamoxifen to ablate myomaker specifically in SCs. Control mice include vehicle-treated Tmem8cLacZ/loxP; Pax7CreERT2/+ mice and tamoxifen-treated Tmem8c+/+; Pax7CreERT2/+ mice. Mice were subjected to MOV and myomaker expression was assessed through qPCR analysis 7 days post-surgery showing that myomaker was efficiently deleted in myomaker scKO muscle (n = 3–4 independent mice). (B) To determine the origin of LacZ staining observed in control myofibers (Figure 1C), MOV was performed on myomaker scKO mice and sections were X-gal stained. Ablation of myomaker in SCs results in restriction of myomaker expression to MPs and lack of expression in the myofiber. Quantification of LacZ+ non-myofibers shows a significant increase at day 7 in myomaker scKO mice compared to control mice because myomaker scKO are fusion defective and thus remain outside the myofiber (n = 3–5 mice). The percentage of LacZ+ myofibers are reduced in myomakerscKO mice suggesting that myofiber LacZ is acquired through fusion of MPs (n = 2500–4,100 myofibers from 3–5 independent mice). In the quantification of (B), the control bars are from Figure 1C. (C) To genetically assess the requirement of myofiber-derived myomaker, tamoxifen was administered to Tmem8cLacZ/loxP; ACTA1CreERT2 mice (myomaker mKO) prior to MOV. qPCR analysis of myomaker in control, myomaker scKO, and myomaker mKO mice after MOV shows that myomaker is only reduced in myomaker scKO mice, demonstrating that myomaker is not transcribed from a myofiber nucleus (n = 3–4 mice). Data are represented as mean ± SEM, *p<0.05. Scale bar: 50 μm.
Figure 2—figure supplement 1
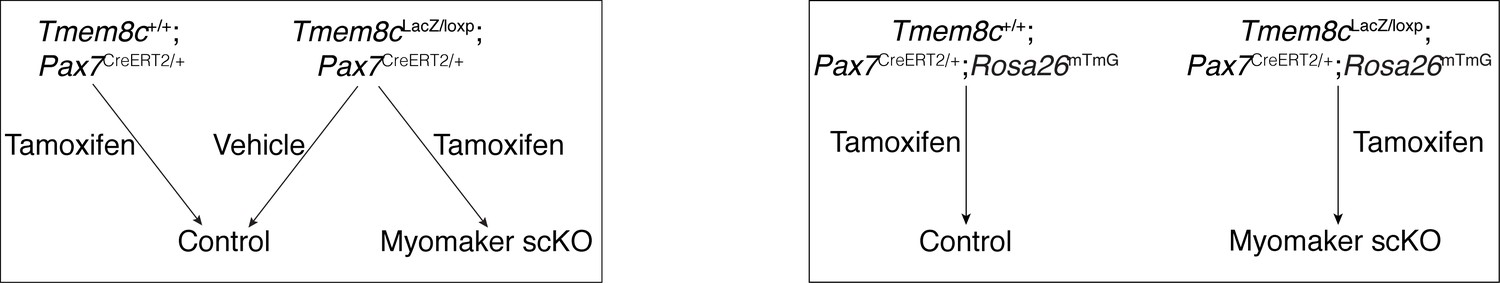
Schematic showing the mice used to ablate myomaker in satellite cells, and their associated control groups.
https://doi.org/10.7554/eLife.20007.006
Figure 2—figure supplement 2
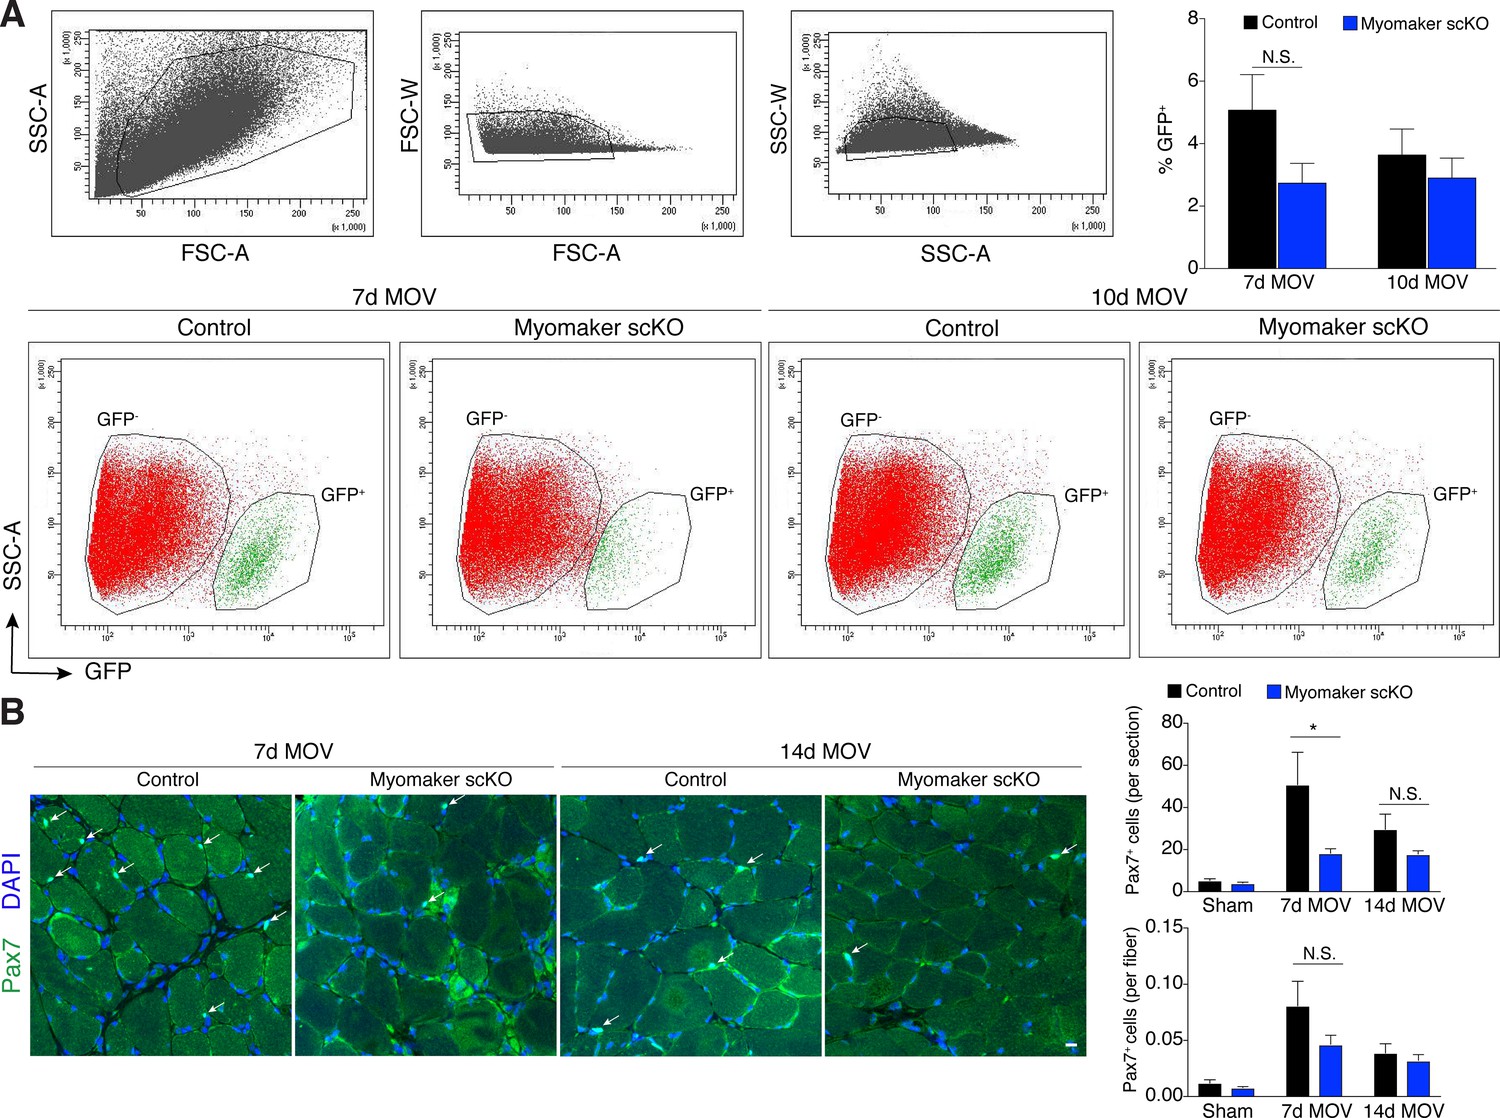
Myogenic progenitors are maintained in myomaker scKO muscle during MOV.
(A) Flow cytometry for mGFP+ progenitors in tamoxifen-treated Pax7CreERT2/+; RosamTmG (control) and Tmem8cLacZ/loxP; Pax7CreERT2/+; RosamTmG mice (myomaker scKO) reveals a distinct GFP- (red) and GFP+ (green) population of cells 7 and 10 days after MOV. Top panels reveal gating strategy derived from forward and side scatter plots. Plots shown are representative from one experiment. Quantitative analysis confirms similar levels of mGFP+ cells between control and myomaker scKO muscles at 7 and 10d of MOV (n = 3 for each group), indicating that myogenic progenitors are present after satellite cell ablation of myomaker. (B) Representative images of Pax7+ nuclei in plantaris sections further reveal that satellite cells are present in fusion-incompetent muscles throughout two weeks of MOV. Quantification revealed a significant difference 7 days after MOV when Pax7+ cells are analyzed per section but not when normalized to fiber number (n = 4–6). Data are represented as mean ± SEM, *p<0.05. Scale bar: 10 μm.
Figure 2—figure supplement 3
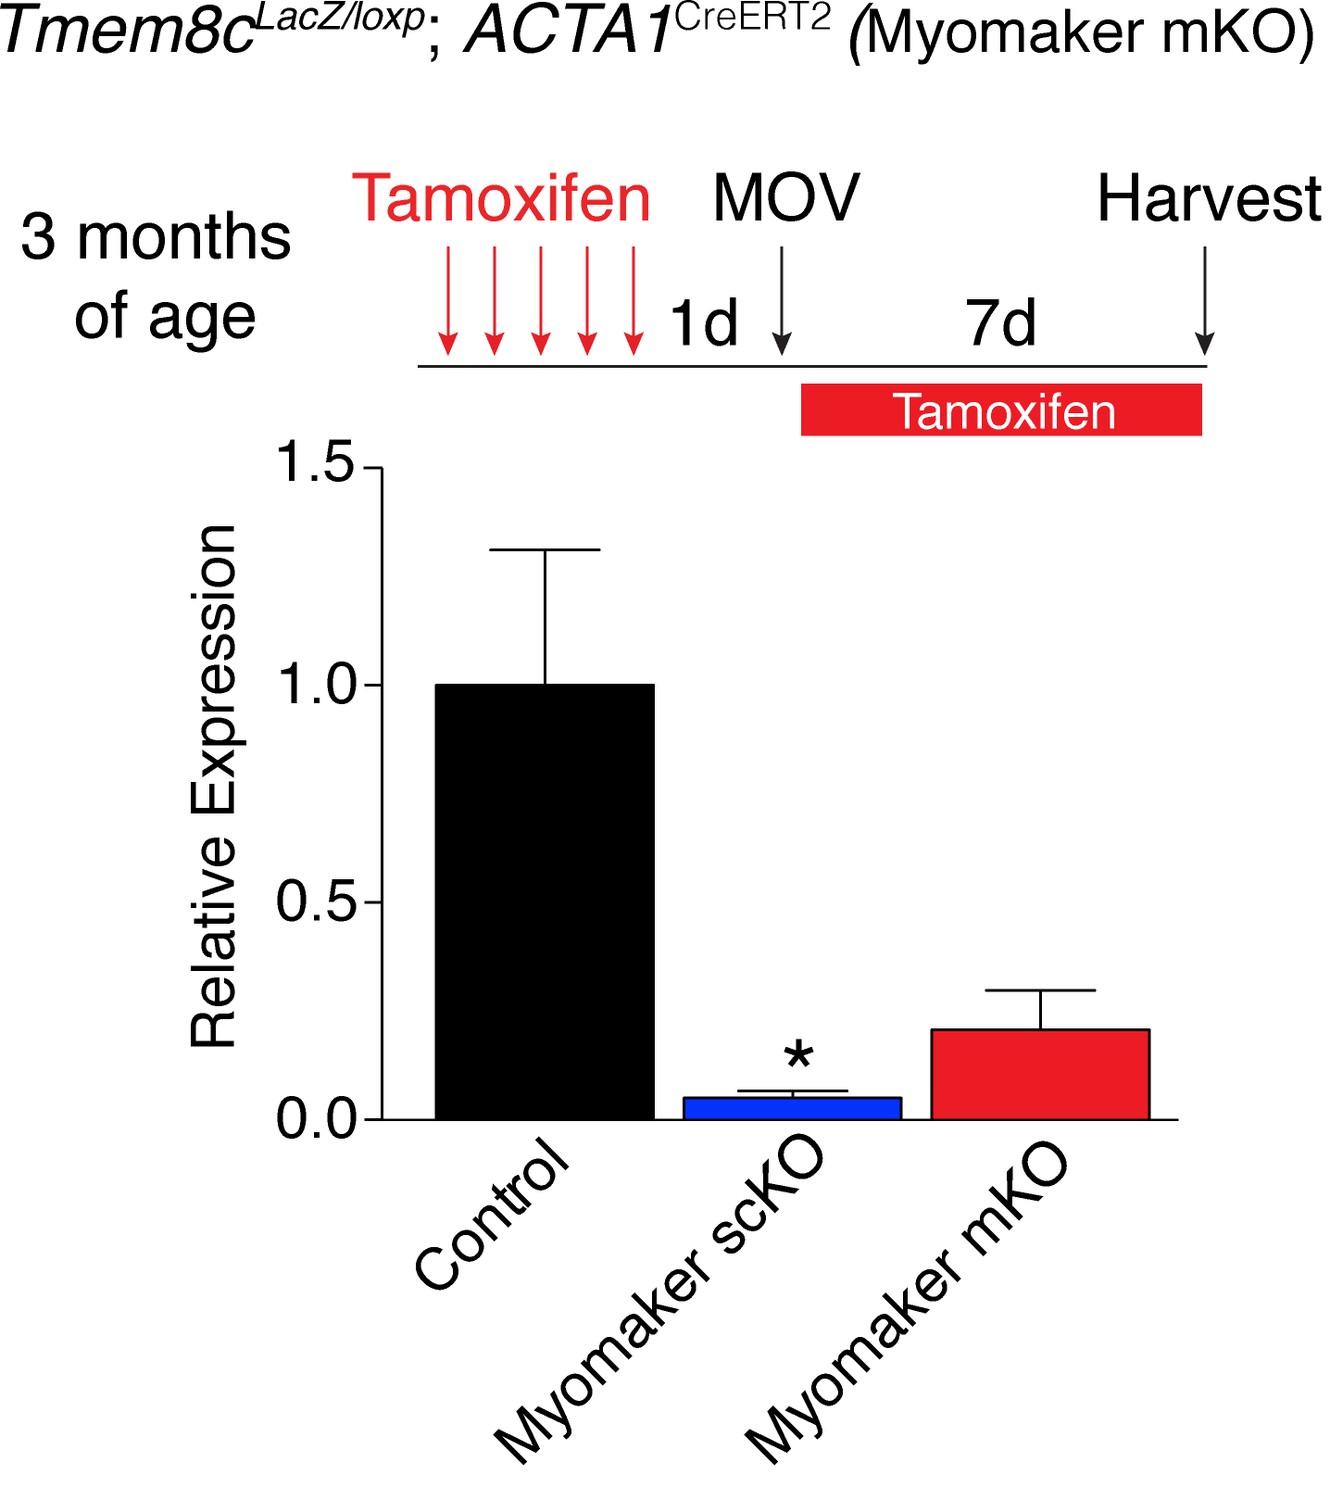
Myomaker expression is reduced in myomaker mKO mice when tamoxifen is present concominant with satellite cell activation suggesting ACTA1CreERT2 is active in myoblasts prior to fusion (n = 3–4 mice).
These data indicate the ACTA1CreERT2 transgene is functional. Data are represented as mean ± SEM, *p<0.05.
Figure 3 with 1 supplement
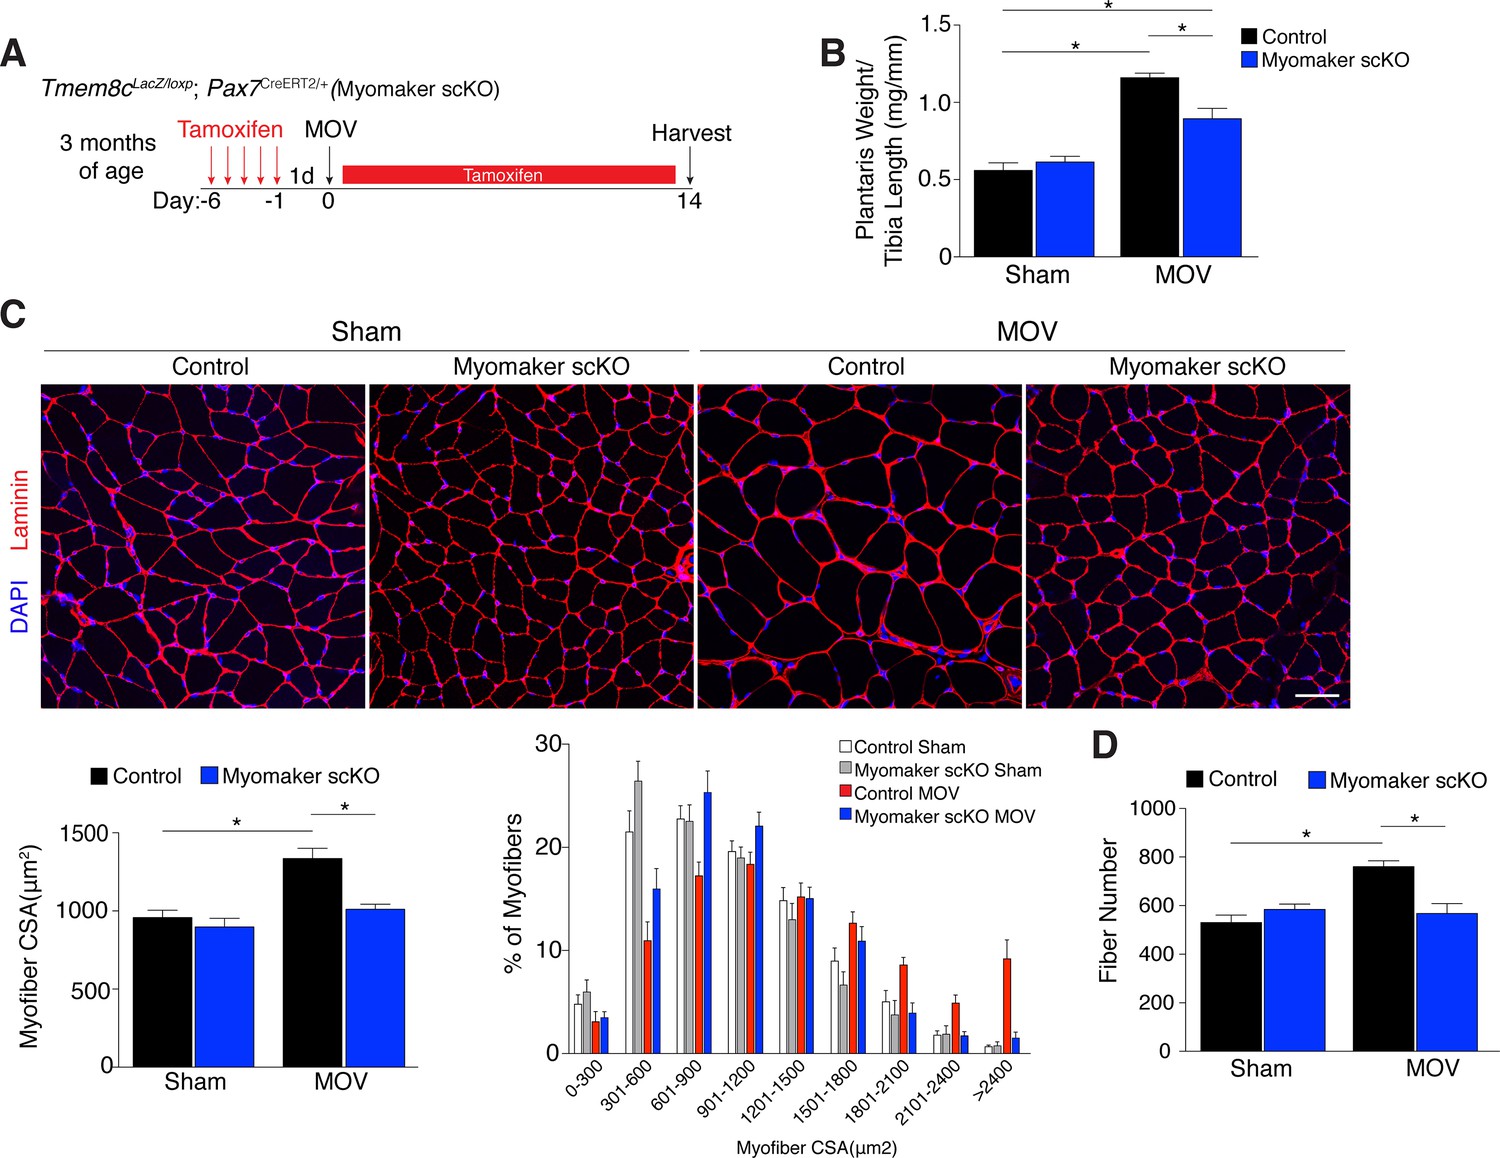
Genetic loss of myomaker in MPs results in an absence of muscle hypertrophy.
(A) Schematic showing timing of tamoxifen treatment by intraperitoneal (IP) injections, MOV, and tissue harvest. Tamoxifen was maintained after MOV through IP injections every other day. (B) Plantaris weight normalized to tibia length indicates a dramatic increase in size in control mice, which is blunted in myomaker scKO mice (n = 7–13 mice). (C) Representative laminin-stained plantaris sections shows an increase in myofiber size after muscle overload in control mice but not in myomaker scKO mice. Quantification of cross-sectional area (CSA) of myofibers at the plantaris mid-belly reveals a significant inhibition of myofiber hypertrophy with satellite cell ablation of myomaker (n = 3200–5,400 myofibers from 7–11 independent mice). Relative frequency of myofiber sizes in the various groups of mice demonstrates that control muscle exhibits a greater percentage of larger fibers after MOV. (D) Fiber number was quantitated at the mid-belly of the plantaris, and reveals a significant inhibition of new fiber formation in plantaris muscle when myomaker was ablated in satellite cells (n = 7–11 mice). Data are represented as mean ± SEM, *p<0.05. Scale bar: 50 μm.
Figure 3—figure supplement 1
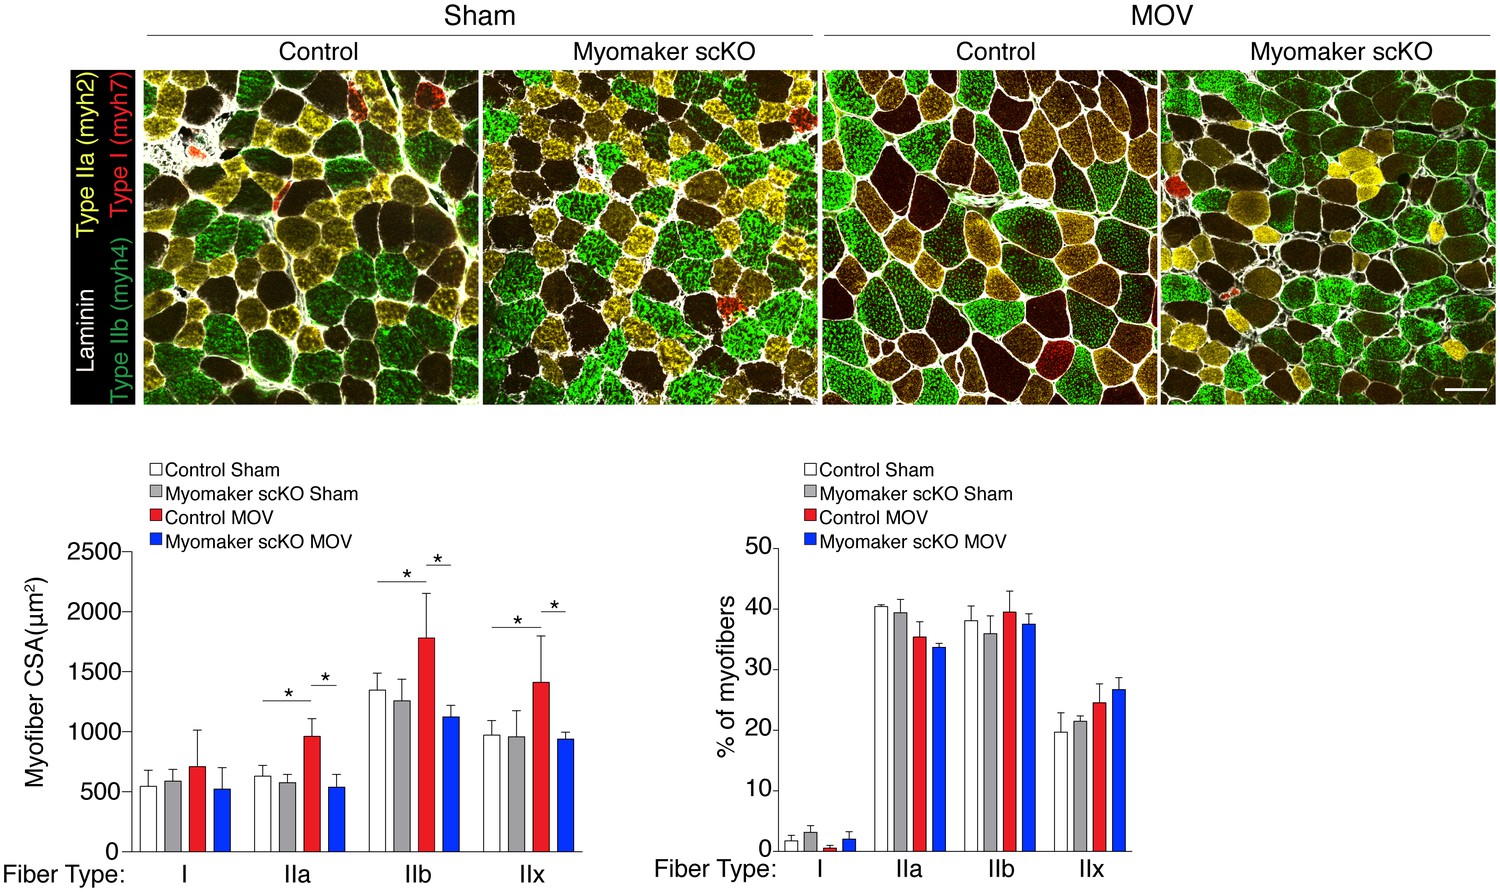
All fiber types fail to hypertrophy in myomaker scKO muscle after MOV.
Representative plantaris sections immunostained with antibodies for laminin, myh7 (Type I myosin, red), myh2 (Type IIa, yellow), and myh4 (Type IIb, green). Type IIx fibers are unstained. Quantification of fiber type cross-sectional area at the plantaris mid-belly reveals a significant increase in Types IIa, IIb, and IIx myofiber size in control mice after overload, whereas myofiber hypertrophy in each of these fiber types is significantly inhibited with satellite cell ablation of myomaker (n = 28–54 fibers (Type I) or 500–1,900 fibers (Types IIa, IIb, IIx) from 3–5 independent mice). Frequency distribution analysis reveals that fiber type composition remains relatively unaltered after 14 days of MOV (n = 1100–1,700 fibers from three independent mice). Data are represented as mean ± SEM, *p<0.05. Scale bar: 50 μm.
Figure 4
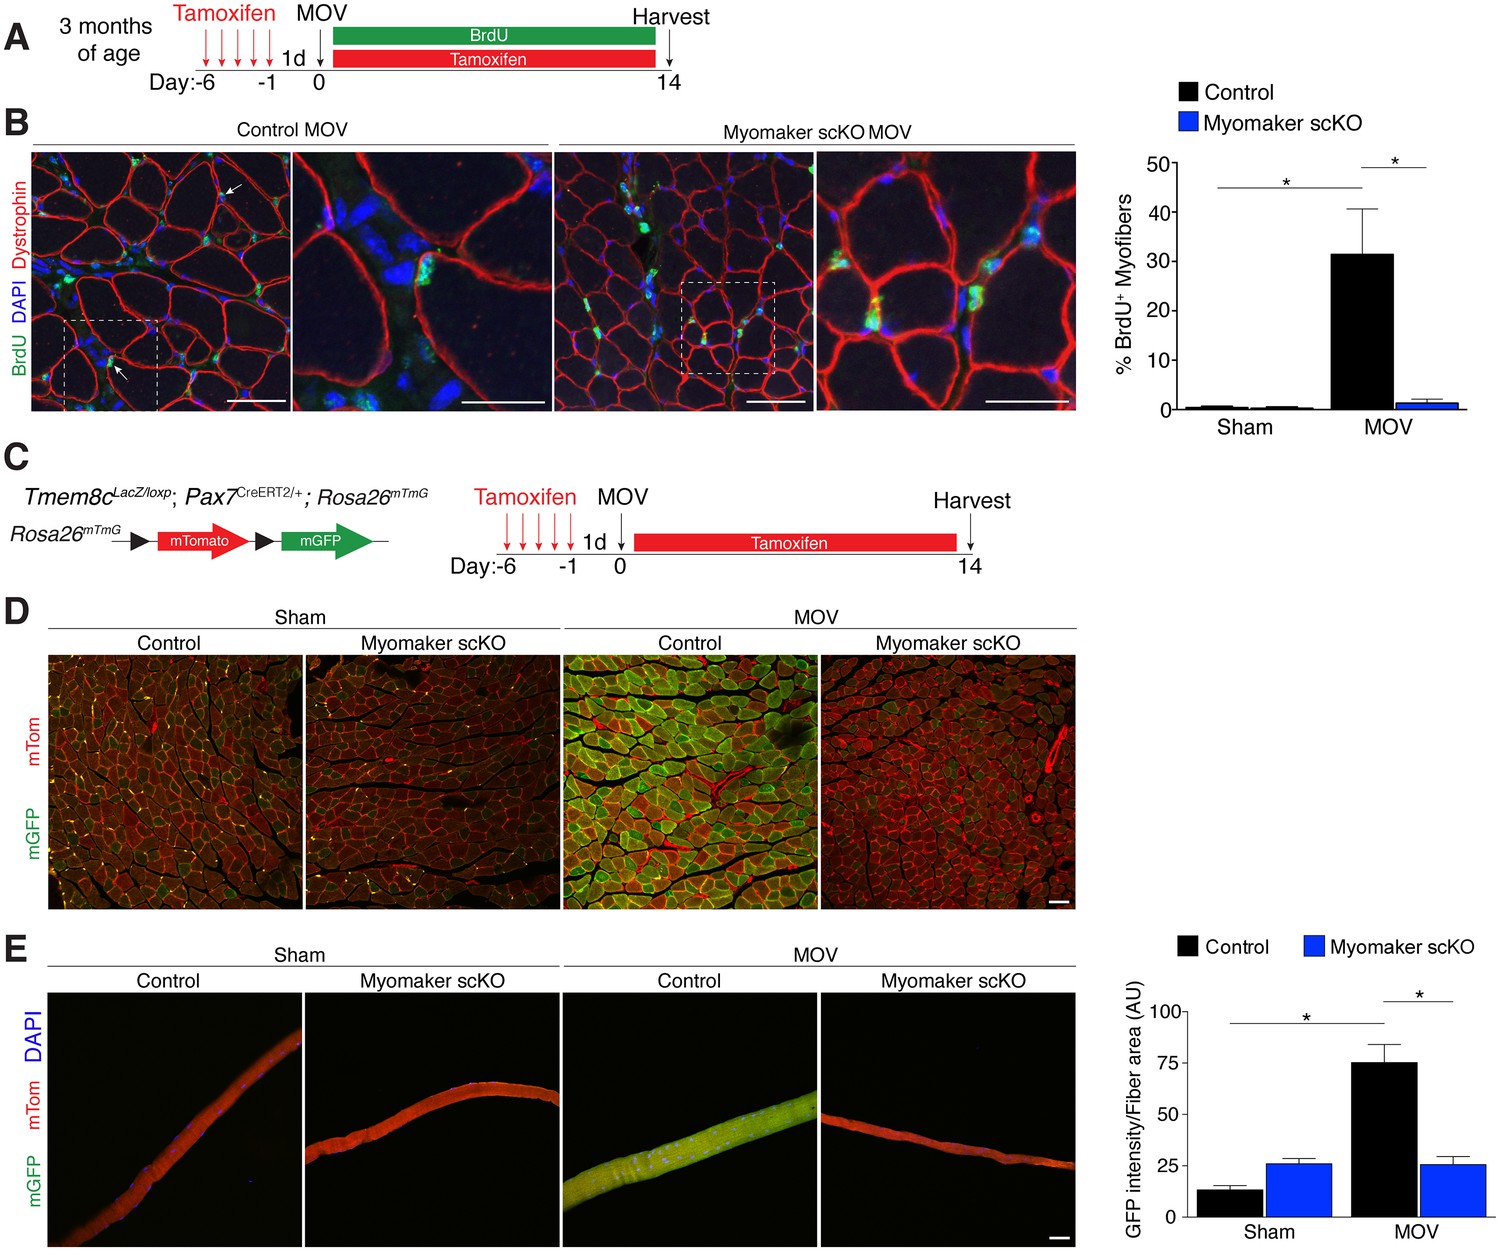
Myomaker is required for fusion during overload-induced muscle hypertrophy.
(A) Schematic showing treatment with tamoxifen and BrdU. (B) Representative images of BrdU+ nuclei within a dystrophin-stained myofiber (arrows) indicating fusion. In myomaker scKO mice, BrdU+ nuclei were observed only in the interstitium between myofibers. Quantification of the percentage of BrdU+ myofibers shows that 30% of fibers undergo fusion in control samples after MOV while this is dramatically reduced in myomaker scKO mice (n > 300 fibers from three independent mice). (C) Tmem8cLacZ/loxP; Pax7CreERT2/+ were crossed with RosamTmG mice to genetically assay fusion. Tamoxifen-treated Tmem8c+/+; Pax7CreERT2/+; RosamTmG mice were used as controls. Upon tamoxifen treatment, SCs will be converted from mTomato-expressing to mGFP-expressing. mGFP+ myofibers indicates fusion with MPs. (D) In sham mice, only minimal mGFP+ fibers were observed. Control MOV mice display numerous mGFP+ myofibers, indicating the majority of myofibers undergo a fusion event. Myomaker scKO mice exhibited marginal mGFP+ fibers (n = 4 mice). (E) Single fibers were isolated from control and myomaker scKO mice and analyzed for mTomato and mGFP expression. Quantification of mGFP intensity in single fibers shows an increase in control MOV, which is inhibited when myomaker is ablated in satellite cells (n = 90–120 myofibers from 3–4 independent mice). Data are represented as mean ± SEM, *p<0.05. Scale bars: 50 μm, except insets in (B) which are 25 μm.
Figure 5
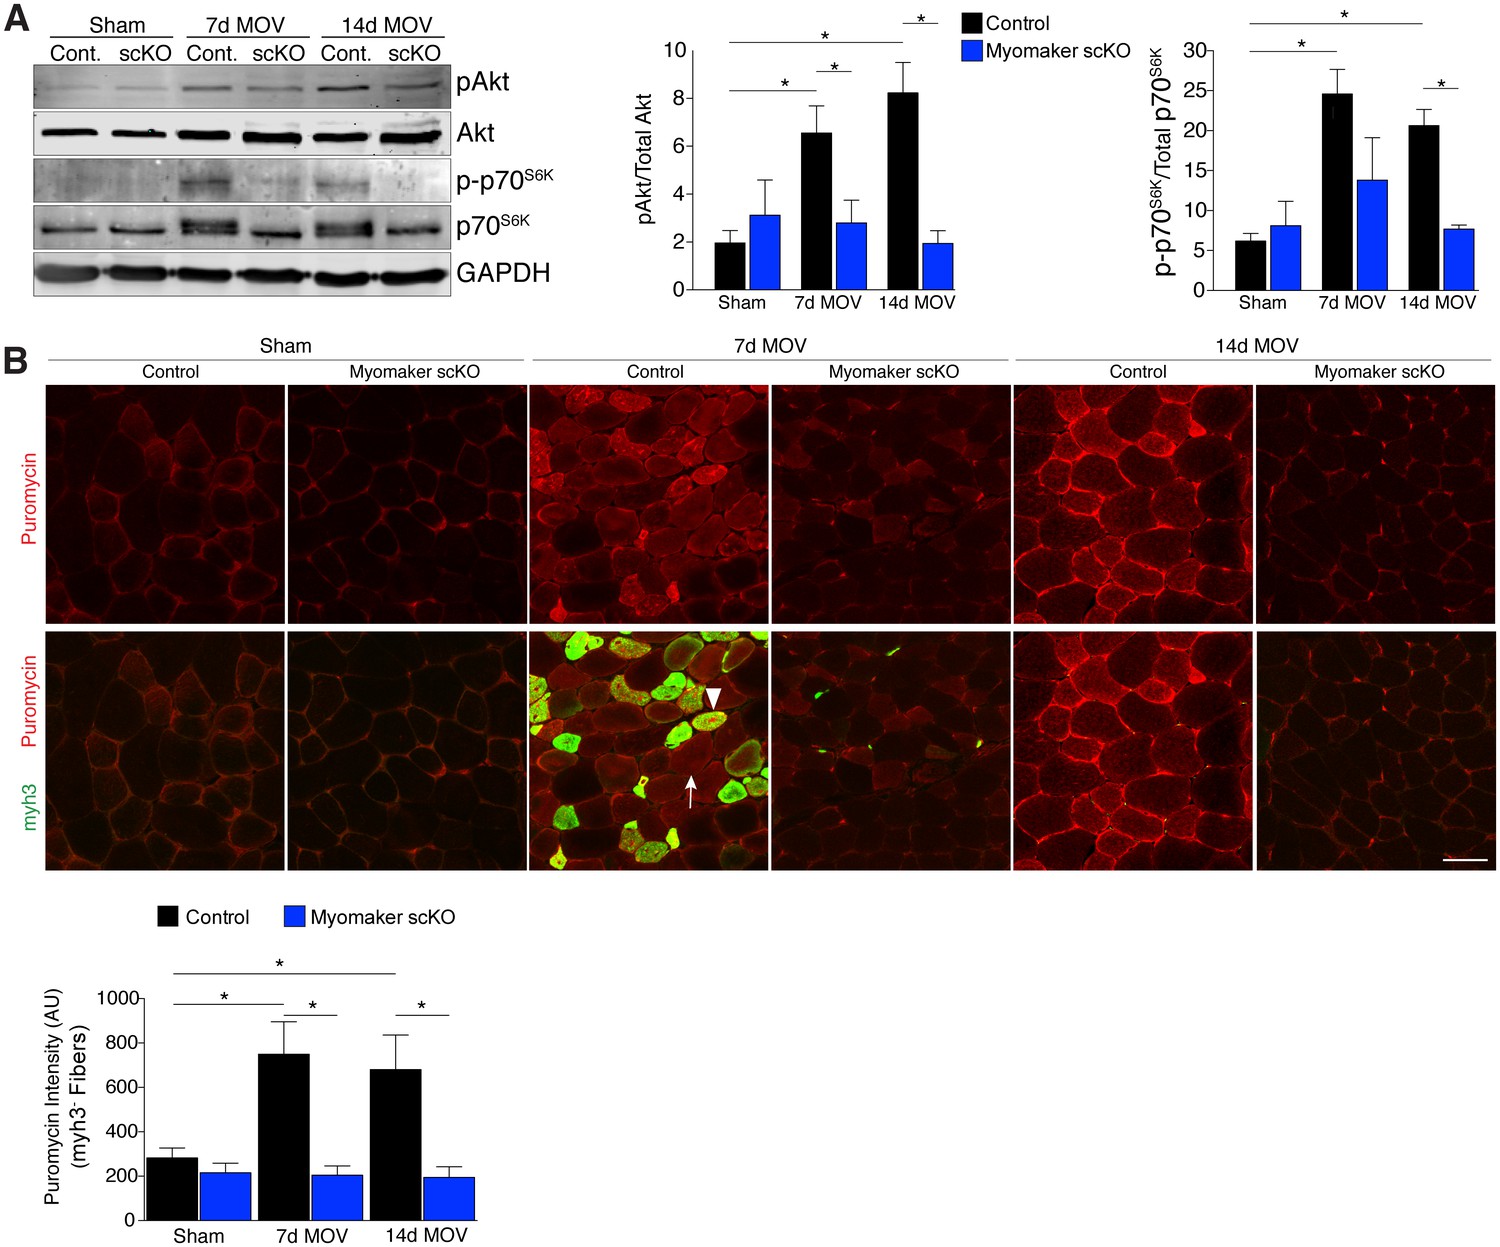
Hypertrophic signaling pathways are reduced in the absence of fusion during MOV.
(A) Western analysis for pAkt (Ser473), total Akt, p-p70S6K (Thr389), and total p70S6K. Control plantaris muscle displays pAkt and p-p70S6K activation after MOV compared to sham controls, however the pathways are not fully activated in myomaker scKO MOV muscles. Quantification of the western signal obtained for pAkt normalized to total protein, and quantification of the western signal obtained for p-p70S6K normalized to total protein both reveal altered Akt/mTOR signaling in myomaker scKO muscles after MOV (n = 4 mice). (B) Analysis of protein synthesis through puromycin incorporation into nascent peptides. Mice were injected with puromycin and sacrificed thirty minutes later. Sections were then immunostained with antibodies to puromycin and myh3, a marker of newly generated muscle cells. Puromycin staining is increased in both myh3+ myofibers (de novo, arrowhead) and myh3- myofibers (existing, arrow) in control samples after MOV. Only myh3- myofibers were observed at 14 days of MOV. Quantification revealed significantly more puromycin incorporation in myh3- myofibers in control samples at both 7 and 14 days after MOV compared to myomaker scKO MOV muscles (2200–3400 fibers from n = 3–4 independent mice). Data are represented as mean ± SEM, *p<0.05. Scale bar: 50 μm.
Figure 6
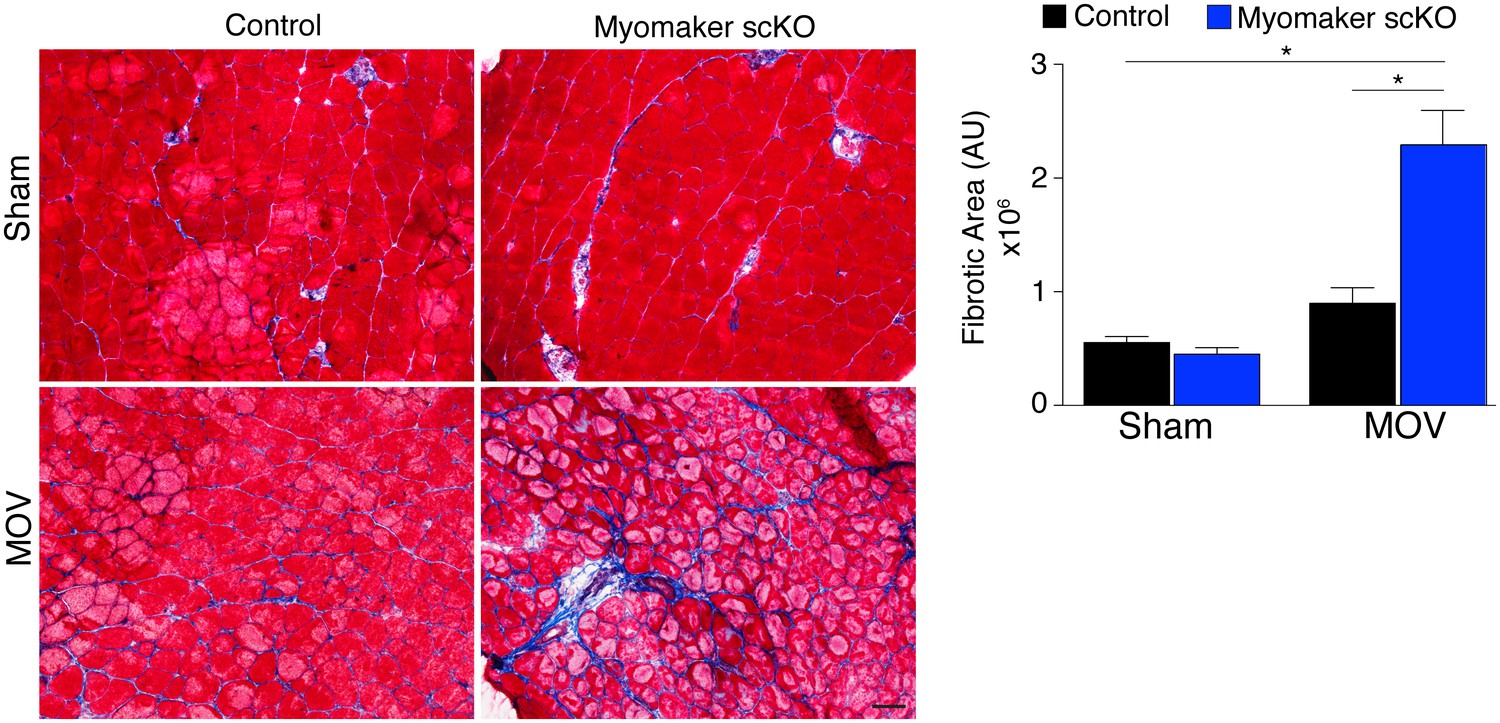
Loss of myomaker in satellite cells results in increased fibrosis during physiological hypertrophy.
Trichrome stained sections from control and myomaker scKO mice demonstrate a significant increase in fibrosis in myomaker scKO mice after MOV. Quantification of the fibrotic area further demonstrates increased fibrosis in fusion-incompetent muscle. Values indicate mean (n = 4–12 mice) ± SEM, *p<0.05. Scale bar: 50 μm.
Author response image 1
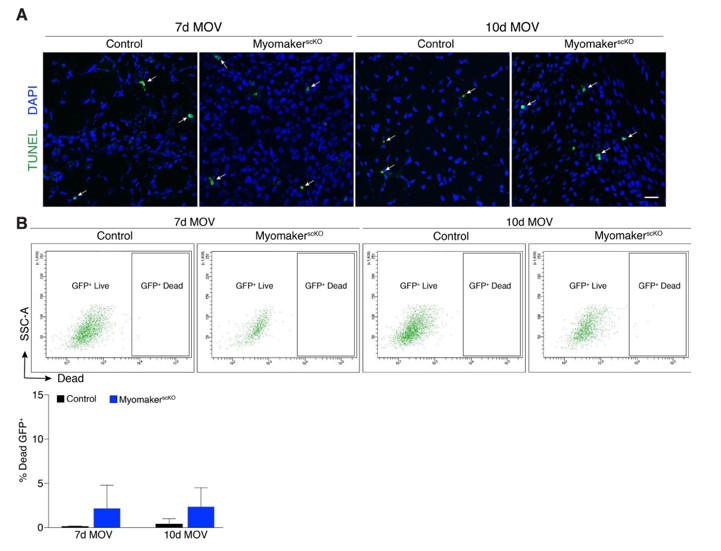
Analysis of cell death after MOV.
(A) Representative images of TUNEL+nuclei in plantaris sections demonstrates similar rates of apoptosis in control and myomakerscKO muscles following MOV. (B) Flow cytometry to distinguish live and dead mGFP+ progenitors using a dye that binds to compromised membranes (LIVE/DEAD Fixable Stain, Invitrogen) in tamoxifen-treated Pax7CreERT2/+; RosamTmG (control) and myomakerLacZ/loxP; Pax7CreERT2/+; RosamTmG mice (myomakerscKO) highlights a small population of dead GFP+ cells 7 and 10d after MOV. Quantitative analysis reveals a modest (although non-significant) level of cell death in MPs between control and myomakerscKO muscles at 7 and 10d of MOV (n = 3 mice/group). Scale bar: 10 μm.
Download links
A two-part list of links to download the article, or parts of the article, in various formats.
Downloads (link to download the article as PDF)
Open citations (links to open the citations from this article in various online reference manager services)
Cite this article (links to download the citations from this article in formats compatible with various reference manager tools)
Requirement of myomaker-mediated stem cell fusion for skeletal muscle hypertrophy
eLife 6:e20007.
https://doi.org/10.7554/eLife.20007


