BLOS2 negatively regulates Notch signaling during neural and hematopoietic stem and progenitor cell development
- Chinese Academy of Sciences, China
- University of Chinese Academy of Sciences, China
- Beijing Children’s Hospital, Capital Medical University, China
- Beijing Institute for Brain Disorders, China
- MOE Key Laboratory of Major Diseases in Children, China
- Beijing Pediatric Research Institute, China
Figures
Figure 1 with 1 supplement

BLOS2-deficiency impaired cortical development.
(A–D) Gross examination of whole mount WT (Bloc1s2+/+) and Bloc1s2−/− embryos at E12.5, E14.5, and newborns (P0). Note that the (A) impaired hematopoiesis, (B) loss of eye pigmentation, (C) craniofacial malformation, and (D) smaller brain size of Bloc1s2−/− mice are indicated by the arrows compared with WT littermates at E12.5 and E14.5 and in newborns. (E) Coronal sections of E14.5 brains with Nissl staining of WT and Bloc1s2−/− embryos. The black boxes indicate the areas shown at higher magnification in (G). The enlarged lateral ventricles (LV) are shown. (F) Volumetric analysis of the LV in WT and Bloc1s2−/− brains at E14.5. The values for LV volume in Bloc1s2−/− mice are indicated as percentages of the corresponding WT values. The ratios of the volume of LV to brain are also indicated as percentages of the corresponding WT values. ***p<0.001 (Student’s t-test); n=6 mice. (G) The cortical plate (CP), intermediate zone (IZ), and ventricular zone (VZ) are labeled and compared. In Bloc1s2−/− brain, the thinner CP and IZ are shown, but VZ is almost normal. (H) Quantification of the thickness of the neocortex, CP, IZ and VZ in WT and Bloc1s2−/− brains at E14.5. 212.85 ± 10.39 (neocortex), 44.48 ± 3.01 (CP), 72.12 ± 6.46 (IZ), 94.66 ± 3.78 (VZ) for WT; 162.61 ± 1.99 (neocortex), 26.12 ± 1.27 (CP), 48.00 ± 1.26 (IZ), 87.17 ± 2.95 (VZ) for Bloc1s2−/−. **p<0.01 (IZ); ***p<0.001 (neocortex and CP); n.s., not significant, p=0.137 (VZ); n=6 mice. (I) Immunohistochemistry (Ctip2 and Tbr1) on sections of WT and Bloc1s2−/− brains at E12.5 and E14.5. The numbers of Ctip2+ and Tbr1+ cells were decreased in the Bloc1s2−/− brain at E12.5 and E14.5. (J and K) Quantification of neuronal number at E12.5 and E14.5. 24.00 ± 0.62 (Ctip2+), 22.08 ± 0.33 (Tbr1+) for WT at E12.5, 12.22 ± 0.17 (Ctip2+), 12.00 ± 0.68 (Tbr1+) for Bloc1s2−/− at E12.5; 48.40 ± 1.73 (Ctip2+), 27.78 ± 1.66 (Tbr1+) for WT at E14.5, 30.1 ± 1.41 (Ctip2+), 14.55 ± 0.66 (Tbr1+) for Bloc1s2−/− at E14.5. ***p<0.001; n=9. All graphs are mean ± s.e.m. Scale bars: 1 mm in (D); 100 µm in (E); 50 µm in (I).
Figure 1—figure supplement 1
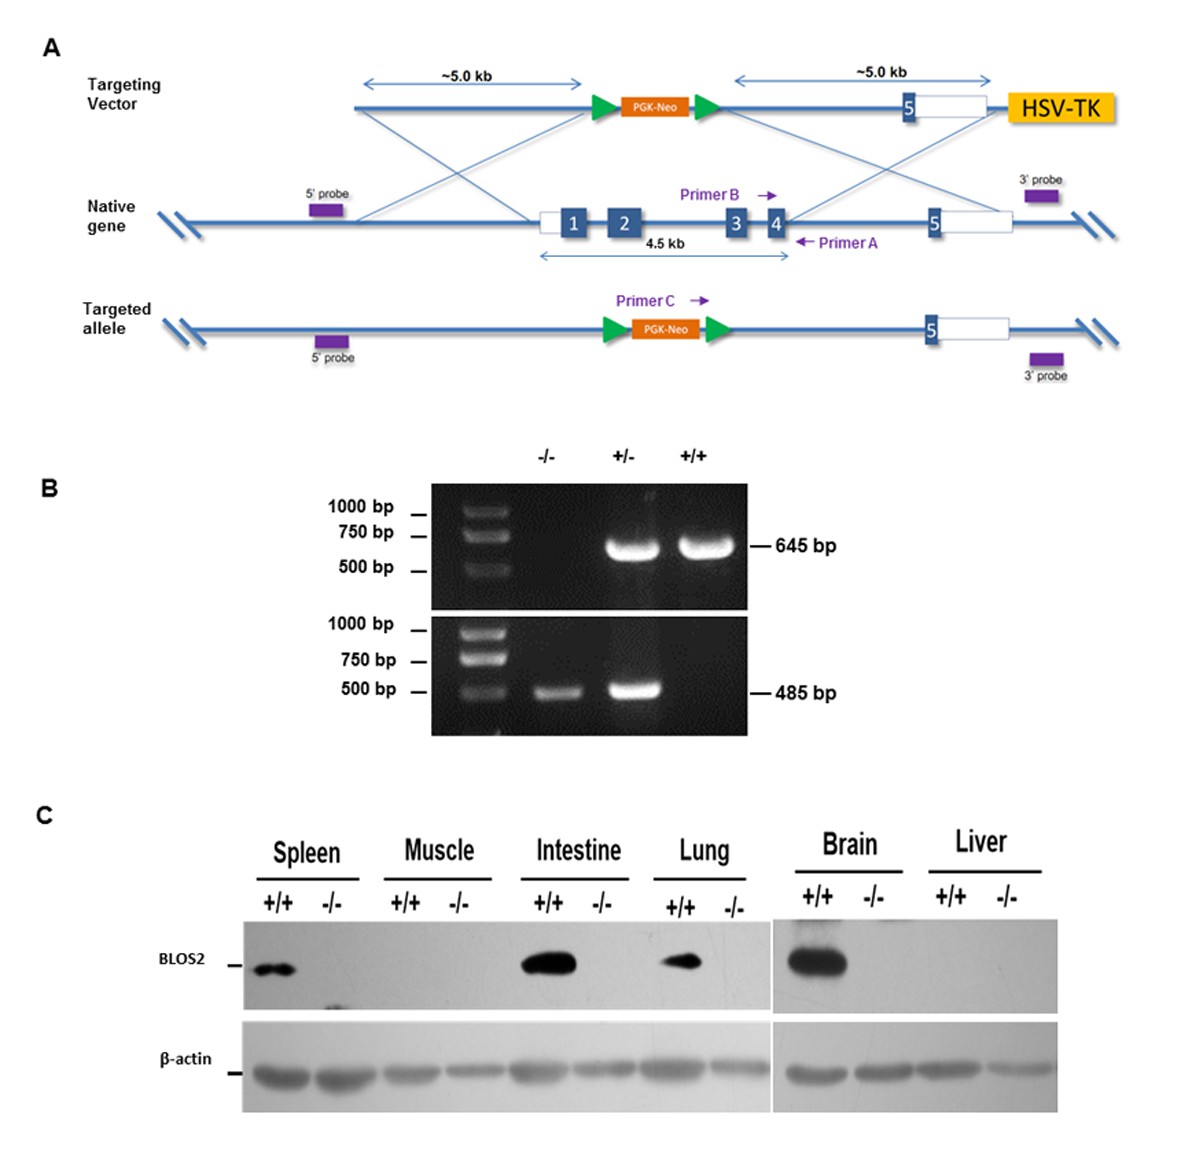
Generation of Bloc1s2 knockout mice.
(A) Schematic diagram of knockout strategy. Exons 1–4 of Bloc1s2 gene are replaced by the PGK-Neo cassette. (B) Genomic PCR using primers shown in (A). The WT allele gives rise to a 645-bp product when using primers A and B, whereas a 485-bp product amplified by primers A and C indicates the null allele. (C) Immunoblotting analysis of BLOS2 protein in multiple tissues isolated from WT and Bloc1s2−/− neonate mice (Figure 1—figure supplement 1C—source data 1). BLOS2 protein is not detectable in various tissues of the Bloc1s2−/− mice. β-actin is served as a loading control. In this figure, +/+, +/- and -/- indicate the genotypes of the WT, heterozygote and homozygote, respectively.
-
Figure 1—figure supplement 1—source data 1
Western blots of Figure 1—figure supplement 1C.
- https://doi.org/10.7554/eLife.18108.004
Figure 2
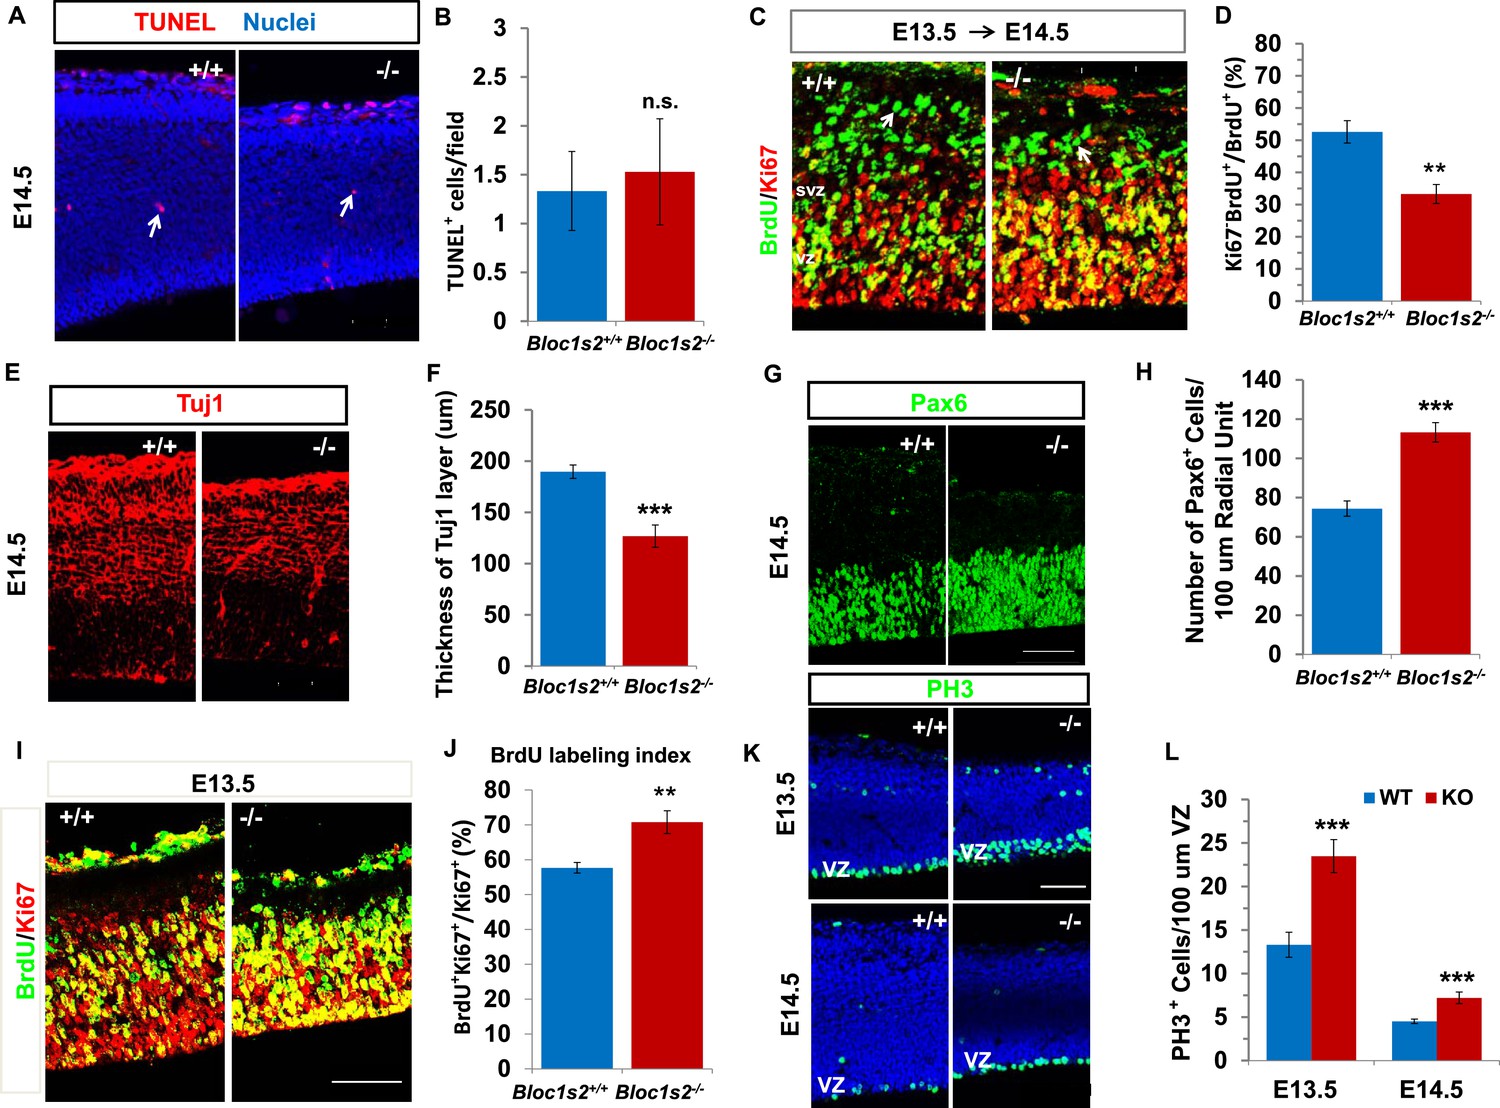
Neural progenitor proliferation and neurogenesis were altered in the Bloc1s2−/− cortex.
(A) TUNEL assay on sections from WT and Bloc1s2−/− embryos at E14.5. No significant difference in the number of apoptotic cells (arrows) in the Bloc1s2−/− neocortex was detected as compared with WT littermates. (B) Quantification of TUNEL+ cells in the WT and Bloc1s2−/−cortices. Results represent the average number of TUNEL-positive cells per imaging field at ×20 magnification within the cortex. 1.33 ± 0.40 for WT, 1.53 ± 0.54 for Bloc1s2-/-. p=0.19, n.s., not significant (Student’s t-test); n=6 mice. (C) Representative staining from the BrdU/Ki67 cell-cycle exit assay in the WT and Bloc1s2−/− cortices. In the cell-cycle exit assay at E13.5 to E14.5, a BrdU pulse was followed 18 hr later by double labeling of BrdU and Ki67. BrdU+/Ki67– cells (arrows) were considered to be cells exited from the cell cycle. Pictures showed that the number of cells exited from the cell cycle was decreased in mutant cortex compared with WT. (D) Quantification of the proportion of cells leaving the cycle [BrdU+/Ki67– over total BrdU+] in WT and Bloc1s2−/− cortices. 52.61 ± 3.48 for WT, 33.29 ± 2.95 for Bloc1s2−/−. **p<0.01; n=9 mice. (E) Immunohistochemistry staining of Tuj1 on sections of WT and Bloc1s2−/− brains at E14.5. The number of Tuj1+ cells was decreased in the Bloc1s2−/− brain. (F) Quantification of the thickness of the Tuj1+ neuronal layer at E14.5. 189.70 ± 6.54 for WT, 126.84 ± 10.88 for Bloc1s2−/−. ***p<0.001; n=9 mice. (G) Immunohistochemistry staining of Pax6 on sections of WT and Bloc1s2−/− brains at E14.5. The number of Pax6+ cells was increased in the Bloc1s2−/− brain. (H) Quantification of the number of Pax6+ cells at E14.5. 74.36 ± 3.88 for WT, 113.29 ± 4.95 for Bloc1s2−/−. ***p<0.001; n=9 mice. (I) Staining of brain sections for BrdU and Ki67 following a 2-hr BrdU pulse at E14.5. Pictures showed an increase in the proportion of cycling cells in S-phase in the Bloc1s2−/− cortex compared with WT. (J) Quantification of the BrdU labeling index in WT and Bloc1s2−/− cortices. BrdU labeling index is the percentage of Ki67+ cells that incorporated BrdU. 57.69 ± 1.52 for WT, 70.79 ± 3.27 for Bloc1s2−/−; **p<0.01; n=9 mice. (K) Immunohistochemistry staining of PH3 on sections of WT and Bloc1s2−/− brains at E13.5 and E14.5. Pictures showed an increase in PH3+ cells in the VZ in the Bloc1s2−/− cortex at E13.5 and E14.5. (L) Quantification of the number of PH3+ cells in the VZ at E13.5 and E14.5. 13.31 ± 1.43 for WT at E13.5, 23.49 ± 1.90 for Bloc1s2−/− at E13.5; 4.51 ± 0.25 for WT at E14.5, 7.21 ± 0.66 for Bloc1s2−/− at E14.5. ***p<0.001; n=9 mice per group. All graphs are mean ± s.e.m. Scale bars: 50 μm in A, C, E, G, I and K.
Figure 3 with 3 supplements

Loss of BLOS2 led to increased Notch signaling in mouse brain.
(A) Immunoblotting analysis of NICD1 and Notch1 (NTM) in cortical extracts derived from WT and Bloc1s2−/− mice at E14.5 (Figure 3—source data 1). The results showed that the levels of NICD1 and Notch1 (NTM) were significantly increased in the Bloc1s2−/− cortex lysates. (B) Quantification of NICD1 and Notch1 (NTM) relative to WT cortex. Data are presented as fold change normalized to the mean of WT ± s.e.m. ***p<0.001 (Student’s t-test); n=9 mice. (C) Immunohistochemistry staining of Notch1 on sections of WT and Bloc1s2−/− brains at E14.5. Insets are high-magnification images of the boxed regions. Increased Notch1 expression was observed in Bloc1s2−/− cortices at E14.5. Scale bar: 50 μm. (D) Quantification of signal intensity of Notch1. **p<0.01; n=9 mice. (E-G) qRT-PCR analysis for Hes1, Hes5 and Fabp7 of the WT and Bloc1s2−/− dissected cortices at E14.5. The expression of Hes1, Hes5 and Fabp7 were significantly higher in the Bloc1s2−/− cortex. Data are presented as fold change normalized to the mean of WT. *p<0.05; ***p<0.001; n=9 mice. (H) Immunoblot analysis of Fabp7, Hes1 and Hes5 in cortical extracts derived from WT and Bloc1s2−/− mice at E14.5 Figure 3—source data 2). (I) Quantification of Fabp7, Hes1 and Hes5 relative to WT cortex. Data are presented as fold change normalized to the mean of WT. ***p<0.001; n=9 mice.
-
Figure 3—source data 1
Western blots of Figure 3A.
- https://doi.org/10.7554/eLife.18108.007
-
Figure 3—source data 2
Western blots of Figure 3H.
- https://doi.org/10.7554/eLife.18108.008
Figure 3—figure supplement 1
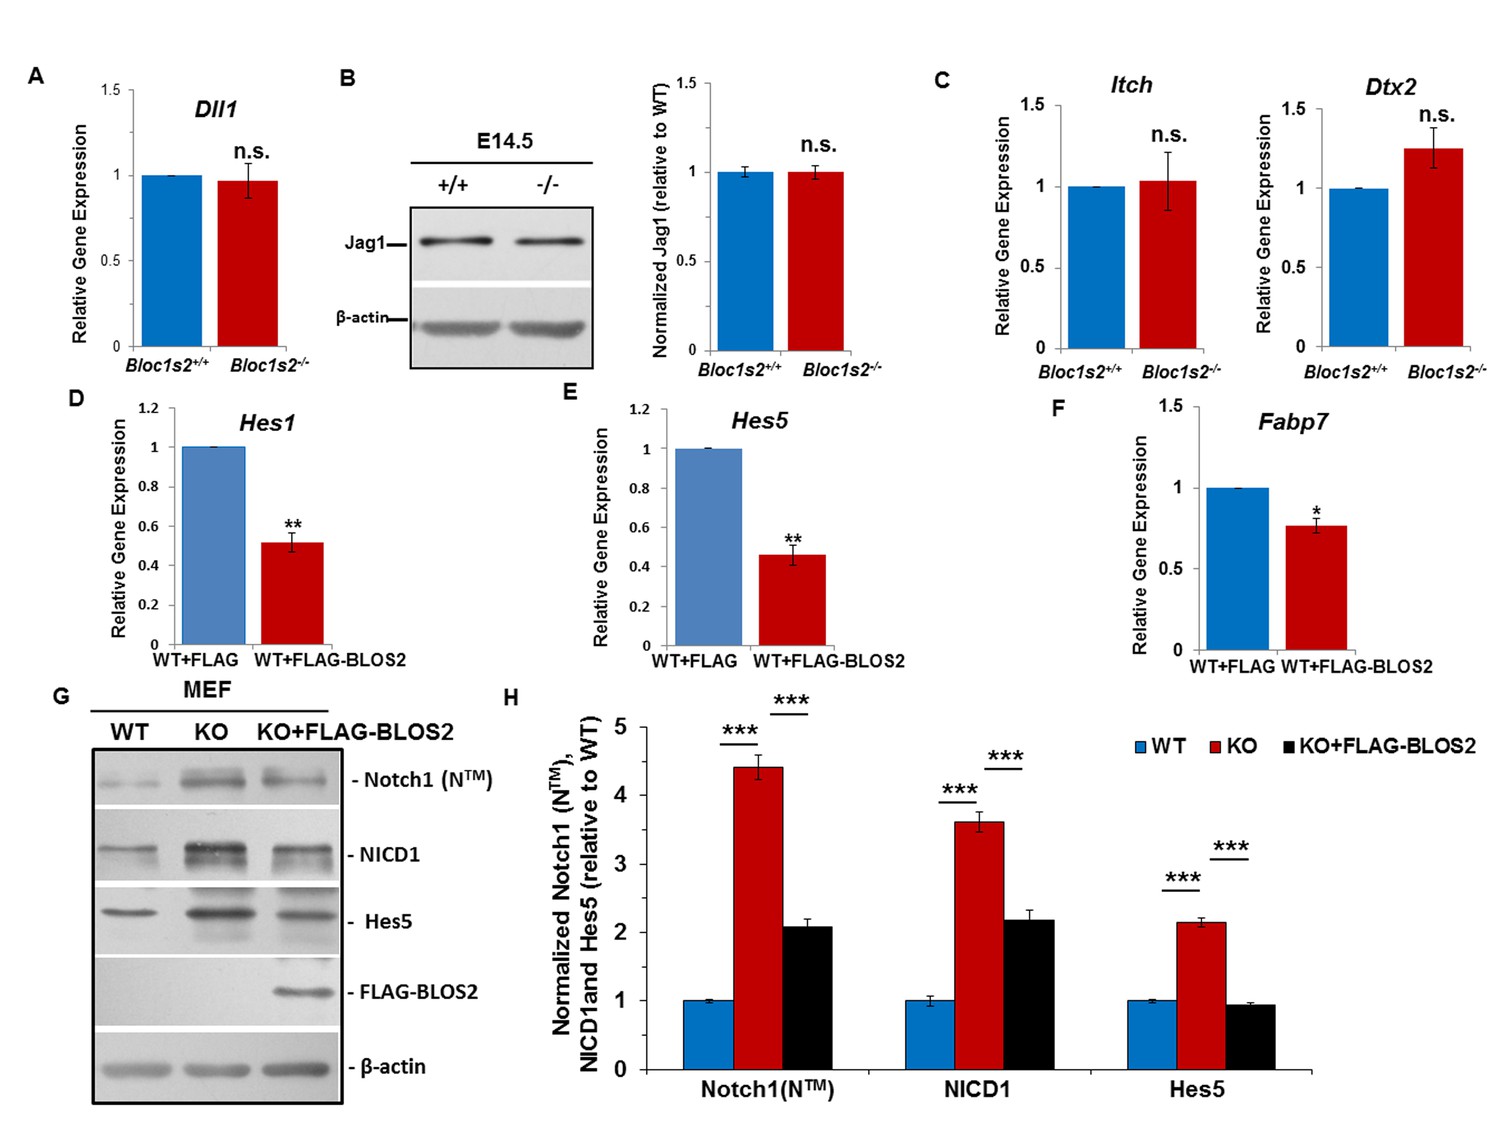
Unchanged Notch ligands in cortices and elevated Notch levels in MEFs.
(A) qRT-PCR analysis for Dll1 of the WT and Bloc1s2−/− dissected cortices at E14.5. No change in Dll1 mRNA levels between WT and Bloc1s2−/− cortex was observed. Data are presented as fold change normalized to the mean of WT. p=0.766, n.s., not significant (Student’s t-test; n=9). (B) Immunoblotting analysis of Jag1 in cortical extracts derived from WT and Bloc1s2−/− mice at E14.5 (Figure 3—figure supplement 1—source data 1). No change in Jag1 levels between WT and Bloc1s2−/− cortices was observed. Quantification of Jag1 relative to WT cortex. Data are presented as fold change normalized to the mean of WT. p=0.986, n.s., not significant (n=9). (C) qRT-PCR analysis for Itch and Dtx2 expression in WT and Bloc1s2−/− MEFs. No changes in Itch and Dtx2 levels in WT and Bloc1s2−/−MEFs were observed. Data are presented as fold change normalized to the mean of WT. p=0.776 (Itch), p=0.071 (Dtx2), n.s., not significant (n=3 mice). (D-F) qRT-PCR analyses of Hes1, Hes5 and Fabp7 in BLOS2-overexpressed MEFs. The expression of Hes1, Hes5 and Fabp7 was significantly decreased in full-length FLAG-BLOS2 overexpressed WT MEFs. Data are presented as fold change normalized to the mean of WT. *p<0.05; **p<0.01 (n=9). (G) Immunoblot analysis of Notch1 (NTM), NICD1 and Hes5 in WT and Bloc1s2−/− MEFs (Figure 3—figure supplement 1—source data 2). The levels of Notch1 (NTM), NICD1 and Hes5 were all significantly increased in Bloc1s2−/− MEFs. Increased levels of Notch1 (NTM) and Notch signaling in Bloc1s2−/− MEFs were mostly rescued by overexpression of full-length FLAG-BLOS2. (H) Quantification of levels of Notch1 (NTM), NICD1 and Hes5 relative to WT MEFs. Data are presented as fold change normalized to the mean of WT. ***p<0.001 (n=9).
-
Figure 3—figure supplement 1—source data 1
Western blots of Figure 3—figure supplement 1B.
- https://doi.org/10.7554/eLife.18108.010
-
Figure 3—figure supplement 1—source data 2
Western blots of Figure 3—figure supplement 1G.
- https://doi.org/10.7554/eLife.18108.011
Figure 3—figure supplement 2
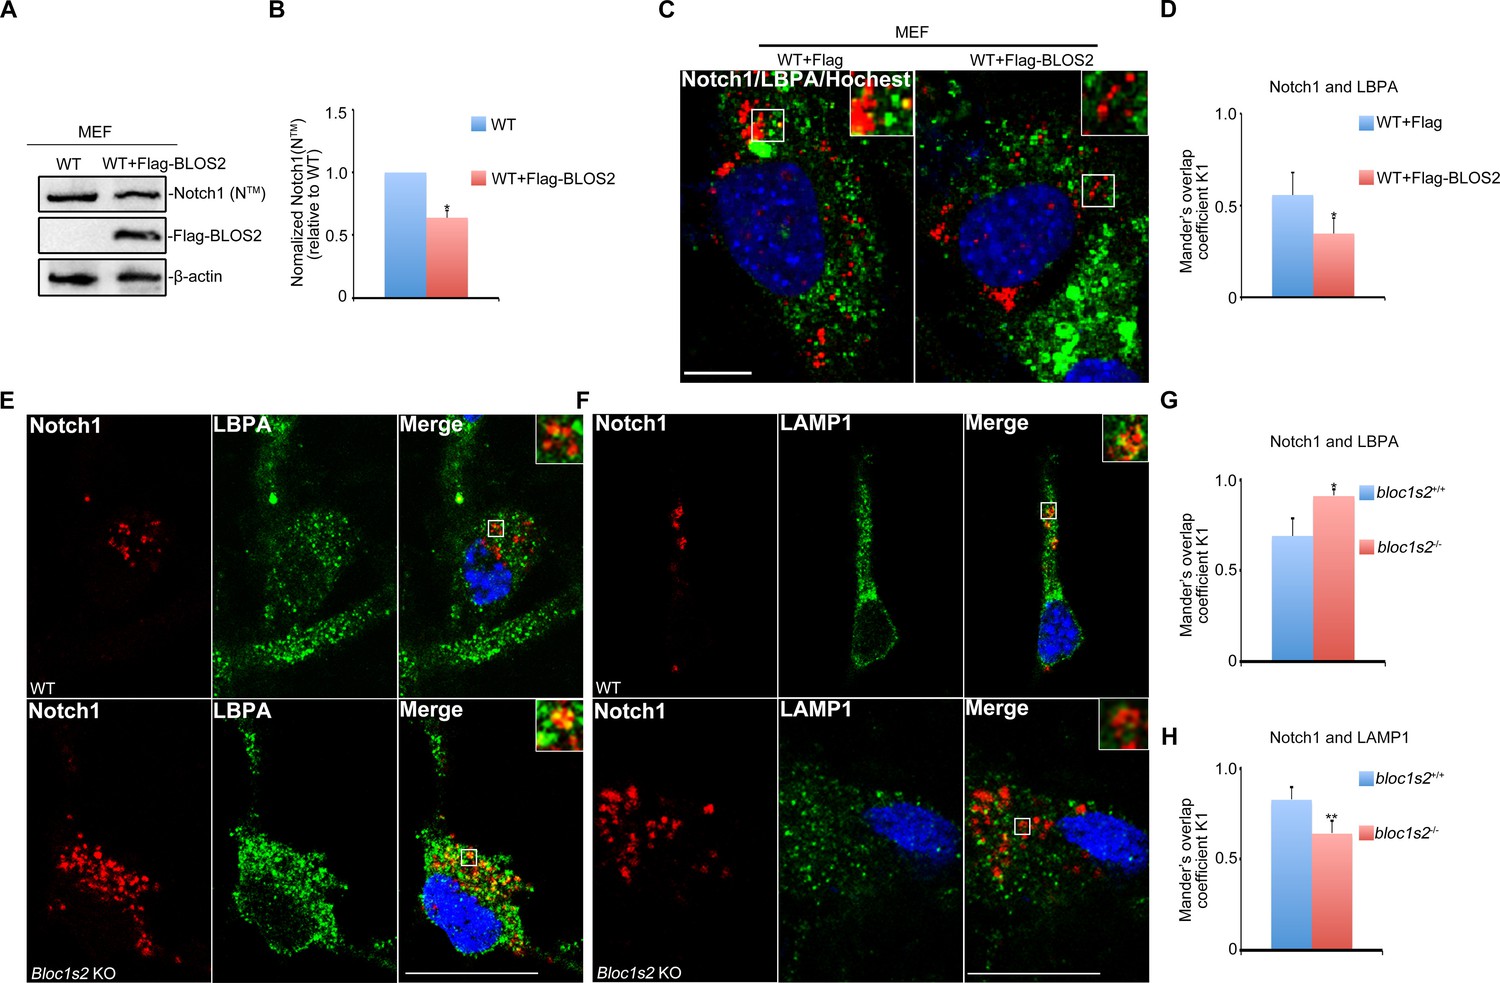
Endosomal Notch1 levels are reduced in BLOS2 overexpressed MEFs but increased in BLOS2-KO NPCs.
(A) Immunoblotting analysis of Notch1 (NTM) in WT and full-length Flag-BLOS2 overexpressing MEFs (Figure 3—figure supplement 2—source data 1). The results showed that the levels of Notch1 (NTM) were significantly decreased by overexpression of full-length Flag-BLOS2. (B) Quantification of Notch1 (NTM) relative to WT. Data are presented as fold changes normalized to the mean of WT ± s.e.m. *p<0.05 (Student’s t-test; n=3). (C) WT + FLAG and WT + FLAG-BLOS2 MEFs immunostained with antibodies against endogenous Notch1 (red) and LBPA (green). The results revealed decreased endogenous Notch1 localization in LBPA-positive vesicles in overexpressed full-length FLAG-BLOS2 MEFs. Scale bar: 10 μm. (D) Quantification of Mander’s overlap coefficient K1 representing co-localizations of Notch1 with LBPA in (C). *p<0.05 (n=100 cells). All graphs are mean ± s.e.m. (E, F) Immunostaining of NPCs derived from E14.5 WT and Bloc1s2−/− neurospheres with antibodies against endogenous Notch1 (red) and LBPA/LAMP1 (green). The results revealed increased endogenous Notch1 localization in LBPA-positive vesicles, and decreased Notch1 localization in LAMP1-labeled vesicles in Bloc1s2−/− NPCs. Scale bars: 50 μm. (G, H) Quantification of Mander’s overlap coefficient K1 representing co-localizations of Notch1 with LBPA and LAMP1, respectively. *p<0.05, **p<0.01 (n=100 cells). All graphs are mean ± s.e.m.
-
Figure 3—figure supplement 2—source data 1
Western blots of Figure 3—figure supplement 2A.
- https://doi.org/10.7554/eLife.18108.013
Figure 3—figure supplement 3
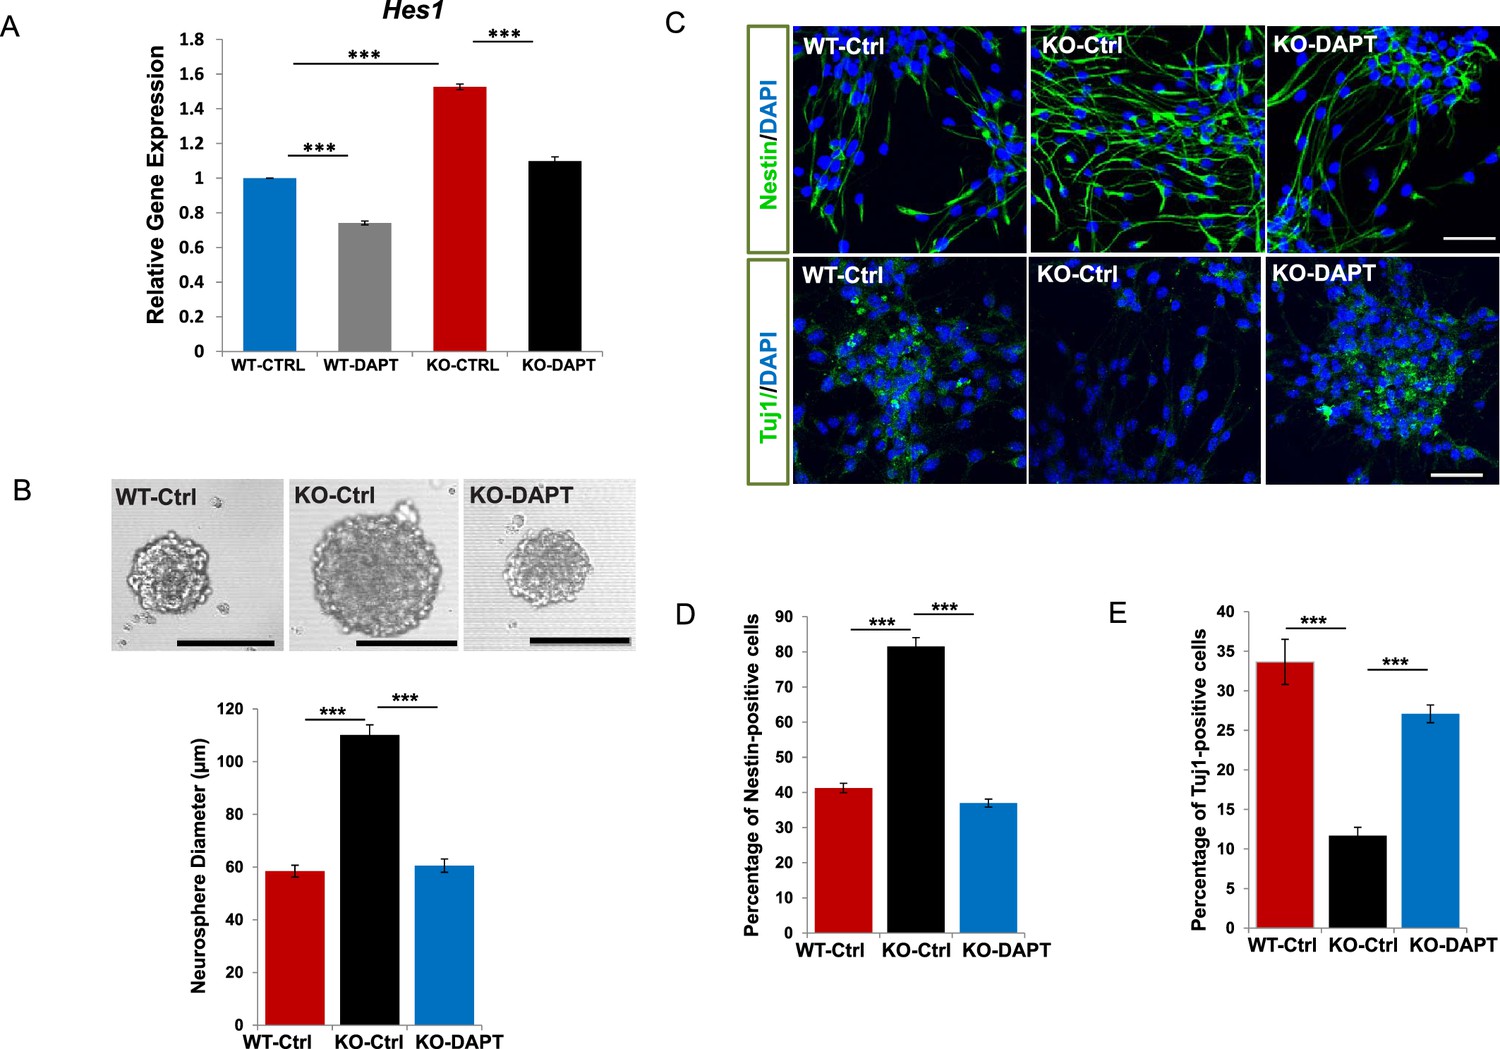
Rescue assays using a γ-secretase inhibitor DAPT.
(A) qRT-PCR analysis for Hes1 of WT and Bloc1s2−/− MEFs incubated with DAPT or DMSO (CTRL). Data are presented as fold change normalized to the mean of WT. ***p<0.001 (Student’s t-test; n=9). (B) Representative images of neurospheres derived from E14.5 NPCs (WT-Ctrl, KO-Ctrl and KO-DAPT) are shown. Quantification of neurosphere diameters (μm): 58.49 ± 2.34 for WT-Ctrl, 110.15 ± 3.84 for KO-Ctrl, 60.56 ± 2.53 for KO-DAPT. ***p<0.001 (n=3 mice). (C) Immunostaining of neurospheres derived from WT-Ctrl, KO-Ctrl and KO-DAPT NPCs with antibodies against Nestin (NPC marker) or Tuj1 (neuron marker). (D and E) Quantification of the percentage (%) of Nestin-positive (proliferation) and Tuj1-positive (differentiation) cells in cultured neurospheres. 41.28 ± 1.31 (Nestin+), 33.66 ± 2.85 (Tuj1+) for WT-CtrlL; 81.56 ± 2.49 (Nestin+), 11.68 ± 1.06 (Tuj1+) for KO-Ctrl; 36.98 ± 1.15 (Nestin+), 27.09 ± 1.13 (Tuj1+) for KO-DAPT. ***p<0.001 (Student’s t-test; n=3 mice). All graphs are mean ± s.e.m. Scale bars: 100 μm in (B); 50 μm in (C).
Figure 4 with 1 supplement
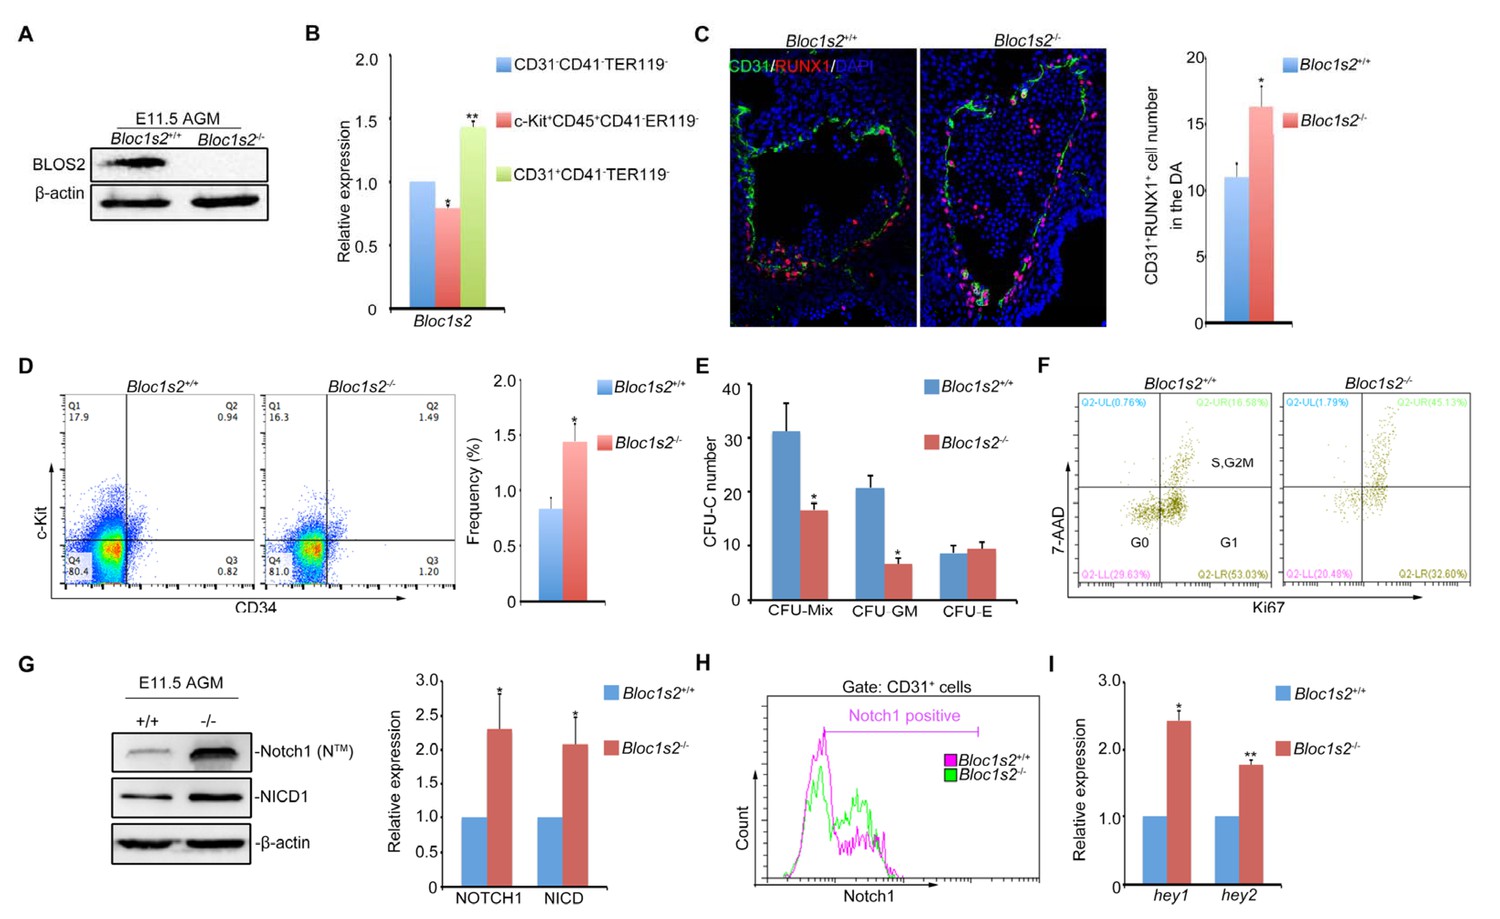
Loss of BLOS2 drives HSPCs from quiescence to rapid proliferation and results in increased frequency and number of HSPCs and elevated Notch signaling.
(A) Immunoblotting of BLOS2 in the E11.5 AGM region of Bloc1s2+/+ and Bloc1s2−/− embryos (Figure 4—source data 1). The cells in the AGM region were immunoblotted with anti-BLOS2 and anti-β-actin. (B) qRT-PCR results showed that Bloc1s2 was enriched in CD31+CD41–CD45–TER119− endothelial cells. Each bar represents the mean ± s.e.m of three independent samples. *p<0.05; **p<0.01 (Student’s t-test). (C) The immunofluorescence of Runx1 and CD31 expression in the E11 AGM region of Bloc1s2+/+ and Bloc1s2−/− embryos. Quantification of CD31+ Runx1+ cell numbers in the DA (dorsal aorta). *p<0.05 (n=3 mice). (D) The cell proportion of c-Kit+CD34+ HSPC from E11 AGM in Bloc1s2+/+ and Bloc1s2−/− embryos. *p<0.05 (n=3 mice). (E) Each well plated with 600 c-Kit+CD34+ HSPCs from E11 Bloc1s2+/+ and Bloc1s2−/− embryos was used for CFU-C assay. Seven days later, the numbers of colonies were counted. Each bar represents the mean ± s.e.m of three independent samples. CFU-MIX: 15.67 ± 2.51 for WT, 8.33 ± 0.58 for Bloc1s2−/− (*p<0.05); CFU-E: 4.33 ± 0.71 for WT, 4.67 ± 0.65 for Bloc1s2−/− (p=0.423); CFU-GM: 10.33 ± 1.63 for WT, 3.33 ± 0.545 for Bloc1s2−/− (p<0.05). (F) Bloc1s2-deficient c-Kit+CD34+ HSPCs have increased proliferation, indicated as Ki67+ 7AAD+ (7-amino-actinomycin D). (G) Immunoblotting of Notch signaling in the AGM region. The cells in the AGM region were immunoblotted with anti-Notch1, anti-NICD and anti-β-actin (Figure 4—source data 2). The right panel shows a quantitative analysis of the western blotting results. Each bar represents the mean ± s.e.m of three independent samples. *p<0.05, **p<0.01. (H) Fluorescence-activated cell sorting (FACS) analysis of Notch1 expression on CD31+CD41–CD45–TER119– endothelial cells in Bloc1s2+/+ or Bloc1s2−/− embryos. (I) qPCR analysis of hey1 and hey2 expression in CD31+CD41–CD45–TER119– endothelial cells from Bloc1s2+/+ or Bloc1s2−/− embryos. Each bar represents the mean ± s.e.m of three independent samples. *p<0.05, **p<0.01.
-
Figure 4—source data 1
Western blots of Figure 4A.
- https://doi.org/10.7554/eLife.18108.016
-
Figure 4—source data 2
Western blots of Figure 4G.
- https://doi.org/10.7554/eLife.18108.017
Figure 4—figure supplement 1
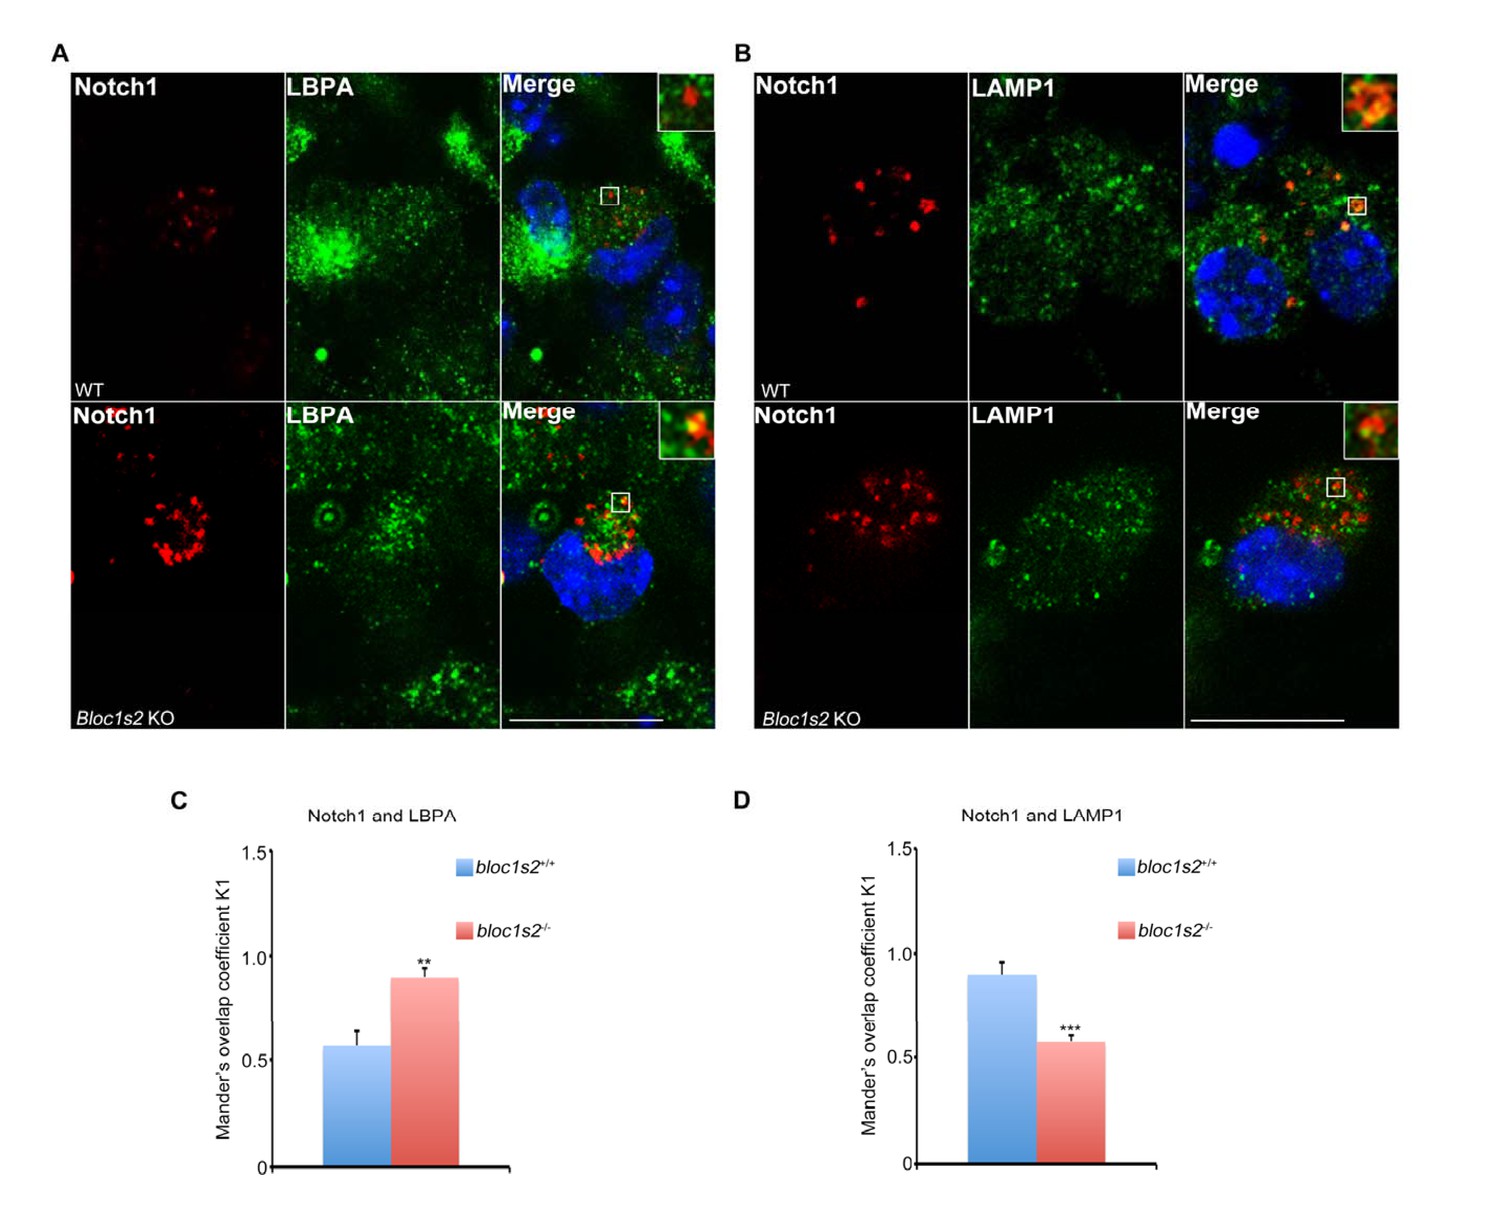
Endosomal Notch1 levels are increased in BLOS2-KO AGM cells.
(A, B) Immunostaining of HSPCs derived from E11.5 WT and BLOS2-KO AGM region with antibodies against endogenous Notch1 (red) and LBPA/LAMP1 (green). It revealed increased endogenous Notch1 localization in LBPA-positive vesicles, and decreased Notch1 localization in LAMP1-labeled vesicles in Bloc1s2−/− cells. Scale bars: 50 μm. (C, D) Quantification of Mander’s overlap coefficient K1 representing co-localizations of Notch1 with LBPA and LAMP1, respectively. **p<0.01, ***p<0.001 (Student’s t-test; n=100 cells). All bars are mean ± s.e.m.
Figure 5 with 3 supplements
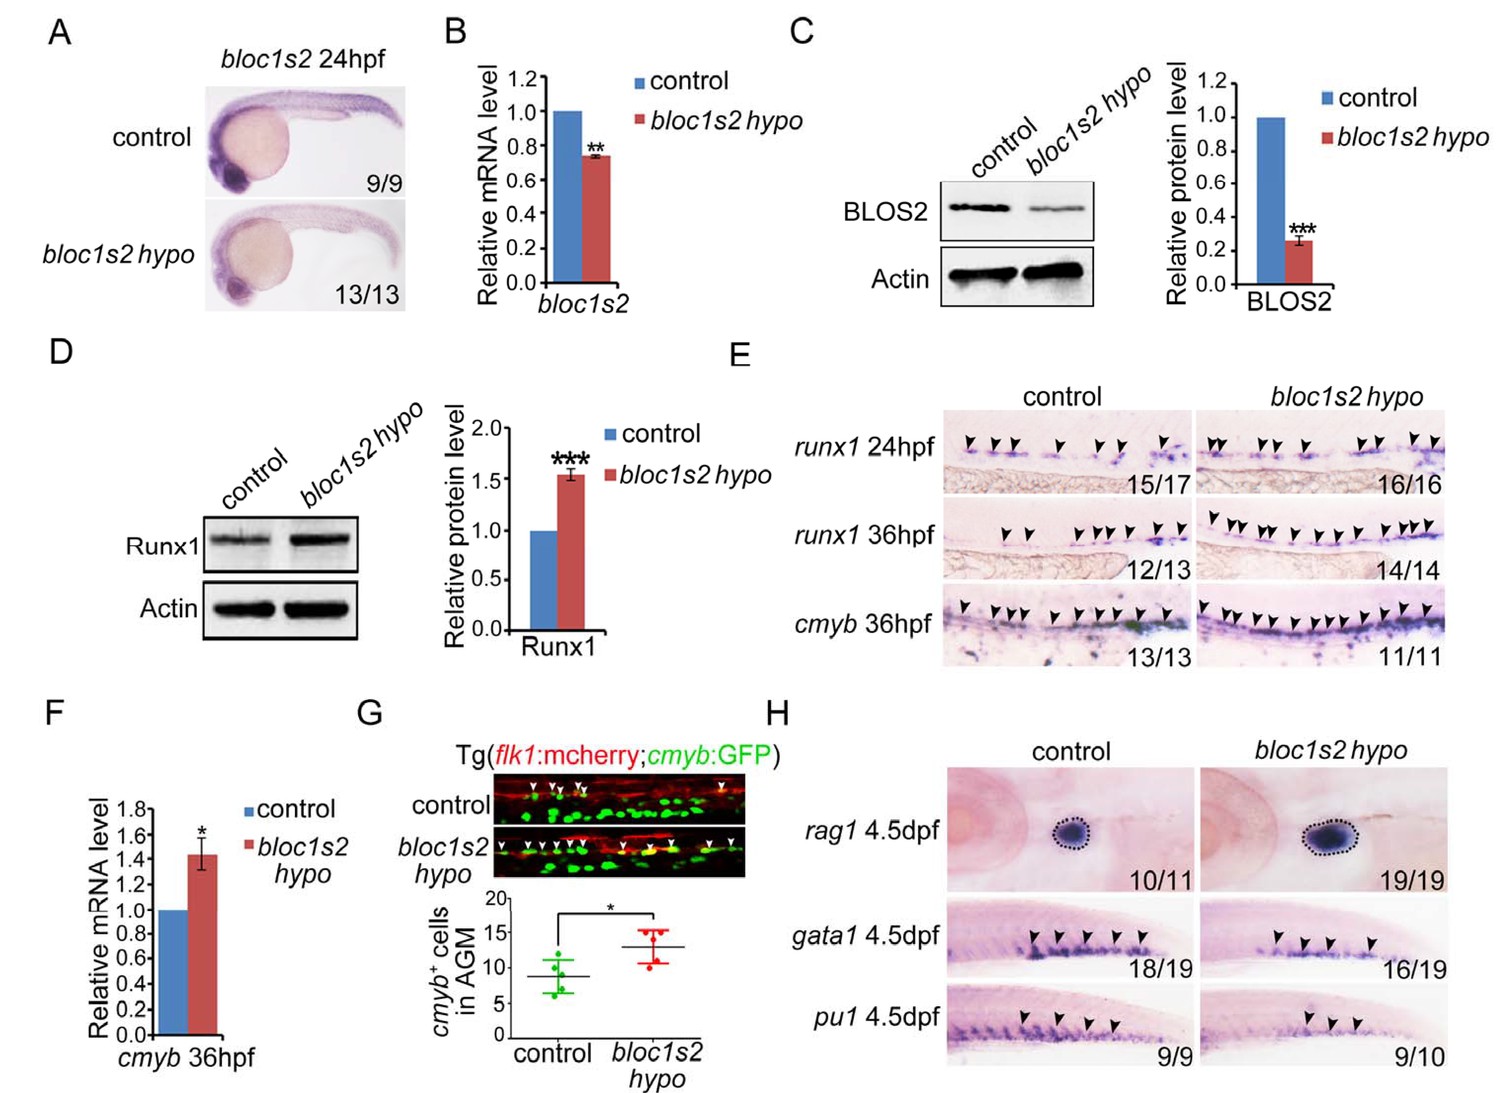
bloc1s2 deficiency promotes HSPC production in zebrafish.
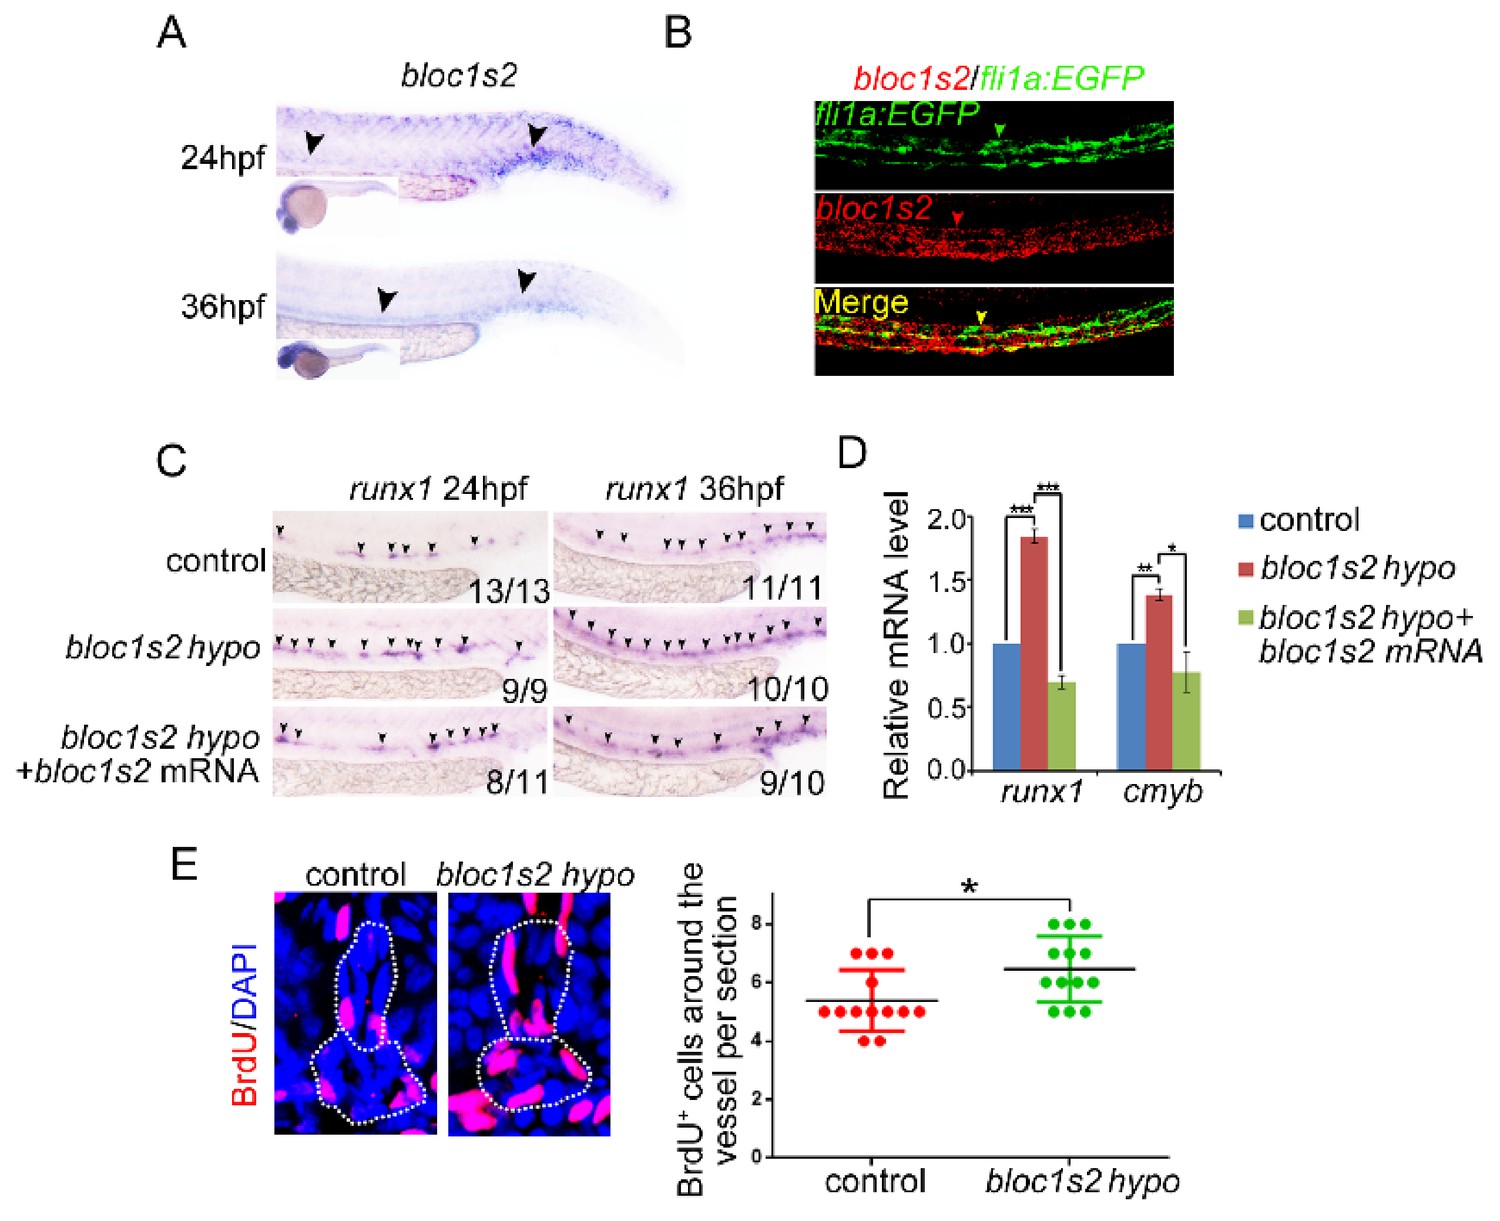
(A-C) The results of (A) whole mount in situ hybridization (WISH), (B) qRT-PCR and (C) immunoblotting (Figure 5—source data 1) showed that the expression of bloc1s2 at the RNA and protein levels in bloc1s2 mutants was decreased but not abolished compared to that in control embryos at 24 hpf. Each bar represents the mean ± s.e.m of three independent experiments. **p<0.01, ***p<0.001 (Student’s t-test). (D) The Runx1 protein level was increased in bloc1s2 mutants (Figure 5—source data 2). The right panel is the quantitative analysis of the western blotting results. Each bar represents the mean ± s.e.m of three independent experiments. ***p<0.001. (E) The WISH results showed that the expression of runx1 at 24 hpf and 36 hpf, and cmyb expression at 36 hpf were increased in bloc1s2 mutants. Black arrowheads mark expression of runx1 and cmyb in the AGM region. (F) qRT-PCR results from the dissected trunk region showed that expression of cmyb at 36 hpf was significantly increased in bloc1s2 mutants. Each bar represents the mean ± s.e.m of three independent experiments. *p<0.05. (G) We generated the bloc1s2 mutants in a Tg (flk1:mcherry;cmyb:GFP) background. The upper panels show that the number of flk1+cmyb+ cells in outcrossed embryos was increased. White arrowheads mark flk1+cmyb+ cells in the AGM region at 36 hpf. The lower panel is the quantitative analysis of the western blotting results. Each bar represents the mean ± s.e.m of seven embryos. **p<0.01. (H) rag1 expression was increased in the thymus region, but gata1 and pu1 expression was decreased in the caudal hematopoietic tissue (CHT) region in bloc1s2 mutants at 4.5 dpf. Black dashed circles mark rag1 expression in the thymus region. Black arrowheads mark expression of gata1 and pu1 in the CHT region.
-
Figure 5—source data 1
Western blots of Figure 5C.
- https://doi.org/10.7554/eLife.18108.020
-
Figure 5—source data 2
Western blots of Figure 5D.
- https://doi.org/10.7554/eLife.18108.021
Figure 5—figure supplement 1
BLOS2 regulation of HSPC development in zebrafish is gene-specific.
(A) WISH results showed the expression of bloc1s2 at 24 hpf and 36 hpf. Black arrowheads mark expression of bloc1s2 in the AGM region and CHT region. (B) Double fluorescence in situ hybridization showed that the expression of bloc1s2 co-localized with that of the endothelial cell marker fli1a. (C) Control and bloc1s2 mutant embryos were injected with bloc1s2 full-length mRNAs. WISH results showed that the increased expression of runx1 in bloc1s2 mutants at 36 hpf was rescued by the overexpression of bloc1s2. (D) qRT-PCR results from the dissected trunk region showed that the increased expression of runx1 and cmyb in bloc1s2 mutants at 24 hpf was rescued by the overexpression of bloc1s2. Each bar represents the mean ± s.e.m of three independent experiments. *p<0.05, **p<0.01, ***p<0.001 (Student’s t-test). (E) The left panel showed the BrdU assay in the frozen sections of control and bloc1s2 mutants at 36 hpf. The white dashed lines label the outline of the dorsal aorta and cardinal vein. The right panel is the quantification of BrdU signals around the vessels per section. Each bar represents the mean ± s.e.m of 13 embryos. *p<0.05.
Figure 5—figure supplement 2
Genome editing of zebrafish bloc1s2 by Cas9 technology.
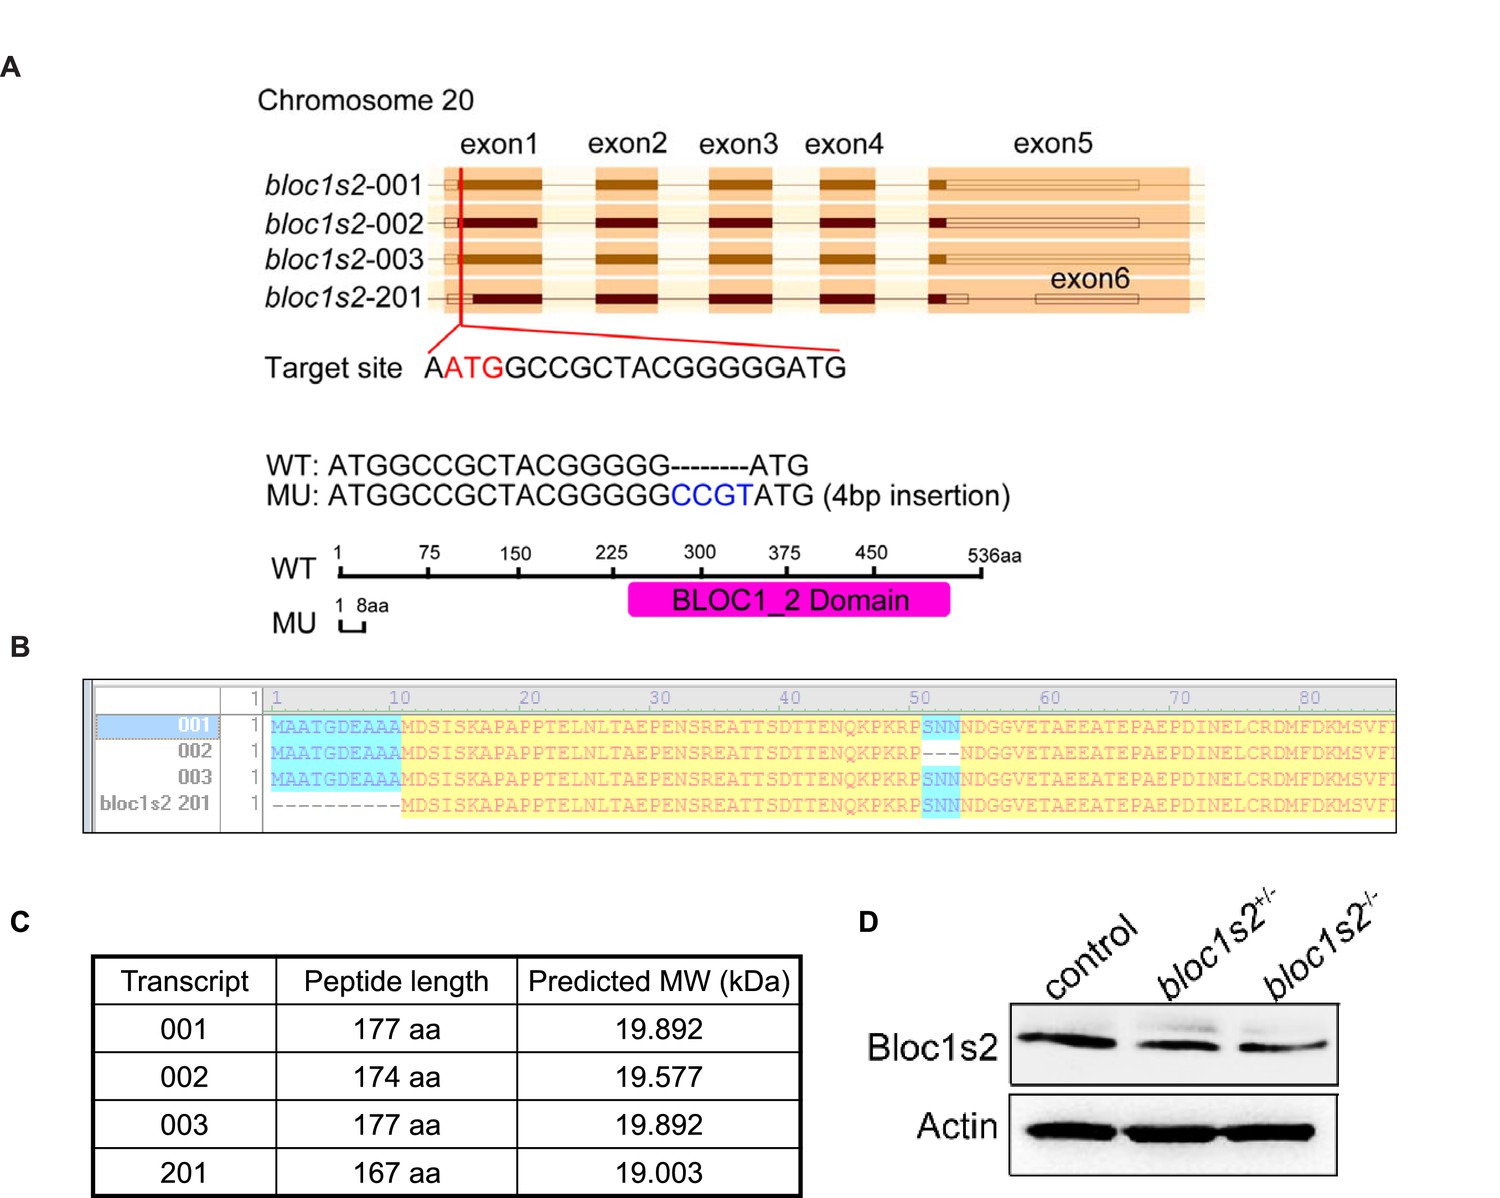
(A) Schematic diagrams of the zebrafish bloc1s2 gene: (top) four potential transcripts from ENSEMBL, gRNA sequence and its target site. (Bottom) Sanger sequencing of PCR amplicons from one fish line indicated that Cas9-mediated mutation at the target site resulted in a CCGT insertion. The homozygous mutants used in this study were all from this fish line and the CCGT insertion resulted in a reading frame shift and a truncated 8 aa peptide for three of bloc1s2 transcripts (001, 002 and 003), but no alteration on the transcript-201. (B) A comparison of the encoded proteins of four bloc1s2 transcripts. Note that the transcript-201 differs from -001 or -003 by missing N-terminal 10 aa. (C) The calculated molecular weights (MWs) of four bloc1s2 isoforms. Note that the protein encoded by transcript-201 is slightly smaller than that encoded by the -001 isoform. (D) BLOS2 was decreased in the AGM region of both bloc1s2+/−and bloc1s2−/− zebrafish (Figure 5—figure supplement 2—source data 1). β-actin was a loading control. Note that the band shown in bloc1s2−/− mutant is likely the isoform-201, therefore designated as bloc1s2 hypo elsewhere.
-
Figure 5—figure supplement 2—source data 1
Western blots of Figure 5—figure supplement 2D.
- https://doi.org/10.7554/eLife.18108.024
Figure 5—figure supplement 3
Increased Notch activity mediates the HSPC phenotype in zebrafish or mouse bloc1s2 mutants.
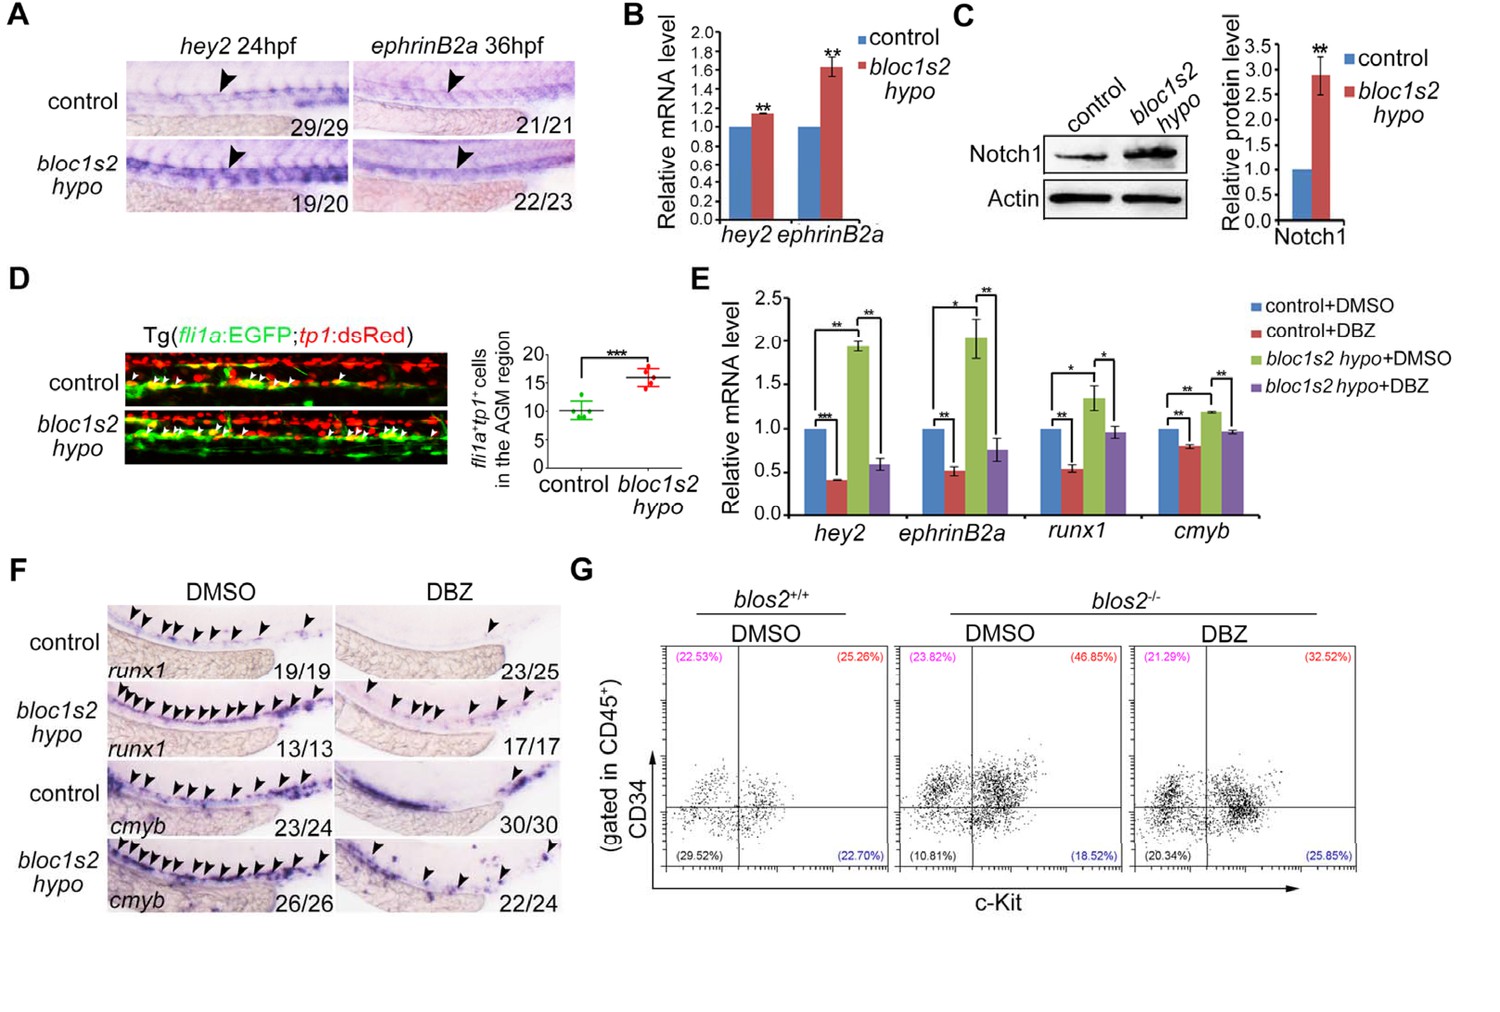
(A) WISH results showed that the expression of Notch targets hey2 and ephrinB2a was increased in the dorsal aorta of bloc1s2 mutants. (B) qRT-PCR results from the dissected trunk region showed that expression of hey2 and ephrinB2a was significantly increased in bloc1s2 mutants. Each bar represents the mean ± s.e.m of three independent experiments. **p<0.01 (Student’s t-test). (C) Western Blot results showed that the protein level of Notch1 was increased in bloc1s2 mutants (Figure 5—figure supplement 3—source data 1). The right panel is the quantitative analysis of the western blotting results. Each bar represents the mean ± s.e.m of three independent experiments. ***p<0.001. (D) We generated bloc1s2 mutants in a Tg (fli1a:EGFP;tp1:dsRed) background. The left panels showed that the number of fli1a+tp1+ cells in bloc1s2 mutant embryos was increased. White arrowheads mark the fli1a+tp1+ cells in the AGM region at 36 hpf. The right panel is the quantification. Each bar represents the mean ± s.e.m of six embryos. **p<0.01. (E) Control and bloc1s2 mutants were treated with 4 μM DMSO or DBZ from 18 hpf to 36 hpf. qRT-PCR results from the dissected trunk region showed that the increased expression of hey2, ephrinB2a, runx1 and cmyb in bloc1s2 mutants at 36 hpf was rescued by the DBZ treatment. Each bar represents the mean ± s.e.m of three independent experiments. *p<0.05, **p<0.01, ***p<0.001. (F) WISH results showed that the increased expression of runx1 and cmyb in bloc1s2 mutants at 36 hpf was rescued by the DBZ treatment. Black arrowheads mark the expression of runx1 and cmyb in the AGM region. (G) DBZ inhibited expansion of c-Kit+CD34+ HSPCs from E11 AGM in Bloc1s2−/− mouse embryos.
-
Figure 5—figure supplement 3—source data 1
Western blots of Figure 5—figure supplement 3C.
- https://doi.org/10.7554/eLife.18108.026
Figure 6

Lysosomal degradation of Notch1 was impaired in mouse and zebrafish Bloc1s2−/− cells.
(A) qRT-PCR analysis for Notch1 of the WT and Bloc1s2−/− dissected cortices at E14.5. No change in Notch1 mRNA levels between WT and Bloc1s2−/− cortices was observed. Data are presented as fold change normalized to the mean of WT. n.s., not significant, p=0.94 (Student’ s t-test; n=9 mice). (B) WT and Bloc1s2−/− MEFs incubated with or without leupeptin (100 µM) or MG132 (10 µM) for 4 hr at 37°C and immunoblotted for Notch1 (NTM) (Figure 6—source data 1). (C and D) Quantification of Notch1 (NTM) relative to that in untreated WT MEFs. **p<0.01; ***p<0.001; n.s., not significant, p=0.876 (n=6). All graphs are mean ± s.e.m. (E) Control and zebrafish bloc1s2 mRNA overexpressing embryos were treated with 50 μM chloroquine from 18 hpf to 36 hpf. The immunoblotting results (Figure 6—source data 2) showed that the decreased Notch1 protein level in bloc1s2 overexpressing embryos was recovered by chloroquine treatment, but not changed by MG132 treatment. (F) Quantitative analysis of the immunoblotting results. Each bar represents the mean ± s.e.m of three independent experiments. *p<0.05; ***p<0.001.
-
Figure 6—source data 1
Western blots of Figure 6B.
- https://doi.org/10.7554/eLife.18108.028
-
Figure 6—source data 2
Western blots of Figure 6E.
- https://doi.org/10.7554/eLife.18108.029
Figure 7 with 1 supplement
The endolysosomal trafficking of Notch1 was altered in Bloc1s2−/− MEFs.
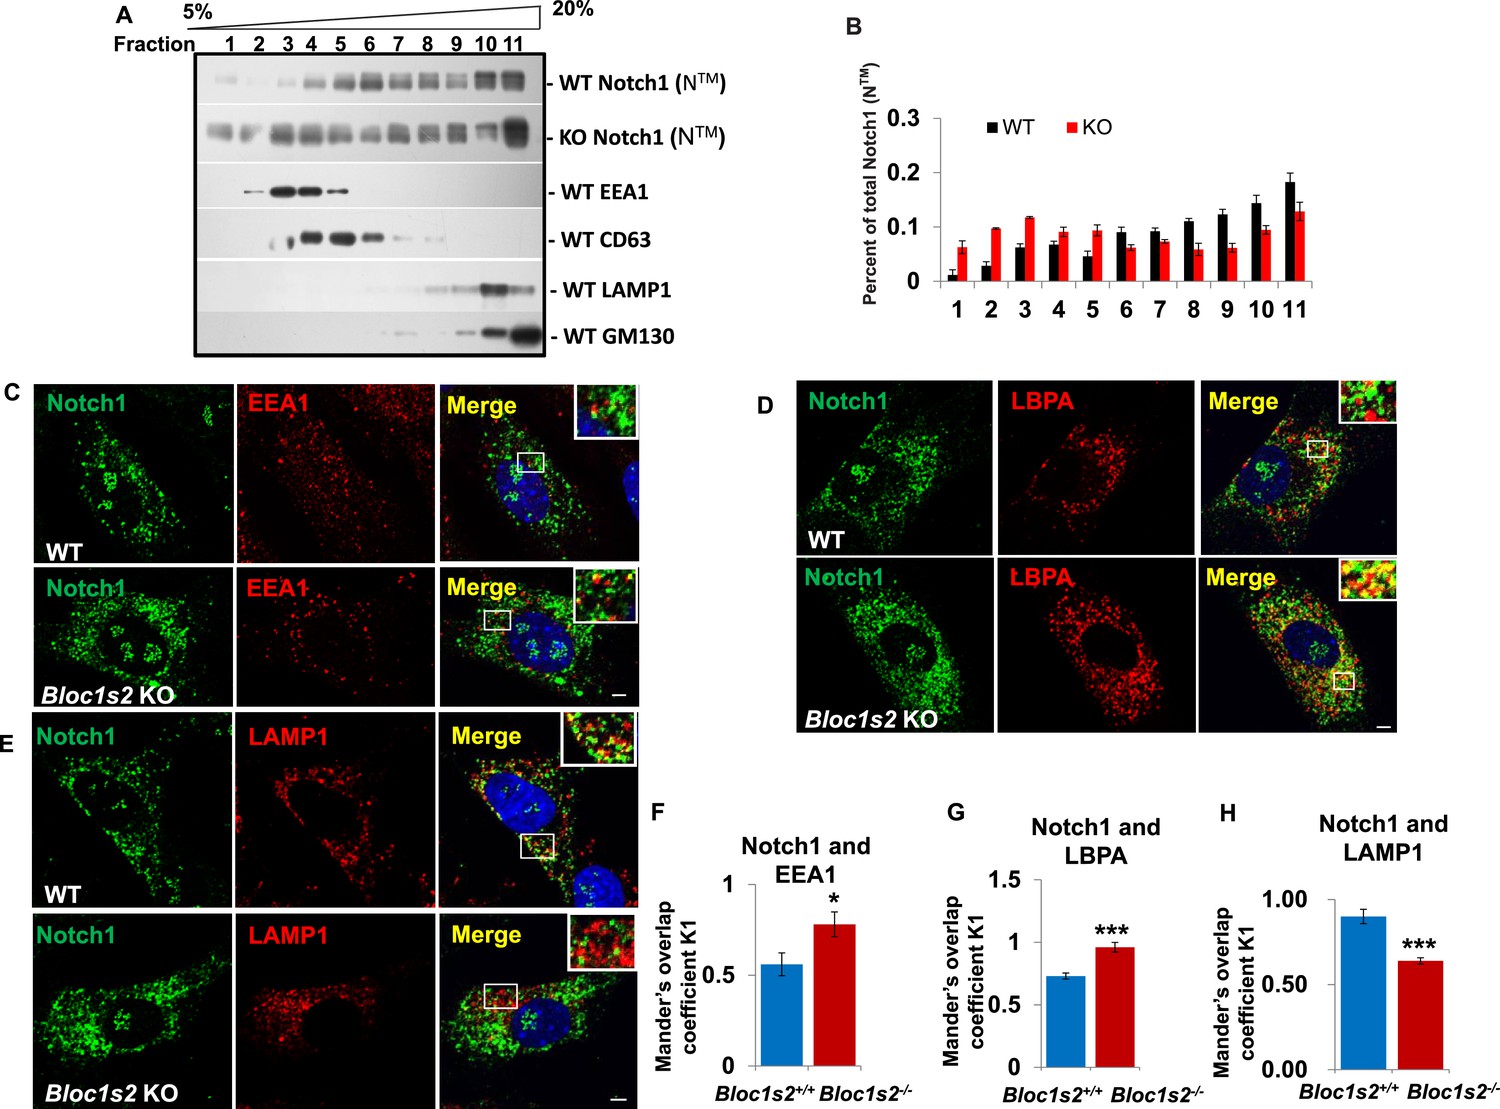
(A) OptiPrep gradient fractionation of WT and Bloc1s2−/− brains at E14.5 probed for Notch1 (NTM), BLOS2, EEA1 (endosome marker), CD63 (MVBs and late endosomes marker), LAMP1 (lysosome marker), and GM130 (Golgi marker) (Figure 7—source data 1). Notch (NTM) distribution exhibited a marked increase in the EEA1- and CD63-labeled fractions in Bloc1s2−/− brain tissues. (B) Quantification of the Notch1 (NTM) in (A) displayed as the proportion in each fraction relative to the total fractions. (C to E) WT and Bloc1s2−/− MEFs immunostained with antibodies against endogenous Notch1 (green) and EEA1/LBPA/LAMP1 (red). This imaging revealed increased endogenous Notch1 localization in EEA1- and LBPA-positive vesicles, and decreased Notch1 localization in LAMP1-labeled vesicles in Bloc1s2−/− MEFs. Scale bars: 5 μm. (F to H) Quantification of Mander’s overlap coefficient K1 representing co-localizations of Notch1 with EEA1 and LBPA and LAMP1, respectively. *p<0.05, ***p<0.001 (Student’s t-test; n=100 cells). All graphs are mean ± s.e.m.
-
Figure 7—source data 1
Western blots of Figure 7A.
- https://doi.org/10.7554/eLife.18108.031
Figure 7—figure supplement 1
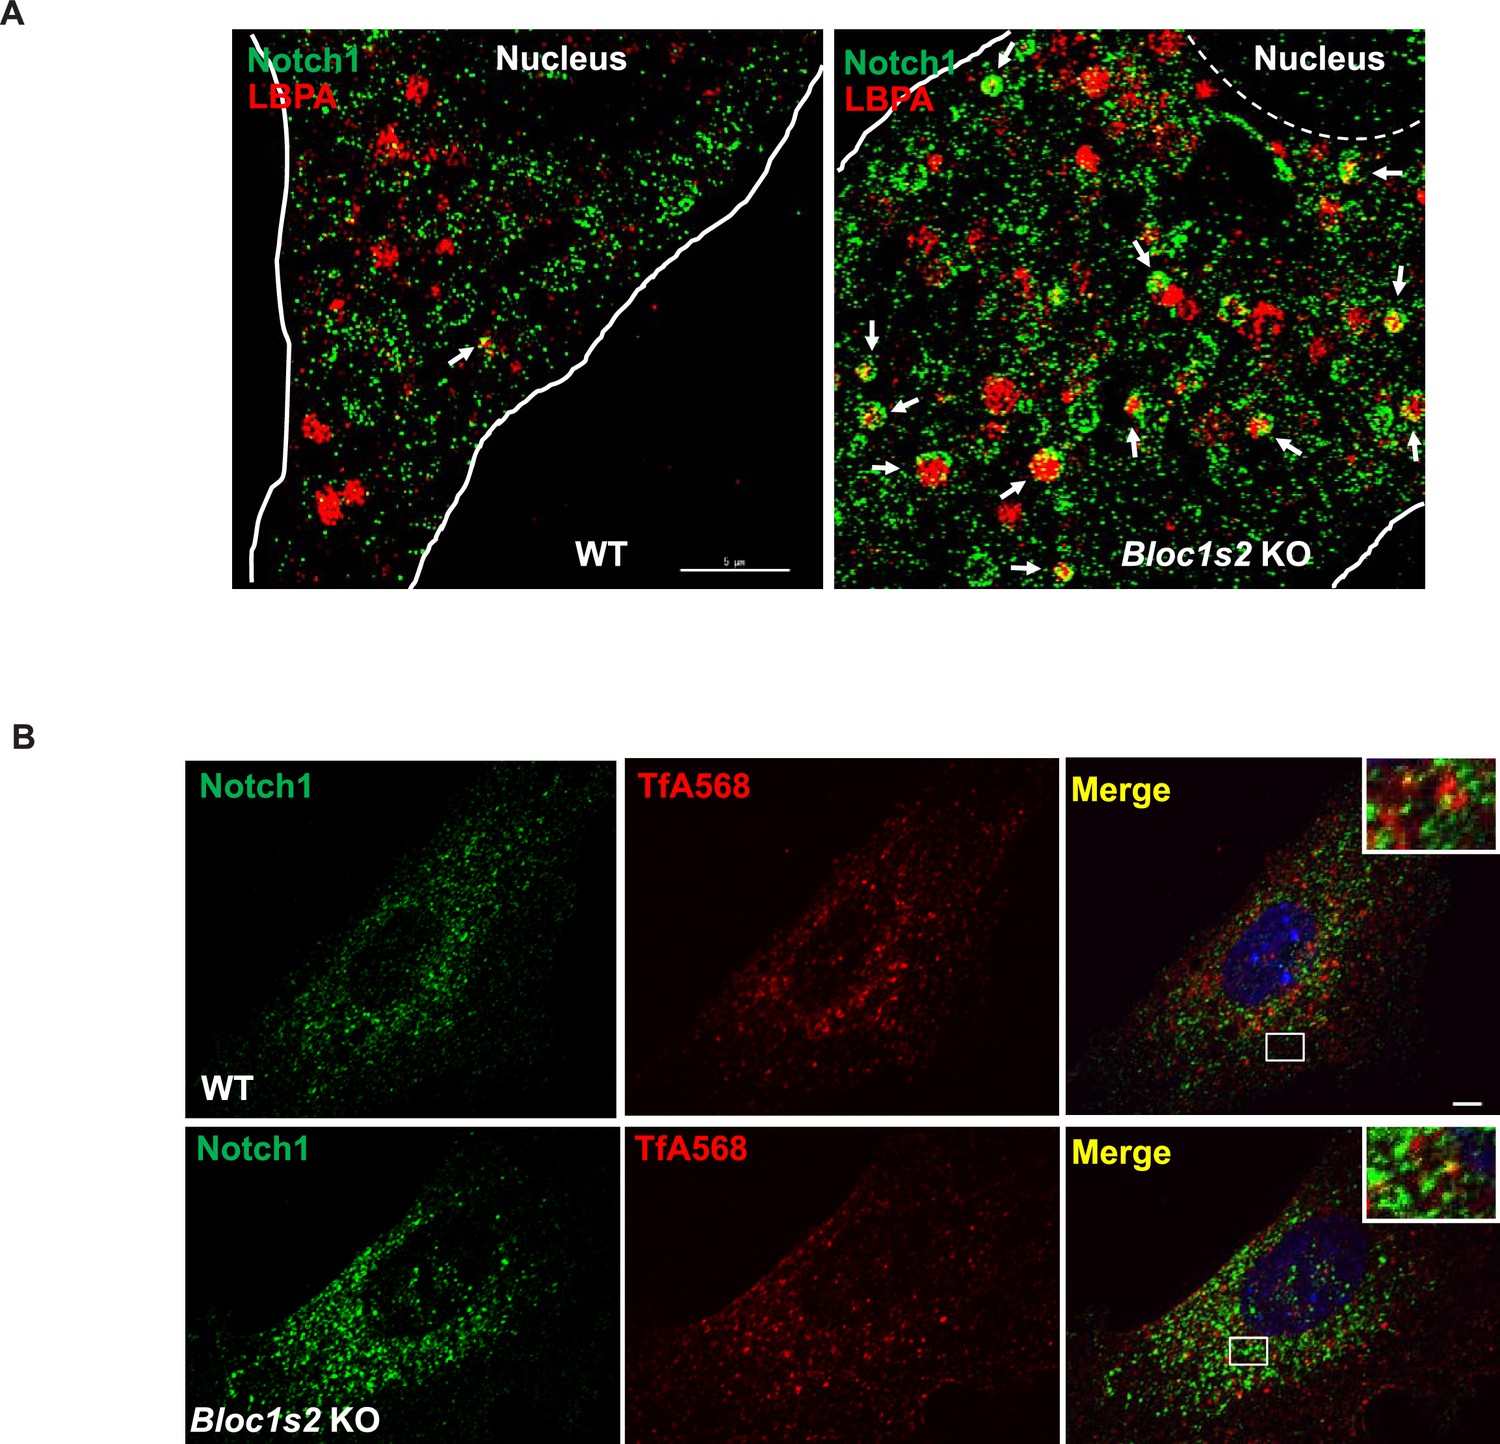
Subcellular localization of Notch1 in late endosomes and recycling endosomes.
(A) Double labeling of Notch1 (green) and LBPA (red) in WT and Bloc1s2−/− MEFs imaged by structured illumination microscopy (SIM). Arrows point out the accumulation of Notch1 receptor in LBPA-positive vesicles. Scale bar: 5 μm. (B) WT and Bloc1s2−/− MEFs that had internalized TfA568 for 30 min were immunostained with antibodies against endogenous Notch1. No apparent change in the localization of Notch1 in TfA568-positive vesicles was observed.
Figure 8 with 3 supplements
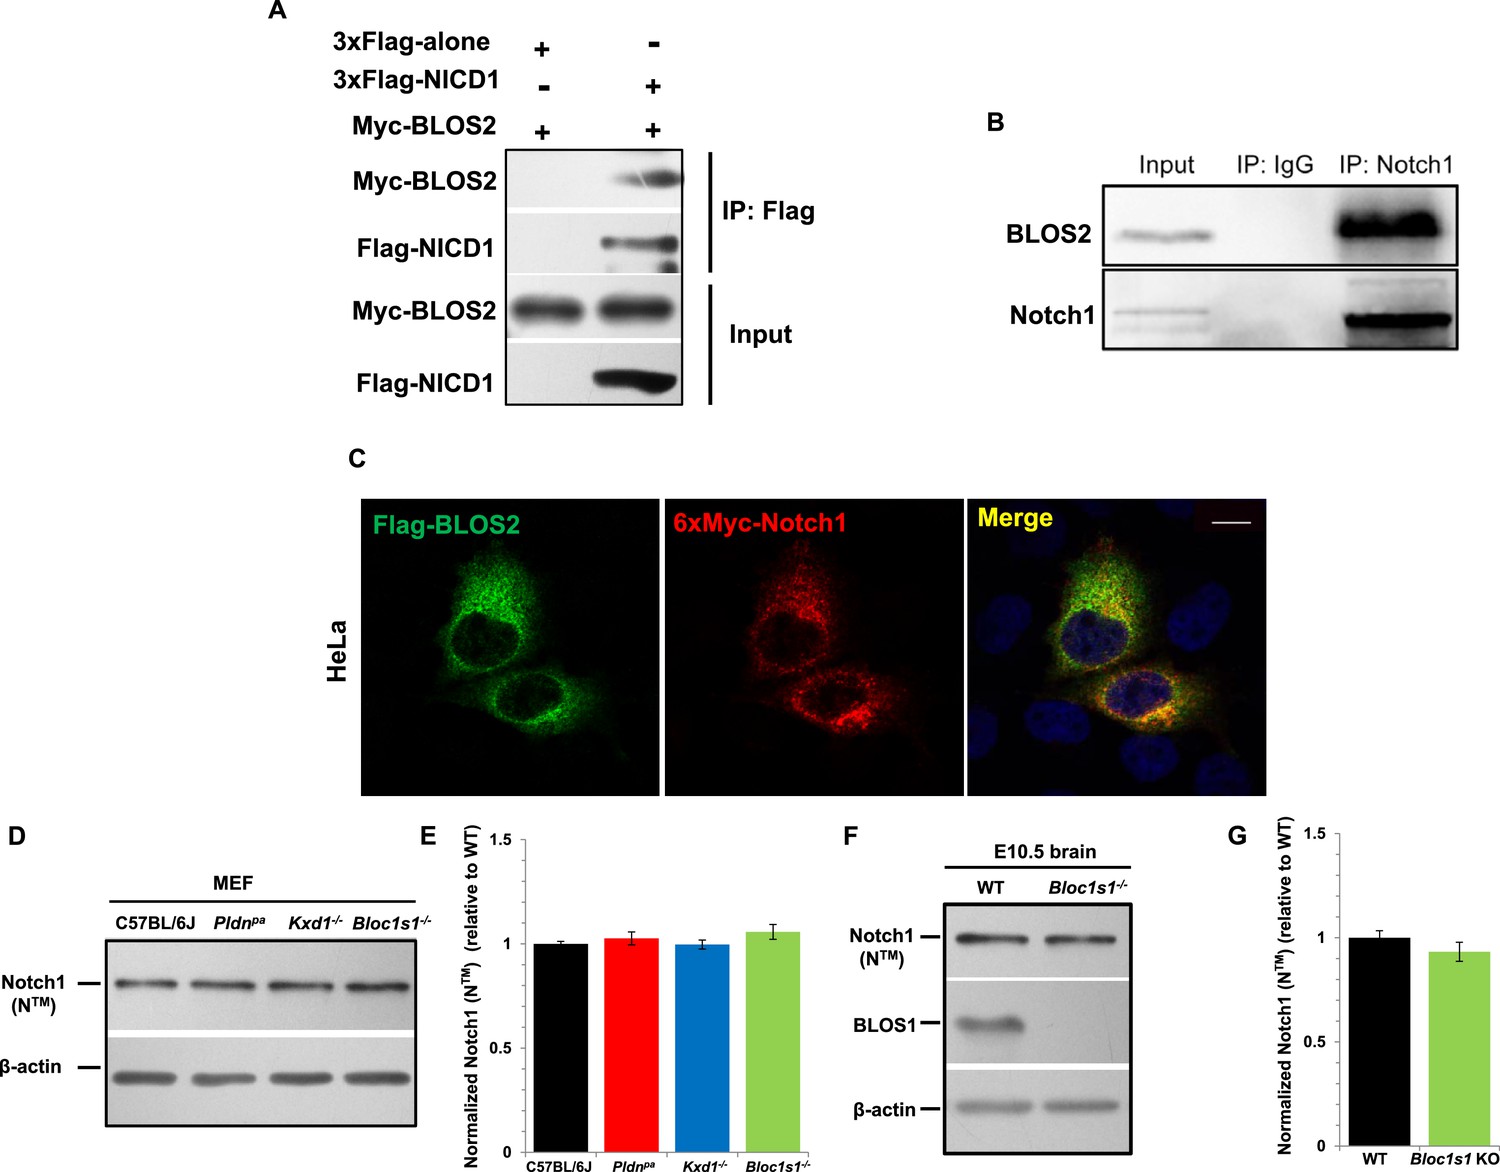
BLOS2 physically interacts with NICD1 and functions independently of BLOC-1 and BORC.
(A) Immunoblotting analysis of Co-IP performed in HEK293T cells. Flag-NICD1 co-eluted with Myc-BLOS2, but Flag-alone did not (Figure 8—source data 1). (B) Endogenous co-immunoprecipitation of Notch1 with BLOS2 in the AGM region (Figure 8—source data 2). IP, immunoprecipitation. (C) Partial colocalization of BLOS2 and Notch1 in HeLa cells transfected with the Flag-BLOS2 and 6×Myc-Notch1 constructs. Scale bar: 5 μm. (D) Immunoblotting analysis of Notch1 (NTM) in WT, Pldnpa, Kxd1-KO, and Bloc1s1-KO MEFs (Figure 8—source data 3). No changes in Notch1 (NTM) levels in Pldnpa, Kxd1-KO, and Bloc1s1-KO MEFs were observed. (E) Quantification of levels of Notch1 (NTM) relative to WT MEFs. Data are presented as fold change normalized to the mean of WT. p=0.457 (Pldnpa), p=0.901 (Kxd1-KO), p=0.178 (Bloc1s1-KO) (Student’s t-test; n=9). (F) Immunoblotting analysis of Notch1 (NTM) in brain extracts derived from WT and Bloc1s1−/− mice at E10.5 (Figure 8—source data 4). No change in Notch1 (NTM) levels in the Bloc1s1−/− cortex lysates was observed. (G) Quantification of Notch1 (NTM) relative to WT cortex. Data are presented as fold change normalized to the mean of WT. p=0.264 (Student’s t-test; n=9).
-
Figure 8—source data 1
Western blots of Figure 8A.
- https://doi.org/10.7554/eLife.18108.034
-
Figure 8—source data 2
Western blots of Figure 8B.
- https://doi.org/10.7554/eLife.18108.035
-
Figure 8—source data 3
Western blots of Figure 8D.
- https://doi.org/10.7554/eLife.18108.036
-
Figure 8—source data 4
Western blots of Figure 8F.
- https://doi.org/10.7554/eLife.18108.037
Figure 8—figure supplement 1
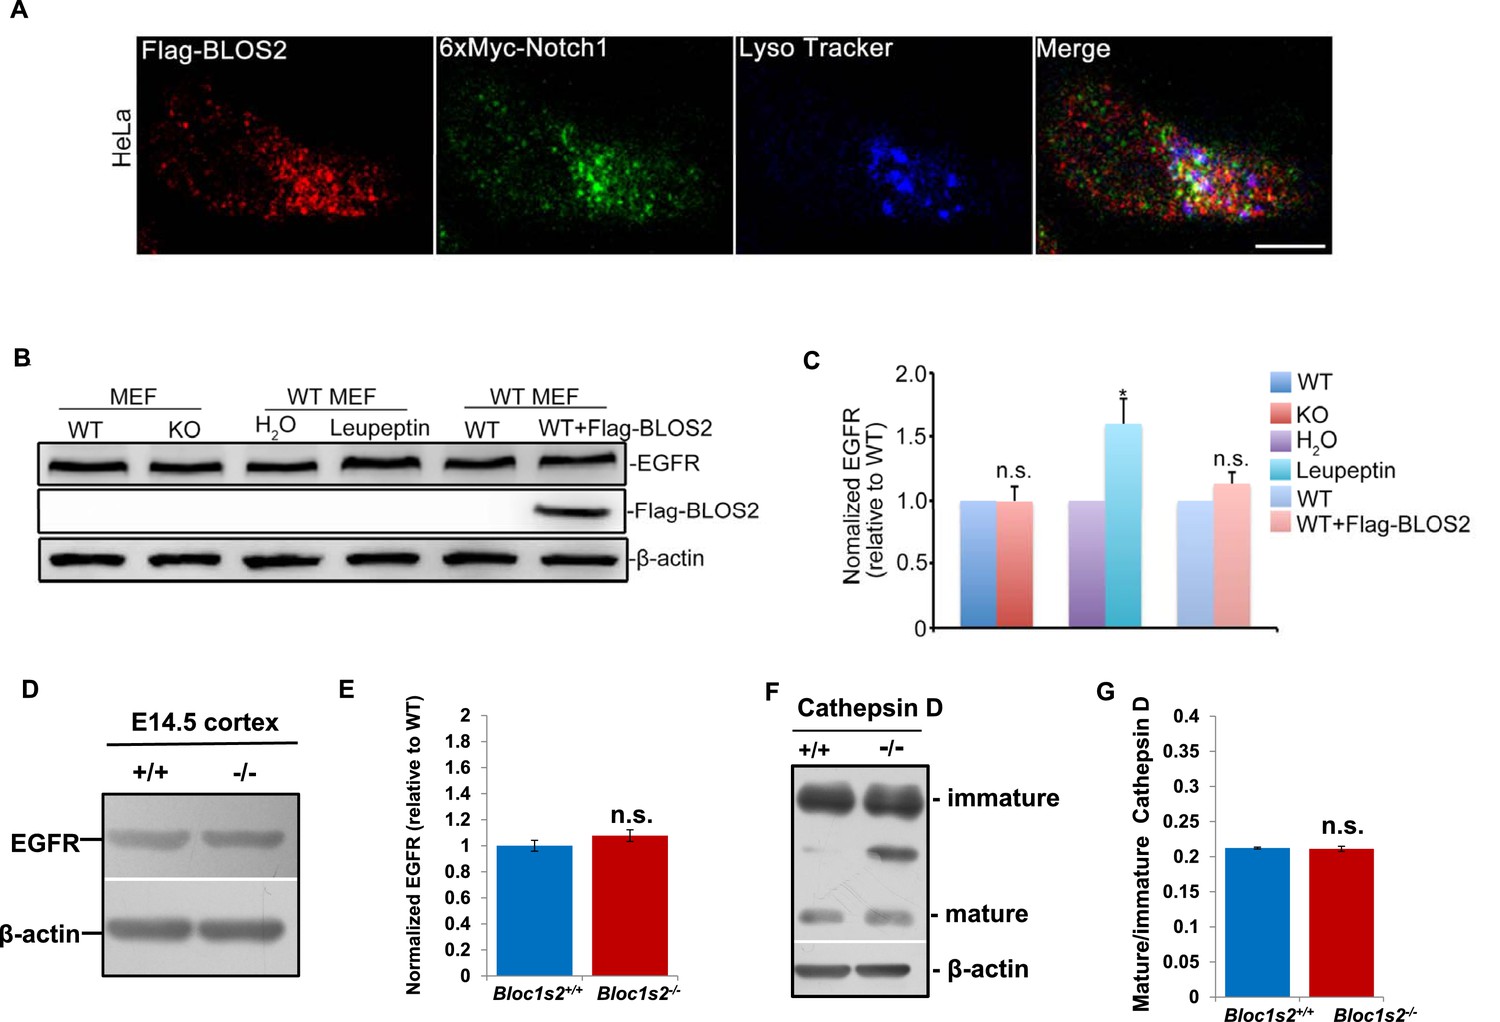
Unaltered lysosomal functions and EGFR steady-state levels in Bloc1s2−/− MEFs or tissues.
(A) Partial colocalization of BLOS2, Notch1 and LysoTracker in HeLa cells transfected with the Flag-BLOS2 and 6×Myc-Notch1 constructs. Scale bar: 10 μm. (B) Immunoblotting analysis of EGFR (Figure 8—figure supplement 1—source data 1). No changes in EGFR levels in WT and Bloc1s2−/− MEFs were observed, while in the control group, significantly increased EGFR resulted from leupeptin (100 µM) treatment. (C) Quantification of EGFR relative to that in untreated WT MEFs. *p<0.05 (H2O vs. leupeptin); n.s., not significant, p=0.933 (WT vs. KO), p=0.131 (WT vs. WT+Flag-BLOS2) (Student’s t-test; n=3). All graphs are mean ± s.e.m. (D) Immunoblotting analysis of EGFR in cortical extracts from WT and Bloc1s2−/− mice at E14.5 (Figure 8—figure supplement 1—source data 2). (E) Quantification of EGFR relative to WT cortex. Data are presented as fold change normalized to the mean of WT ± s.e.m. p=0.235, n.s., not significant (n=9). (F) Immunoblotting analysis of cathepsin D in WT and Bloc1s2−/− MEFs (Figure 8—figure supplement 1—source data 3). There were no apparent changes of immature and mature forms of cathepsin D protein levels between WT and Bloc1s2−/− MEFs. (G) Ratio of mature versus immature cathepsin D in WT and Bloc1s2−/− MEFs by quantifying the related bands on the western blots in A. p=0.766, n.s., not significant (n=3).
-
Figure 8—figure supplement 1—source data 1
Western blots of Figure 8—figure supplement 1B.
- https://doi.org/10.7554/eLife.18108.039
-
Figure 8—figure supplement 1—source data 2
Western blots of Figure 8—figure supplement 1D.
- https://doi.org/10.7554/eLife.18108.040
-
Figure 8—figure supplement 1—source data 3
Western blots of Figure 8—figure supplement 1F.
- https://doi.org/10.7554/eLife.18108.041
Figure 8—figure supplement 2
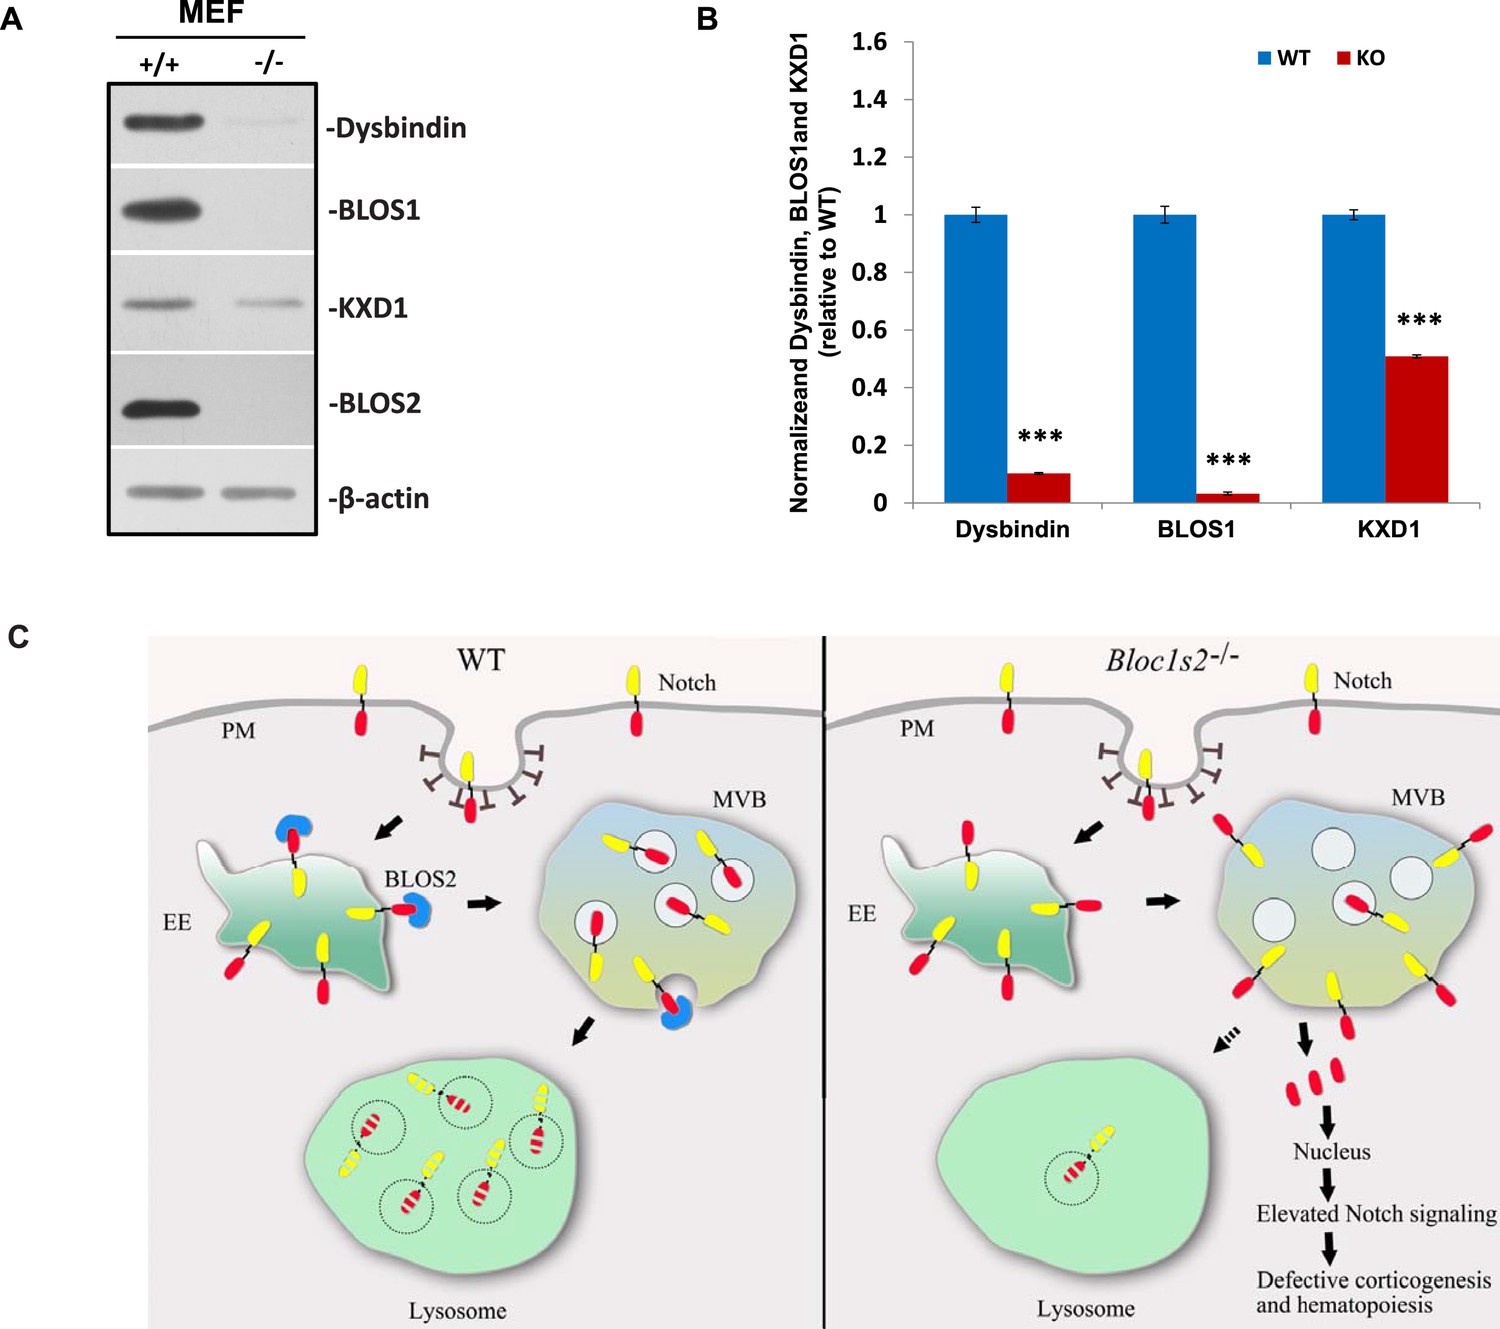
Destabilization of other BLOC-1 or BORC subunits in Bloc1s2−/− MEFs and schematic model of lysosomal degradation of Notch1 mediated by BLOS2.
(A) Immunoblot analysis of dysbindin, BLOS1, and KXD1 in WT and Bloc1s2−/− MEFs (Figure 8—figure supplement 2—source data 1). The levels of dysbindin and BLOS1 were destabilized and KXD1 was significantly reduced in Bloc1s2−/− MEFs. (B) Quantification of levels of dysbindin, BLOS1, and KXD1 relative to WT MEFs. Data are presented as fold change normalized to the mean of WT. ***p<0.001 (Student’s t-test; n=9). (C) A proposed model. In WT cells, BLOS2 is required for the lysosomal degradation of Notch1. The Notch1 receptor is endocytosed to early endosomes, where the receptor is either trafficked back to the membrane by recycling endosomes or it is directed to lysosomal degradation through MVBs and late endosomes. However, in the mutant cells, loss of BLOS2 results in impaired endo-lysosomal trafficking of Notch1. Consequently, a large fraction of Notch1 accumulates in the MVBs and late endosomes, where active NICD1 (red) is produced. This enhanced activation of Notch signaling probably causes the defective embryonic corticogenesis in the mutant mice. PM, plasma membrane; EE, early endosome; MVB, multivesicular bodies.
-
Figure 8—figure supplement 2—source data 1
Western blots of Figure 8—figure supplement 2A.
- https://doi.org/10.7554/eLife.18108.043
Figure 8—figure supplement 3
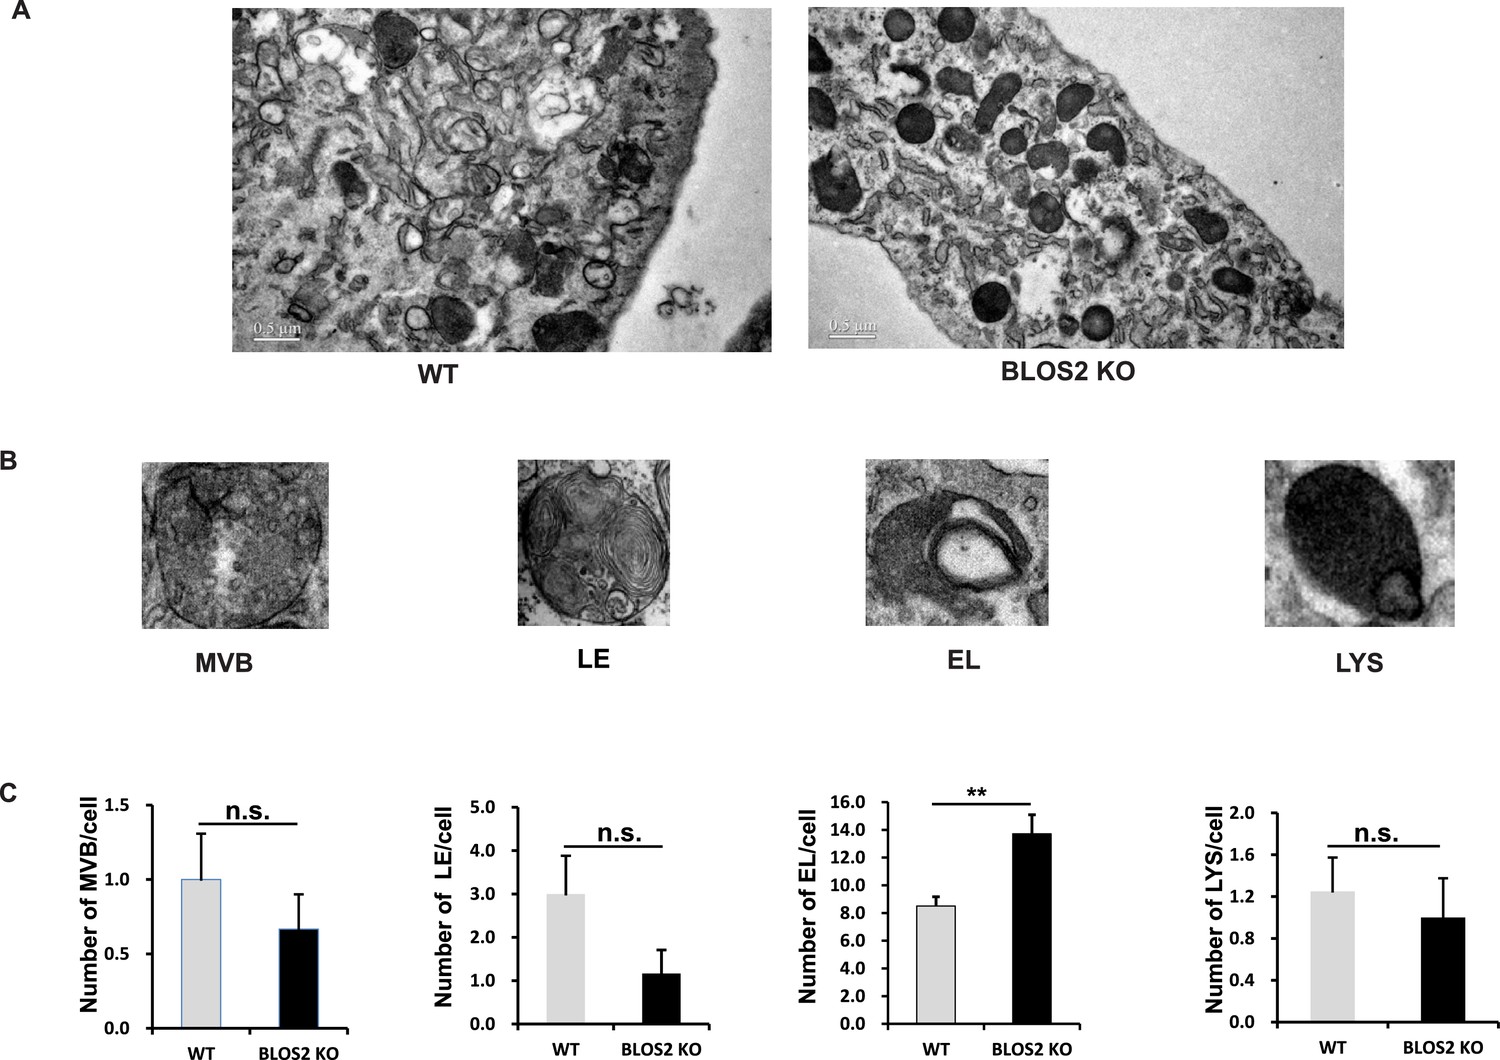
Ultrastructures of endo-lysosomal organelles.
(A) Representative EM pictures of WT and BLOS2-KO MEFs. Scale bars, 0.5 μm. (B) Representative enlarged pictures of endo-lysosomal organelles. The definition of these organelles follows the description in Zhang et al. (2014a). EL: endolysosome; LE: late endosome; LYS: lysosome; MVB: multivesicular body. (C) Quantitative data comparing the number of endo-lysosomal organelles per cell between WT and BLOS2-KO MEFs. n.s., not significant (MVB: p=0.668; LE: p=0.143; LYS: p=0.780); **p<0.01 (Student’s t-test); n=7 cells.
Additional files
-
Supplementary file 1
A comparison of phenotypes for BLOS2-KO, BLOS1-KO and Snapin-KO mouse embryos or MEFs.
- https://doi.org/10.7554/eLife.18108.045
-
Supplementary file 2
The PCR primers used in quantitative PCR assay.
- https://doi.org/10.7554/eLife.18108.046
Download links
A two-part list of links to download the article, or parts of the article, in various formats.
Downloads (link to download the article as PDF)
Open citations (links to open the citations from this article in various online reference manager services)
Cite this article (links to download the citations from this article in formats compatible with various reference manager tools)
BLOS2 negatively regulates Notch signaling during neural and hematopoietic stem and progenitor cell development
eLife 5:e18108.
https://doi.org/10.7554/eLife.18108


