A genomic lifespan program that reorganises the young adult brain is targeted in schizophrenia
- University of Edinburgh, United Kingdom
Figures
Figure 1 with 1 supplement
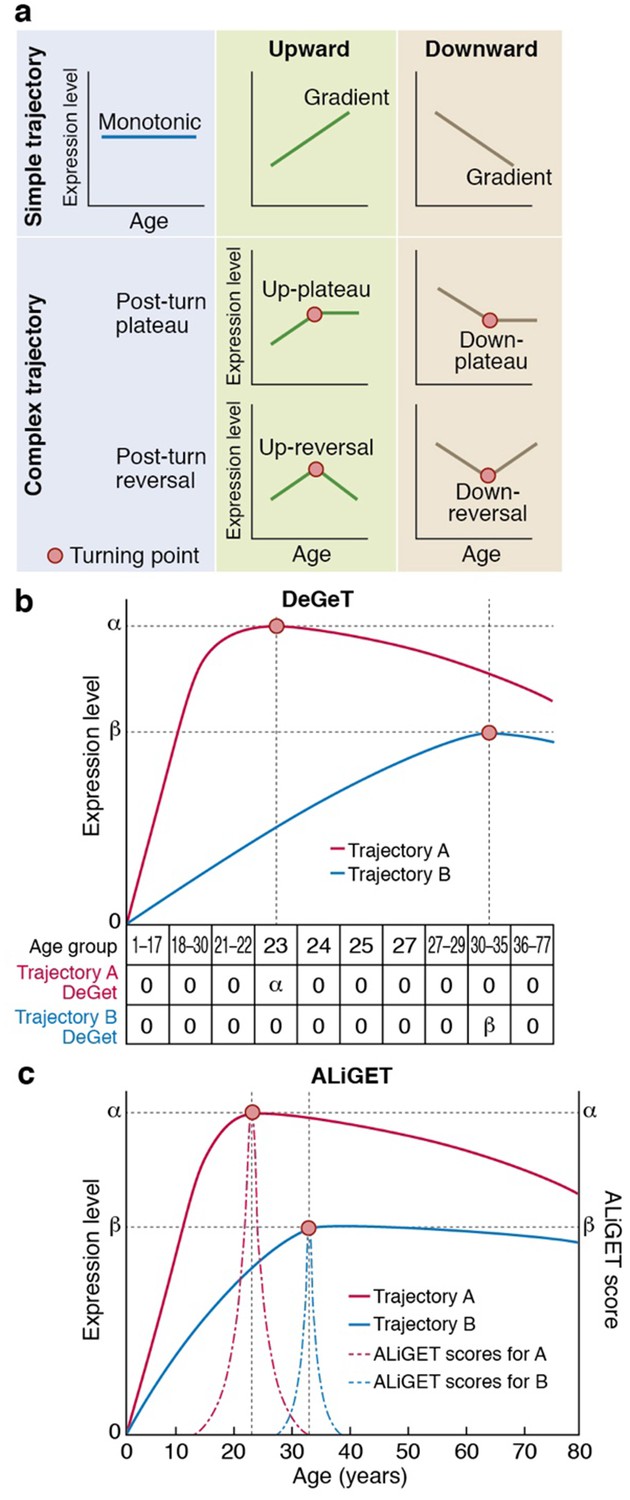
Gene expression trajectories can be classified and quantified based on the characteristics of their turning points (TTTPs).
(a) Simple trajectories (upper panel) do not contain TTTPs (red dots) whereas complex trajectories (lower panel) contain a TTTP. Complex trajectories are further classified according into those that plateau or reverse direction after the TTTP. Upward and Downward classification refers to the initial direction of the trajectory. (b) and (c). Examples of the application of the DeGeT (b) and ALiGeT (c) methods applied to two trajectories (A, shown in red; turns at 23 years of age and has a greater fold change than B, shown in blue, which turns at 33 years). The change in expression (ΔE) prior to the turning point is denoted as α and β for trajectories A and B respectively. (b) The DeGeT scoring system generates a score for each of 10 groups of ages, where each group contains a similar number of TTTPs. Trajectory A receives a DeGeT score of α in the age group spanning 23 years and zero in all other ages. Similarly, trajectory B receives a score of β only in age group 30–35. (c) The ALiGeT scoring system generate a score for each year of age and decays the contribution of ΔE as a function of distance from the TTTP (see dotted ALiGeT scores that peak at α and β and rapidly decay at ages either side of this peak).
Figure 1—figure supplement 1
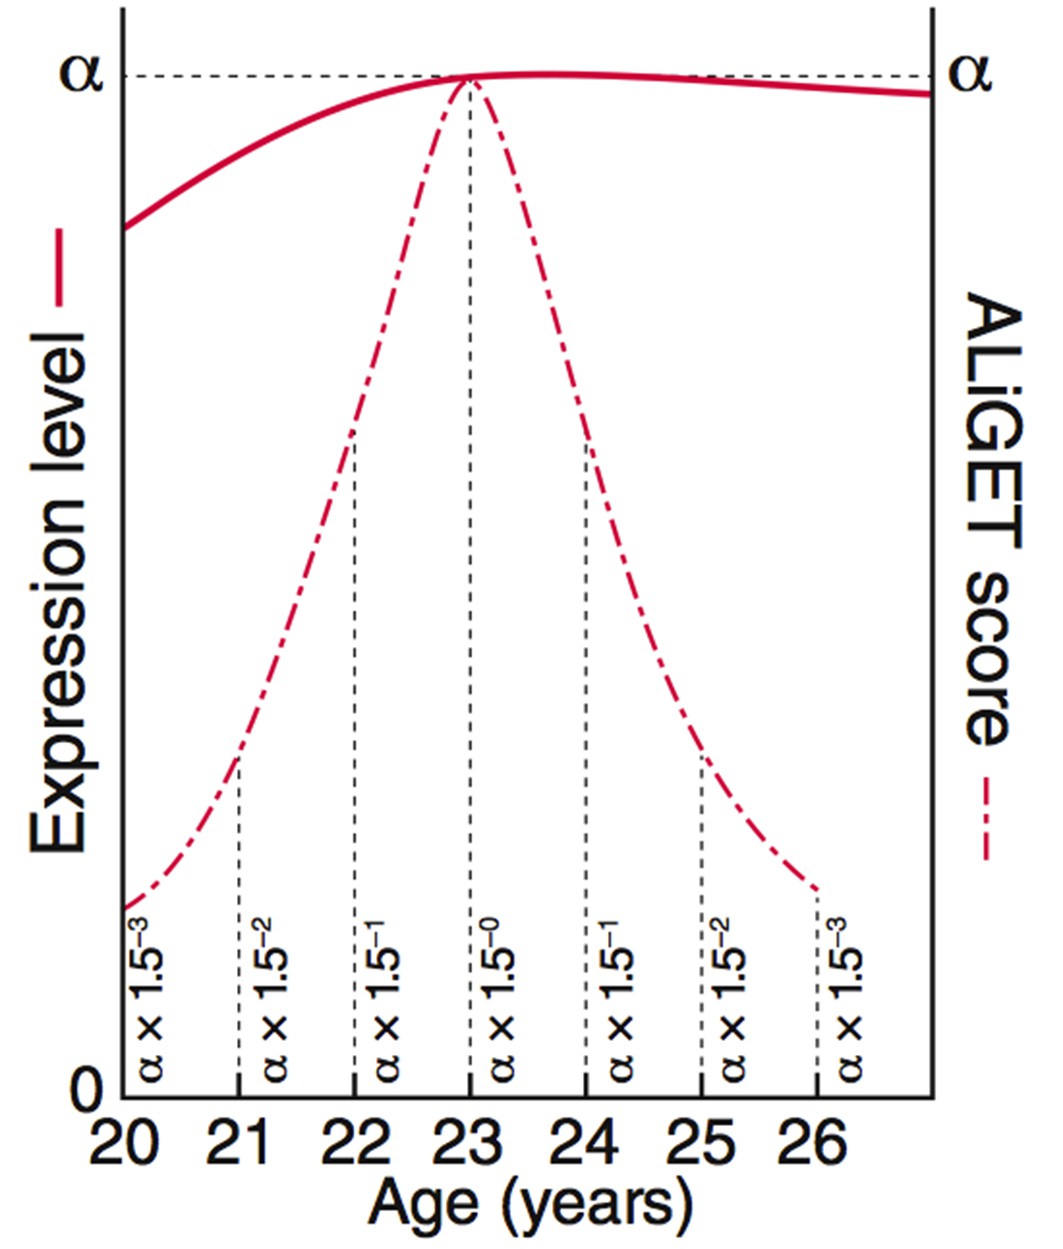
ALiGeT scoring assigns a score to each gene for each year of age.
The value decays further with increasing distance from the year at which the turning point occurs. This diagram shows the equations and graphs for how the scores (dashed red line) decay for a specific example trajectory (solid red line).
Figure 2 with 3 supplements
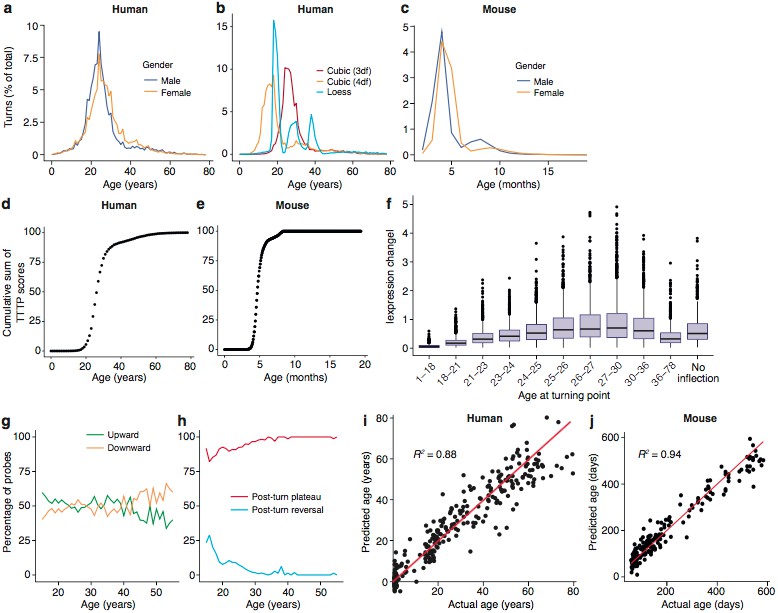
Trajectories and turning points characterise brain age.
(a) Percentage of TTTPs at each age of human lifespan. Mean age is 26.0 years for males and 27.5 years for females. (b) Percentage of TTTPs at each age of human lifespan using three different methods for fitting splines. Mean age is 31.3 years using cubic splines with 3 degrees of freedom, 21.6 years using cubic splines with 4 degrees of freedom and 25.2 years using Loess regression. (c) Percentage of TTTPs at each age of mouse. Mean age is 156 days for males and 165 days for females. (d) Cumulative sum of TTTP scores for every year of life in the Braincloud dataset. (e) Cumulative sum of TTTP scores for every year of life in the mouse hippocampus dataset. (f) The TTTPs for genes with the greatest expression changes prior to the TTTP (ΔE) were concentrated around the late-twenties. (g) Percentage of probes associated with TTTPs that up- or down-regulate prior to turning. (h) Percentage of probes with TTTPs which plateau or reverse after turning. (i) and (j). Age of individual mice and humans can be accurately predicted using a Support Vector Machine trained on the expression data. Individual points represent each mRNA sample.
Figure 2—figure supplement 1
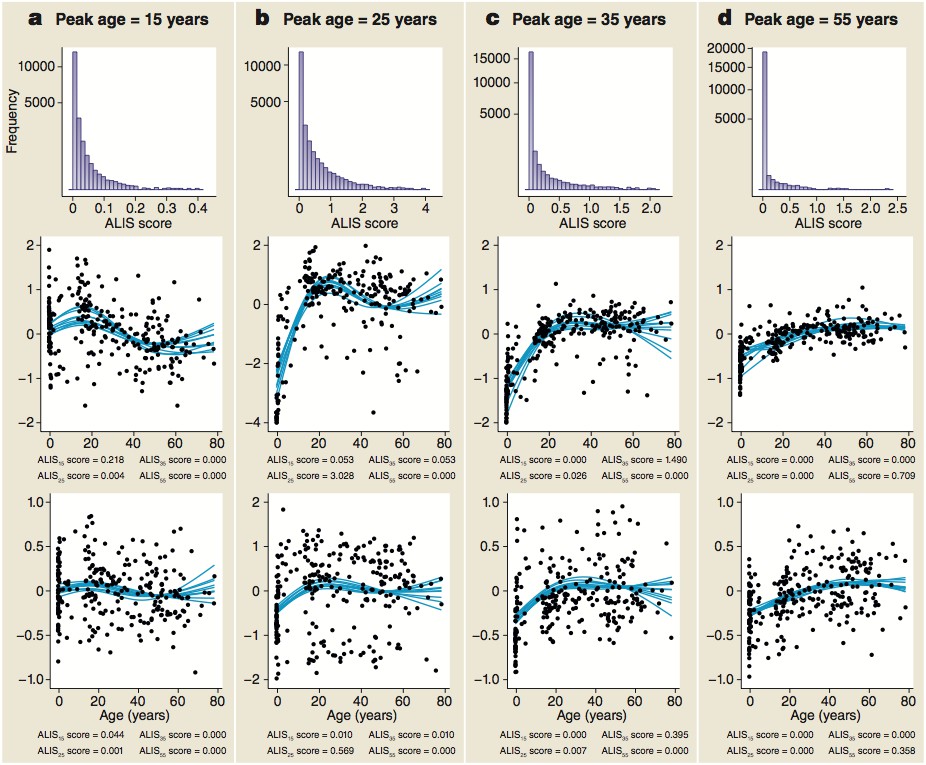
Distribution of ALiGeT scores at 15 (a), 25 (b), 35 (c) and 55 years (d) along with examples of trajectories, their scores and expression data.
The top row of panels shows the frequency distribution of ALiGeT scores. The second row of panels shows the ten interpolated trajectories with highest scores that upregulate prior to turning. Beneath each graph is a list of the four mean scores for these trajectories at the four representative ages. The third row of panels shows ten trajectories with low scores (below the median). Beneath each graph is a list of the four mean scores for these trajectories at the four representative ages. The data points shown in the second and third rows of panels are the individual data points used to generate one of the trajectories shown as a line.
Figure 2—figure supplement 2

the mouse samples are divided amongst two background strains (C57Bl/6 and 129s5) and two sexes, and range from 58 to 600 days of age, whilst human samples are from both sexes and span almost 80 years.
(a) The distribution of mice from different background strains is balanced with respect to age, whilst (b) shows the same for sex. (c) The age of the Braincloud human samples from each sex.
Figure 2—figure supplement 3
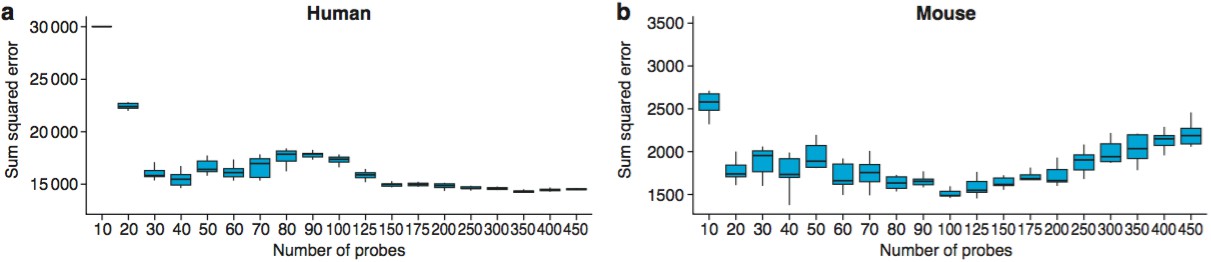
The optimal number of probes to use for age predictions was 40 in humans (a) and 100 in mice (b).
These graphs show the Sum Squared Errors found when 10 training/test runs are performed for each value of Ncutoff.
Figure 3
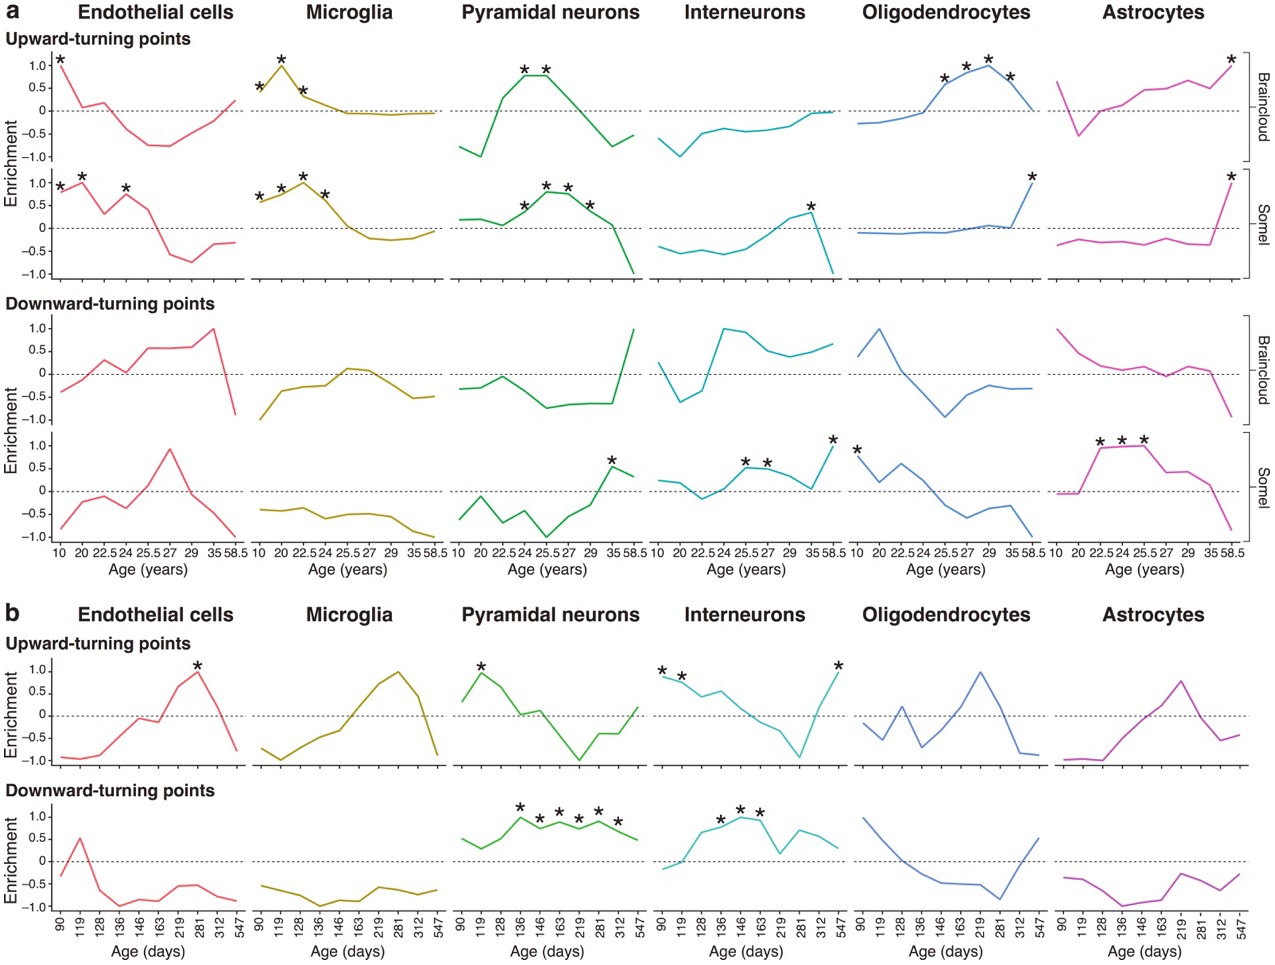
Genes associated with high levels of expression in particular cell types are enriched at different stages of the human and mouse lifespan.
(a) Expression Weighted Cell-type Enrichments (EWCE) for the top 10% of genes with largest DeGeT scores within each age window for the human prefrontal cortex. Enrichments were calculated separately for the Somel (Somel et al., 2009) and Braincloud (Colantuoni et al., 2011) datasets. Enrichment values represent how far the mean cellular expression level within the target list is from the mean value for the bootstrapped lists (in terms of standard deviations); these values have been scaled to have a maximal value of either 1 or −1 within each age window. X-axis labels mark the mean age for each of the age windows. Asterisks mark those enrichments that are significant after Bonferroni correction with p<0.05. (b) Analysis as in (a) on mouse hippocampus.
Figure 4 with 1 supplement
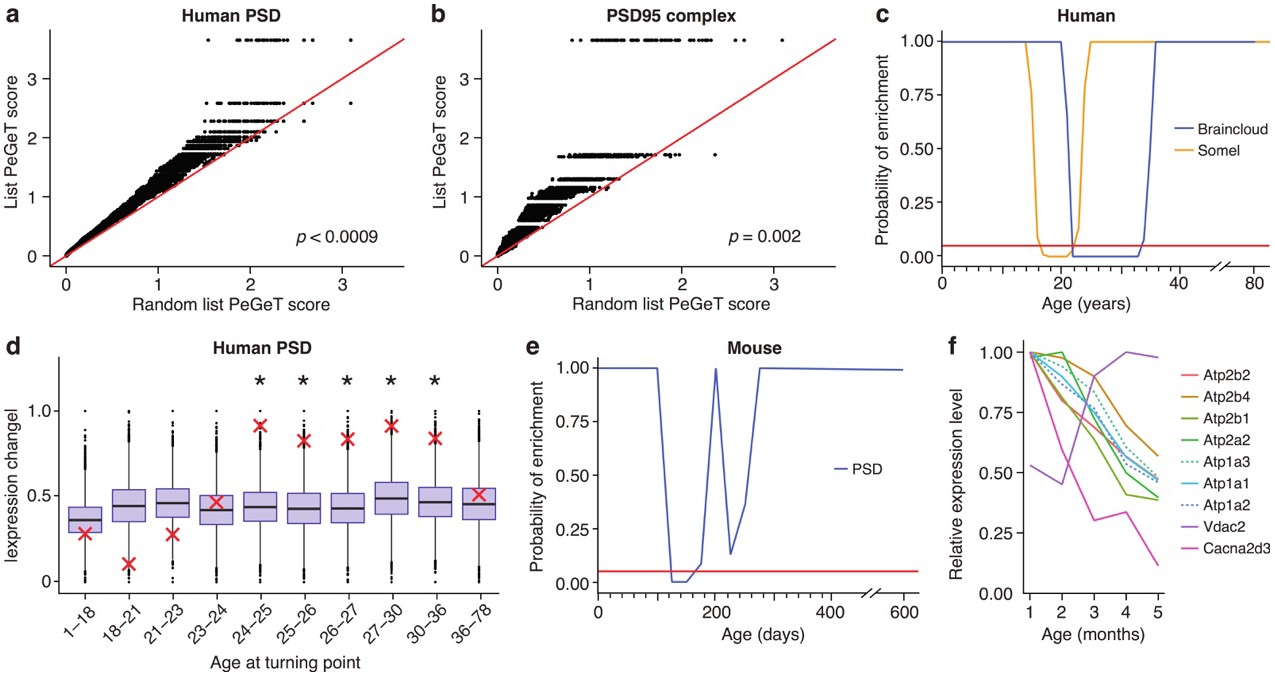
Post-synaptic density (PSD) genes are associated with TTTPs during windows in adolescence and early adulthood.
(a) PeGeT scores for human PSD (hPSD) genes compared with scores from 100 randomly sampled gene lists. For each of the 100 random lists, the ith largest score is plotted against the ith largest hPSD score. If the distribution of PeGeT scores within the PSD gene list was normal, then an equal number of random scores would be expected on either side of the red line. P value from bootstrapping of 10,000 random lists is shown. (b) PeGeT scores for PSD95 supercomplex genes analysed as in (a). (c) Human PSD genes show a window of increased ALiGeT scores during young adulthood in two human prefrontal cortex datasets (Braincloud, blue; Somel, yellow). Beneath the red horizontal line marks the point of significance (Bonferroni corrected p=0.05). (d) DeGeT scores were significantly increased in hPSD genes in five consecutive age sets spanning 24–36 years. Boxplots show the mean bootstrapped scores (10,000 random lists) and the red cross marks the score of the hPSD list for that age. *, Bonferroni corrected p<0.05. (e) Human PSD genes show a window (126 to 151 days) of increased ALiGeT scores during young adulthood in a mouse hippocampal dataset. Beneath the red horizontal line marks the point of significance (Bonferroni corrected p=0.05). (f) The mouse synaptic proteome shows extensive changes during early adulthood, with particularly strong impact on ion channels. Expression profiles for a subset of the channels and receptors found to be differentially expressed with age. Values shown are the mean for each month, divided by the maximum mean expression value for that protein across all five months.
Figure 4—figure supplement 1
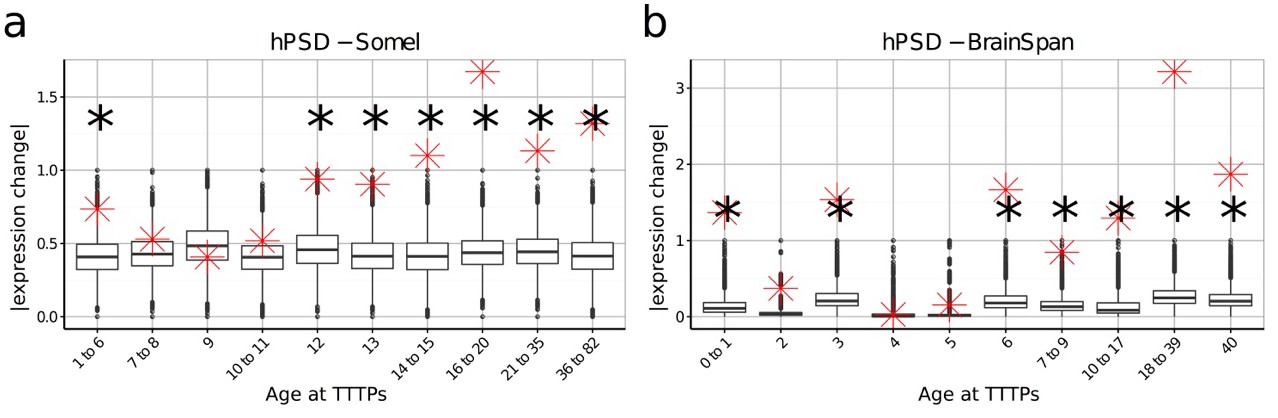
DeGeT enrichment for the human post-synaptic density gene set was repeated in both the (a) Somel and (b) BrainSpan datasets.
Boxplots show the mean bootstrapped scores (10,000 random lists) and the red cross marks the score of the hPSD list for that age. *, Black asterisks mark significance with bonferroni corrected p<0.05.
Figure 5 with 8 supplements
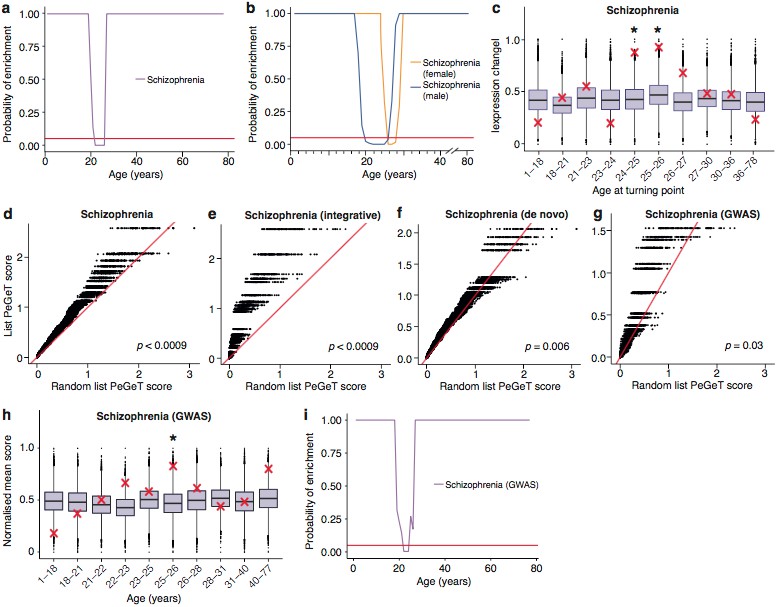
Schizophrenia susceptibility associated genes are associated with TTTPs during windows in adolescence and early adulthood.
(a) Schizophrenia susceptibility genes show a window (22–26 years) of increased ALiGeT scores during young adulthood in the Braincloud dataset. Beneath the red horizontal line marks the point of significance (Bonferroni corrected p=0.05). (b) Schizophrenia susceptibility genes show a later window of increased ALiGeT scores in females (26–28 years) than in males (20–26 years). (c) DeGeT scores were significantly increased in Schizophrenia susceptibility genes in two consecutive age sets spanning 24–26 years. Boxplots show the mean bootstrapped scores (10,000 random lists) and the red cross marks the score of the schizophrenia list for that age. *, Bonferroni corrected p<0.05. (d) PeGeT scores for the schizophrenia susceptibility genes (pooled from de novo, GWAS and integrative studies) compared with scores from 100 randomly sampled gene lists. For each of the 100 random lists, the ith largest score is plotted against the ith largest disease gene score. If the distribution of PeGeT scores within the disease gene list was normal, then an equal number of random scores would be expected on either side of the red line. P value from bootstrapping of 10,000 random lists is shown. (e) PeGeT scores for the schizophrenia genes from the integrative study analysed as in (g). (f) PeGeT scores for the schizophrenia genes from the de novo study analysed as in (g). (g) PeGeT scores for the schizophrenia genes from the GWAS study analysed as in (g). (h) DeGeT scores at 25—26 years are enriched for schizophrenia heritability (calculated with GWAS summary statistics instead of associated gene set). Bootstrapping was performed by shuffling gene level association z-scores which had been calculated using MAGMA. Boxplots show the mean bootstrapped scores and the red cross marks the score with the unshuffled association scores for that age. *, Bonferroni corrected p<0.05. (i) ALiGeT scores are enriched for schizophrenia heritability (calculated with GWAS summary statistics) in the Braincloud dataset between 22 and 24 years of age. The red horizontal line marks the point of significance (Bonferroni corrected p=0.05).
Figure 5—figure supplement 1
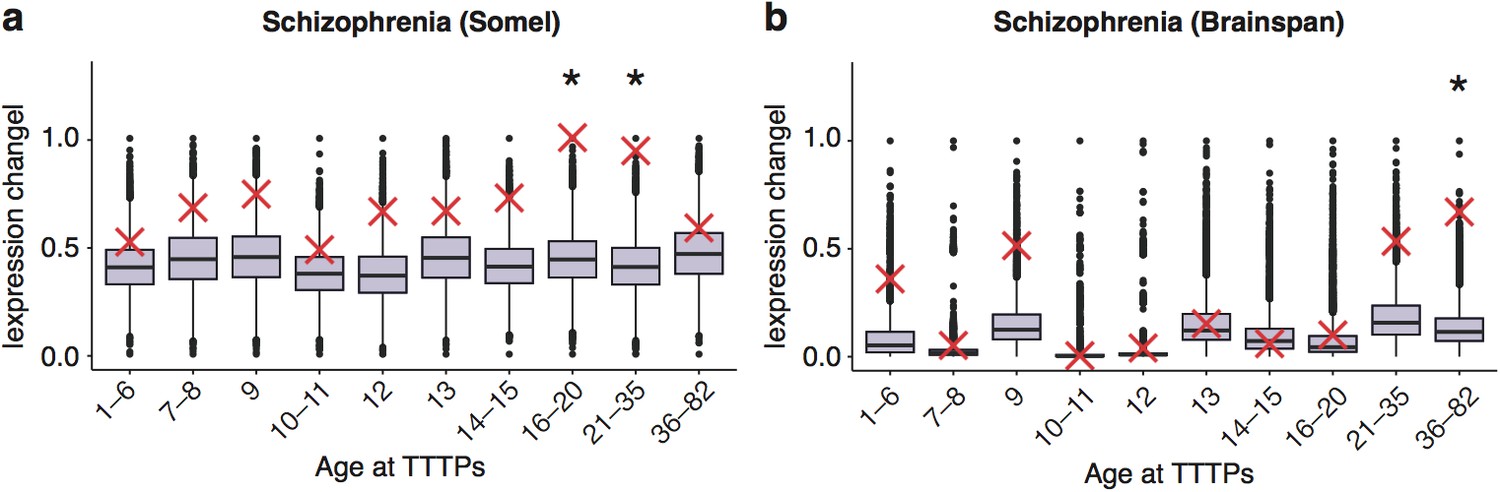
DeGeT enrichment for the schizophrenia associated genes in the two additional human frontal cortex datasets.
Results are for (a) combined schizophrenia gene set in the Somel dataset (b) combined schizophrenia gene set in brainspan dataset. Boxplots show the mean bootstrapped scores (10,000 random lists) and the red cross marks the score of the hPSD list for that age. *, Black asterisks mark significance with bonferroni corrected p<0.05.
Figure 5—figure supplement 2
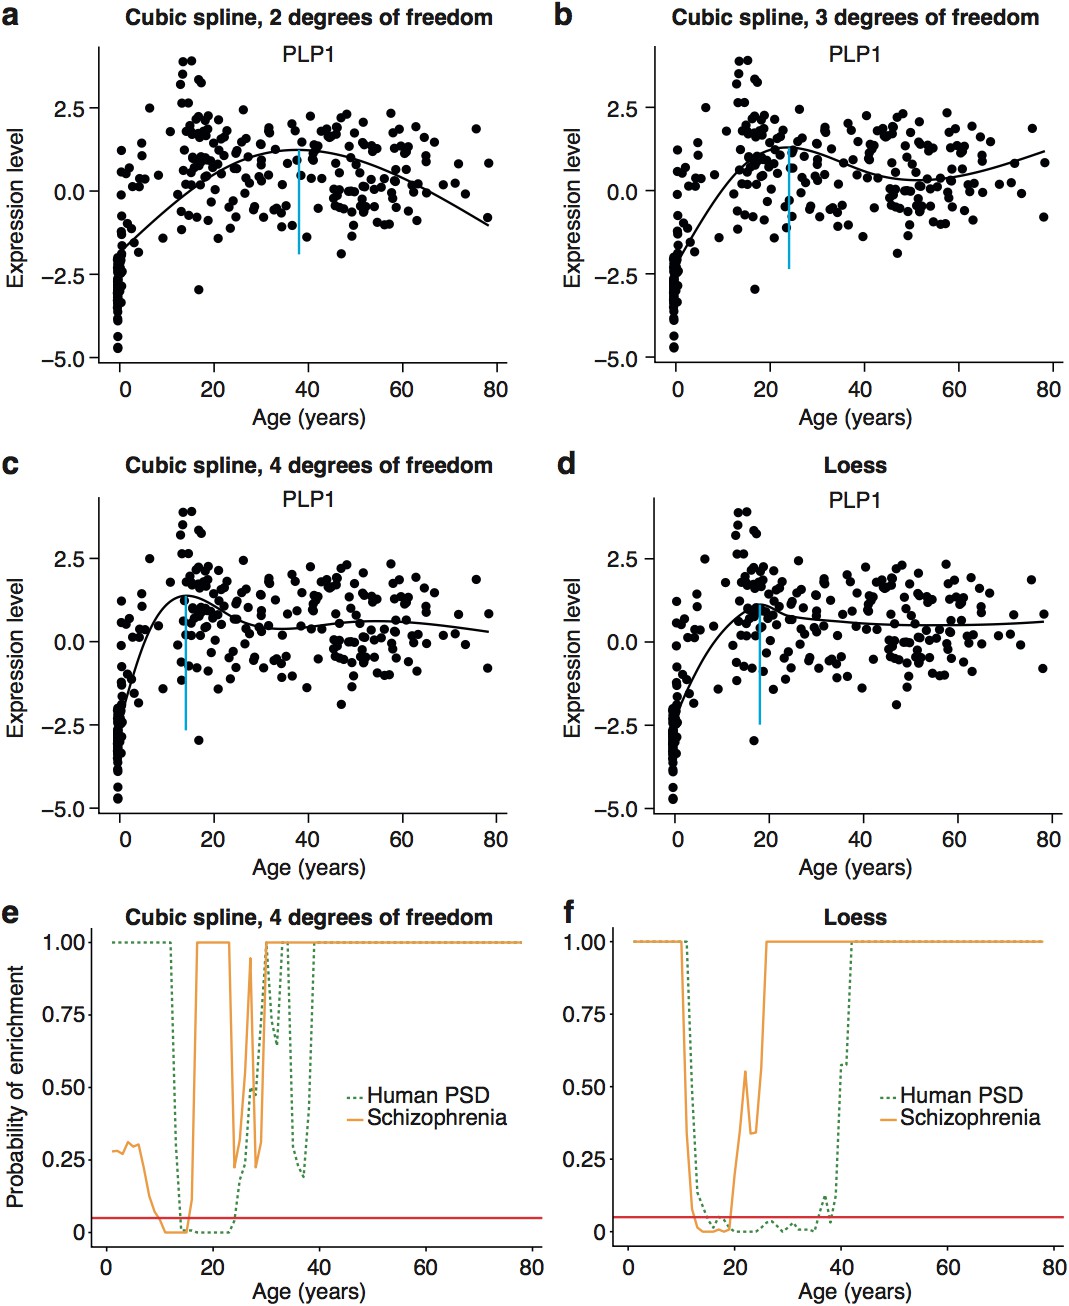
Early adult peak of turning points as well as significant windows for disease and synapse ALiGeT increases are robust against changes in the model used to fit the data.
Examples of how alternate methods fitting the data affects individual trajectories are shown in the first two rows using the data for Plp1 as an example. The following models are shown: cubic spline with 2 degrees of freedom (a); cubic spline with 3 degrees of freedom (b); cubic spline with 4 degrees of freedom (c); loess (d). Schizophrenia susceptibility genes, as well as PSD genes still show windows of increased ALiGeT scores during young adulthood, when cubic splines with 4 degrees of freedom (e) and loess (f) is used to fit the expression data. The red horizontal line marks the point of significance (Bonferroni corrected p=0.05).
Figure 5—figure supplement 3
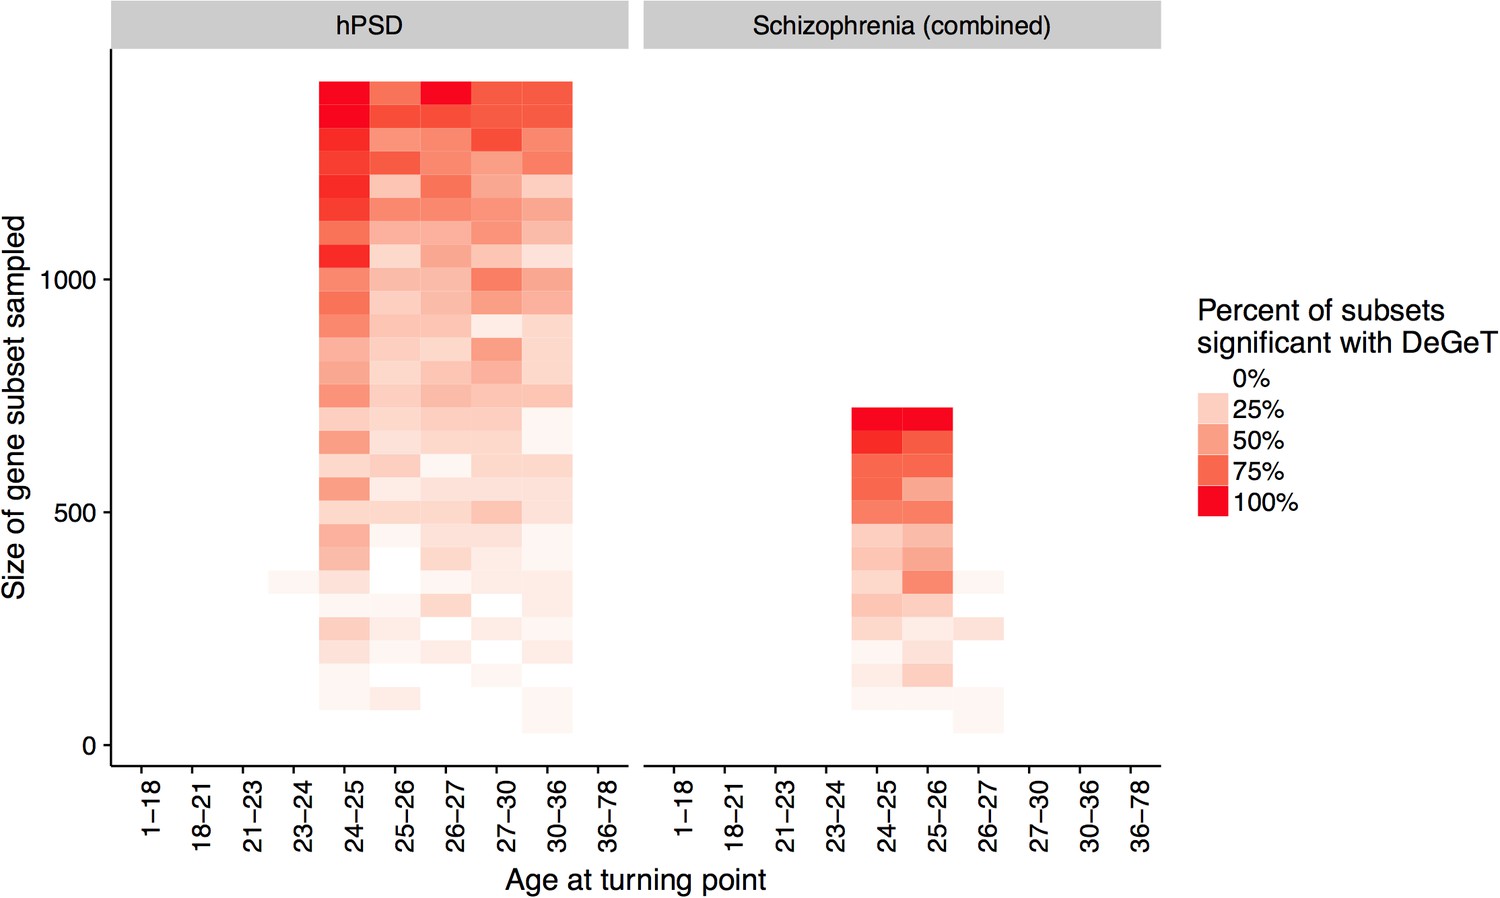
Down-sampling sensitivity analysis indicates that DeGeT enrichments are stronger in earlier adulthood for schizophrenia associated genes than for the hPSD.
Both the hPSD and schizophrenia (combined) gene sets were down sampled repeatedly (20 times for each gene set length) and Bonferroni corrected DeGeT enrichments calculated. Using subsets of 650 genes, 95% of schizophrenia subsets were significant at 24—25 years but only 50% of hPSD subsets.
Figure 5—figure supplement 4
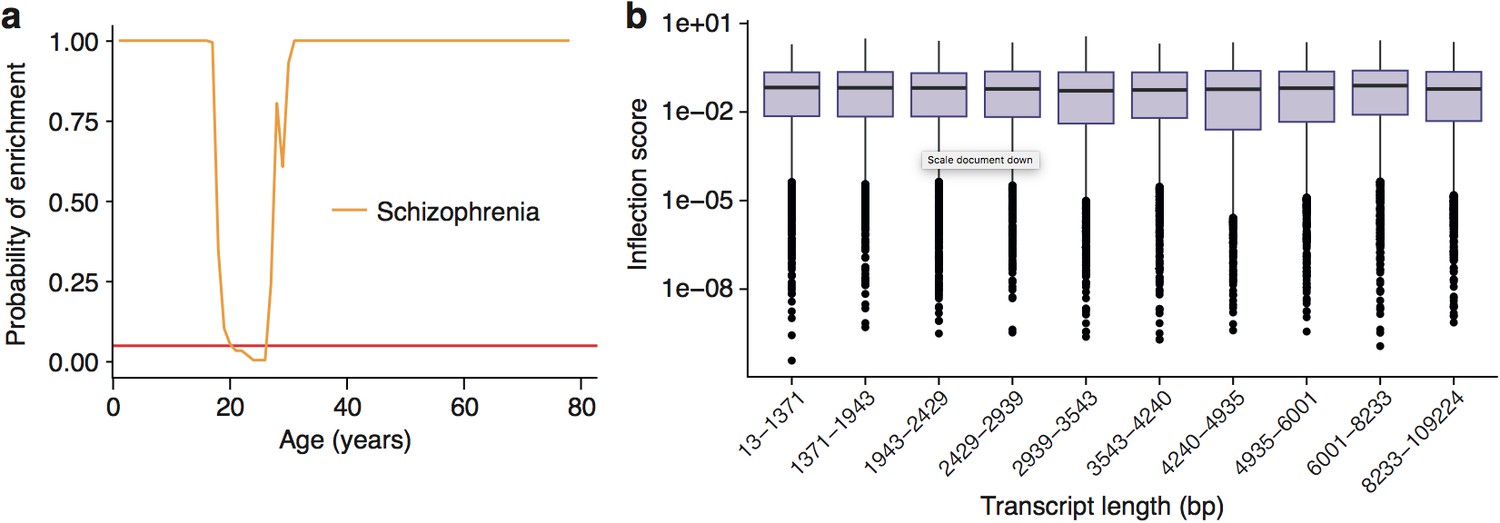
Enrichment of Schizophrenia associated genes does not occur as a side effect of turning points in genes with long transcript lengths or GC-content.
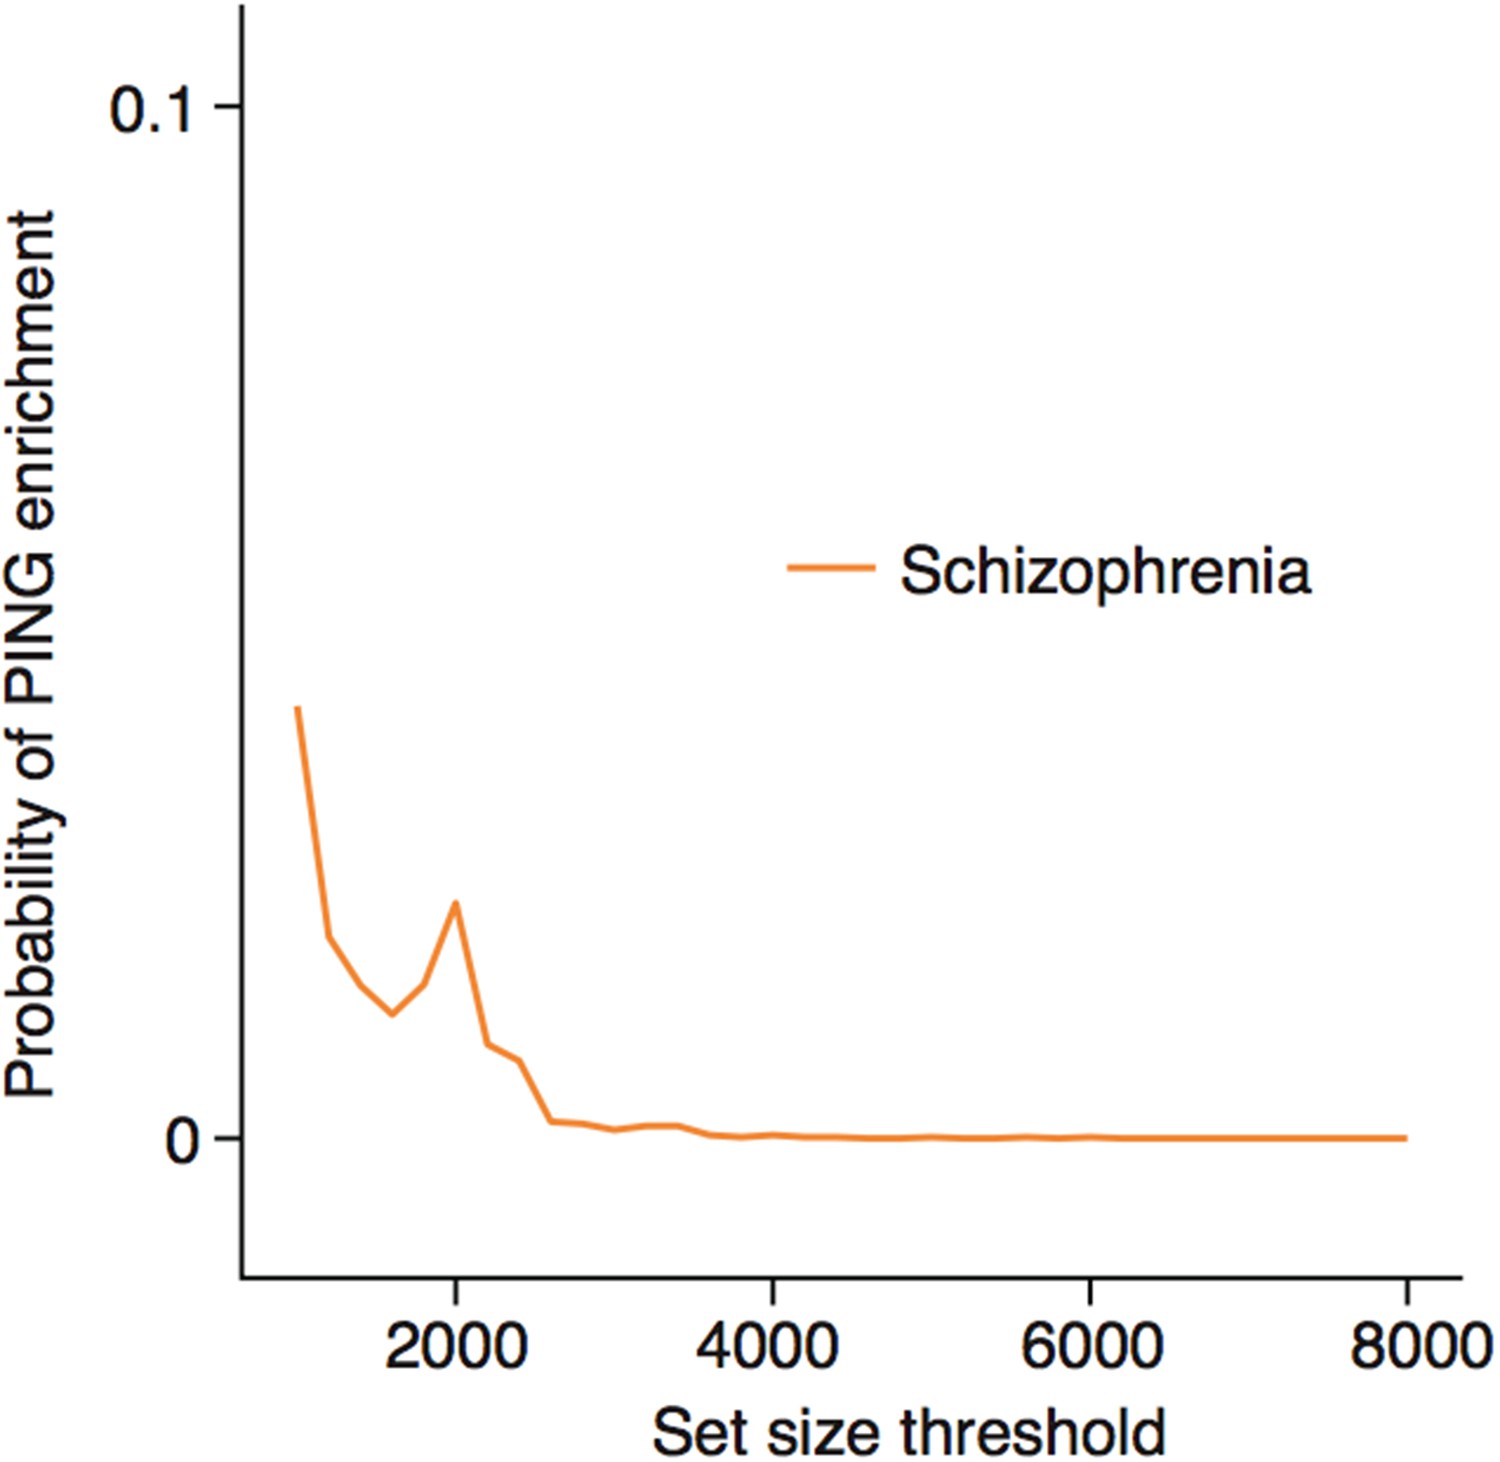
(a) Schizophrenia susceptibility genes still show windows of increased ALiGeT scores during young adulthood, when bootstrapped gene lists are selected to match the GC-content and transcript lengths of the disease genes. The red horizontal line marks the point of significance (Bonferroni corrected p=0.05). (b) PeGeT scores are independent of transcript length. The upper/lower hinges of the boxes indicate first and third quartiles, the central line is the median, the whiskers extend to the furthest value within 1.5 * IQR of the hinge, and points indicate outliers.
Figure 5—figure supplement 5
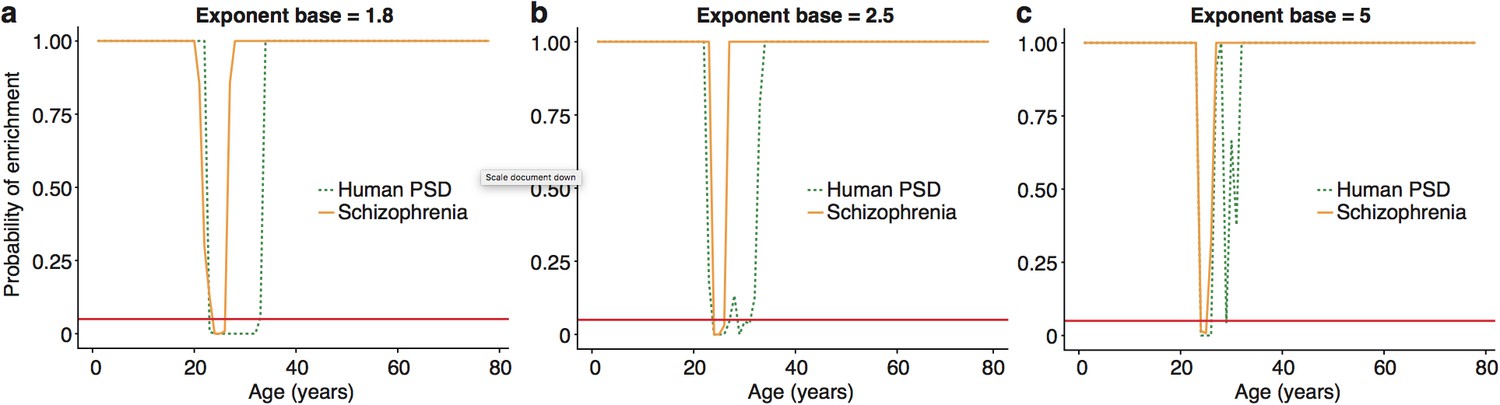
:The ALiGeT scoring function had a single fixed parameter, which controls the extent to which genes which turn proximally to the target year receive high scores: higher values for the parameter result in increasingly rapid decay.
We show here that the main results are robust against a range of values for this parameter, with the primary effect being on the width of the enrichment windows. ALiGeT windows exist for schizophrenia and PSD gene sets when the exponent base equals 1.8 (a), 2.5 (b) and 5 (c).
Figure 5—figure supplement 6
Replication of results with all fetal samples are dropped from the Braincloud dataset.
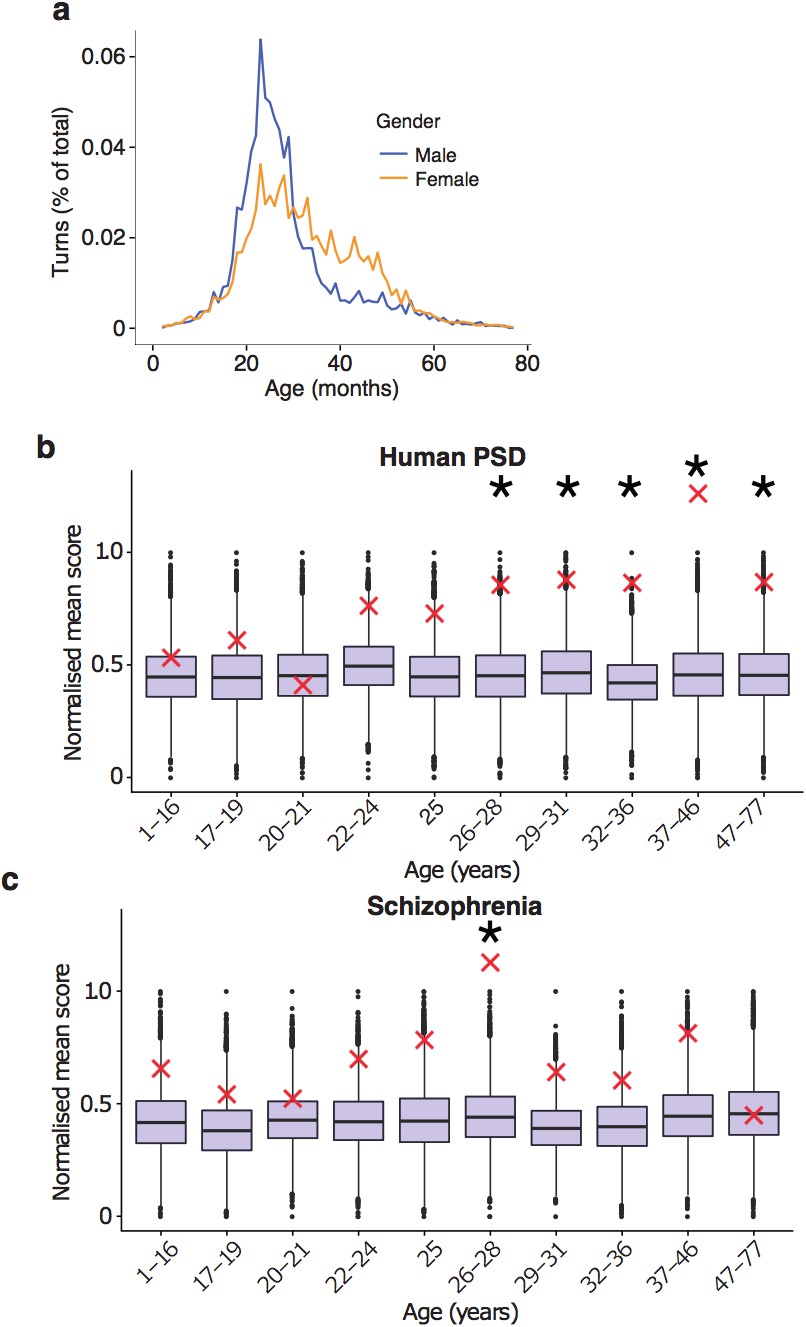
(a) Percentage of TTTPs at each age of human lifespan. Peak age is 26.0 years for males and 27.5 years for females. (b) DeGeT enrichments for human post-synaptic density genes. (c) DeGeT enrichments for the schizophrenia combined list genes. (b–c) Boxplots show the mean bootstrapped scores (10,000 random lists) and the red cross marks the score of the hPSD list for that age. *, Black asterisks mark significance with bonferroni corrected p<0.05.
Figure 5—figure supplement 7
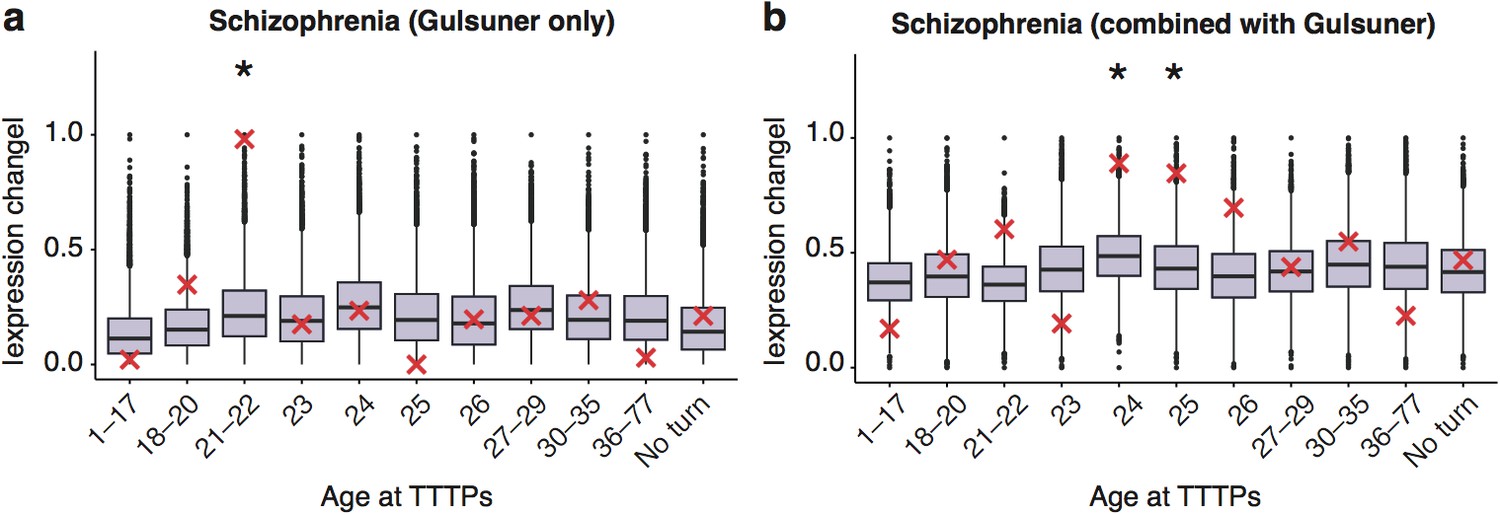
DeGeT enrichment for the additional de novo gene schizophrenia gene set from the Gulsuner et al paper.
Results are for (a) additional de novo genes only against the Braincloud dataset (b) combined schizophrenia gene set and the additional de novo genes against the braincloud dataset. Boxplots show the mean bootstrapped scores (10,000 random lists) and the red cross marks the score of the hPSD list for that age. *, Black asterisks mark significance with bonferroni corrected p<0.05.
Figure 5—figure supplement 8
Schizophrenia heritability enrichments (calculated with GWAS summary statistics instead of associated gene set) are confirmed in the Somel dataset.
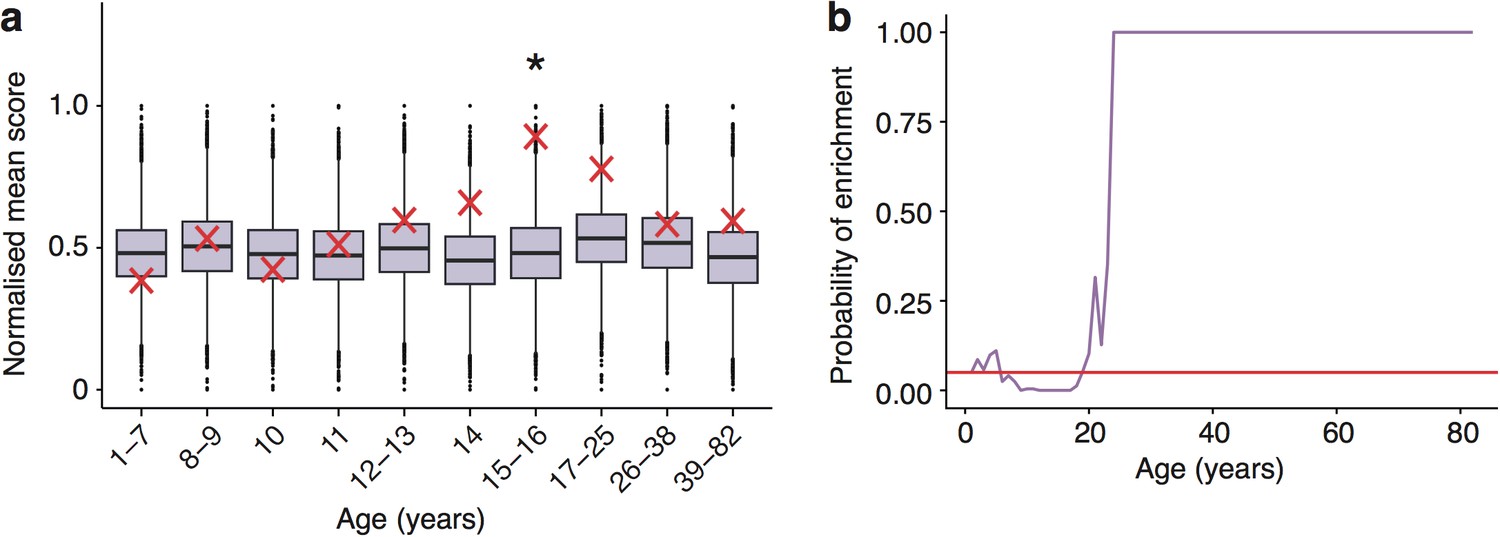
(a) DeGeT scores at 15—16 years are enriched for Schizophrenia heritability. Bootstrapping was performed by shuffling gene level association z-scores which had been calculated using MAGMA. Boxplots show the mean bootstrapped scores and the red cross marks the score with the unshuffled association scores for that age. *, Bonferroni corrected p<0.05. (b) ALiGeT scores are enriched for Schizophrenia heritability (calculated with GWAS summary statistics) in the Somel dataset between 6 and 18 years of age. The red horizontal line marks the point of significance (Bonferroni corrected p=0.05).
Figure 6 with 3 supplements
Trajectories of schizophrenia associated genes show further distinctions in their cell-type and trajectories.
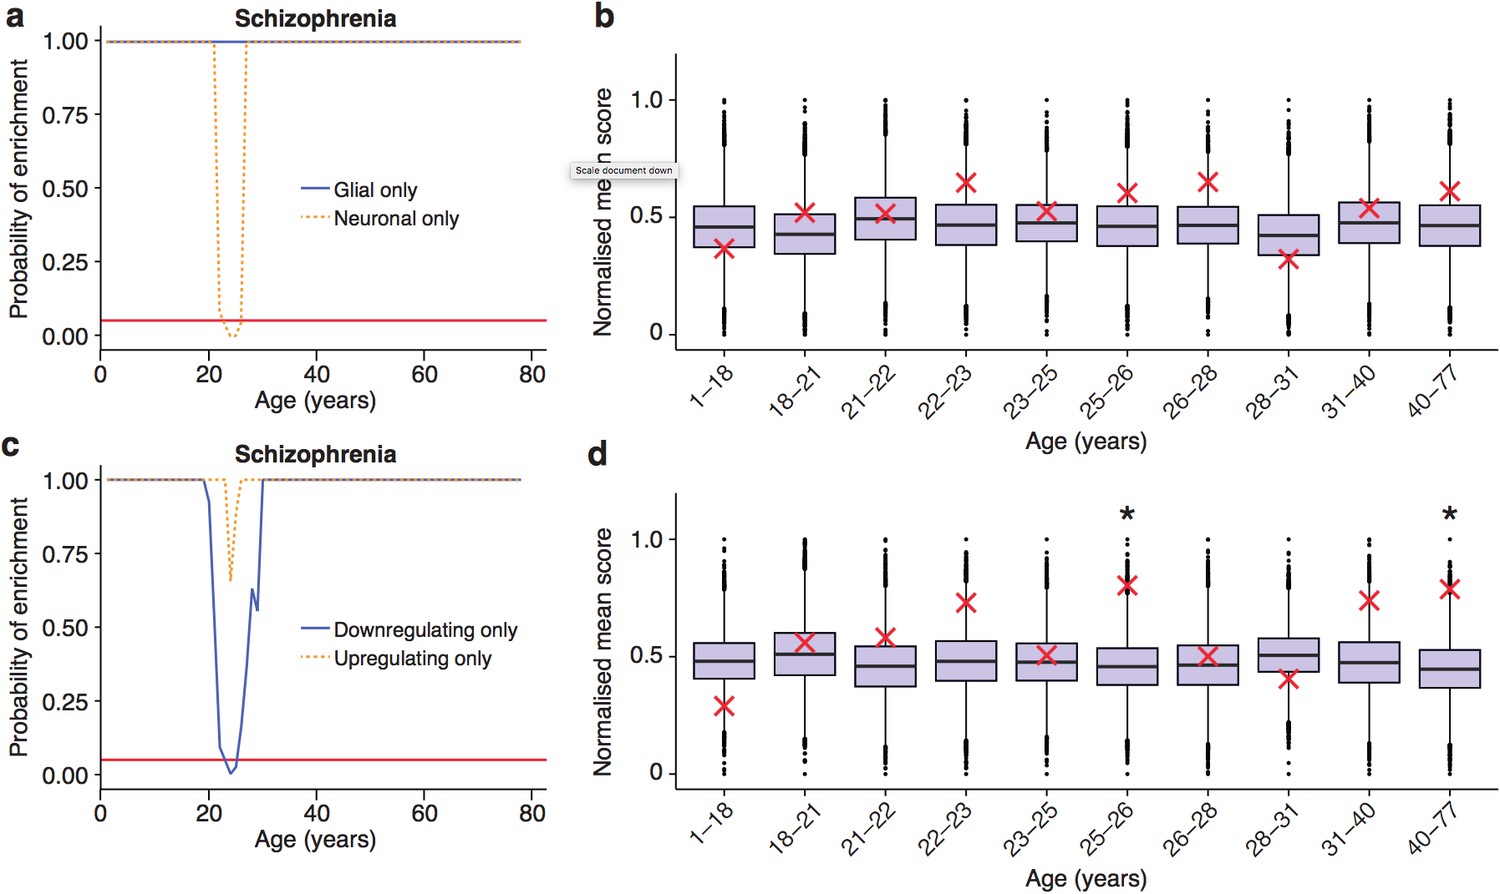
(a) Schizophrenia susceptibility genes show a window of increased ALiGeT scores when the analysis is restricted to the 5000 most neuron specific genes, but not the 5000 most glial specific genes. The red horizontal line marks the point of significance (Bonferroni corrected p=0.05). (b) DeGeT scores of the 5000 most neuron enriched genes do not confirm a significant enrichment in schizophrenia heritability calculated with GWAS summary statistics. Bootstrapping was performed by shuffling gene level association z-scores which had been calculated using MAGMA. Boxplots show the mean bootstrapped scores and the red cross marks the score with the unshuffled association scores for that age. *, Bonferroni corrected p<0.05. (c) Schizophrenia susceptibility genes show a window of increased ALiGeT scores, when the analysis is restricted to genes that down-regulate prior to their TTTP, but not with genes that up-regulate prior to their TTTP. (d) DeGeT scores of genes which down-regulate prior to their TTTP are significantly enriched for Schizophrenia heritability calculated with GWAS summary statistics at 26—27 and 40–77 years.
Figure 6—figure supplement 1
Enrichments for schizophrenia susceptibility genes are specific to particular cell types.
(a) Schizophrenia susceptibility genes show significantly increased ALiGeT scores, when the analysis is restricted to the the 1000th—8000th most neuron specific genes. The x-axis shows the number of genes considered to be ‘neuron specific’ and thus included in the analysis, with the first gene being the most specific.
Figure 6—figure supplement 2

The synaptic proteome was found to show extensive changes during early adulthood, with particularly strong impact on proteins associated with adult-onset mental disorders.
Shown are the expression profiles for the differentially expressed proteins which are associated with adult-onset neurological disorders. Expression values shown are the mean for each month, divided by the maximum mean expression value for that protein across all five months.
Figure 6—figure supplement 3
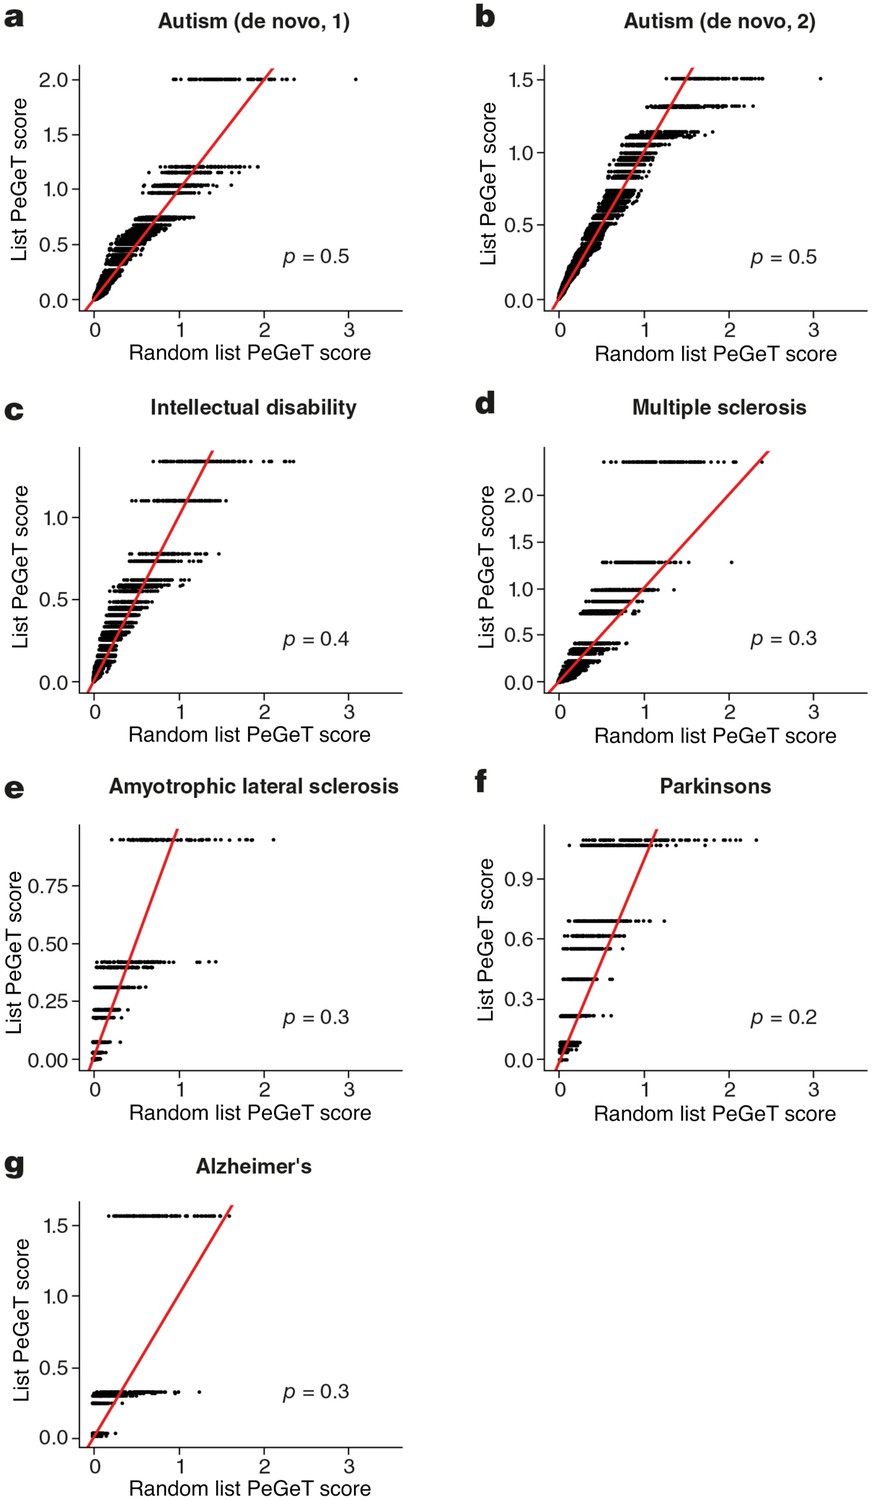
No cognitive disorders other than Schizophrenia showed larger PeGeT scores than expected by chance.
PeGeT scores for gene lists associated with six disorders [autism (a,b), intellectual disability (c), Multiple Sclerosis (d), Amyotrophic Lateral Sclerosis (e), Parkinson’s disease (f) and Alzheimer’s disease (g) ] are compared with scores from 100 randomly sampled gene lists. For each of the 100 random lists, the ith largest score is plotted against the ith largest disease score. If the distribution of PeGeT scores within the disease gene list was normal, then an equal number of random scores would be expected on either side of the red line. P value from bootstrapping of 10,000 random lists is shown.
Figure 7
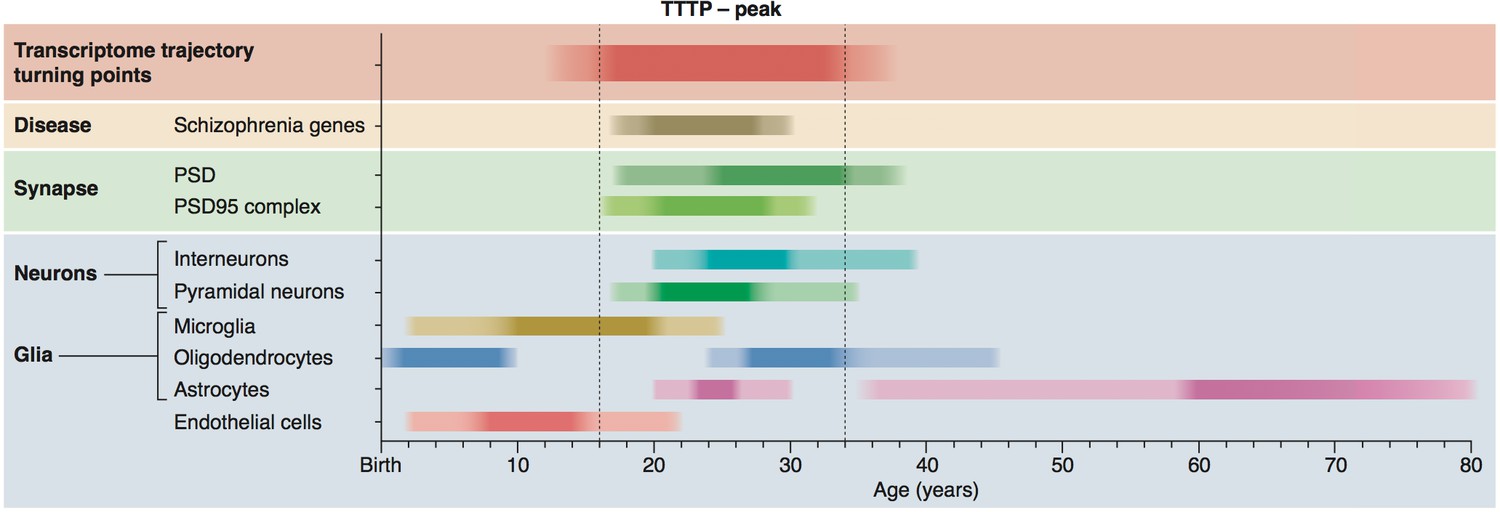
Summary of age windows for synaptic and cellular processes and diseases across the human lifespan.
The intensity of the shaded boxes indicates the enrichment in relevant genes. The TTTP-peak in young adults (vertical dotted lines show approximate boundary) coincides with synaptic and neuronal changes and schizophrenia genetic susceptibility. Changes in glial cells overlap with the TTTP-peak and occur in distinct windows across the lifespan.
Additional files
-
Supplementary file 1
(a) Human PEGET scores. (b) Mouse PEGET scores. (c) Set of genes that were found to have the top PEGET scores in both human and mouse. (d) Post-synaptic proteome gene sets. (e) Annotated table of proteins differentially expressed with age as well as the assigned functional classes used to determine enrichments. (f) Disease gene sets
- https://doi.org/10.7554/eLife.17915.026
-
Transparent reporting form
- https://doi.org/10.7554/eLife.17915.027
Download links
A two-part list of links to download the article, or parts of the article, in various formats.
Downloads (link to download the article as PDF)
Open citations (links to open the citations from this article in various online reference manager services)
Cite this article (links to download the citations from this article in formats compatible with various reference manager tools)
A genomic lifespan program that reorganises the young adult brain is targeted in schizophrenia
eLife 6:e17915.
https://doi.org/10.7554/eLife.17915


