Ribosome•RelA structures reveal the mechanism of stringent response activation
- University of Massachusetts Medical School, United States
- Brandeis University, United States
- Janelia Research Campus, Howard Hughes Medical Institute, United States
Figures
Figure 1 with 4 supplements
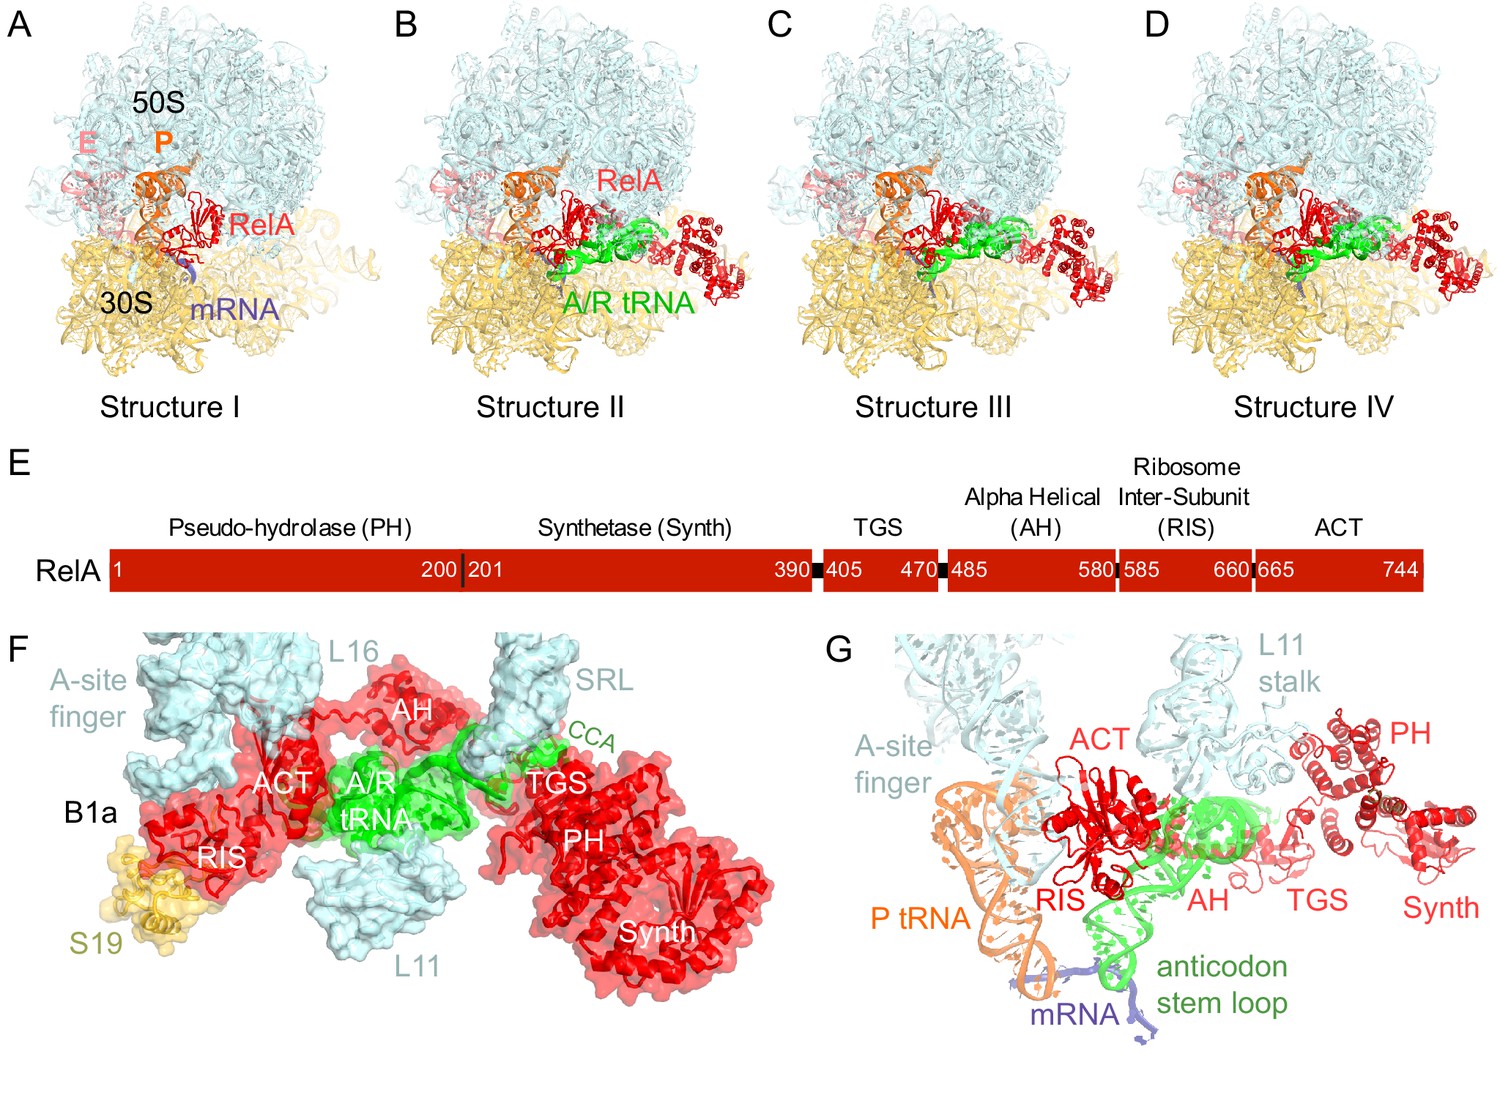
Cryo-EM structures of the 70S•RelA complexes.
(A) Structure of the 70S•RelA complex lacking deacyl-tRNA in the A site (Structure I) reveals the C-terminal superdomain comprising the RIS and ACT domains (red). This superdomain binds near the A site at bridge B1a between the 30S and 50S subunits. (B) Structure of the 70S•RelA•deacyl-tRNA complex (Structure II) shows that the C-terminal superdomain is similar to that in Structure I (A). The central and N-terminal portions of the protein become visible upon interaction with A/R tRNA. (C, D) Structures III (C) and IV (D) are compositionally the same as Structure II, but differ in the conformations of A/R tRNA, the 30S subunit, and RelA. (E) Domain architecture of E. coli RelA. The numbers indicate amino acid positions in RelA. (F) RelA wraps around A/R tRNA. The model from Structure IV is shown in space-filling and secondary-structure rendering. Abbreviations used: ACT (Aspartate kinase-Chorismate mutase-TyrA domain), RIS (Ribosome-InterSubunit domain), AH (α-helical domain), TGS (ThrRS, GTPase, SpoT/RelA domain), Synth (synthetase domain), PH (pseudo-hydrolase domain), SRL (sarcin-ricin loop), B1a (bridge B1a between S19 and A-site finger), CCA (three 3'-terminal nucleotides of tRNA). (G) The position of RelA is shown relative to the A/R tRNA, P-site tRNA and mRNA in Structure IV. 16S rRNA and ribosomal proteins are omitted for clarity. In all panels, the 50S subunit is colored pale blue; the 30S subunit, yellow; RelA, red; A/R tRNA, green; P-site tRNA, orange; E-site tRNA, pink; and mRNA, dark blue.
-
Figure 1—source data 1
Structure I-IV map resolution and refinement statistics.
- https://doi.org/10.7554/eLife.17029.003
Figure 1—figure supplement 1
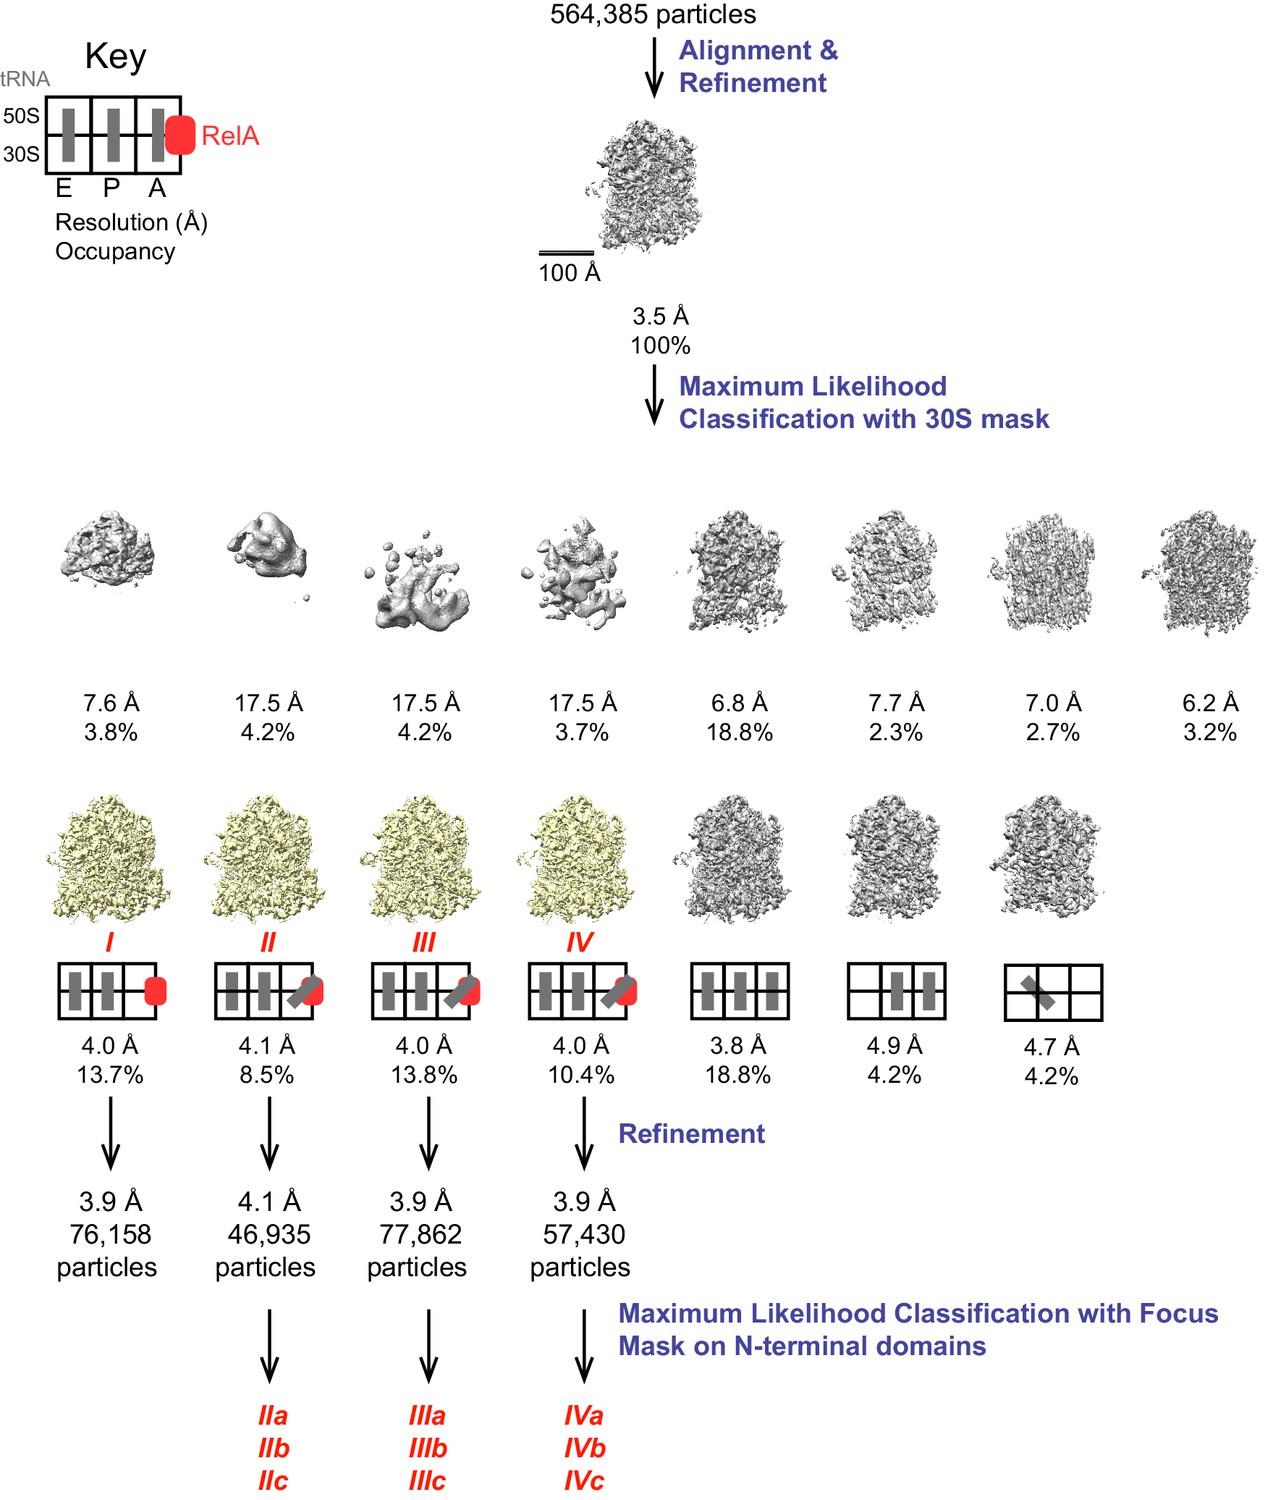
Schematic of cryo-EM refinement and classification procedures.
All particles were initially aligned to a single model, resulting in a 3.5 Å resolution averaged map. 3D classification into 15 classes yielded 7 high-resolution classes of which 4 were found to contain RelA. The key depicts the location (E, P or A site) of tRNAs. Refinement of individual classes yielded final maps used for model building. Additional sub-classification of Structures II, III and IV was performed using a spherical mask covering the N-terminal domains of RelA to reveal the positions of these domains (Figure 4—figure supplement 1).
Figure 1—figure supplement 2
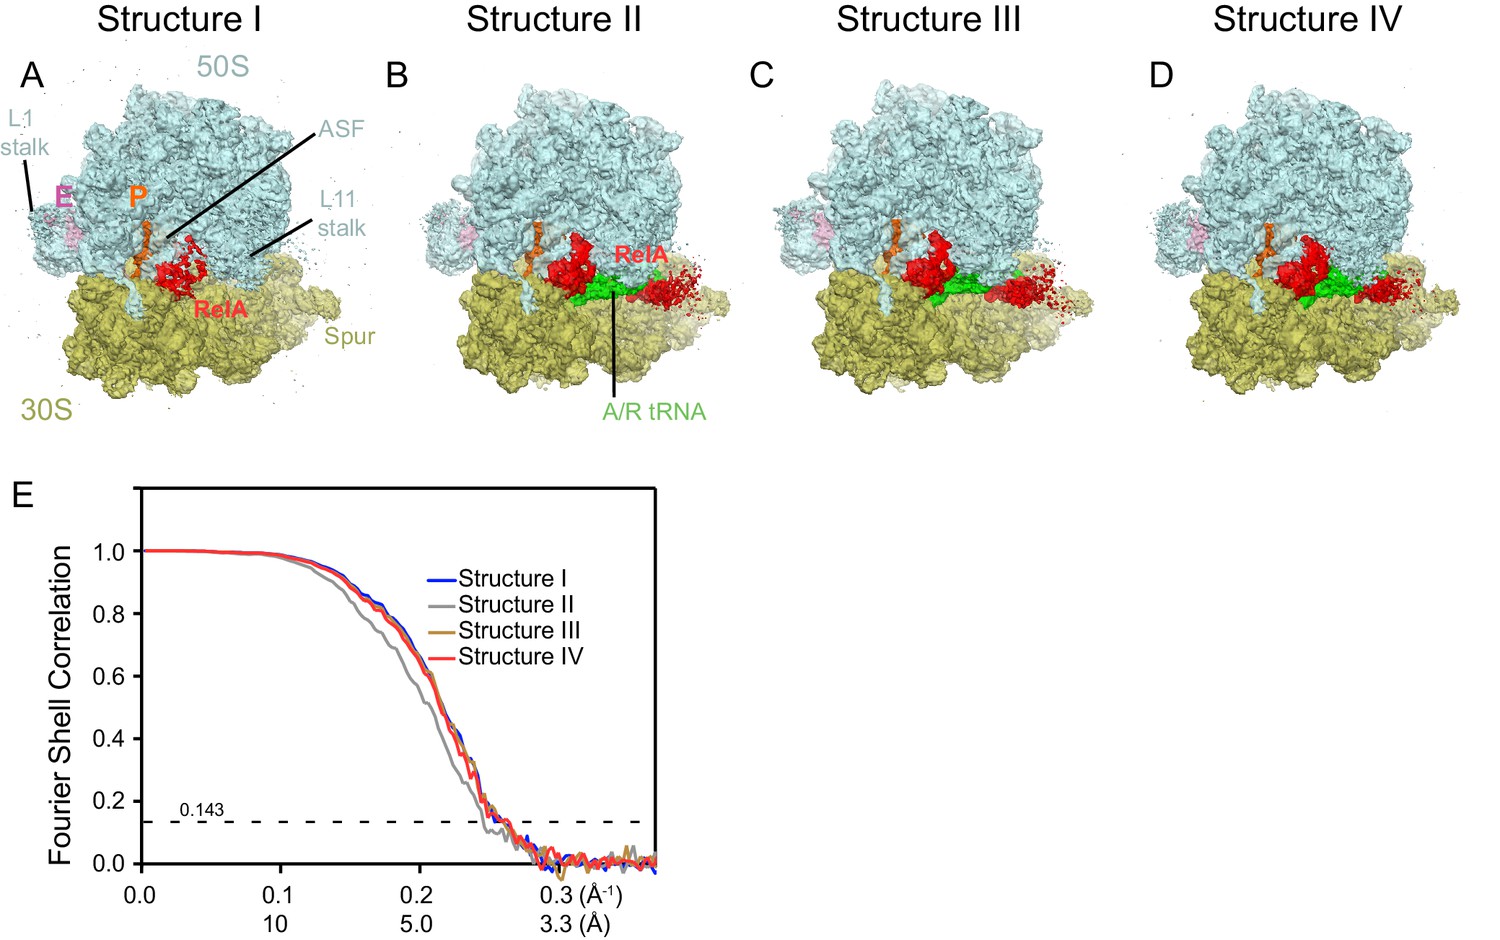
Cryo-EM density in Structures I-IV.
For panels (A–D), the maps were B-factor sharpened by applying a B-factor of 42 Å2 (Structure II) or -65 Å2 (Structure I, III and IV). (A) Cryo-EM map of Structure I, 70S•RelA complex in the absence of deacyl-tRNA in the A site is shown at 2.0 σ. Density for the C-terminal domains of RelA (red) is present at bridge B1a. The map is segmented and colored as in Figure 1. (B) Cryo-EM map of Structure II, 70S•RelA•deacyl-tRNA complex with an open 30S domain conformation, is shown at 2.5 σ. Density for the C-terminal domains is present at bridge B1a and for the N-terminal domains near the spur of the small subunit. (C) Cryo-EM map of Structure III, 70S•RelA•deacyl-tRNA complex with an intermediate 30S conformation, is shown at 2.5 σ. (D) Cryo-EM map of Structure IV, 70S•RelA•deacyl-tRNA complex with a closed 30S domain, is shown at 2.5 σ. (E) Fourier shell correlation (FSC) curves for Structures I-IV are shown. The horizontal axis is labeled with spatial frequency Å-1 and with Å. The resolutions stated in the text correspond to an FSC cutoff value of 0.143, shown as a dotted line, for the FREALIGN-derived FSC ('Part_FSC'). Structures I, II, III and IV have the resolutions of 3.9 Å, 4.1 Å, 3.9 Å and 3.9 Å, respectively.
Figure 1—figure supplement 3
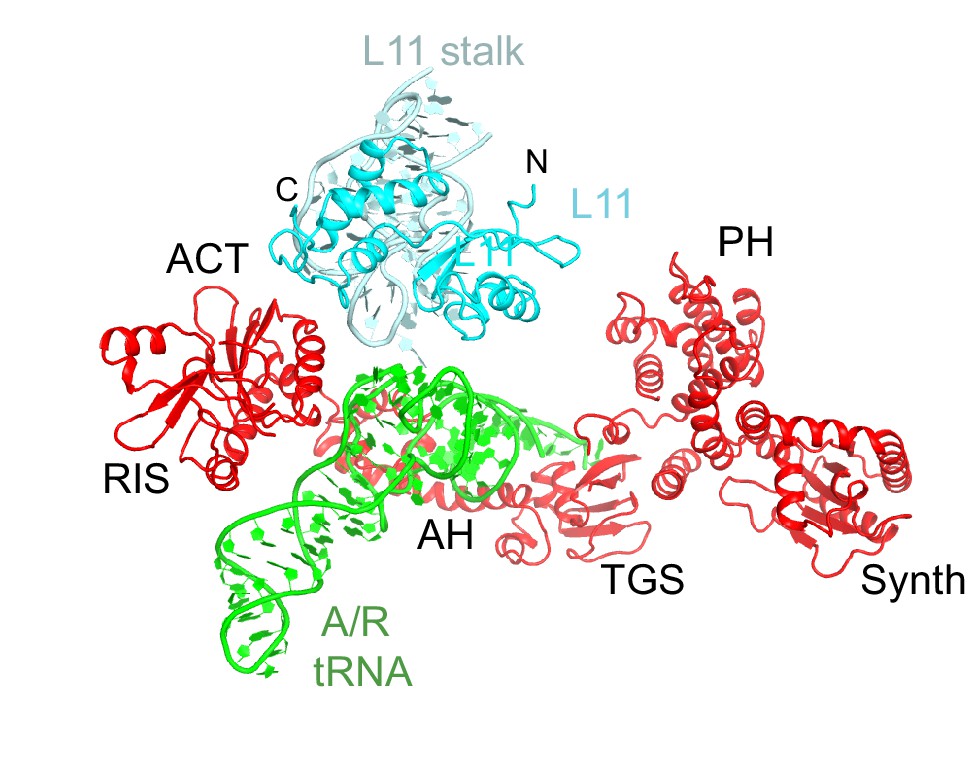
Interactions of the L11 stalk with A/R tRNA.
The N-terminal portion of L11 contacts the elbow of A/R tRNA. Structure IV is shown colored as in Figure 1.
Figure 1—figure supplement 4
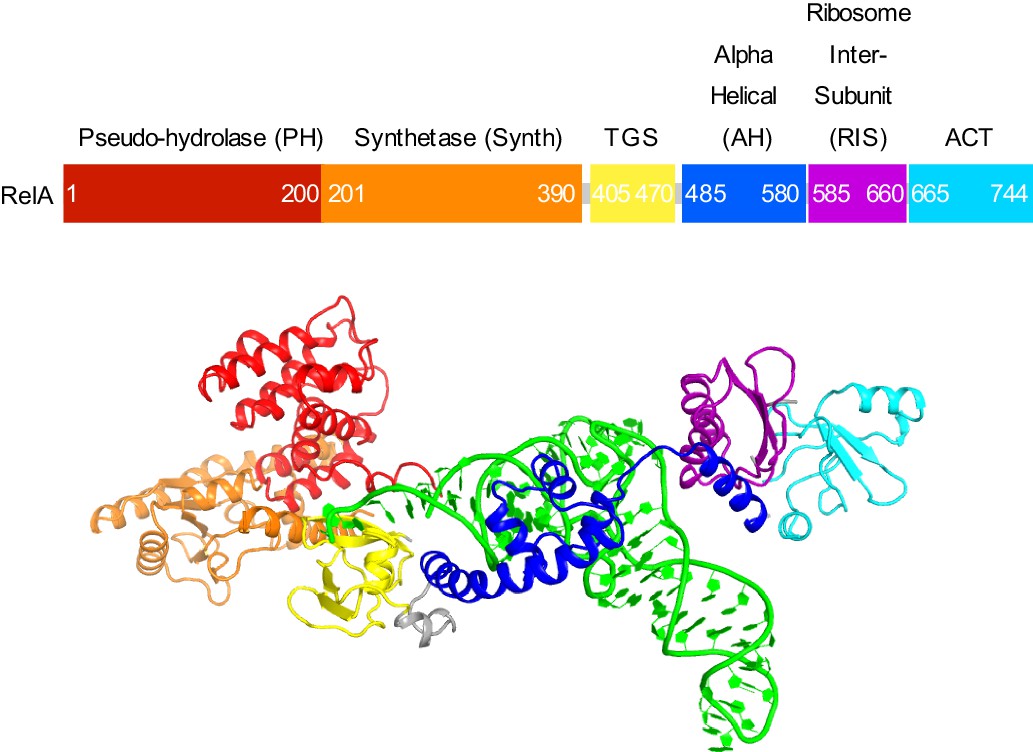
Domain organization of RelA.
Domains are shown in different colors, the numbers denote approximate amino acid positions demarcating the domains. The view of the structures of RelA and A/R tRNA (green) in the lower panel shows the N-terminal domains and the CCA 3´ end on the left; the C-terminal domains and the anticodon-stem loop are on the right. Structure IV is shown.
Figure 2 with 2 supplements
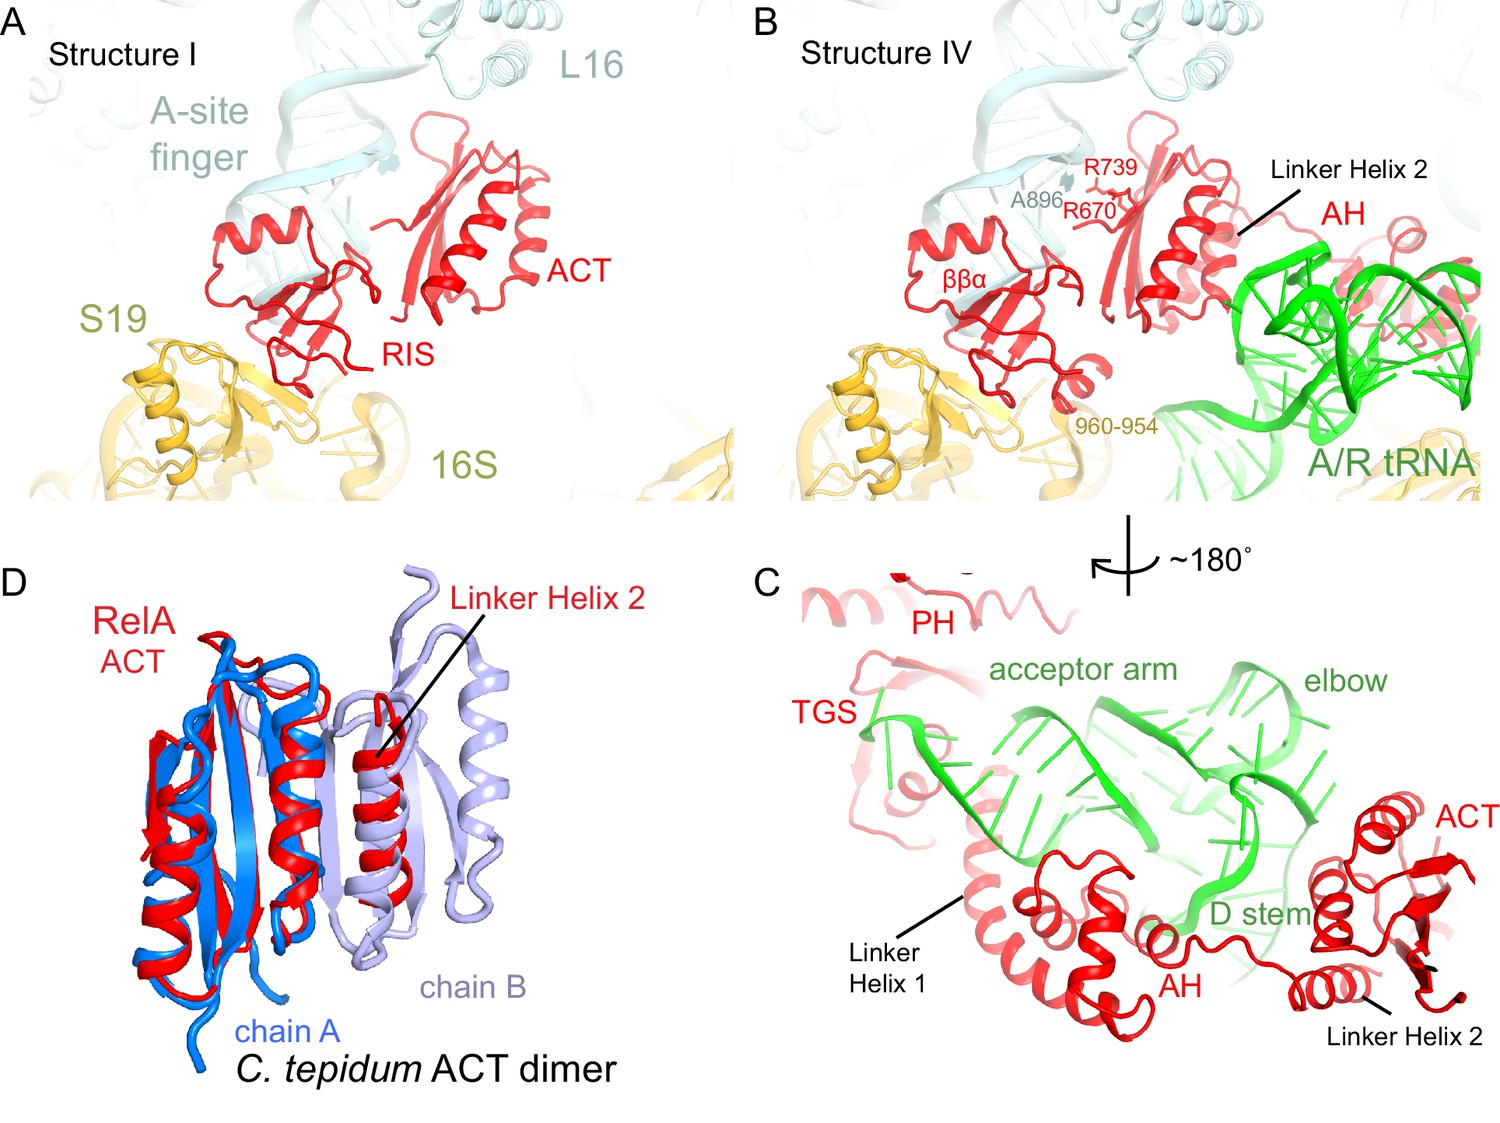
The C-terminal superdomain of RelA binds at the intersubunit bridge B1a.
(A) In the absence of A-site tRNA (Structure I), the C-terminal superdomain of RelA interacts with the intersubunit bridge B1a. The ACT domain interacts with the A-site finger (helix 38 of 23S rRNA) and L16. The RIS domain interacts with the A-site finger, 16S rRNA and S19. (B) In the presence of A/R tRNA, as in Structures II, III or IV (shown), the RIS and ACT domains maintain their interaction with the ribosome at bridge B1a, and additional elements of the C-terminal region become ordered. Linker Helix 2, which connects the α-helical (AH) and RIS domains, packs against the ACT domain (also shown in (C)), similarly to an α-helix in the isolated ACT dimer shown in (D). (C) In Structures II, III, and IV (shown), the AH domain of RelA interacts with the D stem and acceptor arm of A/R tRNA. The AH domain is connected to the TGS domain by Linker Helix 1 that passes under the acceptor arm of A/R tRNA. (D) Comparison of the ACT domain in the 70S-bound RelA and in the solution structure of the isolated ACT dimer of C. tepidum RSH (PDB: 2KO1, [Eletsky et al., 2009]). In the 70S•RelA structures (Structure III is shown), Linker Helix 2 is positioned similarly to a helix from the partner ACT molecule (light blue) in the dimerized ACT domain. The interaction between the linker helix and the ACT domain in Structures II, III and IV suggests that the possible dimerization surface of the ACT domain in free RelA is disrupted upon ordering of RelA by the deacyl-tRNA in the A/R conformation. The colors in all panels are as in Figure 1.
Figure 2—figure supplement 1
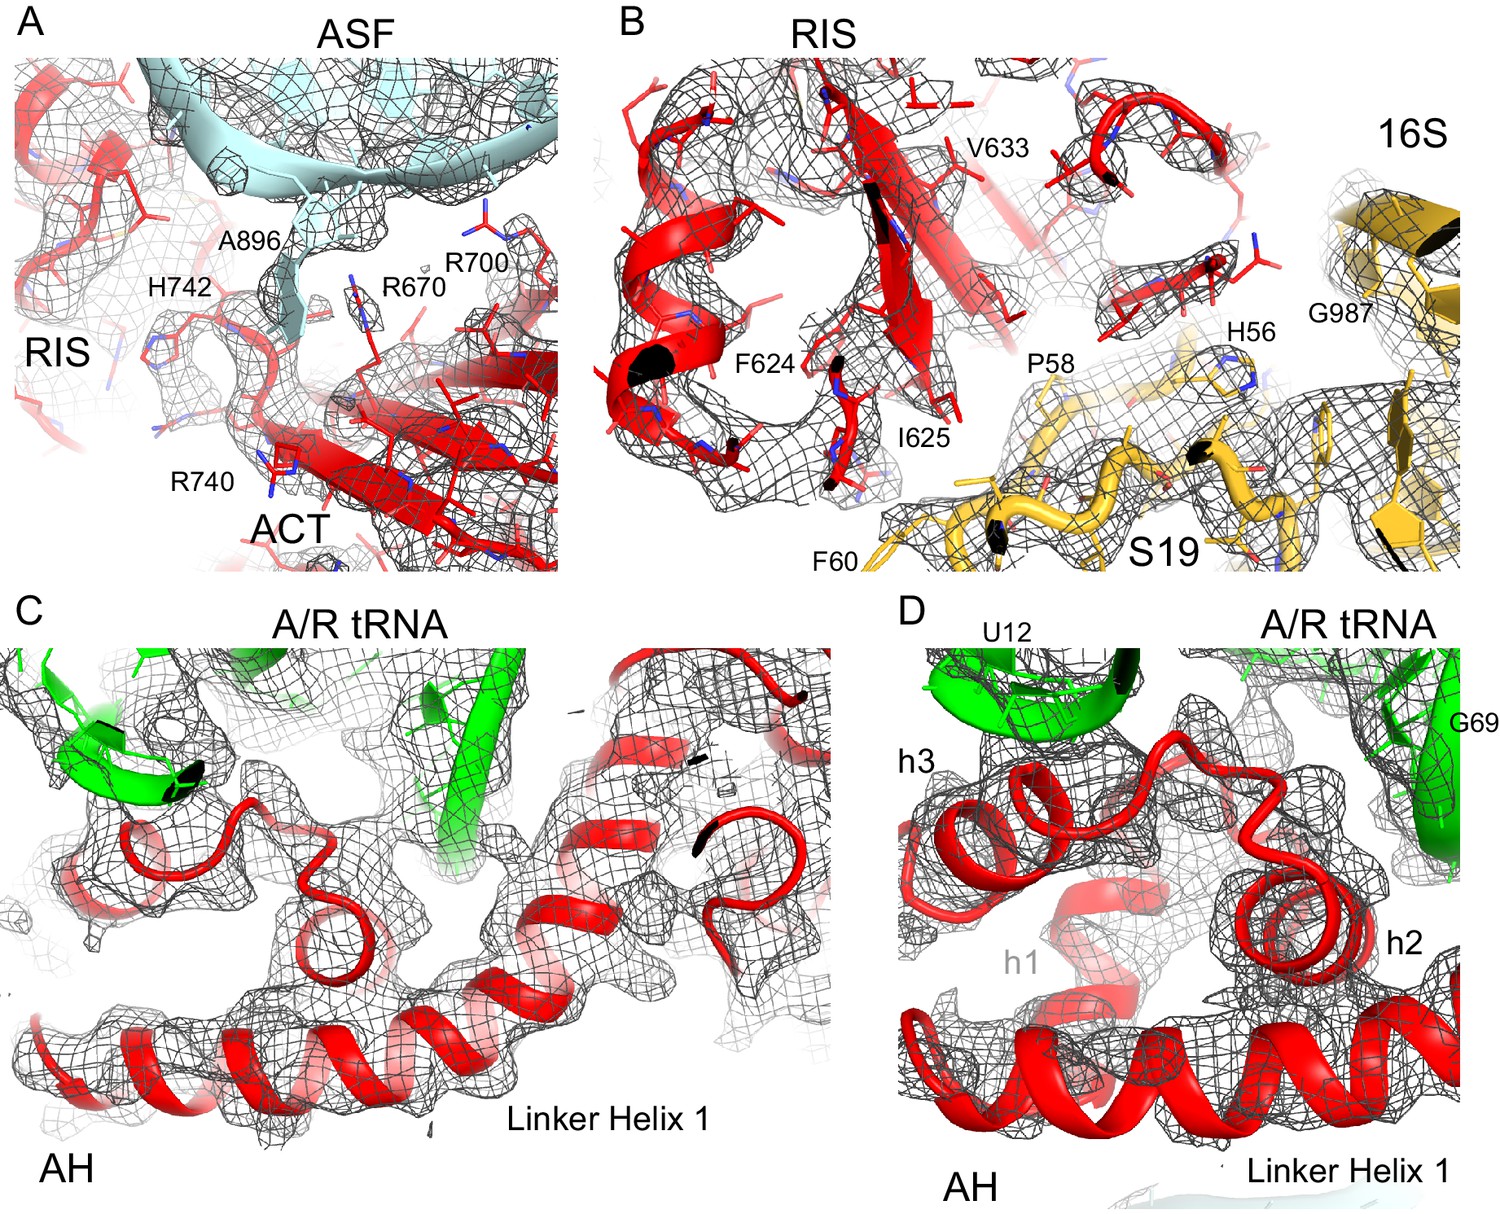
Cryo-EM density for the RIS, ACT and AH domains.
(A) Cryo-EM map (gray) and the structural model of the C-terminal ACT domain and its interaction with the bulged A896 of the A-site finger (ASF) of 23S ribosomal RNA (Structure III). The cryo-EM map was sharpened by applying a B-factor of −120 Å2. The density is shown at 1.75 σ. (B) Cryo-EM density for the RIS domain (Structure III) near ribosomal protein S19 and 16S rRNA (yellow); the cryo-EM map was sharpened by applying a B-factor of −120 Å2. The density is shown at 2.3 σ. (C) Cryo-EM density for the α-helical domain (AH) core, showing the packing of core α-helices and Linker Helix 1 next to the acceptor arm and D stem of the A/R tRNA (green). Cryo-EM map was prepared by local refinement around the AH domain using particles from Structures II, III and IV. The cryo-EM map was sharpened by applying a B-factor of −90 Å2. The density is shown at 1.3 σ. (D) Cryo-EM density for the α-helical domain (AH) core, showing the packing of short α-helices (labeled h1, h2 and h3) next to the A/R tRNA (green). Cryo-EM map as in (C) except that density is shown at 1.9 σ.
Figure 2—figure supplement 2
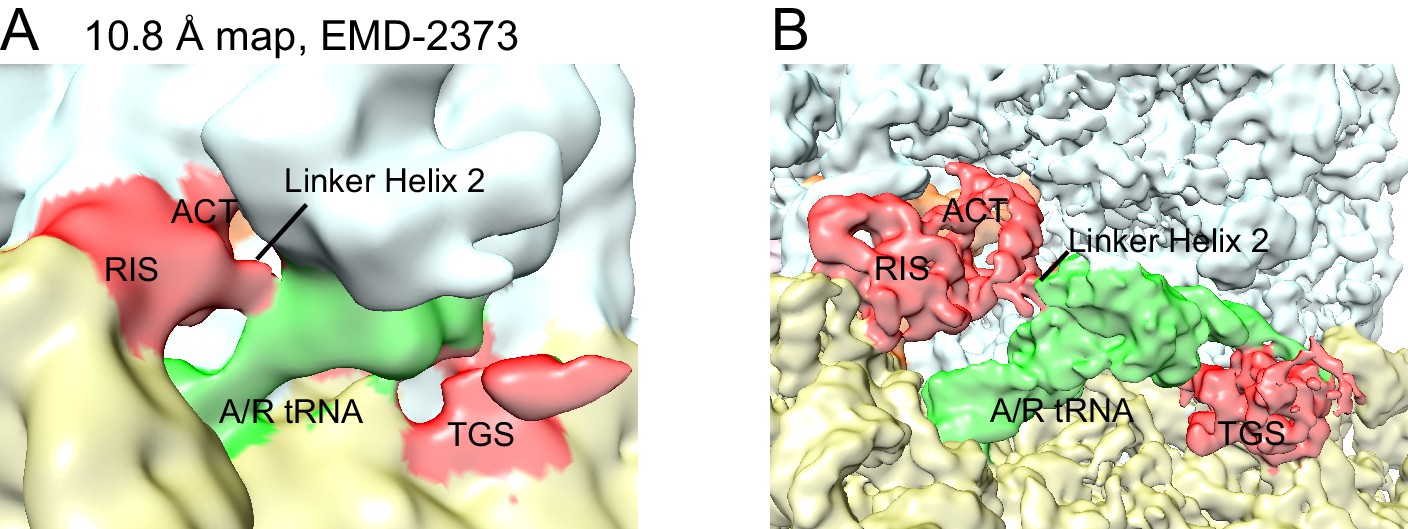
Re-evaluation of the previously reported 10.8 Å cryo-EM map.
(A) EMD-2373 (Agirrezabala et al., 2013) was segmented according to the atomic model for Structure IV. The segmentation reveals density for the RIS and ACT domains at the subunit interface, as reported in this work. Map is shown at contour level of 0.25. 30S is yellow, 50S is pale cyan, RelA is red, A/T tRNA is green. (B) Structure IV map, softened with a B-factor of 50 Å2 and shown at 4.0 σ, was segmented according to its atomic model and colored as in (A).
Figure 3 with 1 supplement
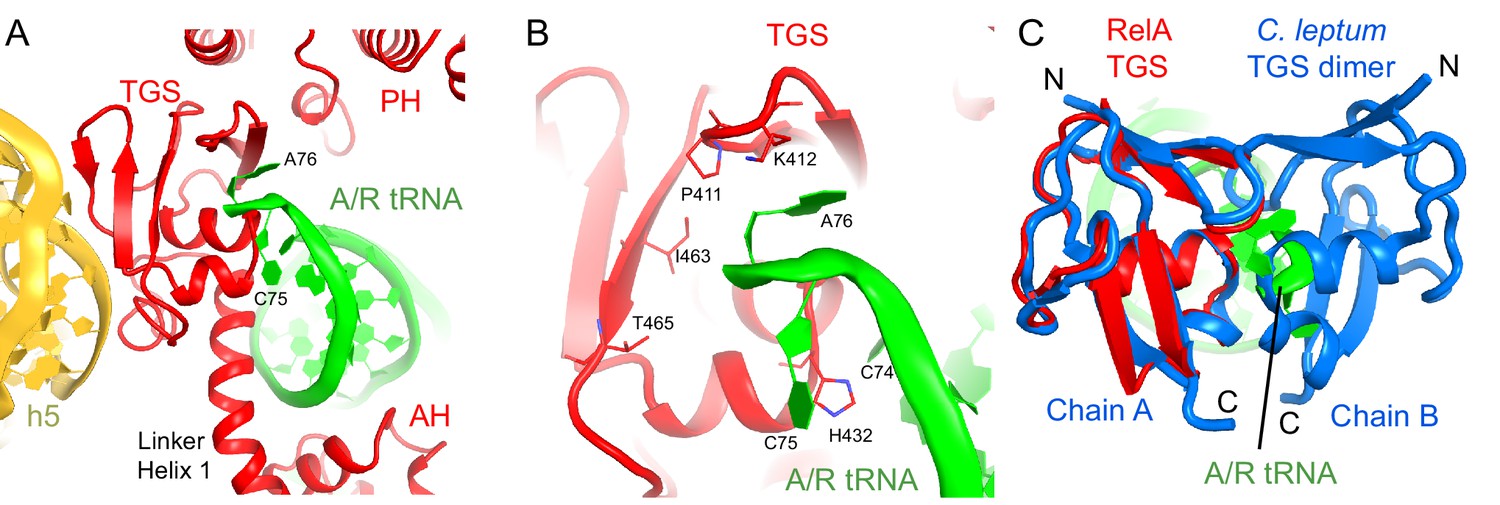
Interactions of the TGS domain of RelA with the A/R tRNA and 16S rRNA.
(A) The 3´ CCA end of A/R tRNA pins the TGS domain against helix 5 of 16S rRNA. (B). Interactions of the terminal nucleotides of the A/R tRNA with the TGS domain. (C) Comparison of the TGS domain bound with the CCA end of the A/R tRNA (this work) with the dimeric TGS domain from C. leptum RSH (Forouhar et al., 2009), showing that the A/R tRNA disrupts the dimerization surface of the isolated homologous TGS domain. Superposition was performed by the structural alignment of the all-atom models of the TGS domain (Structure IV) and the TGS dimer (PDB: 3HVZ). The TGS dimer is shown in blue; other molecules are labeled and colored as in Figure 1. Structure IV is shown in all panels.
Figure 3—figure supplement 1

Interactions of the TGS domain with the A/R tRNA.
(A) The conformations of the TGS domain and interactions with the CCA end of A/R tRNA are similar in Structures II, III and IV. RelA TGS domains from Structures II, III, and IV (aa 404–487) were superimposed. The 30S subunit is not shown for clarity. (B) Cryo-EM density and interactions of the TGS domain with the CCA end of the A/R tRNA. The map for Structure III, which was sharpened by applying a B-factor of −120 Å2, is shown at 2.35 σ. Colors are as in Figure 1.
Figure 4 with 2 supplements
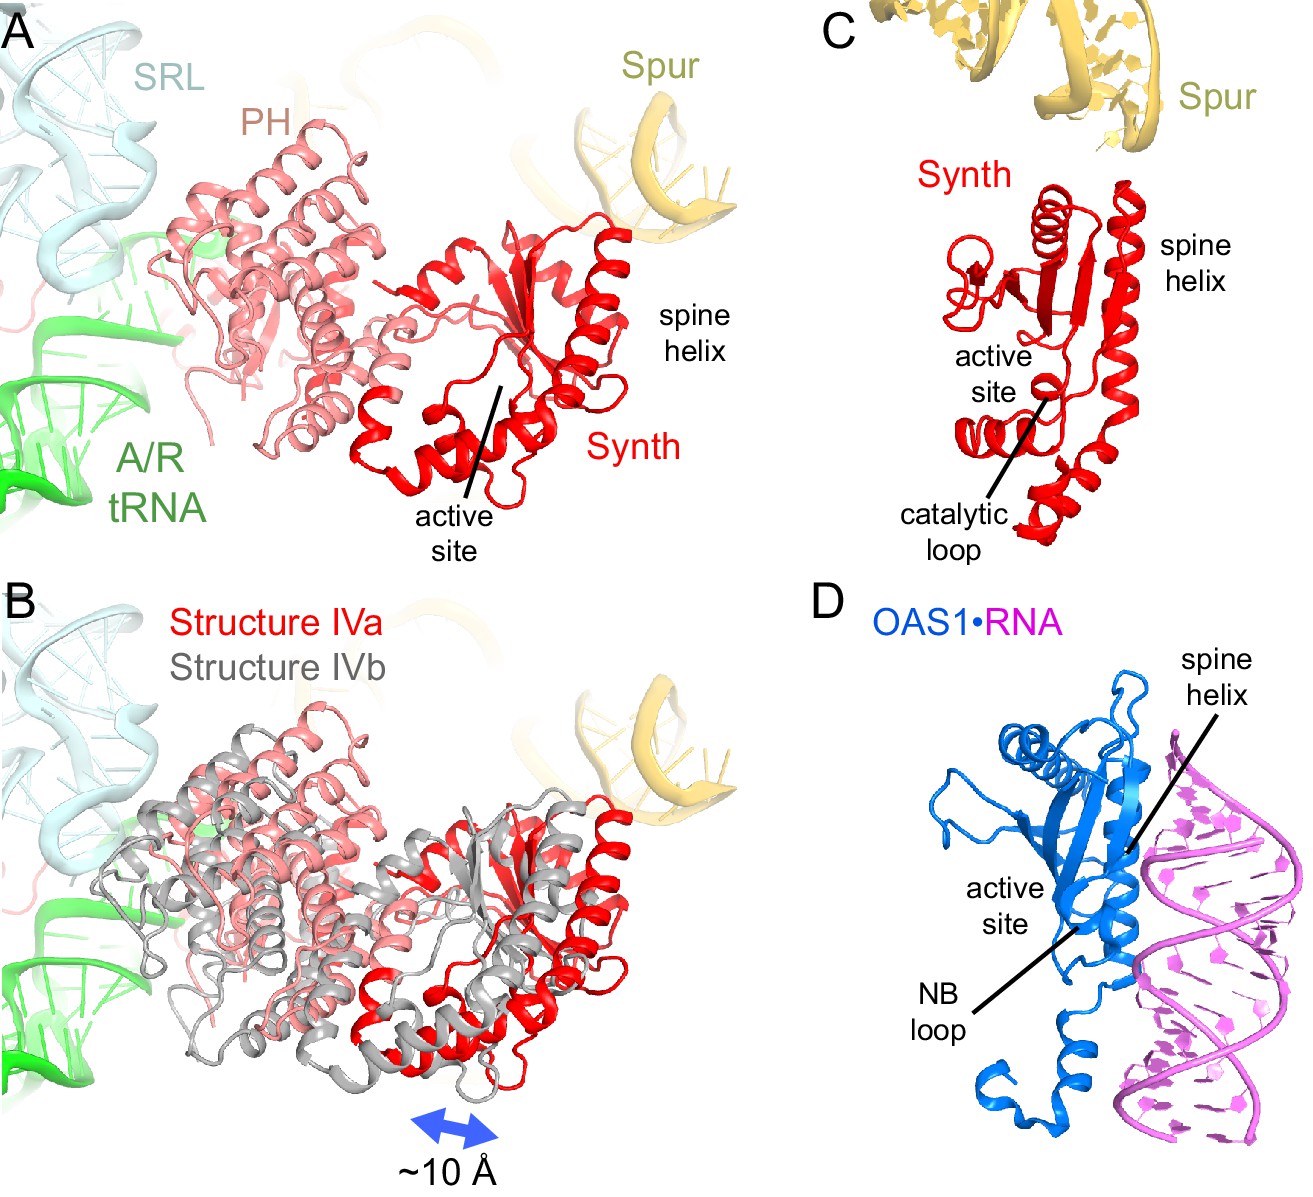
Positions and interactions of the N-terminal domains of RelA.
(A) Pseudo-hydrolase (PH; pink) and synthetase (Synth; red) domains are in the intersubunit space between the sarcin-ricin loop (SRL) of the 23S rRNA and the spur of the 16S rRNA. The N-terminal domains are shown in a conformation, in which the synthetase domain is near the spur (Structure IV is shown). (B) Comparison of the two conformations of the N-terminal domains inferred from the heterogeneous cryo-EM density by additional sub-classification (Structure IV is shown; see also Figure 4—figure supplement 1). The red model is shown as in (A). The gray model exhibits a conformation shifted away from the spur. (C) Relative positions of the synthetase domain and the spur in Structure IVa. (D) Structure of the innate immune sensor OAS1 (blue, PDB: 4RWP) bound with an RNA helix (magenta) (Lohöfener et al., 2015). OAS1 is a second-messenger-(2′-5′-oligoadenylate)-synthesizing enzyme, whose architecture resembles that of the synthetase domain of RelA, shown in a similar orientation in (C). The nucleotide-binding loop (NB loop) and other structural elements are labeled.
Figure 4—figure supplement 1
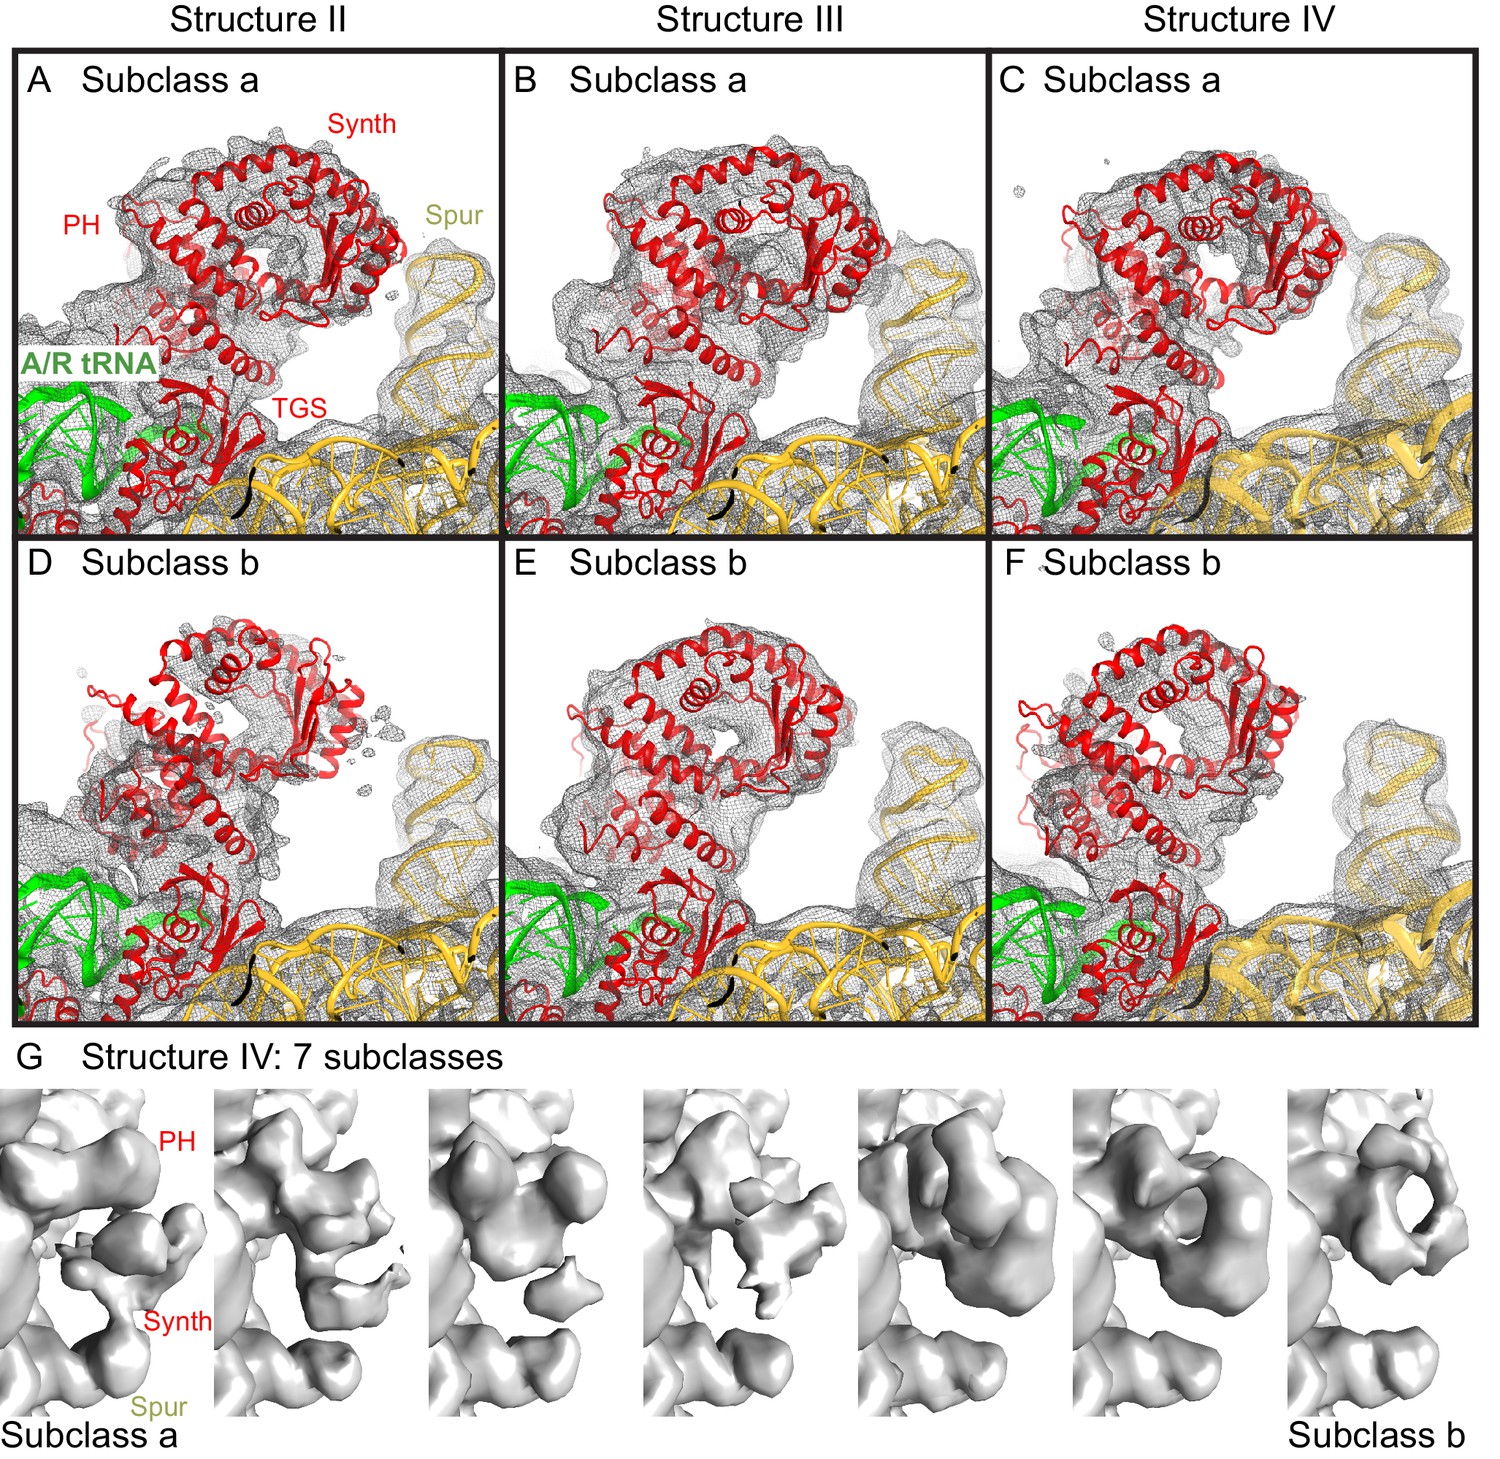
Cryo-EM densities for the N-terminal domains, obtained by sub-classification of Structures II, III and IV.
(A−F).Two predominant conformations of the N-terminal domains are shown, obtained by sub-classification of each Structure into three classes. In one class, the synthetase domain is in the vicinity of the 30S spur (Subclass a, panels A–C), whereas in the second class, the synthetase domain is shifted by ~10 Å away from the spur (Subclass b, panels D–F). The spur, A/R tRNA, and domains of RelA (pseudo-hydrolase (PH), synthetase (Synth) and TGS) are labeled. Colors are as in Figure 1. The maps, which were softened by applying a B-factor of 20 Å2 and 6 Å low-pass filter, are shown at 1.25–1.5 σ. (G). Sub-classification into 7 subclasses shows additional positions of the synthetase domain between the extreme positions (the latter are similar to Subclasses a and b, shown in panels A–F). The maps for Structure IV, which were softened by applying a B-factor of 20 Å2 and 10 Å low-pass filter, are shown at 1.4 σ.
Figure 4—figure supplement 2
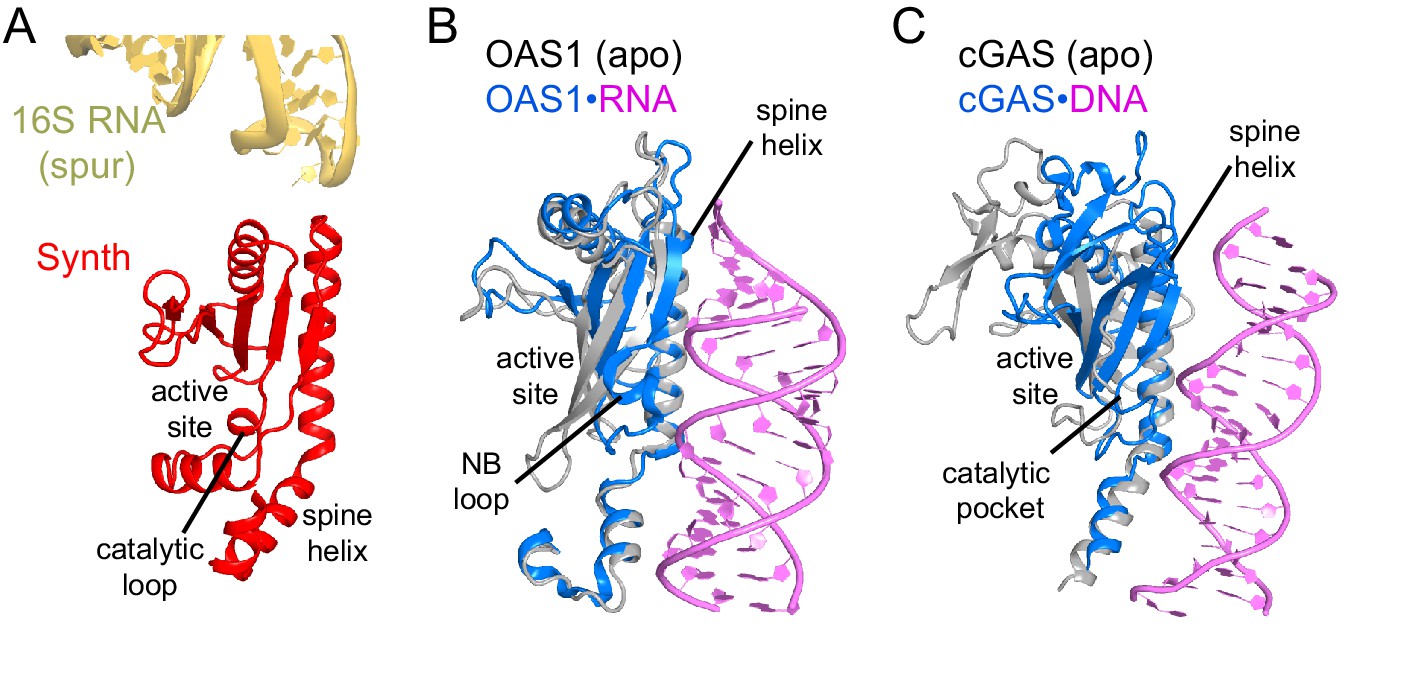
Comparison of the synthetase domain of RelA with metazoan innate immune sensors OAS1 and cGAS.
(A) Position of the synthetase domain of RelA (red) in Structure IV near the tip of the spur of the 30S subunit (yellow). (B) Interaction of OAS1 (blue) with an RNA helix (magenta) results in conformational rearrangements relative to the apo-form of OAS1 (gray; PDB: 4WRP and 4WRQ; [Lohöfener et al., 2015]). (C) Interaction of cGAS (blue) with a DNA helix (magenta) results in conformational rearrangements relative to the apo-form of cGAS (gray; PDB: 4K96 and 4K8V;[Gao et al., 2013]).
Figure 5 with 1 supplement
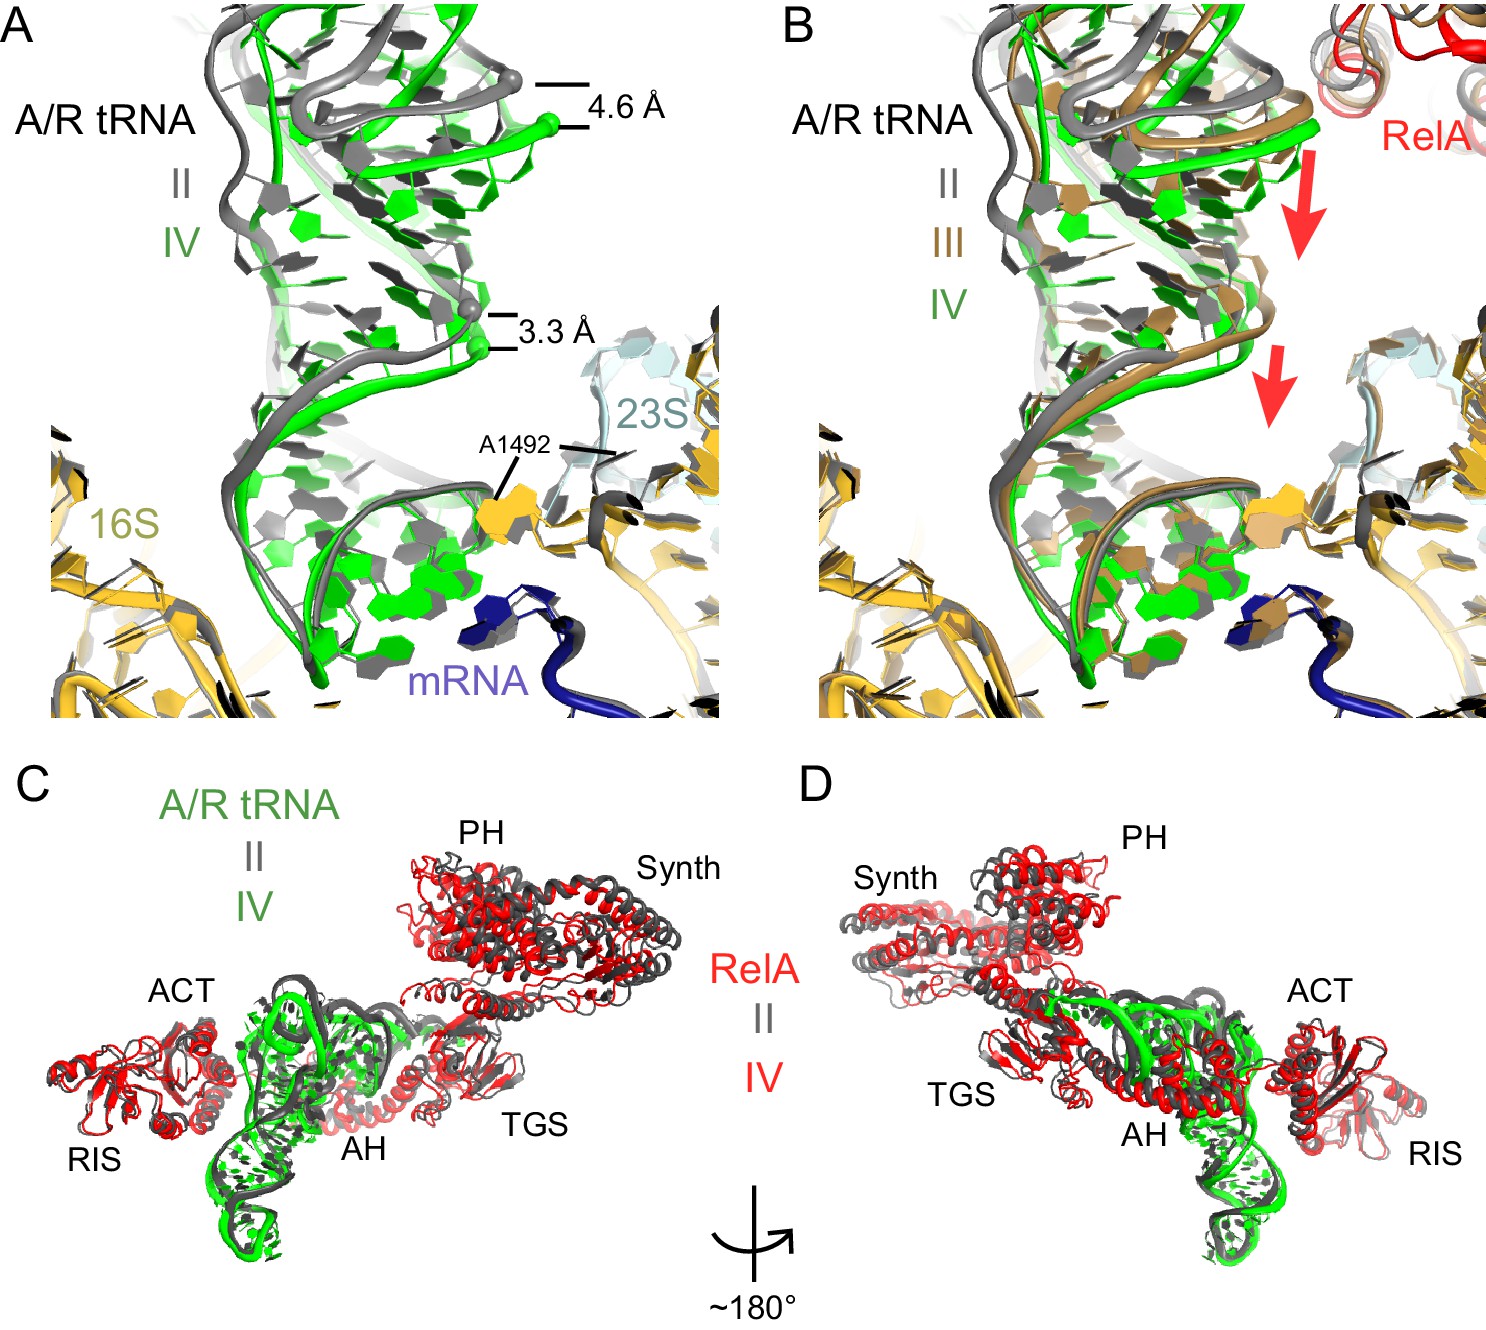
A/R tRNA and RelA rearrange toward the 30S subunit in Structures II to IV.
(A) A/R tRNA settles into the decoding center of the 30S subunit between Structures II (grey) and IV (colored as in Figure 1). Structures II and IV were aligned on the 16S rRNA. RelA is not shown. The positions of A1492 in Structures II and IV are labeled for reference. (B) A/R tRNA and RelA positions in Structures II (grey), III (gold) and IV (colored as in Figure 1). (C) and (D) Two views showing that RelA shifts with the A/R tRNA between Structure II (grey) and Structure IV (colored as in Figure 1). The TGS domain, which interacts with the acceptor arm of A/R tRNA, moves more than the RIS and ACT domains. The superposition of Structures II and IV was performed by structural alignment of the 16S rRNA.
Figure 5—figure supplement 1
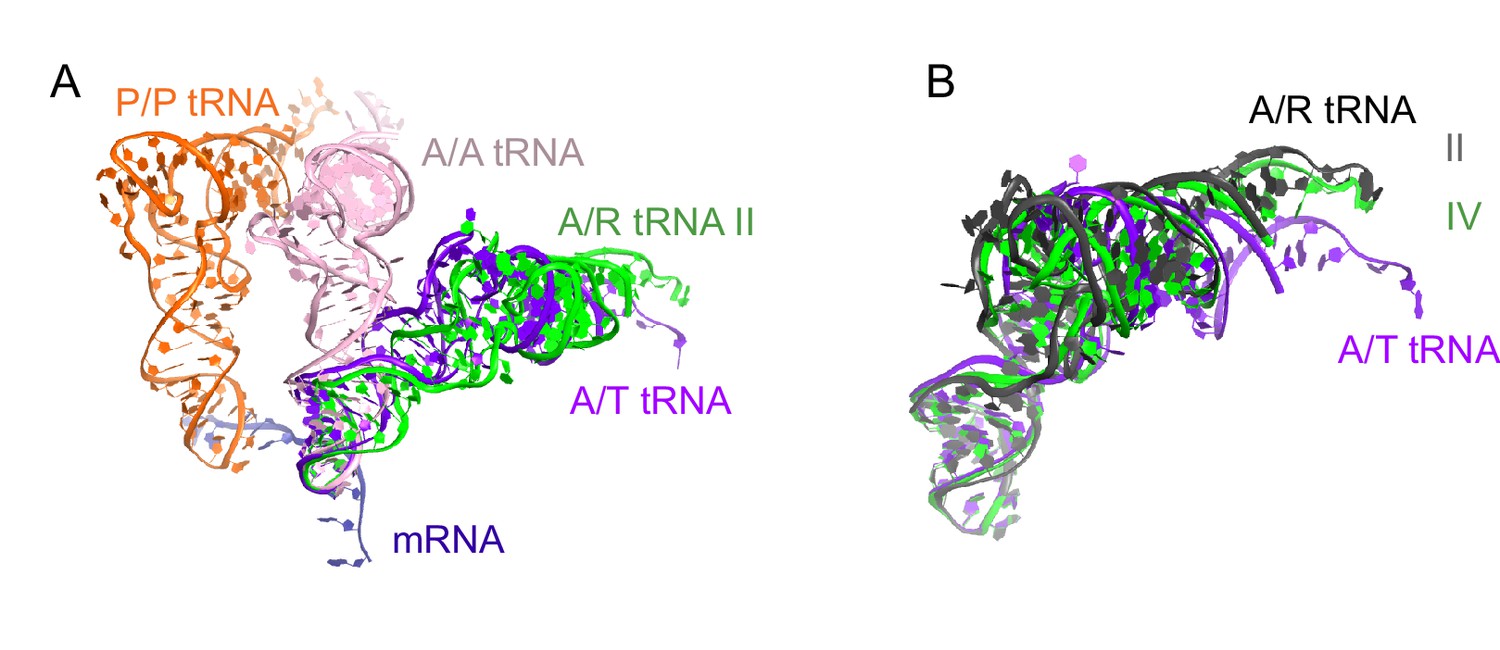
Comparison of A/R tRNA to A/T and A/A tRNA.
(A) The position of A/R tRNA in Structure II (green) is compared with the A/T tRNA (purple) in E. coli 70S•EF-Tu•GDP•kirromycin•Phe-tRNAPhe complex (PDB: 5AFI; [Fischer et al., 2015]) and A/A tRNA (pink) in 70S ribosome complex with 3 tRNAs (PDB: 4V6F; [Jenner et al., 2010]). P/P tRNA from Structure II is also shown. Superposition was obtained by the structural alignment of the 16S rRNA. (B) Conformations of the A/R tRNA in Structures II (grey) and IV (green) are compared with the A/T tRNA (purple) in the E. coli 70S•EF-Tu•GDP•kirromycin•Phe-tRNAPhe complex (PDB: 5AFI; [Fischer et al., 2015]). Superposition was obtained by structural alignment of the anticodon (nt 34–36). The 3′-end of A/R tRNA in Structure II is displaced by ~10 Å from the 3′-end of A/T tRNA.
Figure 6 with 3 supplements
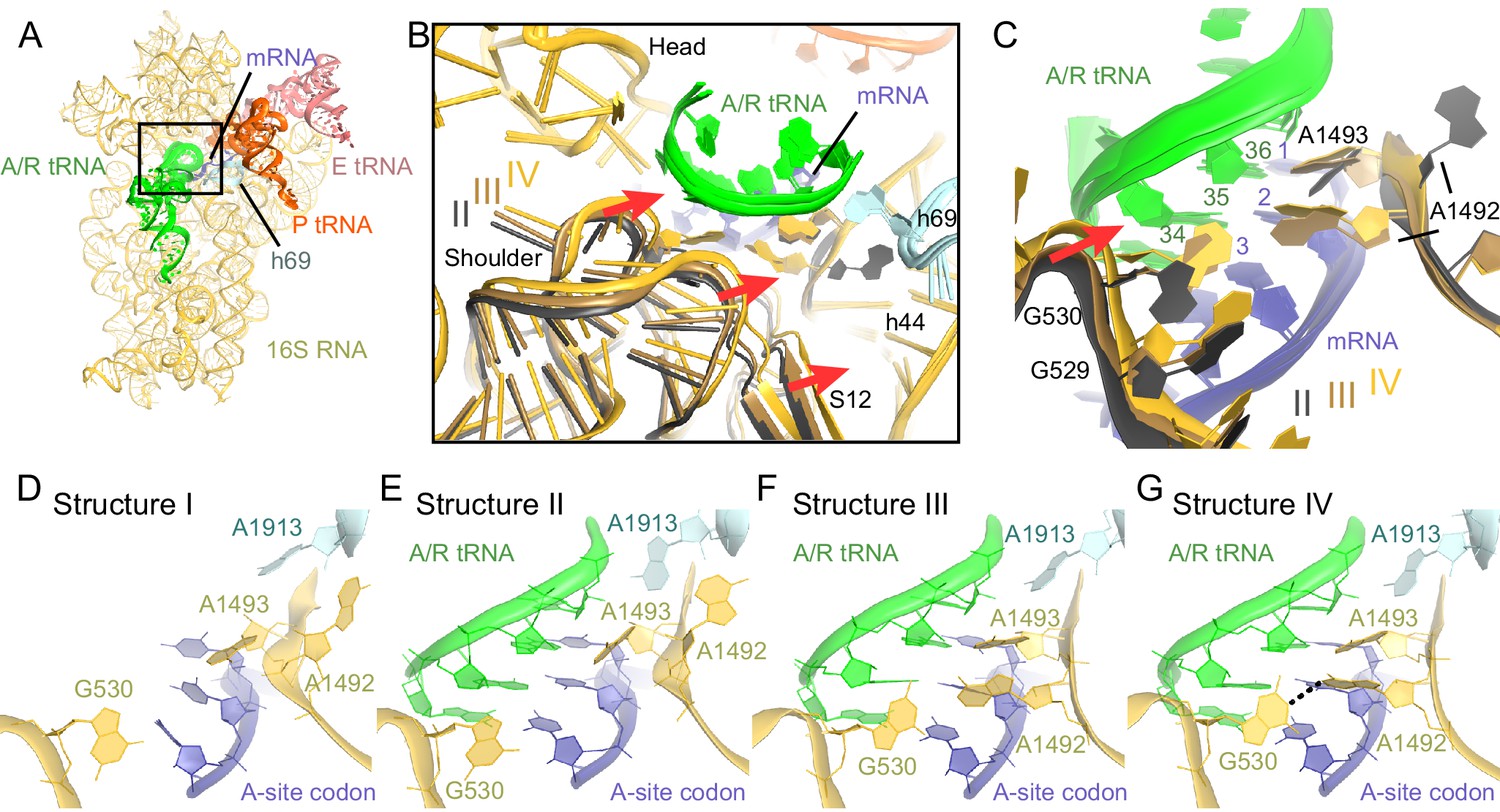
Closure of the 30S subunit and decoding-center rearrangements in Structures II, III and IV.
(A) A view down on the 30S subunit from the inter-subunit interface shows the position of the decoding center (boxed). The 50S subunit (except for helix 69), small ribosomal proteins and RelA are omitted for clarity. (B) The conformational differences in the 30S subunits of Structures II, III and IV suggest a domain-closure pathway. From Structure II to IV, the 30S shoulder is shifted by more than 4 Å toward the 30S head. The superposition of Structures II, III, and IV was performed by structural alignment of nt 980–1200 of 16S rRNA, corresponding to the 30S head. (C) Conformational differences in the decoding-center’s universally conserved nucleotides A1492, A1493, and G530 of Structure II, III, and IV are shown after alignment as in (B). (D) The decoding center of Structure I, which lacks A/R tRNA, is similar to that of the 30S domain-open structures with a vacant A site (Ogle et al., 2001; Jenner et al., 2010). (E) The decoding center of Structure II reveals a previously unseen state, in which the domain-open 30S subunit contains a tRNA in the A site. A1493 is near the first base pair of the codon-anticodon helix; A1492 is in helix 44, whereas G530 adopts the conformation previously observed in the absence of the A-site tRNA (Ogle et al., 2001; Jenner et al., 2010). (F) The decoding center of Structure III reveals a previously unseen state, in which the 30S subunit adopts an intermediate domain-closure conformation. A1493 and A1492 interact with the first and second base pairs of the codon-anticodon helix, respectively, whereas G530 is oriented toward A1492. (G) The decoding center of Structure IV, with a closed 30S conformation, comprises A1493 and A1492 forming A-minor interactions with the first two base pairs of the codon-anticodon helix, whereas G530 is shifted toward helix 44 and interacts with A1492. This conformation resembles that of other 30S domain-closed structures in pre-accommodation-like 70S•EF-Tu•aa-tRNA complexes (Stark et al., 2001; Valle, 2002; Schmeing et al., 2009) and 70S complexes with fully accommodated A/A tRNA (Voorhees et al., 2009; Jenner et al., 2010; Demeshkina et al., 2012). Proteins are omitted for clarity in (C–G).
-
Figure 6—source data 1
Distances between Structures II, III and IV, reflecting the movement of the 30S shoulder domain from Structures II to III to IV, relative to the head and the body of the 30S subunit.
- https://doi.org/10.7554/eLife.17029.020
Figure 6—figure supplement 1
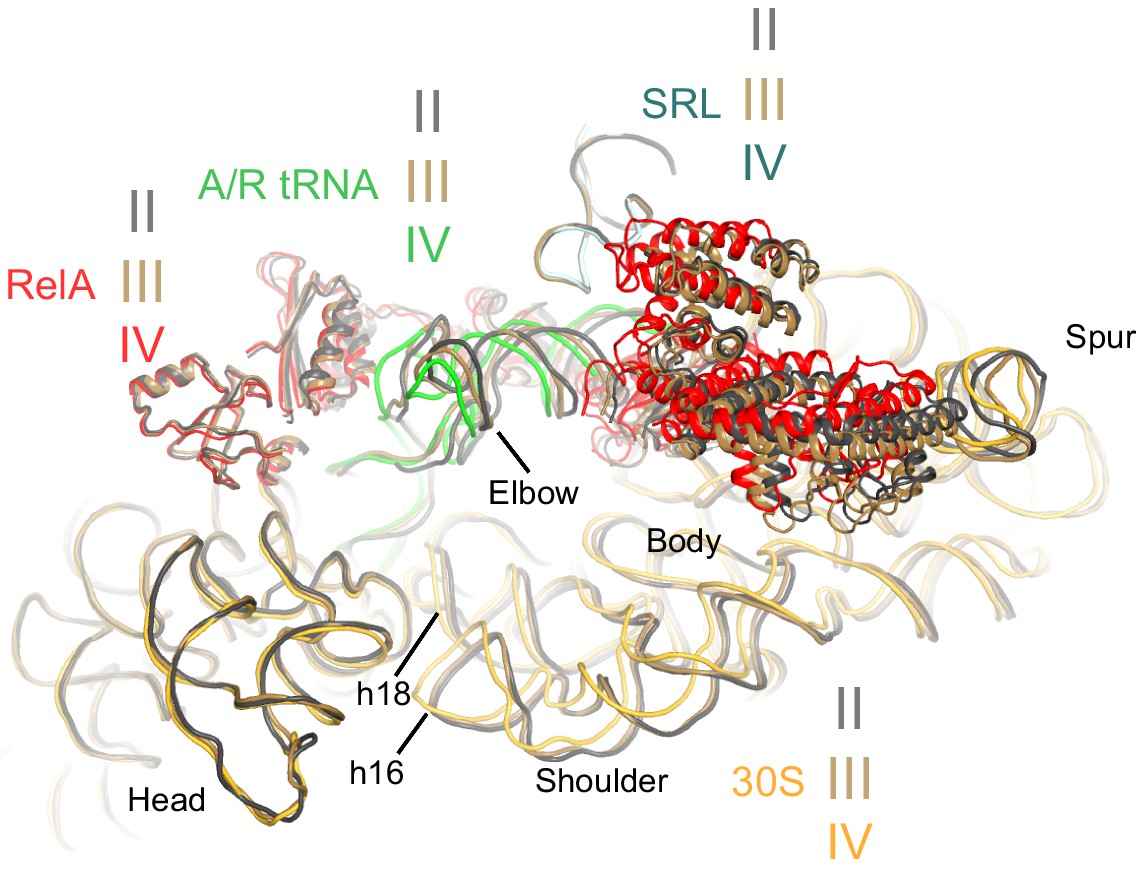
Comparison of the 30S subunits of Structures II, III and IV reveals domain closure of the 30S subunit from Structure II to IV.
The 30S subunit adopts the most open conformation in Structure II, intermediate conformation in Structure III, and most closed conformation in Structure IV. In Structure IV, the shoulder of the 30S subunit at helix 16 (h16) and helix 18 (h18) with the 530 loop is shifted by more than 4 Å toward the head, relative to those in Structure II (see also Figure 6—source data 1). The superposition was obtained by structural alignment of the 23S rRNA from Structures II, III and IV. Sarcin-ricin loop (SRL) is shown as part of the 23S rRNA for reference. Structure II is colored gray, Structure III is colored gold, and Structure IV is colored as in Figure 1.
Figure 6—figure supplement 2
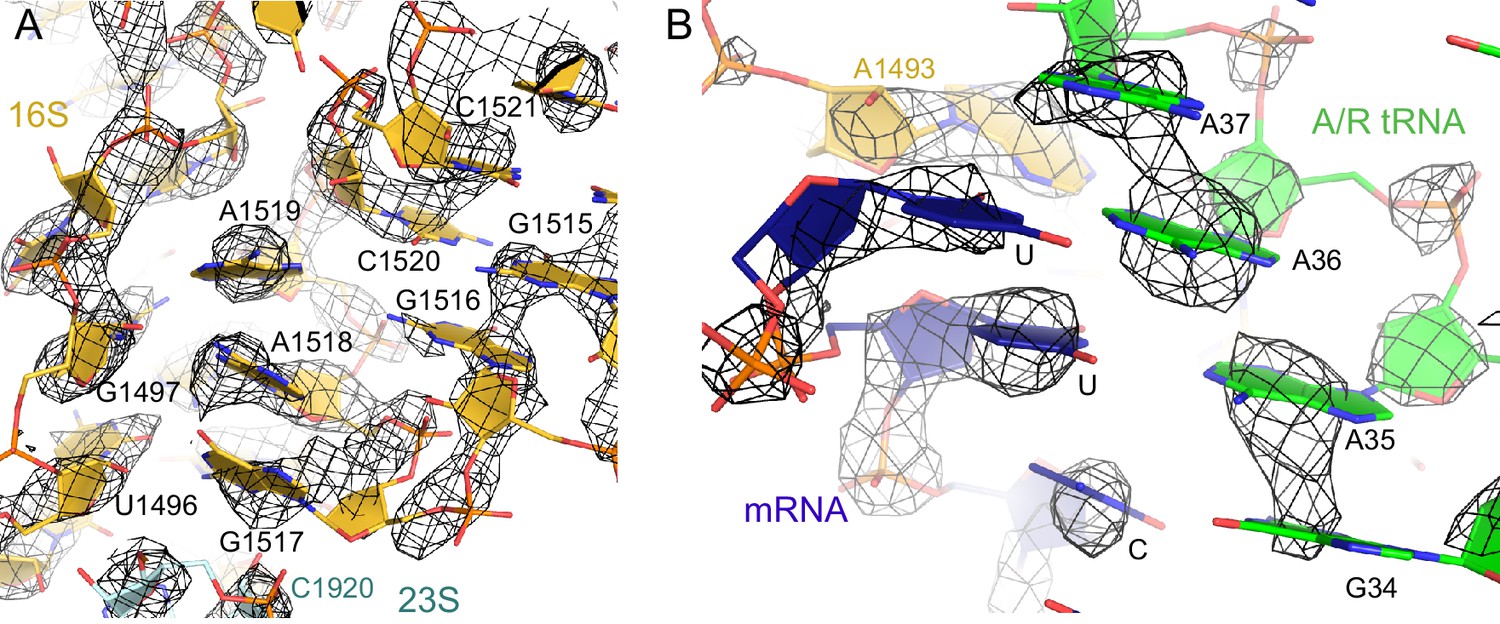
The nucleotides at the decoding center and vicinity are resolved in the cryo-EM density.
(A) Example of cryo-EM density near the decoding center in Structure III. The map was sharpened by applying a B-factor of -100 Å2 and is shown at 3.2 σ. (B) Example of cryo-EM density showing the codon:anticodon interaction (blue and green) in Structure IV. The map was sharpened by applying a B-factor of -200 Å2 and is shown at 6.0 σ.
Figure 6—figure supplement 3
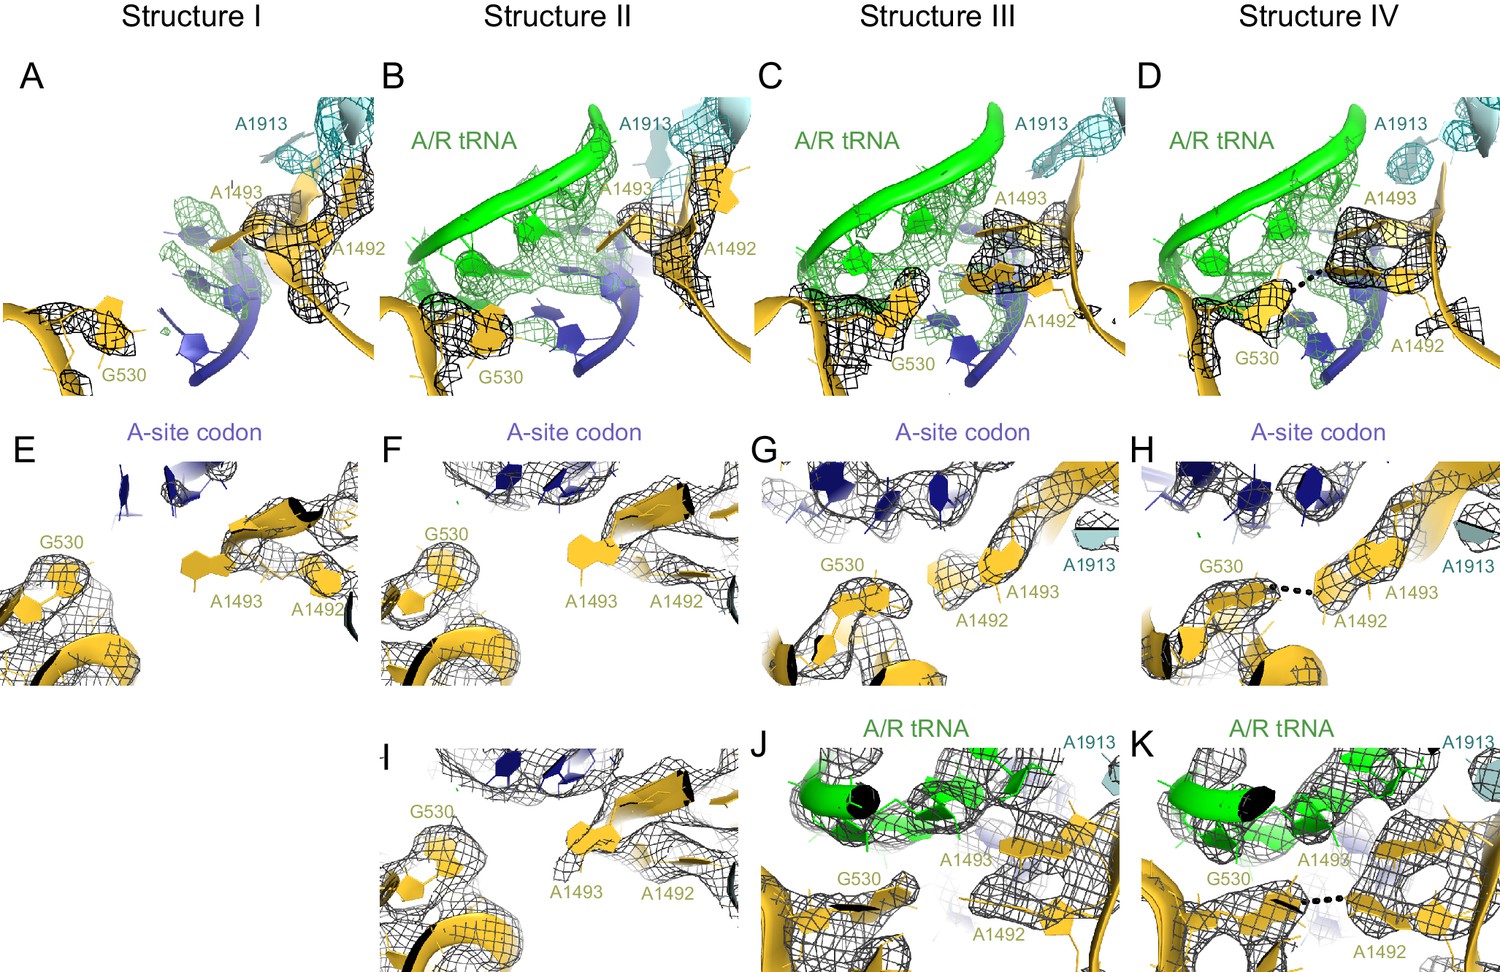
Conformational differences between the decoding centers of Structures I through IV.
(A) Cryo-EM density (shown as mesh) of the decoding center in Structure I. The map was sharpened by applying a B-factor of -120 Å2 and density is shown at 2.0 σ for mRNA, 4.0 σ for G530, 2.0 σ for A1492, A1493 and A1913. (B) Cryo-EM density for the decoding center in Structure II. The map was sharpened by applying a B-factor of -100 Å2 and density is shown at 2.6 σ for mRNA and anticodon of tRNA, 3.5 σ for G530, and 2.3 σ for A1492, A1493 and A1913. (C) Cryo-EM density for the decoding center in Structure III. The map was sharpened by applying a B-factor of -120 Å2 and density is shown at 3.3 σ for mRNA and anticodon of tRNA, 3.3 σ for G530, 3.0 σ for A1492, A1493, and A1913. (D) Cryo-EM density for the decoding center in Structure IV. The map was sharpened by applying a B-factor of -120 Å2 and density is shown at 4.0 σ for mRNA and anticodon of tRNA, 4.0 σ for G530, 3.5 σ for A1492 and A1493, and 3.5 σ for A1913. (E–H) Additional views of cryo-EM densities for G530, A1492 and A1493 in Structures I-IV. The direction of the view is approximately down the helical axis of the anticodon-stem loop of the A/R tRNA (not shown). (E). Cryo-EM density for G530, A1492 and A1493 in Structure I. The map was sharpened by applying a B-factor of -120 Å2; density is shown at 2.3 σ. (F) Cryo-EM density for G530, A1492 and A1493 in Structure II. The map was sharpened by applying a B-factor of -100 Å2 and density is shown at 2.1 σ. (G) Cryo-EM density for G530, A1492 and A1493 in Structure III. The map was sharpened by applying a B-factor of -120 Å2 and density is shown at 2.5 σ. (H) Cryo-EM density for G530, A1492 and A1493 in Structure IV. The map was sharpened by applying a B-factor of -120 Å2 and density is shown at 3.5 σ. (I) Cryo-EM density for the decoding center nucleotides of Structure II, shown at 1.6 σ. Weak density for A1493 is visible. The map was sharpened by applying a B-factor of -100 Å2. (J) Cryo-EM density for the decoding center of Structure III, shown at 3 σ. The map was sharpened by applying a B-factor of -120 Å2. (K) Cryo-EM density for the decoding center of Structure IV, shown at 3.5 σ. The map was sharpened by applying a B-factor of -120 Å2. The structures are colored as in Figure 1.
Figure 7 with 1 supplement
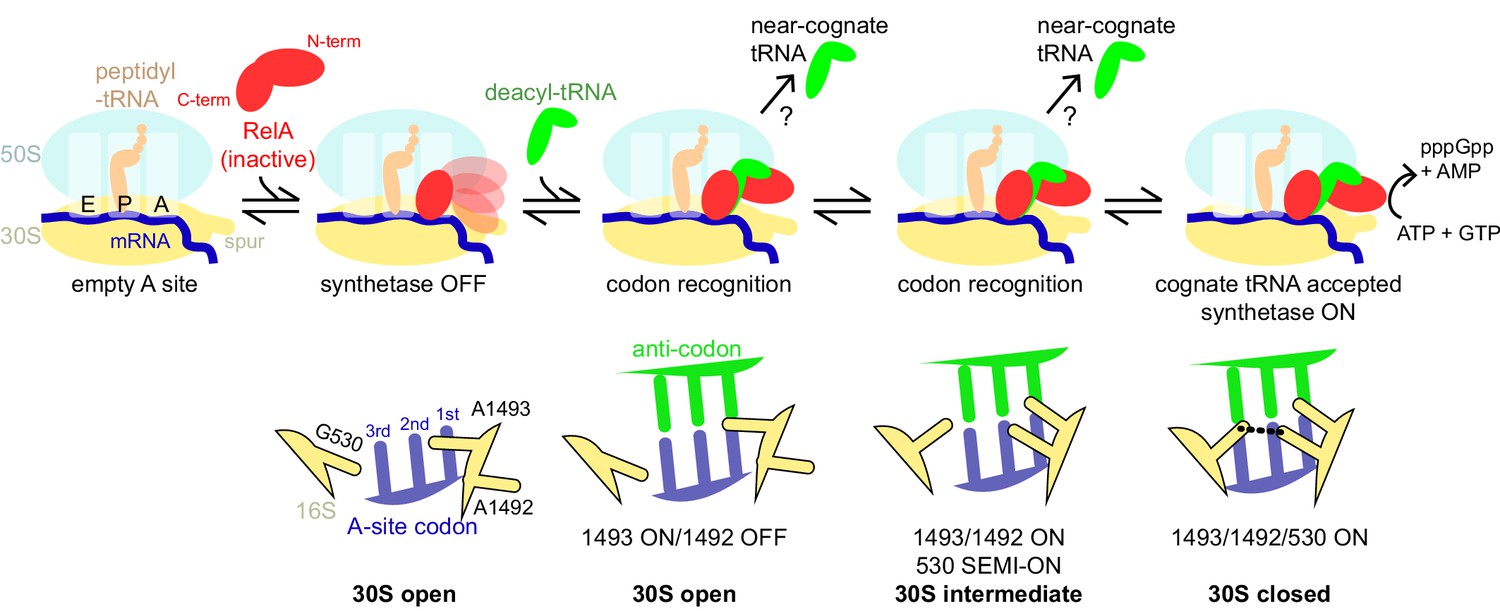
Schematic of the mechanism of RelA activation by the ribosome and cognate deacyl-tRNA.
The C-terminal domains of RelA, the RIS and the ACT, bind the ribosome at the intersubunit bridge B1a near the vacant A site, but the synthetase remains unbound and inactive. When deacyl-tRNA binds to the ribosomal A site, the decoding center controls the selection of cognate tRNA, coupled with domain closure of the 30S subunit. The codon recognition checkpoints are mediated by distinct positions of the universally conserved nucleotides of the decoding center A1492, A1493 and G530. Upon binding of cognate deacyl-tRNA to the ribosome, the RelA synthetase domain is exposed in the vicinity of the 30S spur and is activated for (p)ppGpp synthesis by alleviation of RelA autoinhibition and interactions with the ribosome.
Figure 7—figure supplement 1

Superpositions with structures of 70S-ribosome complexes suggest that RelA is displaced from ribosomes during tRNA accommodation and translocation.
(A) In the absence of deacyl-tRNA, a RelA-bound 70S ribosome can accommodate EF-Tu ternary complex. Superposition of the 70S•RelA complex, Structure I, with the E. coli 70S•EF-Tu•GDP•kirromycin•Phe-tRNAPhe complex (PDB: 5AFI; [Fischer et al., 2015]) was obtained by structural alignment of the 16S rRNA. (B) The ACT domain of RelA sterically clashes with fully accommodated A-site tRNA. The 16S rRNA of Structures I, IV and a 70S•tRNA complex containing three tRNAs (PDB: 3I8H and 3I8I; [Jenner et al., 2010]) were superimposed. Structure I is shown in red. A/A tRNA from PDB: 3I8I is shown in blue. A/R tRNA from Structure IV is shown in green. (C) In the rotated (hybrid-state) conformation of the 70S ribosome sampled during translocation, the RIS domain interactions with S19 would be disrupted. Superposition of the 70S•RelA complex (Structure I) with the pre-translocation 70S•tRNA•EF-G•viomycin complex (PDB: 4V7C; [Brilot et al., 2013]) was obtained by structural alignment of 23S rRNA. The 50S subunit (cyan), RelA (red), S19 (yellow) and P tRNA (orange) are from Structure I. 30S subunit (gray) and S19 (black) are from PDB: 4V7C. (D) In the post-translocation state, elongation factor G (EF-G) sterically clashes with Linker Helix 2 of RelA. Superposition of the 70S•RelA•deacyl-tRNA complex (Structure IV) with a 70S•EF-G•GDP•fusidic acid complex (PDB: 2WRI; [Gao et al., 2009]) was obtained by structural alignment of the 16S rRNA. EF-G domain IV (blue, residues 483–603) and post-translocation tRNA (orange) are shown from PDB: 2WRI. RelA RIS and ACT domains and Linker Helix 2 (red) are shown from Structure I.
Videos
Video 1
An animation showing transitions between Structures I, II, III and IV.
Three views (scenes) are shown: (1) A view of the complete 70S complex, as in Figure 1; two conformations of the N-terminal domain of RelA are shown for Structures II, III and IV. In Structure I, the central and N-terminal domains of RelA are not resolved – here, a model from Structure IV is shown in gray for reference. (2) A close-up view, showing A/R tRNA accommodation ('settling') into the decoding center and 30S domain rearrangements. The head of the 30S subunit is shown on the left, the body of the 30S is on the right, the shoulder is oriented toward the viewer. (3) A close-up view of the decoding center, similar to that shown in Figure 6D–G. Colors are as in Figure 1.
Download links
A two-part list of links to download the article, or parts of the article, in various formats.
Downloads (link to download the article as PDF)
Open citations (links to open the citations from this article in various online reference manager services)
Cite this article (links to download the citations from this article in formats compatible with various reference manager tools)
Ribosome•RelA structures reveal the mechanism of stringent response activation
eLife 5:e17029.
https://doi.org/10.7554/eLife.17029


