Ca2+ entry into neurons is facilitated by cooperative gating of clustered CaV1.3 channels
- University of California, United States
- University of Washington, United States
Figures
Figure 1 with 1 supplement
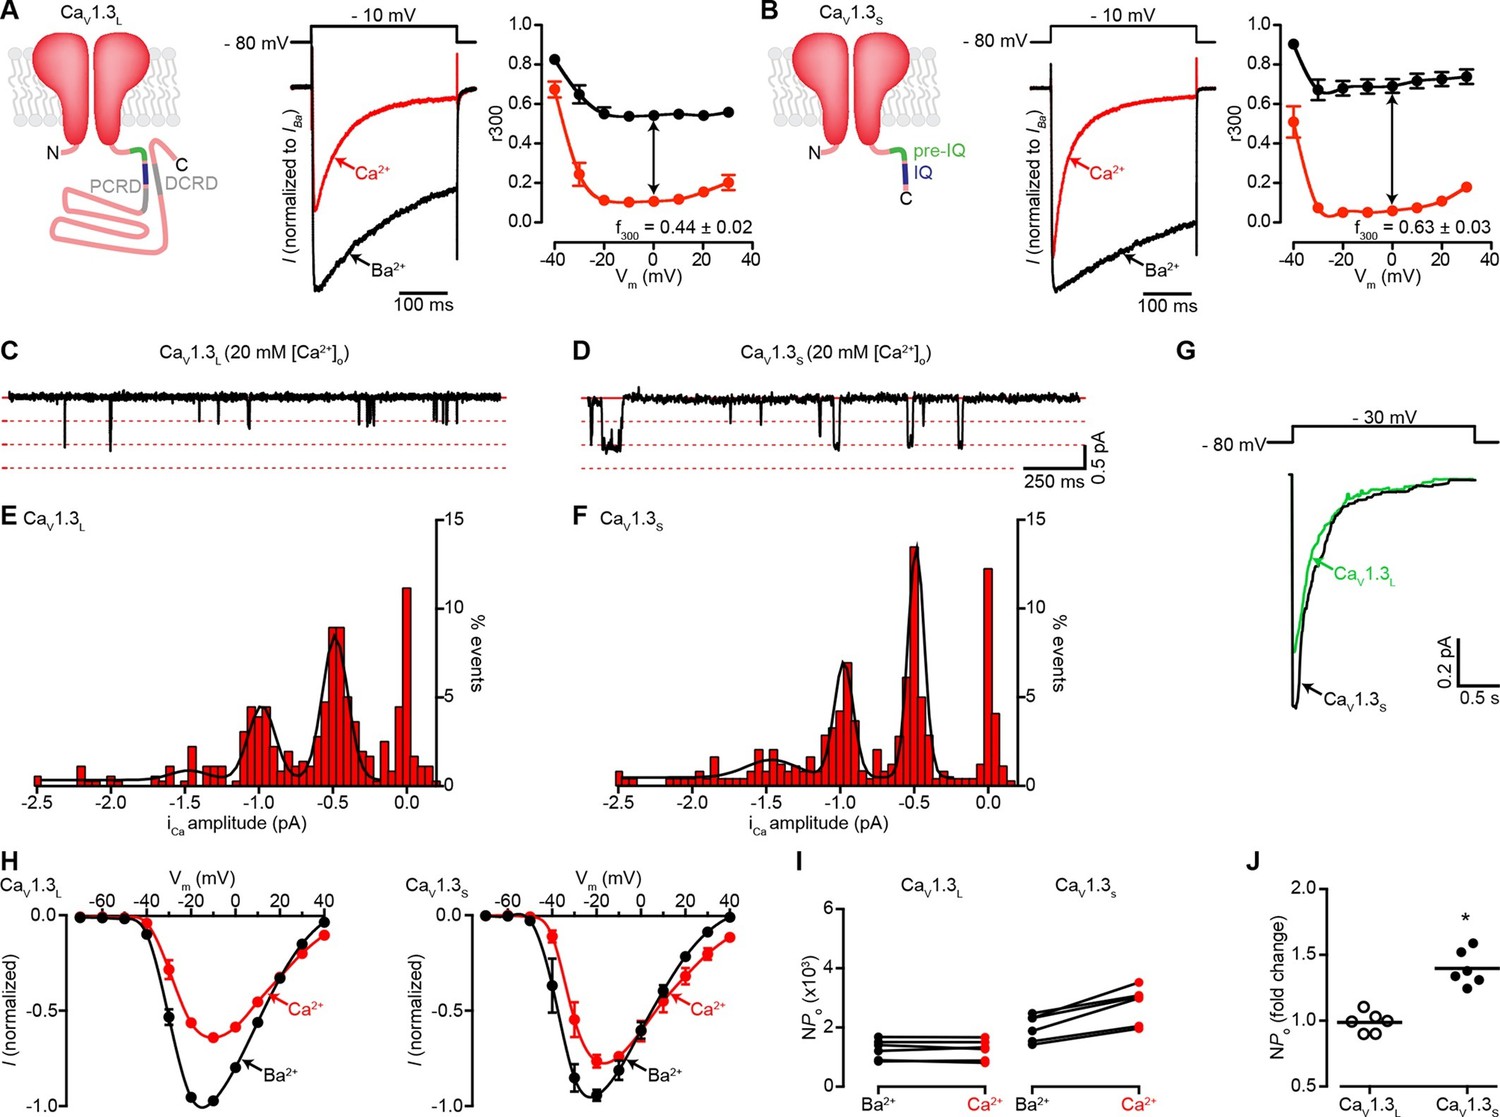
Ca2+ enhances the activity of CaV1.3S, but not CaV1.3L, channels.
(A) Left: Schematic of CaV1.3L channel splice variant, depicting the domains important for Ca2+-mediated regulation: pre-IQ (green), IQ (blue), proximal and distal C-terminal regulatory domains (PCRD, DCRD, gray). Middle: Representative ICa and IBa of CaV1.3L channels expressed in tsA-201 cells. Currents were evoked by a 300-ms depolarization from holding potential of -80 mV to a test potential of -10 mV, with 2 mM Ba2+ (black) or 2 mM Ca2+ (red) as the charge carrier in the same cell. Right: Voltage dependence of CaV1.3L channel CDI. r300 is the fraction of ICa or IBa remaining after 300 ms. f300 is the difference between ICa and IBa r300 values at 0 mV. (B) Left: Schematic of CaV1.3S channel splice variant. Middle: Representative ICa and IBa of CaV1.3S channels. Right: Voltage dependence of CaV1.3S channel CDI, format as in (A). ICa is presented as normalized to IBa, currents analyzed for these experiments were in a range between 200 and 900 pA. (C and D) Representative iCa single channel recordings from CaV1.3L (C) and CaV1.3S channels (D) expressed in tsA-201 cells during step depolarizations from -80 to -30 mV. (E and F) all-points iCa amplitude histograms for CaV1.3L (E) and CaV1.3S channels (F), the black line is the best fit to the data with a multi-Gaussian function with a quantal unit value of -0.48 ± 0.07 for CaV1.3L and -0.49 ± 0.01 pA for CaV1.3S channels, respectively (constructed from n = 6 cells each). Single channel recordings were also performed using Ba2+ as the charge carrier for both channels (see Figure 1—figure supplement 1). (G) Ensemble average single-channel currents from multiple sweeps. (H) Current-voltage relationships of CaV1.3L currents (left) and CaV1.3S currents (right) in the presence of 2 mM Ca2+ (red) or Ba2+ (black) as the charge carrier. Data were normalized to the maximum current in the presence of Ba2+. Symbols are averages of 7 cells ± SEM. (I) Scatter plots of NPo (at -10 mV) of CaV1.3L (left) and CaV1.3S (right) channels in the presence of Ba2+ and Ca2+. (J) Change in NPo for CaV1.3L and CaV1.3S channels for currents recorded in the presence of Ca2+ and then Ba2+. The horizontal bar shows the mean value (*p < 0.001).
Figure 1—figure supplement 1
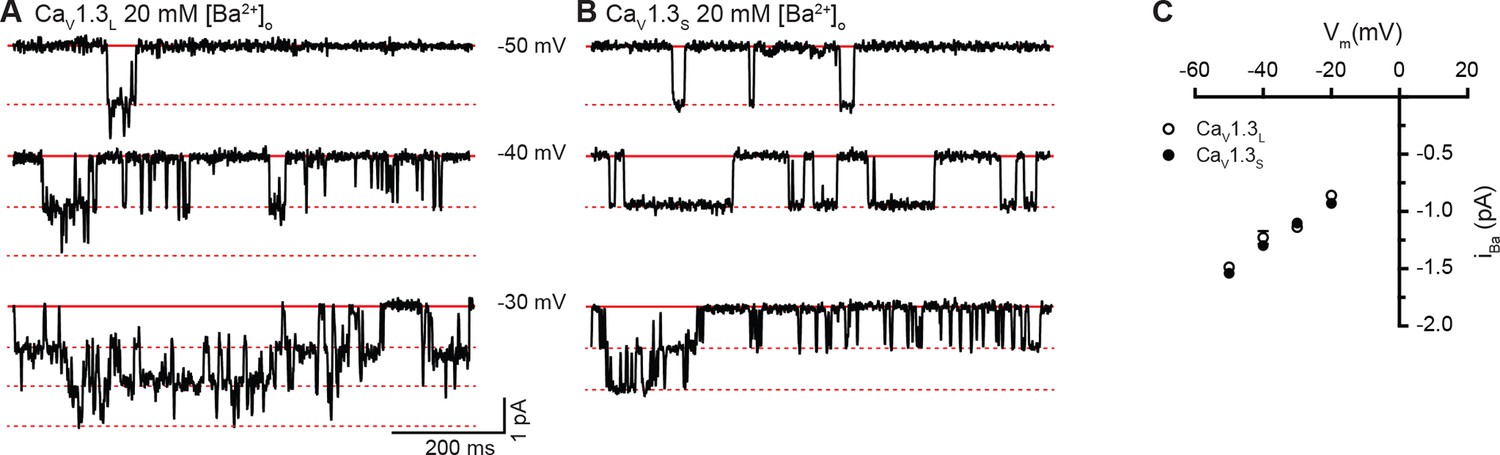
Single-channel recordings of iBa for CaV1.3S and CaV1.3L channels.
(A and B) Representative iBa single channel recordings from CaV1.3S (A) and CaV1.3L channels (B) expressed in tsA-201 cells during step depolarizations from -80 to -30 mV. (C) Average single-channel current-voltage relationship ± SEM. Data from 5 cells for CaV1.3S and 7 cells for CaV1.3L.
Figure 2
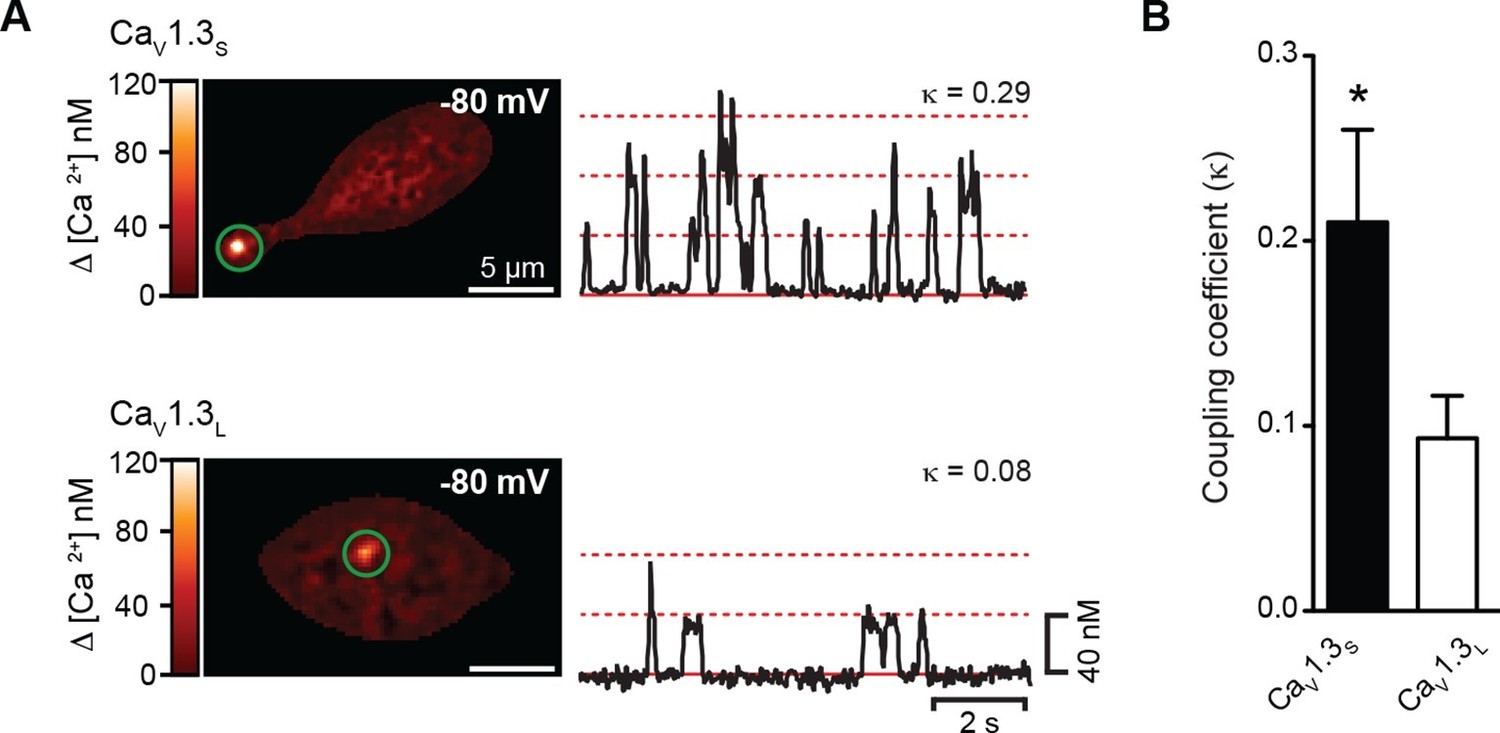
CaV1.3S but not CaV1.3L channels gate cooperatively to increase Ca2+ influx.
(A) TIRF images of spontaneous CaV1.3S (top) and CaV1.3L sparklets (bottom) at a holding potential of -80 mV in tsA-201 cells expressing the respective channels. Traces at the right show the time course of [Ca2+]i in the sites marked by the green circles. The dotted red lines show the amplitudes of 1 to 3 quantal levels. The coupling coefficient (κ) is shown above each trace. (B) Bar chart showing the coupling coefficient for the CaV1.3S and CaV1.3L sparklets sites. Bars are averages of 5 cells ± SEM (*p<0.05).
Figure 3 with 2 supplements
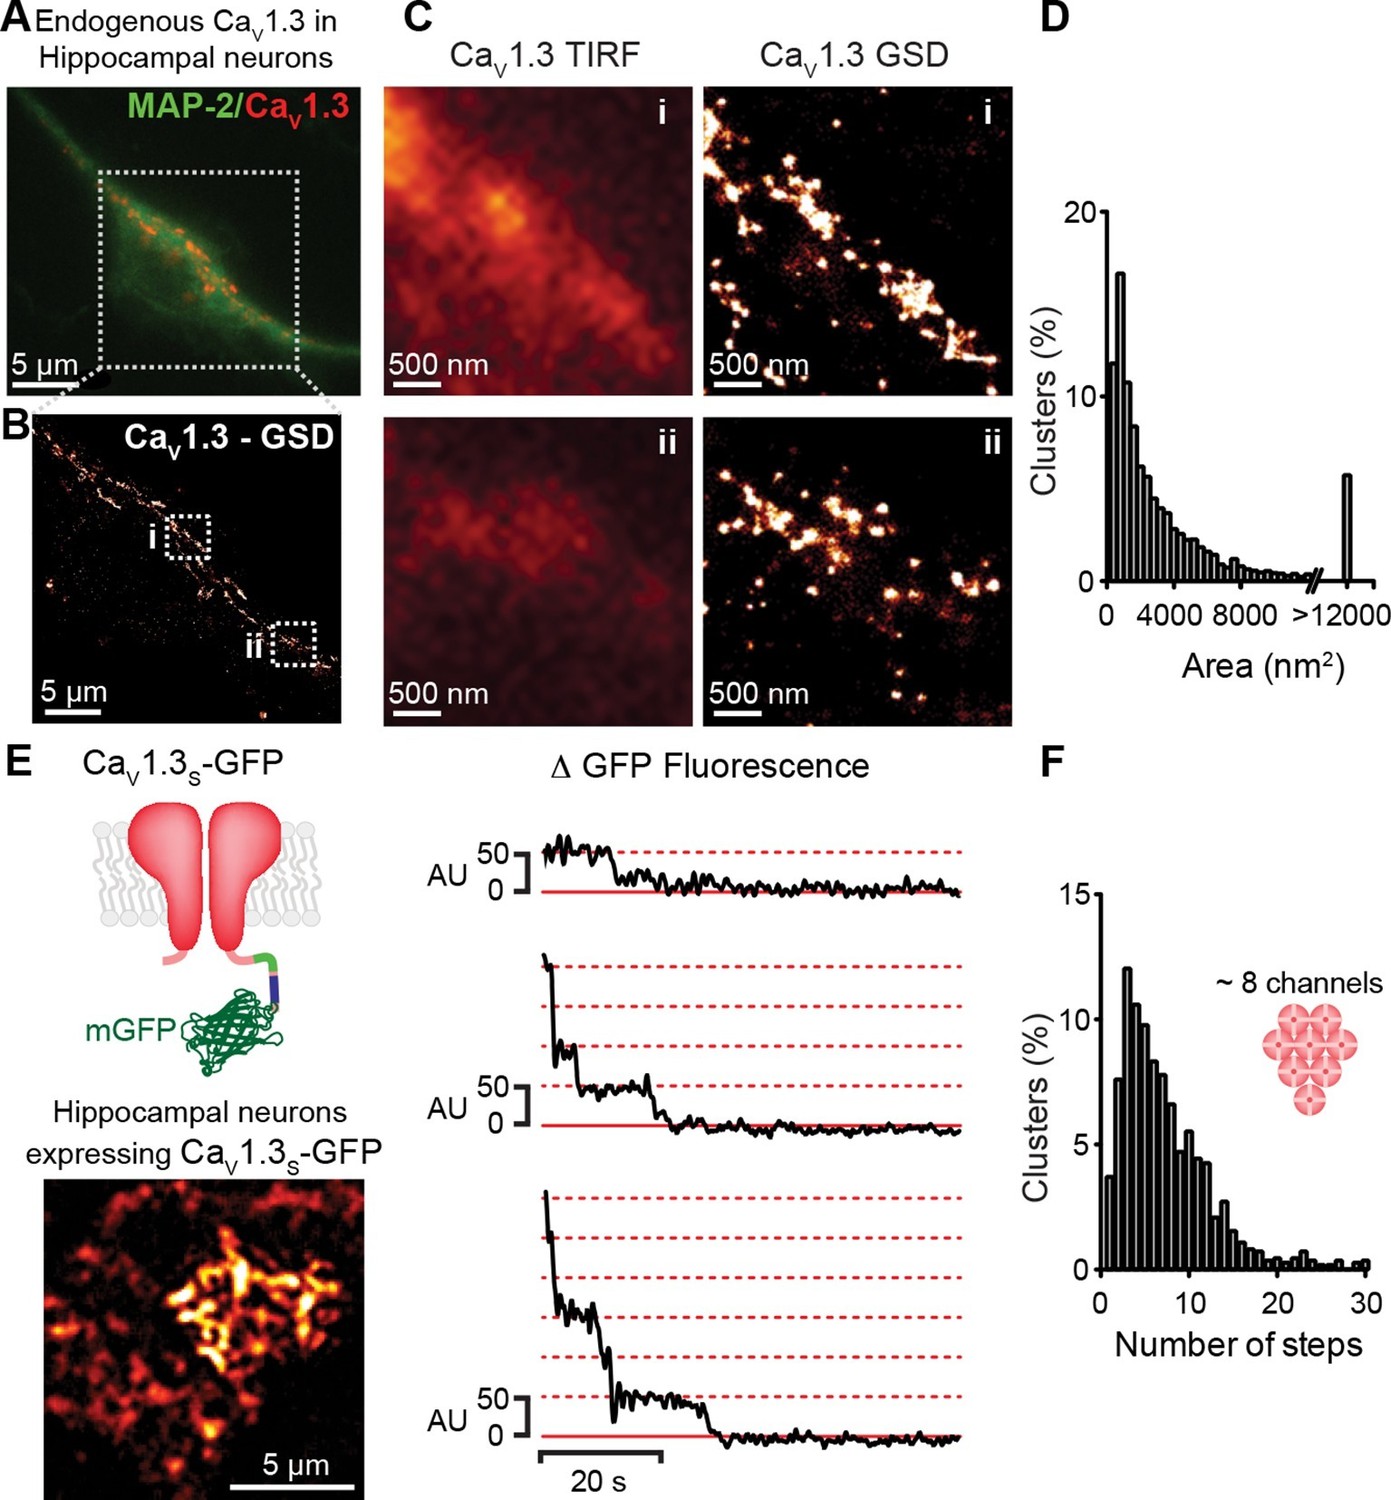
CaV1.3 channels assemble into clusters in the plasma membrane of cultured hippocampal neurons.
(A) Wide-field image of a representative cultured hippocampal neuron immunostained for CaV1.3 channels (red) and the neuronal marker microtubule-associated protein 2 (MAP2; green). (B) Super-resolution (GSD) image of CaV1.3 channels in the outlined region in (A). (C) Comparison of conventional (TIRF, left) and super-resolution (GSD, right) images of CaV1.3 clusters in zones i and ii outlined in (B). (D) Frequency distribution of the area of CaV1.3 channel clusters (n = 5320 clusters from 5 cells). (E) TIRF image of CaV1.3S-mGFP channels expressed in cultured hippocampal neurons (left). Examples of sequential photobleaching steps for three different clusters (right). (F) Frequency distribution of CaV1.3S cluster bleaching steps (n = 1105 clusters from 18 cells). Clustering of CaV1.3S and CaV1.3L channels was tested in tsA-201 cells expressing the respective isoform (See also Figure 3—figure supplement 1).
Figure 3—figure supplement 1
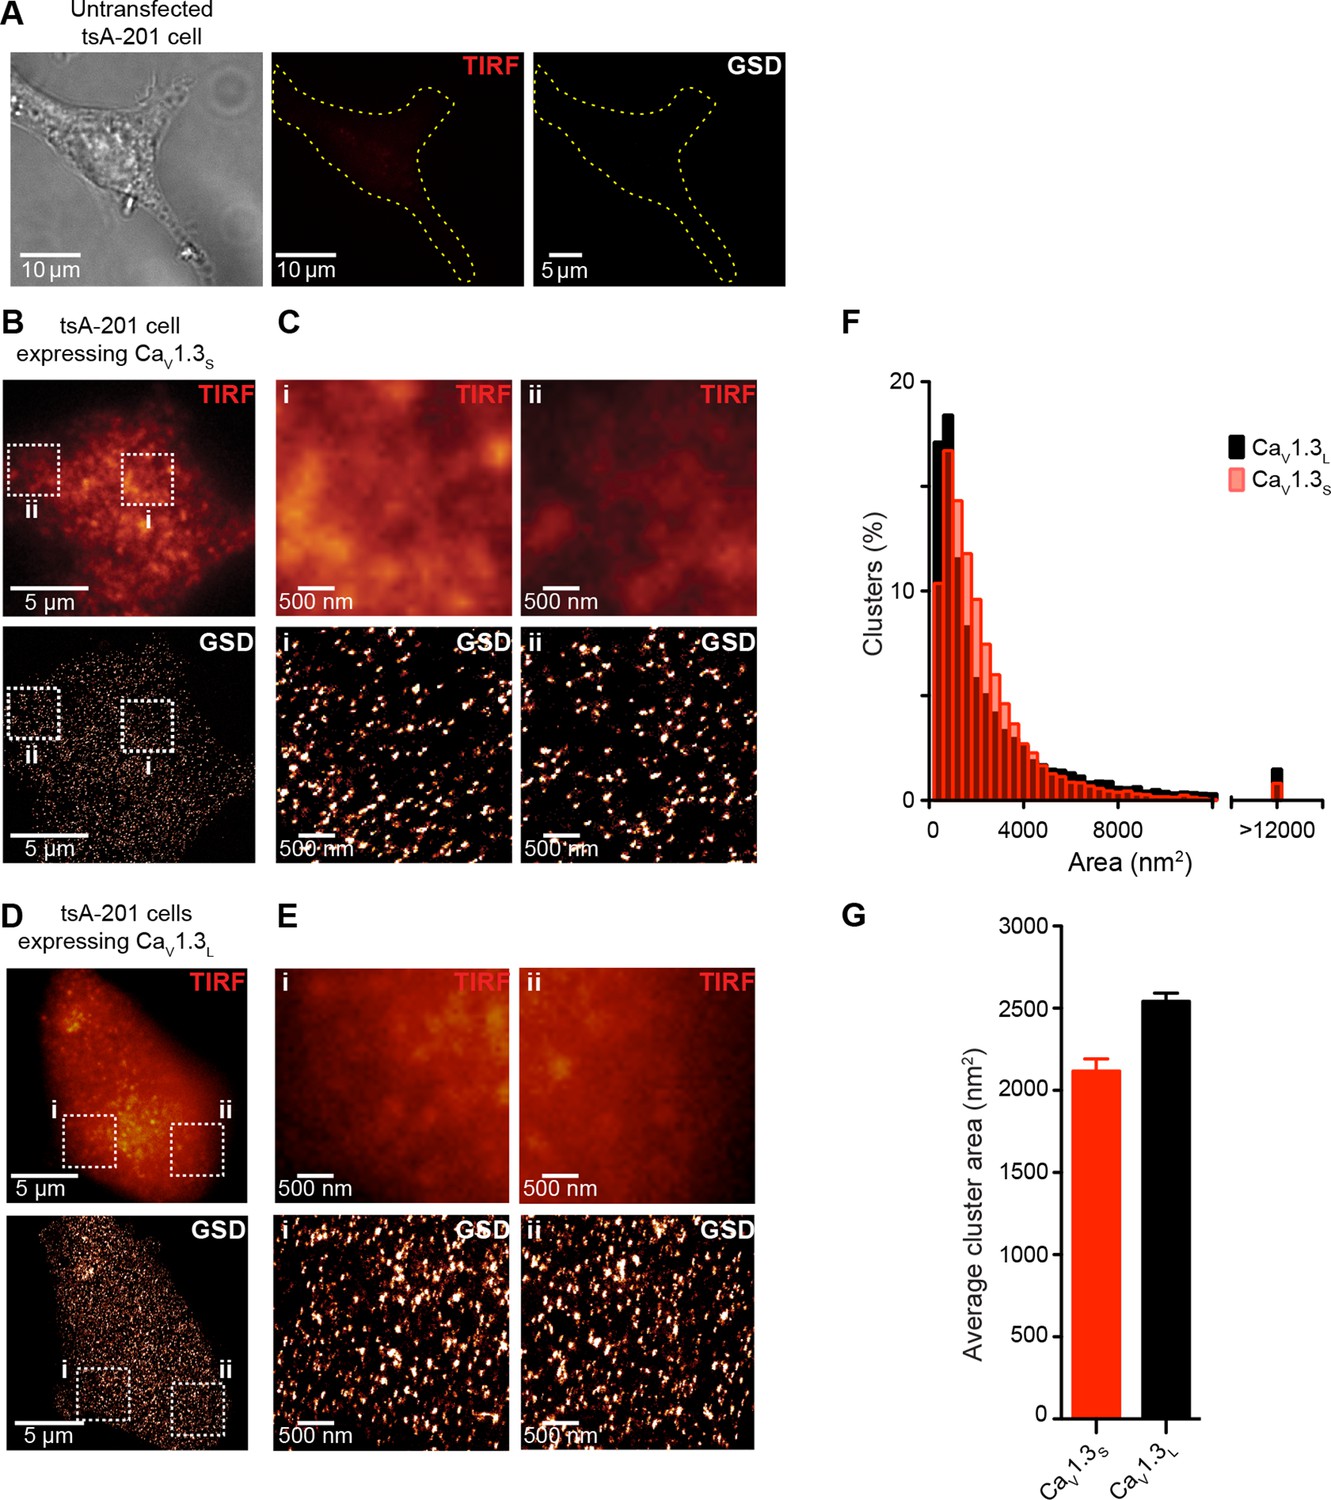
CaV1.3S and CaV1.3L channels form clusters in tsA-201 cells.
(A) Untransfected tsA-201 cells immunostained against CaV1.3 channels. Bright field (left), TIRF (center) and super-resolution (GSD, right) images, outline depicts the periphery of the cell. (B) TIRF (top) and GSD (bottom) of the immunostaining of a representative tsA-201 cell expressing CaV1.3S channels. (C) Zoom in of the CaV1.3S clusters in zones i and ii outlined in (B). (D) TIRF (top) and GSD images (bottom) of the immunostaining of a representative tsA-201 cell expressing CaV1.3L (E) Zoom in of CaV1.3L clusters in zones i and ii in (D). (F) Frequency distributions of the area of CaV1.3S and CaV1.3L channel clusters (n = 19,143 clusters from 7 cells for CaV1.3S and 15,580 cluster from 5 cells for CaV1.3L). (G) Bar plot of the average cluster area for CaV1.3S and CaV1.3L channel clusters (n = 7 and 5 cells).
Figure 3—figure supplement 2
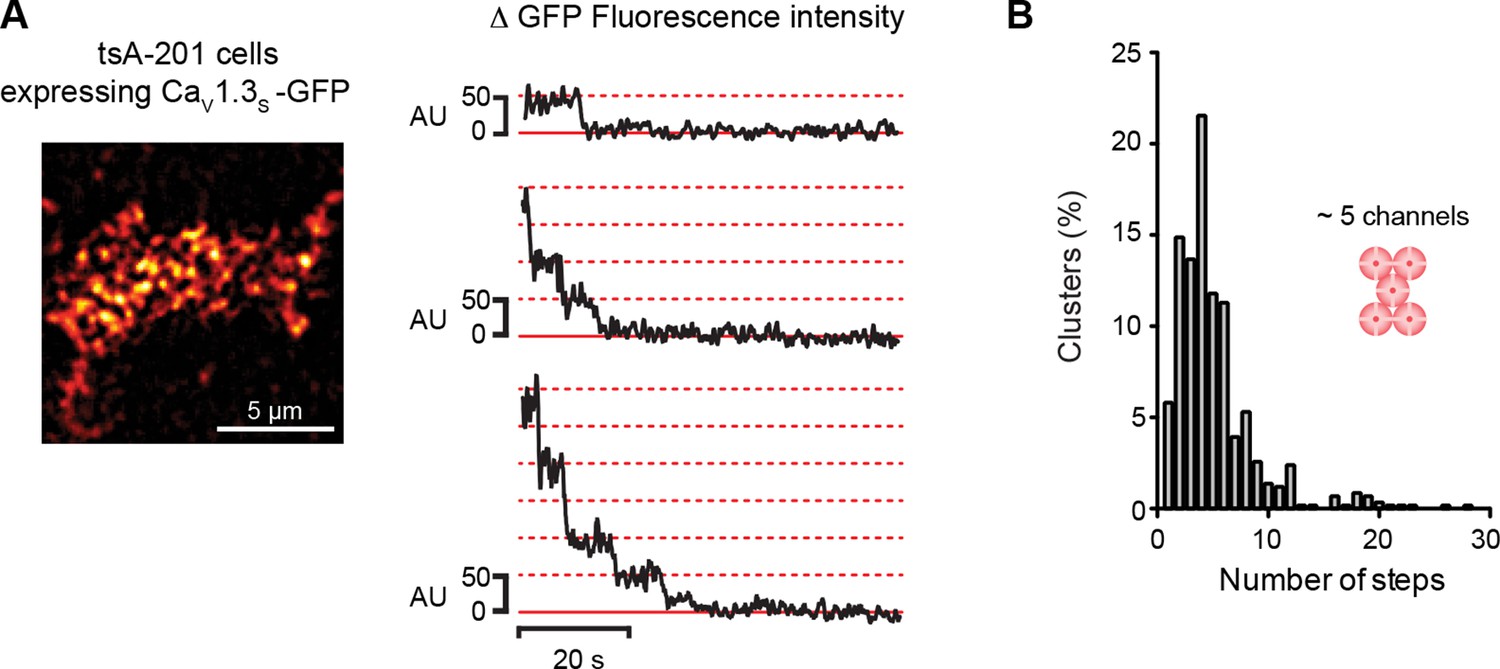
CaV1.3S organize in clusters of ~5 channels in tsA-201 cells.
(A) TIRF image of CaV1.3S-mGFP channels expressed in tsA-201 cells (left). Sequential photobleaching steps for three different clusters (right). (B) Frequency distribution of CaV1.3S cluster bleaching steps (n = 585 clusters from 11 cells).
Figure 4

Light-induced fusion increases ICa amplitude in CaV1.3S but not in CaV1.3L channels.
(A) Schematic of the blue light-induced dimerization system (CIBN-CRY2) fused to the C-terminal of CaV1.3S channels. The same proteins were fused to the C-terminal of CaV1.3L channels (not shown in schematic). (B) Representative current records from tsA-201 cells expressing CaV1.3S-CIBN/CaV1.3S-CRY2 (left) or CaV1.3L-CIBN/CaV1.3L-CRY2 (right), before (black traces) and after (red traces) induction of channel coupling by excitation with a 30 s pulse of 488 nm light. (C) Bar plot of the averaged fold-change in ICa following 488 nm excitation in cells expressing CaV1.3S-CIBN/CaV1.3S-CRY2 (black) or CaV1.3L-CIBN/CaV1.3L-CRY2. Bars are averages of 5 cells ± SEM (*p<0.05).
Figure 5 with 2 supplements
Coupling of CaV1.3S channels is Ca2+-dependent and increases channel activity.
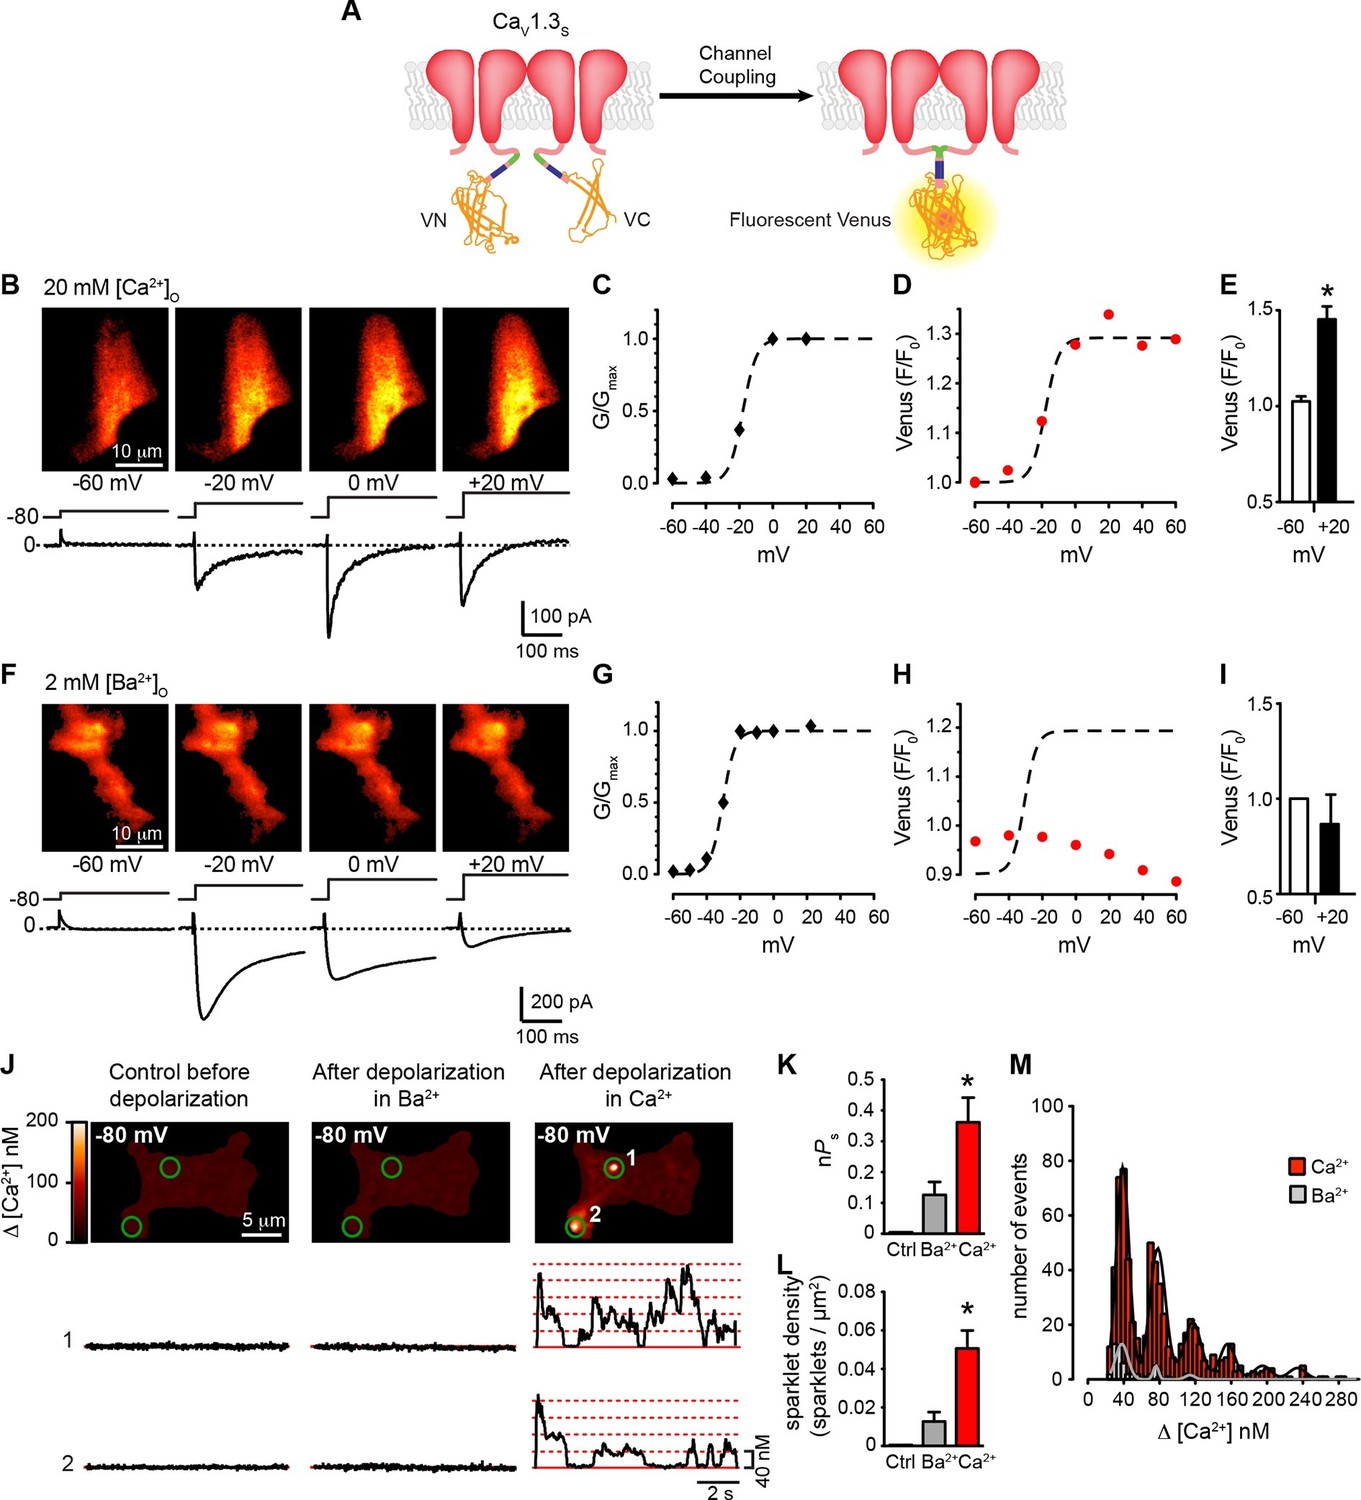
(A) Schematic of CaV1.3S fused to VN and VC fragments of the Split Venus bimolecular fluorescence complementation system. (B) TIRF images of Venus fluorescence reconstitution in the presence of 20 mM Ca2+ in tsA-201 cells expressing CaV1.3S-VN and CaV1.3S-VC (top). Fluorescence reconstitution was measured in response to 9-s depolarizing voltage steps from a holding potential of -80 mV to test potentials of -60 mV to +60 mV. ICa currents evoked at the different voltage steps (bottom). (C) Voltage-dependence of the normalized conductance (G/Gmax) of the ICashown in (B). Dashed curve is the fit to a Boltzmann function. (D) Voltage-dependence of Venus fluorescence reconstitution in the presence of 20 mM Ca2+. The Boltzmann function calculated in (C) is superimposed to compare voltage-dependence. (E) Bar plot of averaged Venus fluorescence in the presence of 20 mM Ca2+ at -60 mV and +20 mV. Bars are averages ± SEM (*p<0.05, n = 5 cells). (F) TIRF images of Venus fluorescence reconstitution in the presence of 2 mM Ba2+ in tsA-201 cells expressing CaV1.3S-VN and CaV1.3S-VC (top). Format and protocol are as in (B) IBa currents evoked at the different voltage steps (bottom). (G) Voltage dependence of normalized conductance (G/Gmax) of the IBashown in (F). Dashed curve is the fit to a Boltzmann function. (H) Voltage dependence of Venus fluorescence reconstitution in the presence of 2 mM Ba2+. The Boltzmann function calculated in (G) was superimposed to compare voltage-dependence. (I) Bar plot of averaged Venus fluorescence in the presence of 20 mM Ca2+ at -60 mV and +20 mV. Bars are averages of 5 cells ± SEM (*p<0.05). Venus reconstitution was also tested in the presence 2 mM Ca2+ (See Figure 5—figure supplement 1) (J) Top: TIRF images of CaV1.3S sparklets recorded at -80 mV in 20 mM Ca2+, before depolarization (left), after the same depolarization protocol used in (B, F) in the presence of 2 mM Ba2+ (center), and after depolarization in the presence of 20 mM Ca2+ (right). Green circles indicate sparklet sites. Bottom: Traces of the time course of [Ca2+]i in sites 1 and 2 under the three conditions. (K) Bar plot of the averaged CaV1.3S sparklet activity (nPs) before depolarization (black; average is ~0), after depolarization in Ba2+ (gray), and after depolarization in Ca2+ (red). Bars are averages ± SEM (*p<0.05, n = 5 cells). (L) Bar plot of sparklet density. Format as in (K). (M) Event amplitude histograms of CaV1.3S sparklets recorded after depolarization in the presence of Ba2+ (gray) or Ca2+ (red). The amplitude of elementary CaV1.3 sparklets was calculated by fitting histograms to a multicomponent Gaussian function. The experiments in this figure were performed using the CaV1.3S channel encoded by the Addgene plasmid 26576, similar results for split Venus reconstitution and sparklet activity were observed for the plasmid 49,333 (Figure 5—figure supplement 2).
Figure 5—figure supplement 1
Depolarization in the presence of physiological Ca2+ concentrations induces coupling in CaV1.3S.
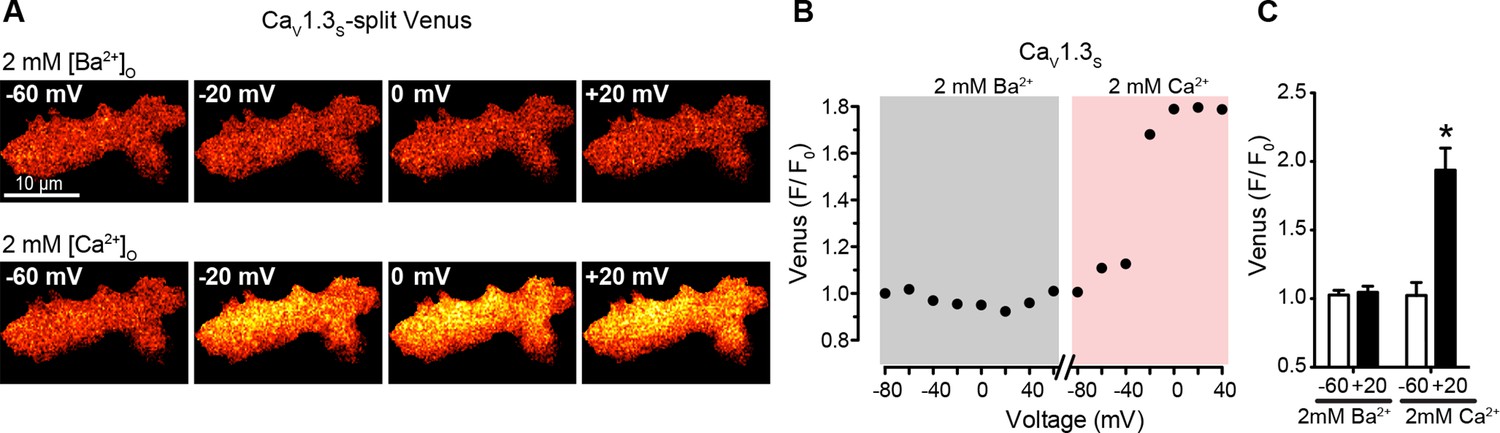
(A) TIRF images of Venus fluorescence reconstitution in the presence of 2 mM Ba2+ in tsA-201 cells expressing CaV1.3S-VN and CaV1.3S-VC (top). TIRF images of Venus fluorescence reconstitution in the presence of 2 mM Ca2+ in the same cell (bottom). Fluorescence reconstitution was measured as described in Figure 5. (B) Voltage-dependence of CaV1.3S-VN and CaV1.3S-VC Venus fluorescence reconstitution in the presence of 2 mM Ba2+ followed by 2 mM Ca2+. (C) Bar plot of averaged Venus fluorescence in the presence of 2 mM Ba2+ and 2 mM Ca2+ at -60 mV and +20 mV. Bars are averages ± SEM (*p<0.05, n = 6 cells). Bars are averages ± SEM (*p<0.05, n = 6 cells).
Figure 5—figure supplement 2
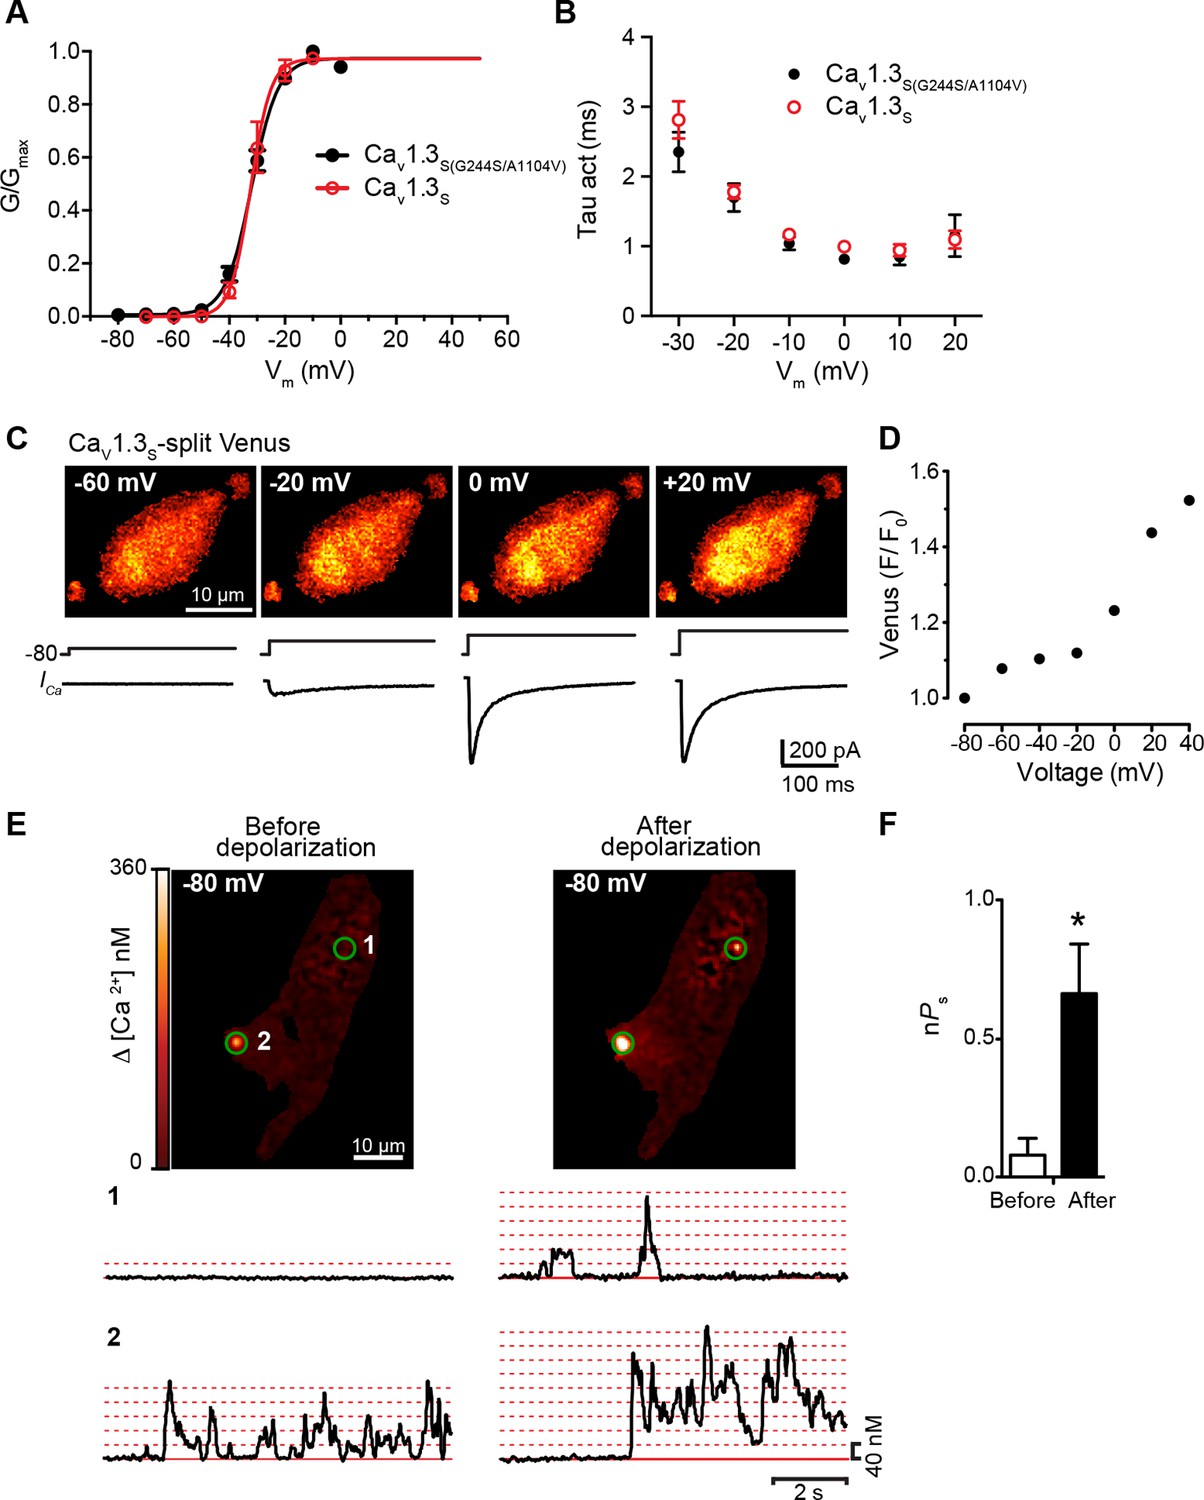
CaV1.3S and CaV1.3S(G244S) channels exhibit Ca2+-dependent coupling and increased sparklet activity after depolarization.
(A) Voltage-dependence of the normalized conductance (G/Gmax) of the ICa from tsA-201 cells expressing CaV1.3S (Addgene 49333) or CaV1.3S(G244S/A1104V) (Addgene 26576). (B) Plot of the time constants of activation against the depolarization voltage. Current traces were fitted by a single exponential and the corresponding time constants were averaged and plotted in the graph. Data from 6 cells per group. (C) TIRF images of Venus fluorescence reconstitution in the presence of 2 mM Ca2+ in tsA-201 cells expressing CaV1.3S (top). Fluorescence reconstitution was measured in response to 9-s depolarizing voltage steps from a holding potential of -80 mV to test potentials of -60 mV to +60 mV. ICa currents evoked at the different voltage steps (bottom). (D) Voltage-dependence of Venus fluorescence reconstitution in the presence of 2 mM Ca2+. (E) (top) TIRF images of CaV1.3S sparklets recorded at -80 mV in 20 mM Ca2+, before depolarization (left), after the same depolarization protocol used in (C) in the presence of 20 mM Ca2+ (right). Green circles indicate sparklet sites. (Bottom)Traces of the time course of [Ca2+]i in sites 1 and 2. (F) Bar plot of the averaged CaV1.3S sparklet activity (nPs) before and after. Bars are averages of 4 cells ± SEM (*p<0.05).
Figure 6
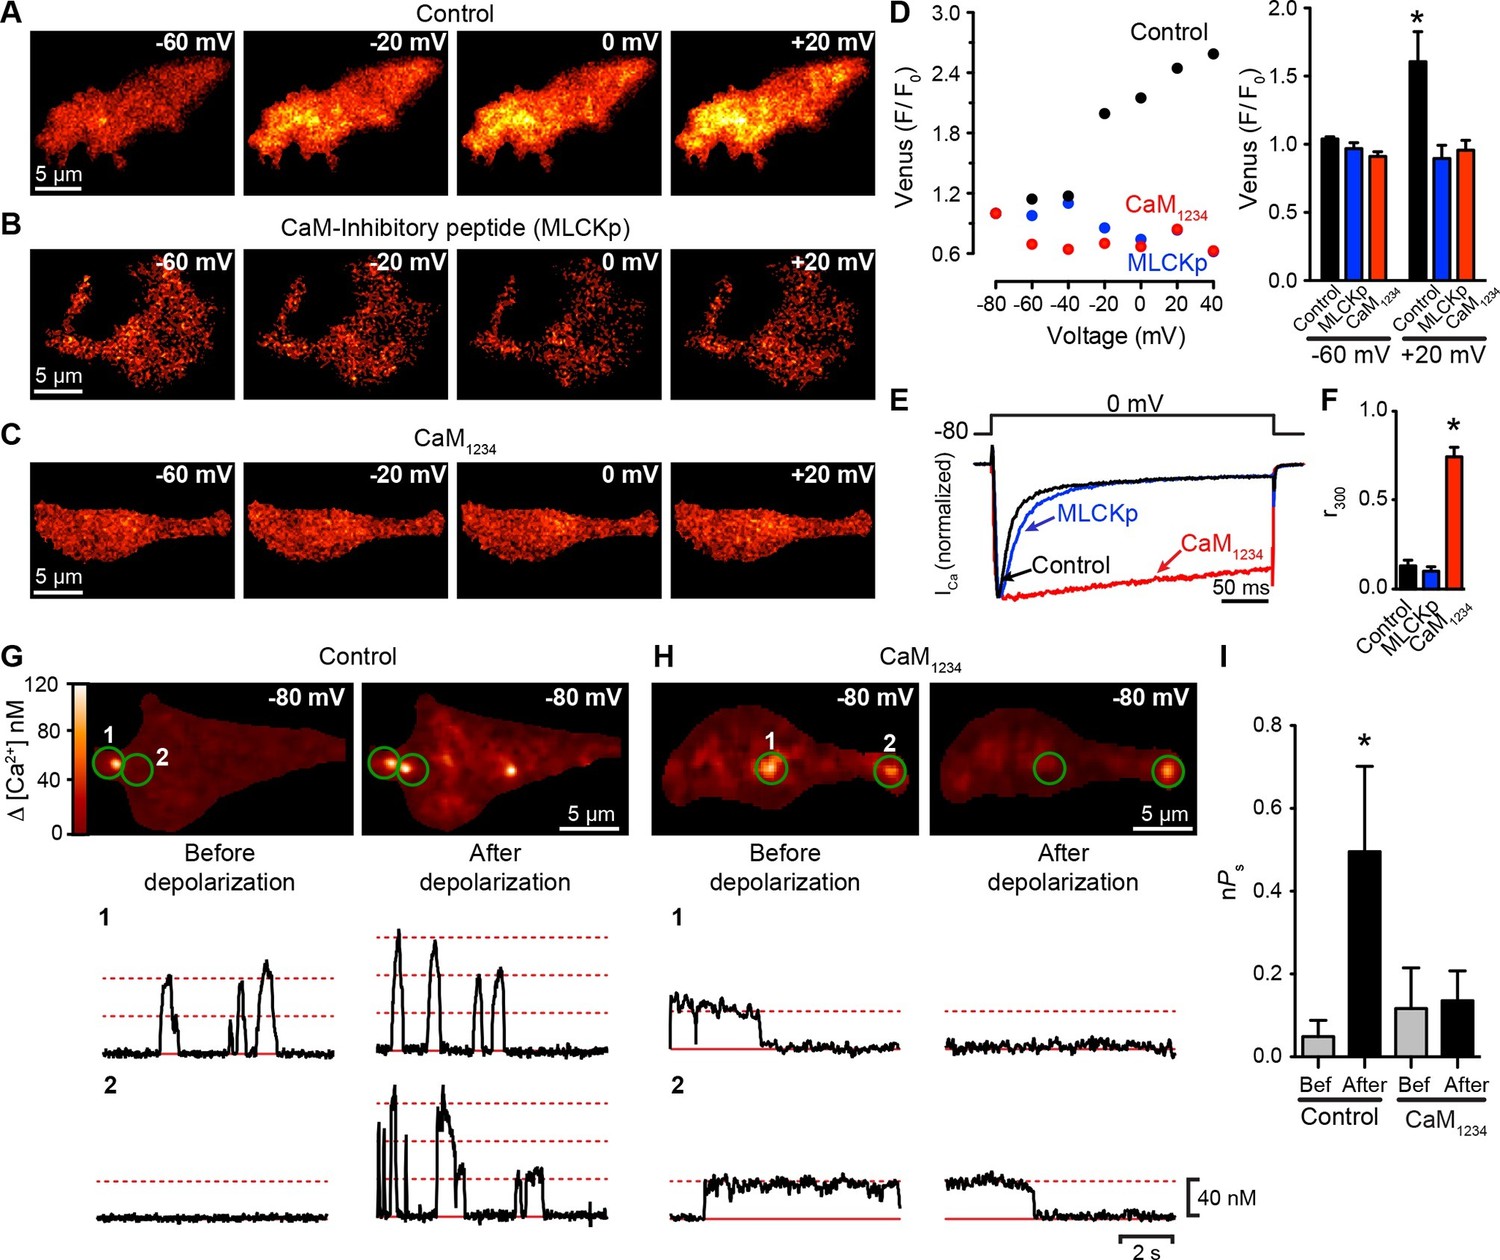
CaV1.3S coupling requires Ca2+-CaM.
(A–C) TIRF images of Venus fluorescence reconstitution in the presence of 20 mM Ca2+ in tsA-201 cells expressing (A) CaV1.3S-VN and CaV1.3S-VC, (B) CaV1.3S-VN and CaV1.3S-VC and dialyzed with the MLCK peptide (MLCKp), (C) CaV1.3S-VN, CaV1.3S-VC and CaM1234. Fluorescence reconstitution was measured in response to depolarizing voltage steps from a holding potential of -80 mV to test potentials of -60 mV to +60 mV. (D) Voltage-dependence of Venus fluorescence reconstitution in the presence of 20 mM Ca2+ for control (black), MLCKp (blue), and CaM1234 (red) cells shown in (A–C) (left). Bar plot of averaged Venus fluorescence in the presence of 20 mM Ca2+ at -60 mV and +20 mV (right). Bars are averages ± SEM (*p<0.05, n = 5 cells). (E) Normalized ICa currents evoked by a 300-ms depolarizing pulse from a holding potential of -80 mV to a test potential of 0 mV in control (black), MLCKp (blue), and CaM1234 (red) cells. Currents analyzed for these experiments were in a range between 0.3 and 1.2 nA (F) Bar plot of the mean fraction of r300 at 0 mV. Bars are averages ± SEM (*p<0.05, n = 5 cells). (G) Top: TIRF images of CaV1.3S sparklets in tsA-201 cells expressing CaV1.3S-VN and CaV1.3S-VC (Control). Sparklets were recorded at -80 mV in 20 mM Ca2+ before depolarization (left) and after the same depolarization protocol used in (A–C) (right). Green circles indicate sparklet sites. Bottom: Traces of the time course of [Ca2+]i in the corresponding sparklet sites 1 and 2. (H) TIRF images and time course of [Ca2+]i of CaV1.3S sparklets in tsA-201 cells expressing CaV1.3S-VN/CaV1.3S-VC and CaM1234. Format and protocol are as in (G). (I) Bar plot of the averaged CaV1.3S sparklet activity (nPs) before (gray) and after (black) depolarization. Bars are averages 5 cells ± SEM (*p<0.05).
Figure 7

The pre-IQ domain is required for Ca2+-CaM-mediated CaV1.3S coupling.
(A) Schematic of CaV1.3S mutations introduced to disrupt CaM binding to the IQ (I1608E) or the pre-IQ (AAE) domain; the position of the mutated amino acid is shown in the sequence below. (B) Normalized ICa currents evoked by a 30-ms depolarizing pulse from a holding potential of -80 mV to a test potential of 0 mV in tsA-201 cells expressing CaV1.3S (Control, black), CaV1.3S(I1608E) (blue), or CaV1.3S(AAE) (red). Currents analyzed for these experiments were in a range between 100 and 600 pA (C–E) TIRF images of Venus fluorescence reconstitution in the presence of 20 mM Ca2+ in tsA-201 cells expressing (C) CaV1.3S-VN and CaV1.3S-VC, (D) CaV1.3S(I1608E)-VN and CaV1.3S(I1608E)-VC, or (E) CaV1.3S(AAE)-VN and CaV1.3S(AAE)-VC. Fluorescence reconstitution was measured in response to depolarizing voltage steps from a holding potential of -80 mV to test potentials of -60 mV to +60 mV. (F) Voltage-dependence of Venus fluorescence reconstitution in the presence of 20 mM Ca2+ for control (black), I1608E mutant (blue), and AAE mutant (red) from the cells shown in (C–E). (G) Bar plot of averaged Venus fluorescence in the presence of 20 mM Ca2+ at -60 mV and +20 mV. Bars are averages of 5 cells ± SEM (*p<0.05).
Figure 8 with 1 supplement

Distal auto-regulatory domain (DCRD) is not responsible for the lack of coupling of CaV1.3L channels.
(A) Schematic of CaV1.3L channel splice variant (left), depicting the domains important for Ca2+-mediated regulation: pre-IQ (green), IQ (blue), proximal and distal C-terminal regulatory domains (PCRD, DCRD, gray. Schematic of the CaV1.3LΔC116 channel where the last 116 aa in the C-terminal were removed (right). (B) Representative currents of CaV1.3L (black) and CaV1.3L ΔC116 channels (red) expressed in tsA-201 cells. Currents were evoked by a 300-ms depolarization from holding potential of -80 mV to a test potential of 0 mV, with 2 mM Ca2+ as the charge carrier. Currents analyzed for these experiments were in a range between 0.3 and 1 nA (C) Bar plot of the% inactivation after 25 or 300 ms at 0 mV. Bars are averages of 5 cells ± SEM (*p < 0.001) (D–F) TIRF images of Venus fluorescence reconstitution in the presence of 2 mM Ca2+ in tsA-201 cells expressing CaV1.3S-VN and CaV1.3S-VC (D) CaV1.3L-VN and CaV1.3L-VC (E) or CaV1.3L ΔC116-VN and CaV1.3L ΔC116-VC (E). Fluorescence reconstitution was measured in response to depolarizing voltage steps from a holding potential of -80 mV to test potentials of -60 mV to +60 mV. (G) Bar plot of averaged Venus fluorescence at -60 mV and +20 mV for each of the aforementioned construct pairs. Bars are averages of 5 cells ± SEM (*p<0.05). Data for CaV1.3L ΔC116-VN and CaV1.3L ΔC116-VC Venus reconstitution with 20 mM Ca2+ is presented in Figure 8—figure supplement 1.
Figure 8—figure supplement 1
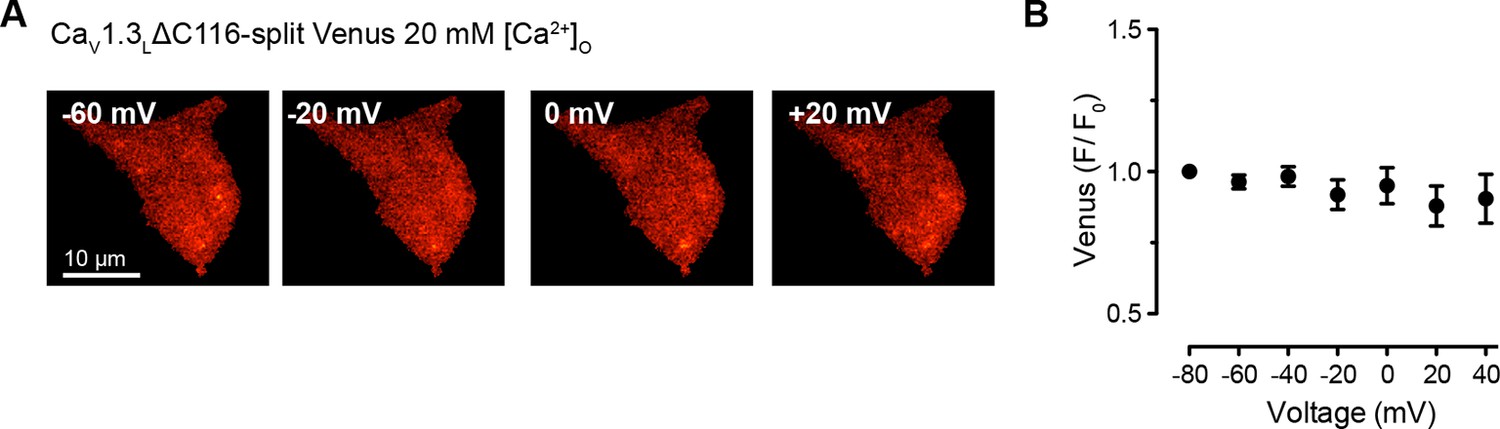
High Ca2+ concentration is not enough to induce coupling in CaV1.3LΔC116 channels.
(A) TIRF images of Venus fluorescence reconstitution in the presence of 20 mM Ca2+ in tsA-201 cells expressing CaV1.3L ΔC116-VN and CaV1.3L ΔC116-VC. Fluorescence reconstitution was measured in response to depolarizing voltage steps from a holding potential of -80 mV to test potentials of -60 mV to +60 mV. (B) Voltage-dependence of Venus fluorescence reconstitution in the presence of 20 mM Ca2+. Points are averages of 5 cells ± SEM.
Figure 9

Hippocampal neurons exhibit dihydropyridine-sensitive spontaneous persistent sparklet activity that is increased after depolarization.
(A) Top: TIRF images of Ca2+sparklets recorded at -80 mV in cultured hippocampal neurons (4 div) under control conditions (20 mM [Ca2+]o; left), and after exposure to low (1 µM; middle) and high (10 µM; right) concentrations of dihydropyridine (DHP). Green circles indicate sparklet sites. Bottom: Traces of the time course of [Ca2+]i at the site indicated by the white arrow for each condition are shown below the relevant image. Dotted red lines show the amplitudes of 1 to 7 quantal levels. (B) Bar chart showing the mean Ca2+ sparklet activity (nPs) in control conditions and after exposure to 300 nM, 1 µM or 10 µM concentrations of DHP. (C) Bar chart showing sparklet density for each condition described in (B) (*p<0.05, n = 6 cells). (D) Top: Ca2+ sparklets recorded at -80 mV in cultured hippocampal neurons (4 div), before depolarization (left) and after depolarization (right). Green circles indicate sparklet sites. Bottom: Traces of the time course of [Ca2+]i in sites 1 and 2 before and after depolarization. (E) Bar plot of the averaged Ca2+ sparklet activity (nPs) before (white) and after depolarization (black). Bars are averages of 4 cells ± SEM (*p<0.05).
Figure 10 with 1 supplement
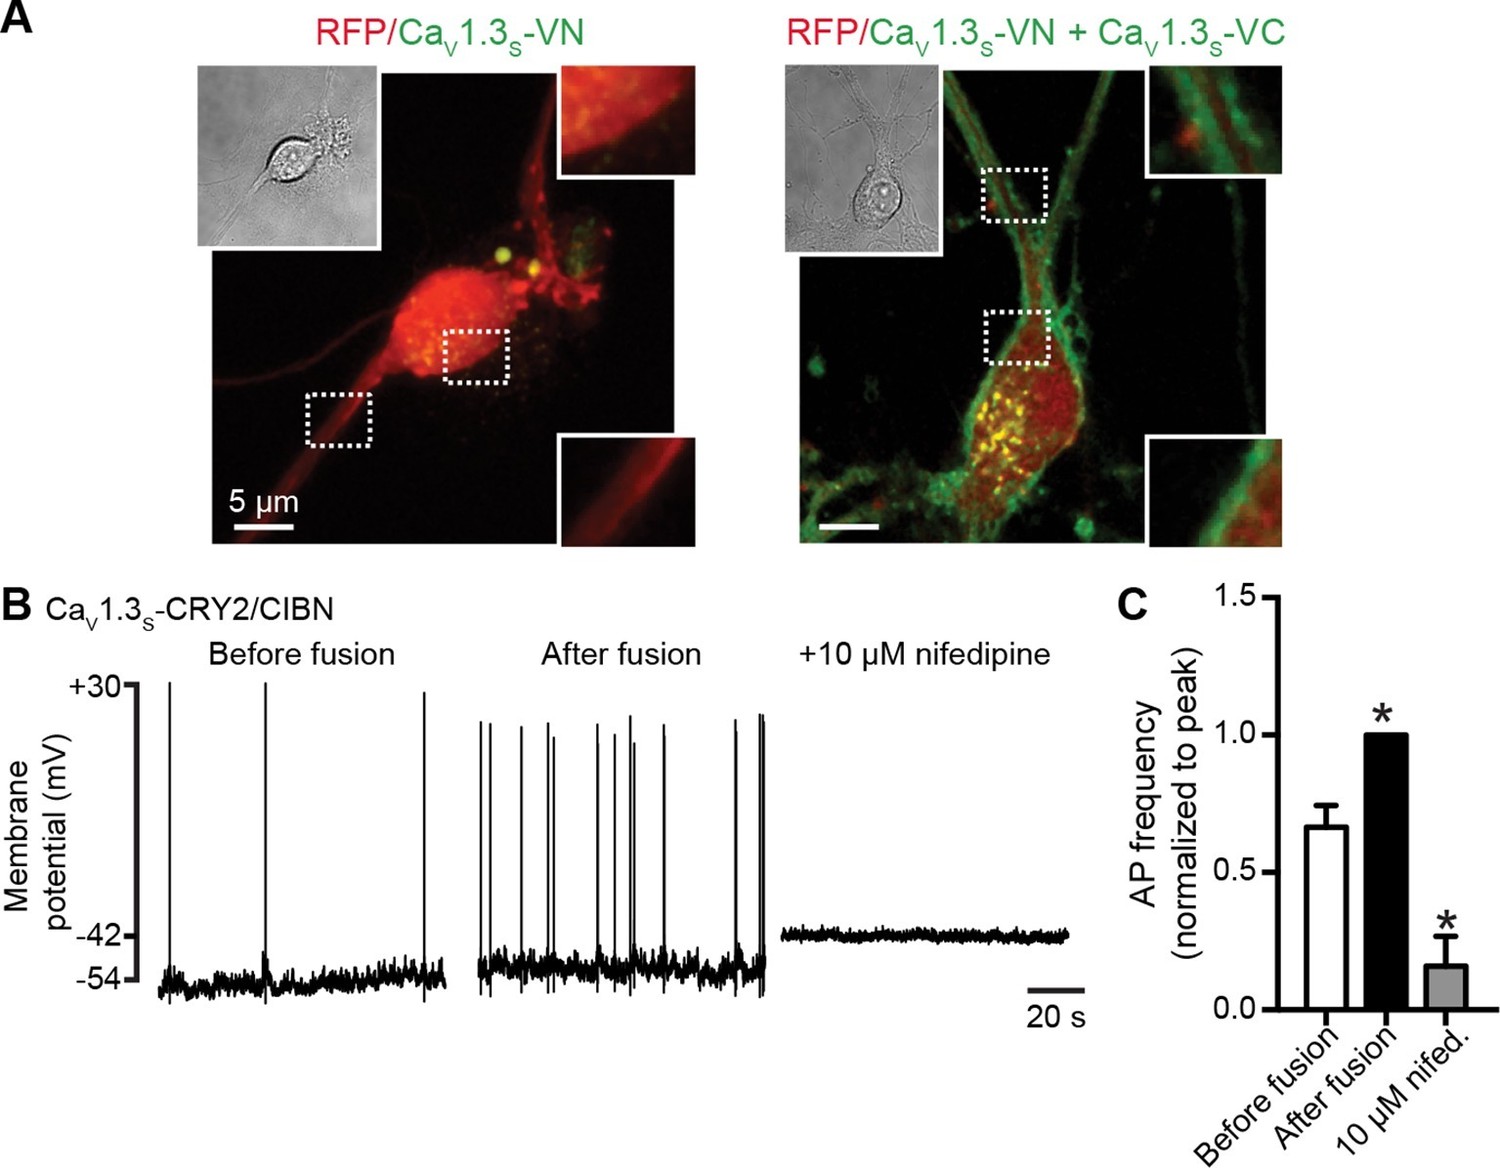
CaV1.3S coupling increases the firing rate of hippocampal neurons.
(A) Confocal images of two representative cultured hippocampal neurons expressing tRFP as a transfection marker (red) and CaV1.3S-VC (left, negative control) or CaV1.3S-VC/CaV1.3S-VN (right). Fluorescence of the spontaneously reconstituted Venus is shown in green. The insets show expanded views of the soma and dendritic regions marked by the dashed boxes. Overexpression of these channels does not change the cluster size observed with super-resolution microscopy (see also Figure 10—figure supplemental 1). (B) Representative traces of spontaneous action potentials recorded from neurons expressing CaV1.3S-CRY2 and CaV1.3S-CIBN before (left) and after (middle) the induction of fusion with 488 nm light and after subsequent treatment with 10 µM nifedipine (right). (C) Bar plot showing the AP frequency (normalized to the peak frequency) for each condition. Bars are averages of 4 cells ± SEM (*p<0.01).
Figure 10—figure supplement 1
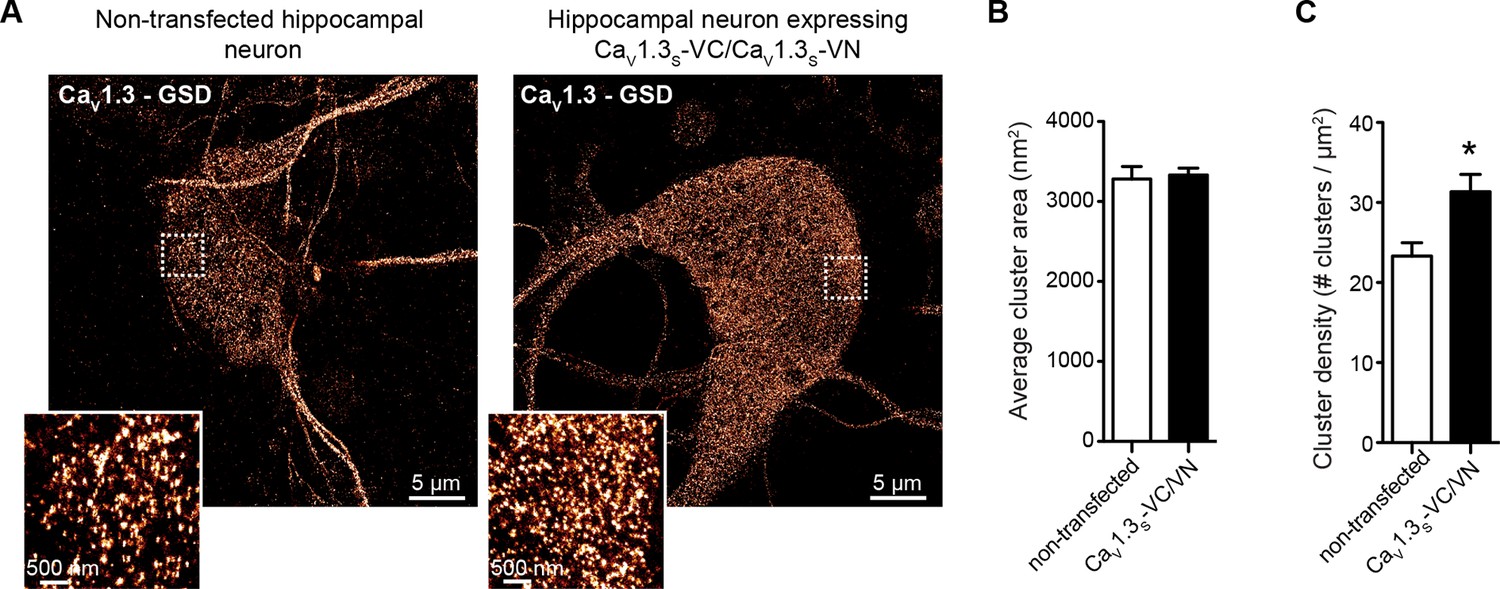
CaV1.3S overexpression in hippocampal neurons increased the number of CaV1.3S channels, but not the cluster size.
(A) Super-resolution (GSD) image of CaV1.3 channels in representative hippocampal neurons non-transfected (left) or expressing CaV1.3S-VN and CaV1.3S-VC (right), immunostained against CaV1.3. Insets at the left corner are magnifications of the outlined regions. (B) Average cluster area for CaV1.3 channels in non-transfected (white) and CaV1.3S-VN and CaV1.3S-VC transfected neurons. Bars are averages ± SEM (n = 5 cells). (C) CaV1.3 channels cluster density in non-transfected (white) and CaV1.3S-VN and CaV1.3S-VC transfected neurons. Bars are averages of 5 cells ± SEM (*p<0.05).
Figure 11

Proposed mechanism for Ca2+-induced functional CaV1.3S coupling in hippocampal neurons.
CaV1.3S channels are organized in clusters in the plasma membrane (SM) of hippocampal neurons. At hyperpolarized potentials (e.g., -80 mV), where [Ca2+]i and Po of CaV1.3S channels is very low, the number of coupled channels is very low. Membrane depolarization increases the probability of stochastic (i.e., uncoupled) openings of CaV1.3S channels. Ca2+ flow through these channels creates a local increase in [Ca2+]i (yellow gradient). This Ca2+ binds to apoCaM, which can be tethered to the pre-IQ domain or soluble in the cytoplasm. Once CaM is activated it promotes channel-channel interaction at the pre-IQ domain. Upon association, the activity of adjoined channels increases, entering into a cooperative gating mode that facilitates Ca2+ influx and underlies the ‘depolarizing drive’ that sustain repetitive firing.
Additional files
-
Source code 1. Custom software for Ca2+ sparklet detection and analysis written in MATLAB
- https://doi.org/10.7554/eLife.15744.021
-
Source code 2. Binary coupled Markov chain model
- https://doi.org/10.7554/eLife.15744.022
Download links
A two-part list of links to download the article, or parts of the article, in various formats.
Downloads (link to download the article as PDF)
Open citations (links to open the citations from this article in various online reference manager services)
Cite this article (links to download the citations from this article in formats compatible with various reference manager tools)
Ca2+ entry into neurons is facilitated by cooperative gating of clustered CaV1.3 channels
eLife 5:e15744.
https://doi.org/10.7554/eLife.15744


