Neural correlations enable invariant coding and perception of natural stimuli in weakly electric fish
- McGill University, Canada
Figures
Figure 1 with 1 supplement
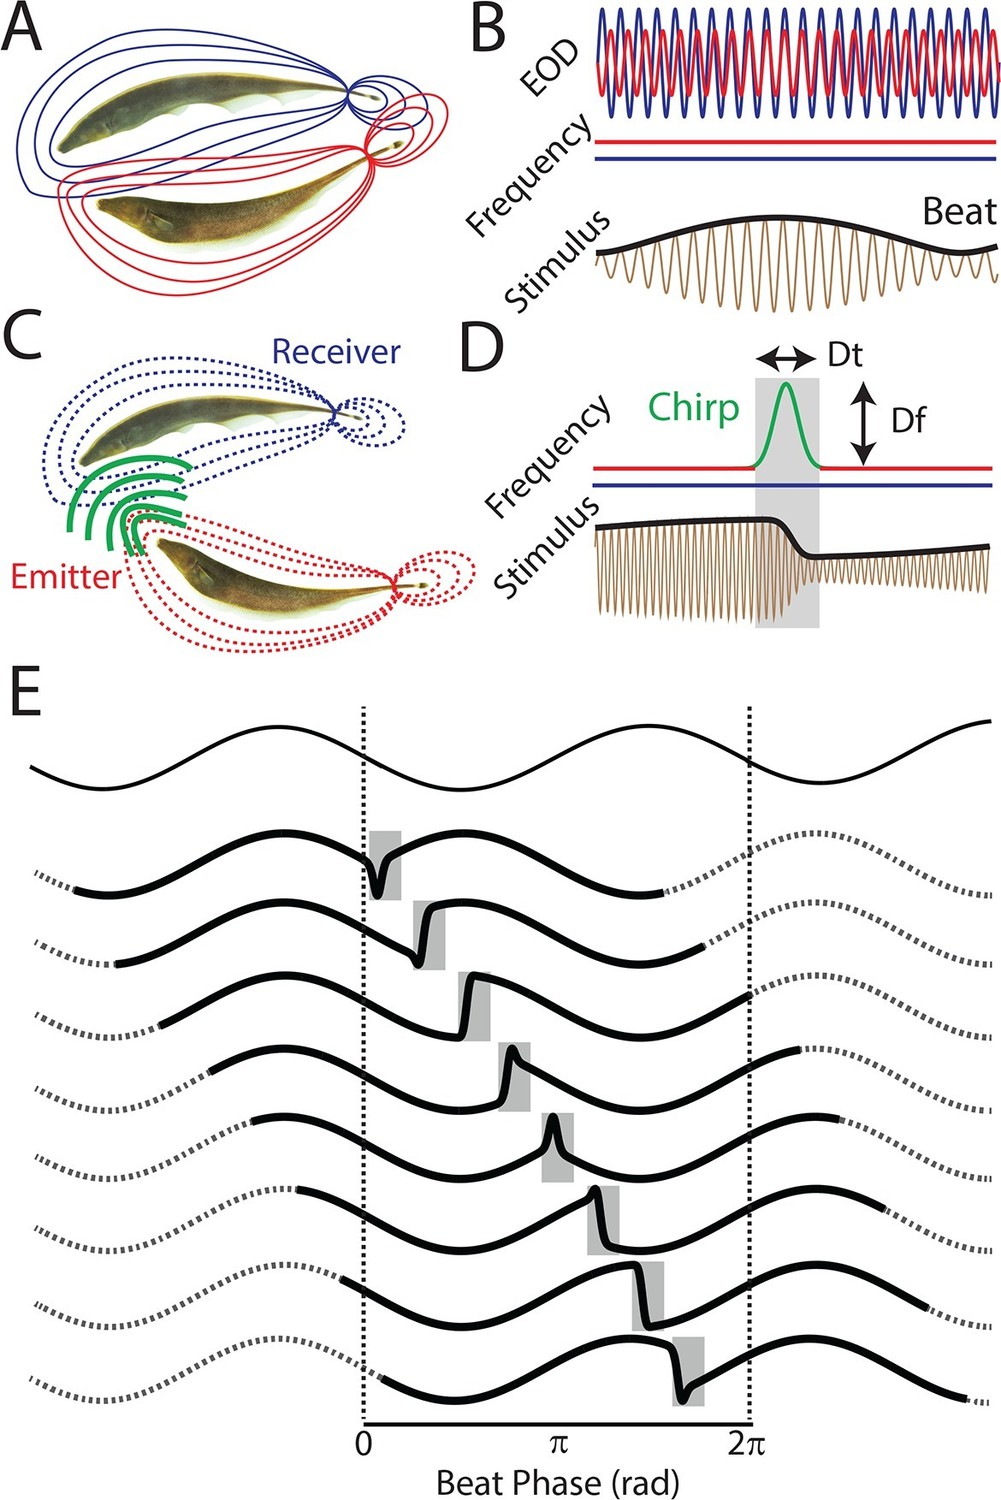
The same chirp stimulus gives rise to heterogeneous waveforms depending on time of occurrence within the beat cycle.
(A) Two weakly electric fish with their electric organ discharges (EODs) in red and blue. (B) The EOD waveforms of both fish (top red and blue traces) show alternating regions of constructive and destructive interference when the instantaneous EOD frequencies do not vary in time (middle red and blue traces). Interference between the EODs leads to a sinusoidal amplitude modulation (i.e. a beat, bottom black trace) of the summed signal (bottom brown trace). (C) Schematic showing communication between the emitter (red) and receiver (blue) fish. (D) During a communication call, the emitter fish’s EOD frequency (top red trace) transiently increased by maximum of Δf for a duration Δt (top green trace), while the receiver fish’s EOD frequency (top blue trace) remains constant. The communication call results in a phase reset of the beat (bottom black trace). (E) Ongoing unperturbed beat (top) and stimulus waveforms (bold black traces within gray bands) resulting when a chirp with the same frequency increase Δf and duration Δt occurs at different phases during the beat cycle. We note that these waveforms are very similar to those recorded from actual fish (Aumentado-Armstrong et al., 2015).
Figure 1—figure supplement 1
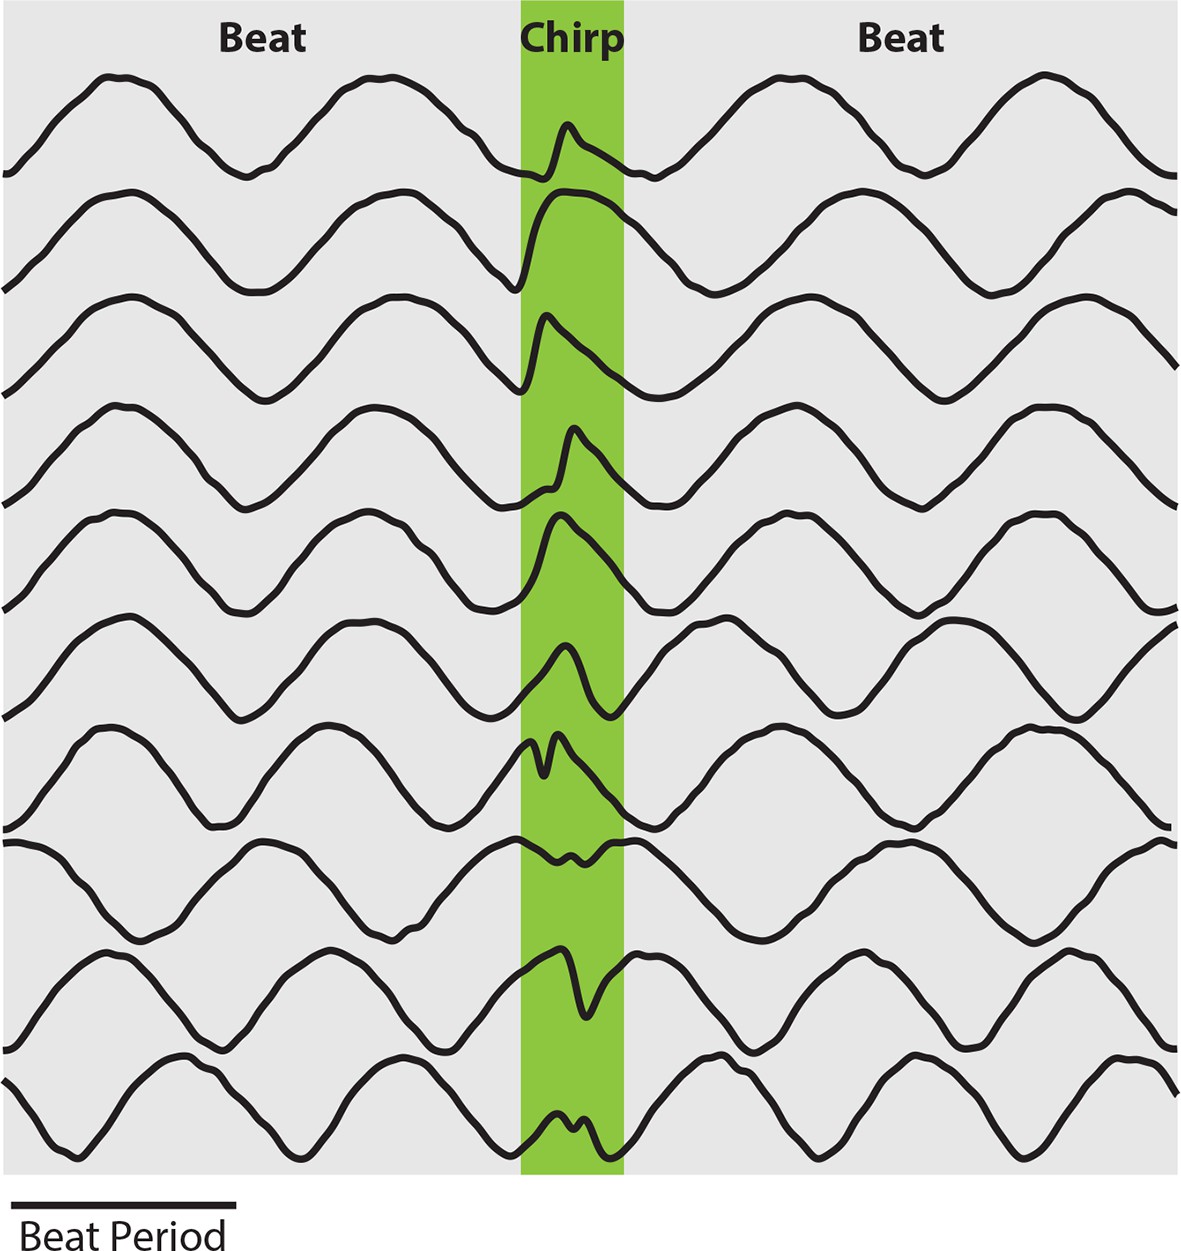
EOD amplitude modulations resulting from chirps display large heterogeneities.
Example waveforms recorded from behaving fish display large heterogeneities similar to the waveforms used in this study.
-
Figure 1—figure supplement 1—source data 1
Source data for Figure 1—figure supplement 1.
- https://doi.org/10.7554/eLife.12993.005
Figure 2 with 1 supplement
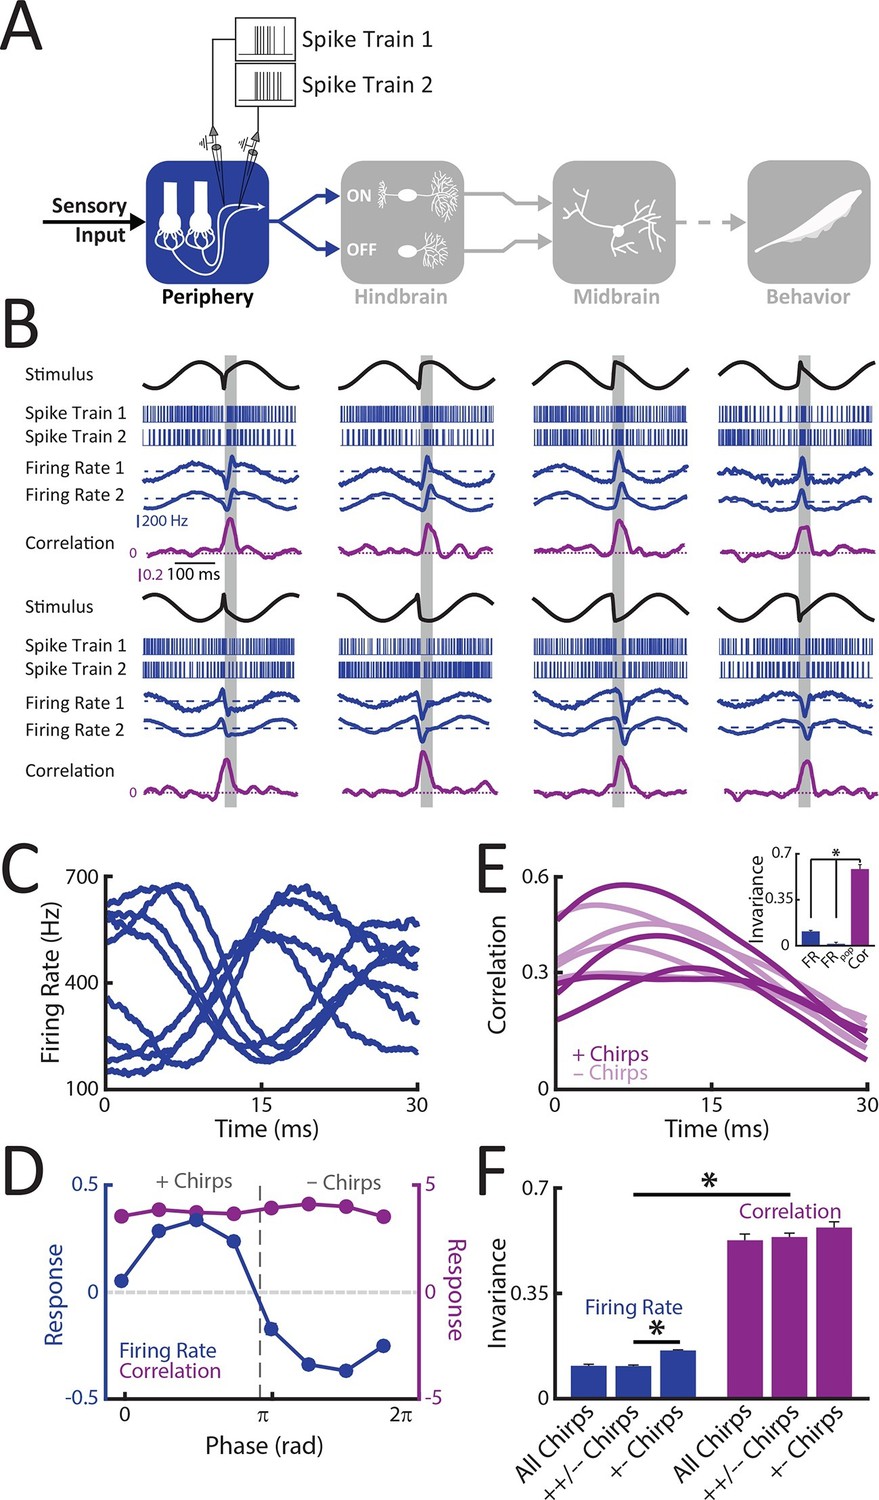
Correlated but not single peripheral afferent activity provides a representation that is invariant to the different patterns of stimulation resulting from the same chirp occurring at different phases within the beat cycle.
(A) Schematic showing the different stages of processing in the electrosensory system. Recordings were made from single (N = 18) as well as pairs (N = 8) of afferents. (B) Example spike trains (blue, top), firing rates averaged across trials (middle, blue), and correlation coefficient (purple) from an example afferent pair to different stimulus waveforms associated with the same electrosensory object. Note that each stimulus was presented at least 20 times. The horizontal bars (shaded gray) represent the chirp window (30 ms) used for evaluation. (C) Population-averaged firing rate responses to the different stimulus waveforms during the 30 ms chirp window shown in B. (D) Population-averaged tuning curves obtained from single neuron firing rates (blue) and from the correlation coefficient (purple). '+ chirps' and '- chirps' were defined as the stimulus waveforms that gave rise to positive (i.e. increases in firing rate) and negative (i.e. decreases in firing rate) responses in afferents, respectively. (E) Correlation coefficient as a function of time in response to all stimulus waveforms. Inset: Invariance score computed from single afferents (left), from the population-averaged activity (center), and from the correlation coefficient (right). (F) Invariance score computed from single afferent activity (blue) and from correlated activity (purple) computed for all stimulus waveforms, '++/- - chirps', and '+- chirps'. '*' indicates statistical significance at the p = 0.05 level using a one-way ANOVA with Bonferroni correction.
-
Figure 2—source data 1
Source data for Figure 2.
- https://doi.org/10.7554/eLife.12993.007
Figure 2—figure supplement 1

Phase invariant coding by single and correlated activity.
(A) Plot of the distance between responses as a function of the distance between the corresponding stimulus waveforms for an example single afferent (blue) and for the correlated activity of an example afferent pair (purple). (B) Time varying correlation coefficients in response to eight different stimulus waveforms for different time windows (see legend). (C) Invariance as a function of time window length. Robust invariance was seen for time windows up to ˜60 ms.
-
Figure 2—figure supplement 1—source data 1
Source data for Figure 2—figure supplement 1.
- https://doi.org/10.7554/eLife.12993.009
Figure 3 with 1 supplement
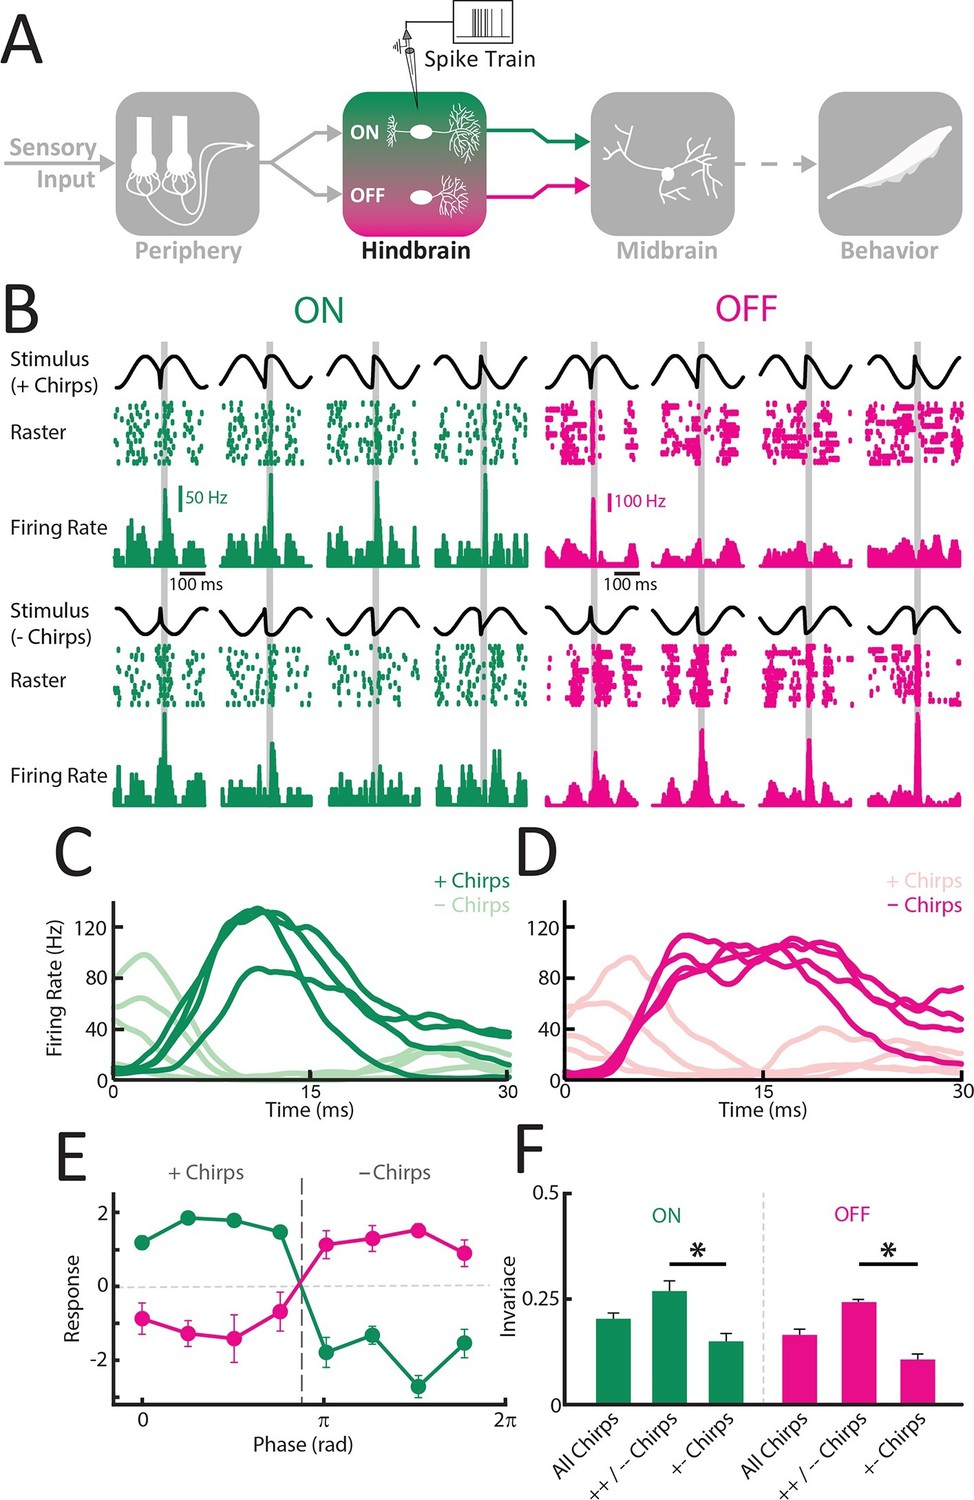
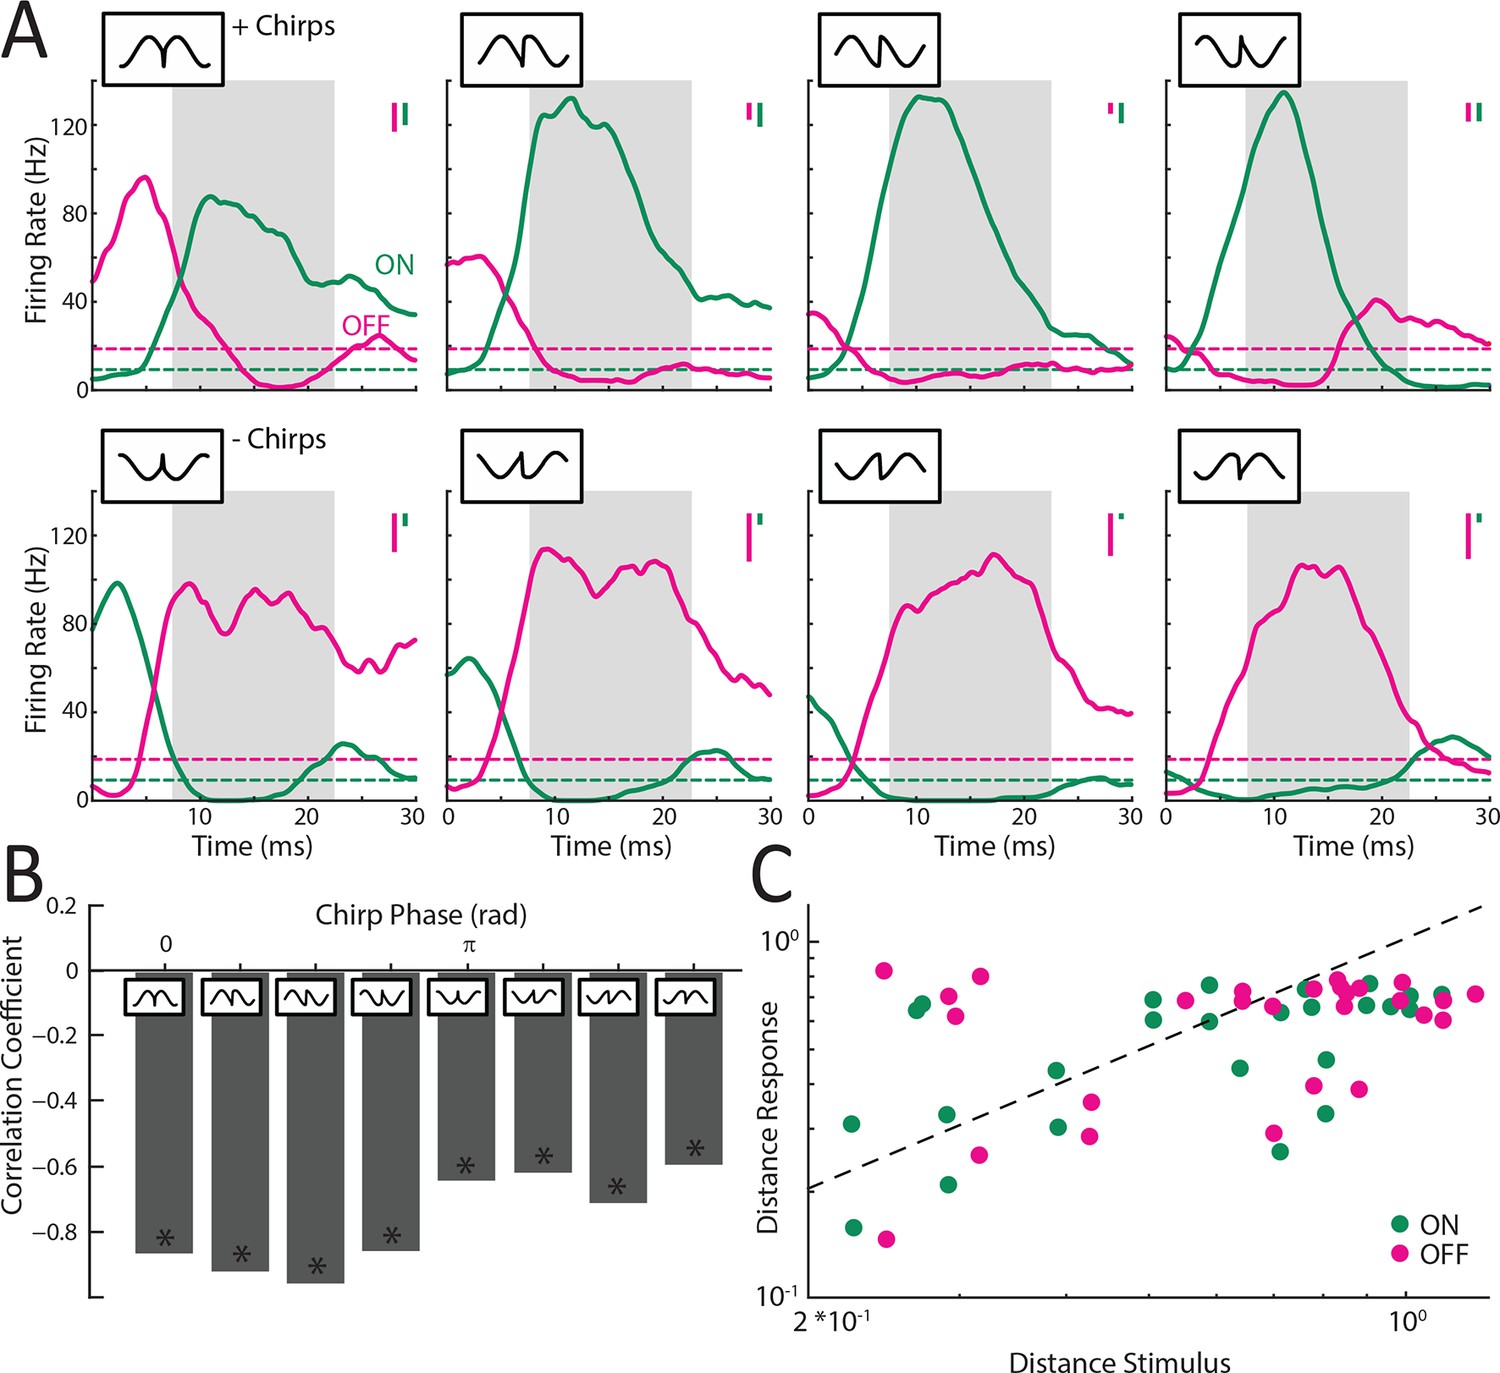
ON and OFF-type hindbrain ELL pyramidal neurons display more phase invariance by decoding correlated activity from peripheral afferents.
(A) Schematic showing the different stages of processing in the electrosensory system. Recordings were made from ELL ON- (N = 22) and OFF-type (N = 9) pyramidal neurons. (B) Example responses of an ON-type (green) and an OFF-type neuron (magenta) to stimulus waveforms associated with the same electrosensory object. Shown are the stimulus waveforms, raster plots showing responses to 20 presentations of each stimulus, and trial-averaged time varying firing rates. Stimulus waveforms corresponding to '+ chirps' are shown above while those corresponding to '- chirps' are shown below. Note that excitatory responses of the ON-type neuron were mainly observed during + chirps while excitatory responses of the OFF-type neuron were found for - chirps. (C,D) Averaged time dependent firing rates for ON (C) and OFF (D) –type neurons in response to '+ chirps' (dark green) and '- chirps' (light green). (E) Tuning curves averaged from individual responses for ON- (green) and OFF (magenta) -type neurons. (F) Phase invariance scores computed from individual ON and OFF-type pyramidal neurons for all stimulus waveforms, same-type chirp combinations only ('++/- -'), and opposite-type chirp combinations only '+- chirps'. '*' indicates statistical significance at the p = 0.05 level using a one-way ANOVA.
-
Figure 3—source data 1
Source data for Figure 3.
- https://doi.org/10.7554/eLife.12993.011
Figure 3—figure supplement 1
Responses of ELL pyramidal ON and OFF type populations to chirp stimuli.
(A) Averaged responses of ON (green; N = 22) and OFF- (magenta; N = 9) type pyramidal neurons to '+ chirps' (top row) and '- chirps' (lower row). Note that '+ chirps' elicited increased response of ON-type units, while '- chirps' instead elicited increased response in OFF-type units. (B) Correlation coefficients for linear correlations of the ON- and OFF-type population responses for the chirps occurring at different phases in the beat cycle. Note that for all chirp waveforms the population responses were significantly negatively correlated (r<-0.45; p<<10–3 in all cases). (C) Plots of the distance between responses as a function of the distance between the corresponding stimulus waveforms for example ON-type (green) and OFF-type (magenta) ELL pyramidal cell.
-
Figure 3—figure supplement 1—source data 1
Source data for Figure 3—figure supplement 1.
- https://doi.org/10.7554/eLife.12993.013
Figure 4 with 1 supplement
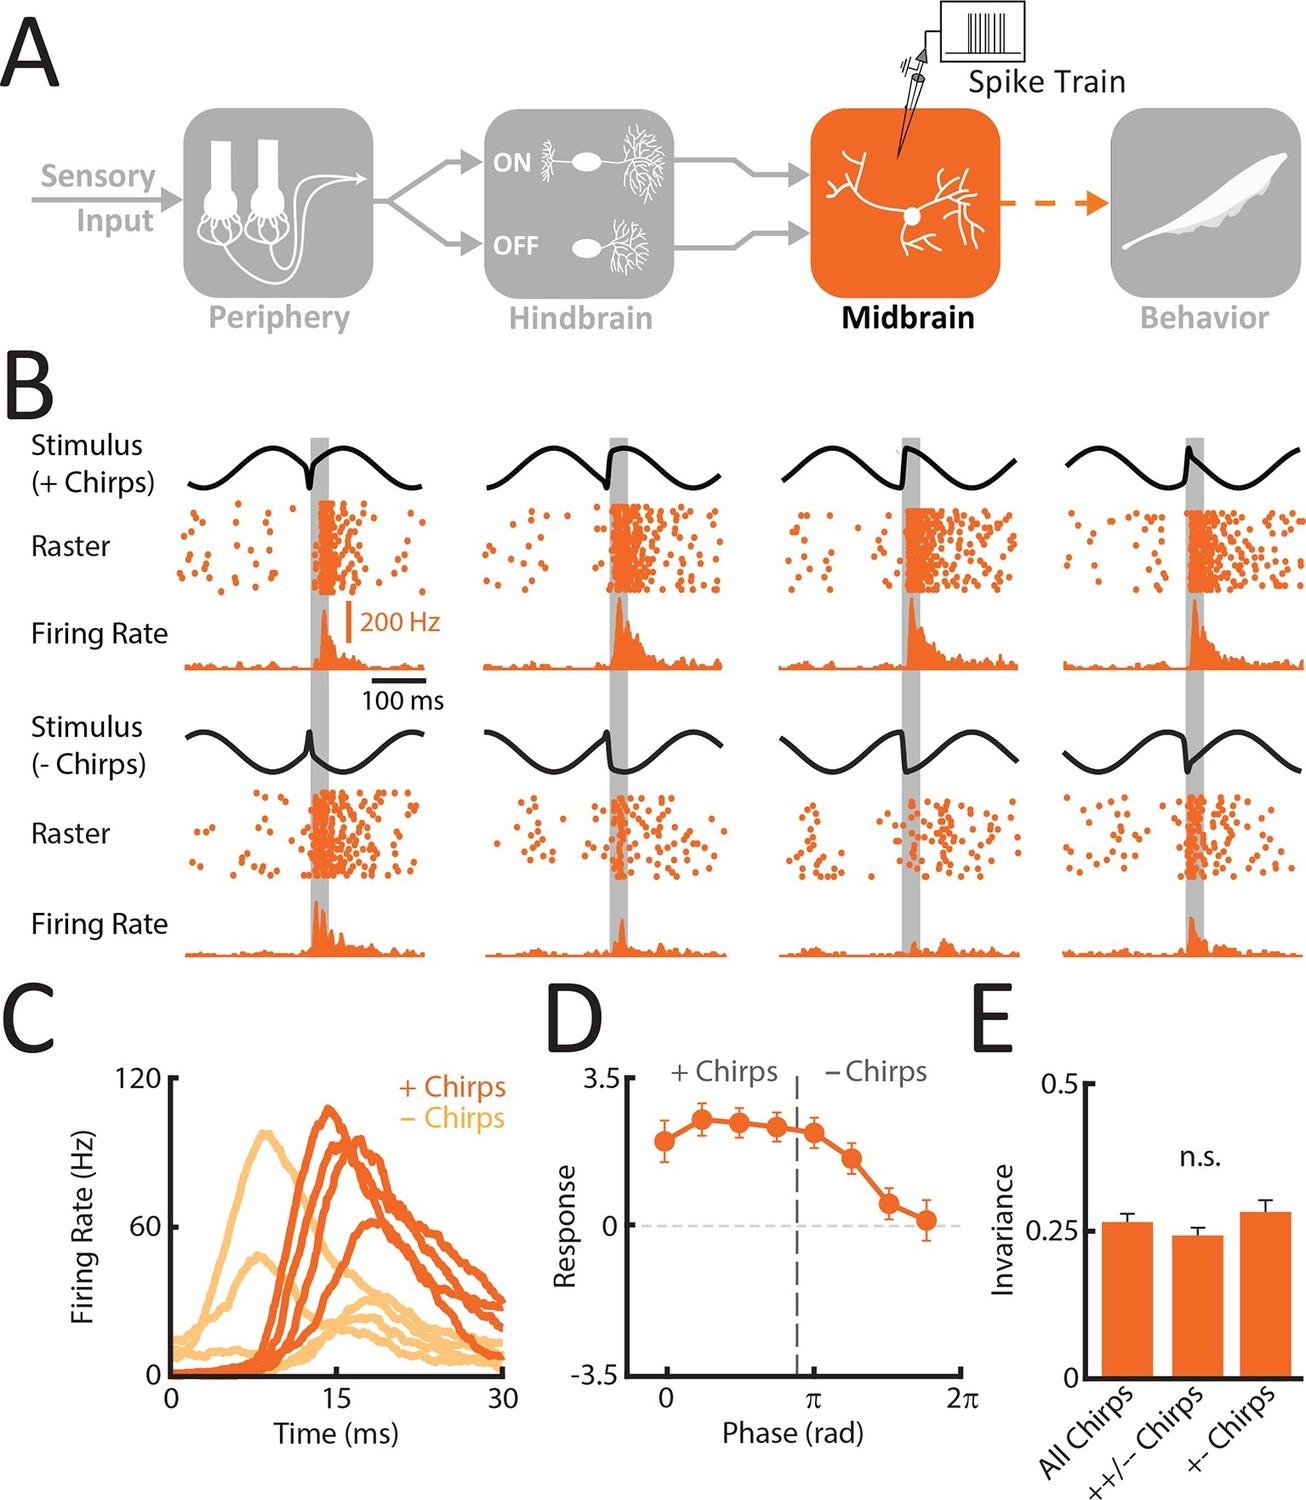
Midbrain TS neurons display invariant responses to the different patterns of stimulation resulting from the same chirp occurring at different phases within the beat cycle.
(A) Schematic showing the different stages of processing in the electrosensory system. Recordings were made from TS neurons that receive balanced excitatory input from both ON and OFF-type ELL hindbrain neurons (N = 25). (B) Example responses of a TS neuron to stimulus waveforms associated with the same electrosensory object. Shown are the stimulus waveforms, raster plots showing responses to 20 presentations of each stimulus, and trial-averaged time varying firing rates. Stimulus waveforms corresponding to '+ chirps' are shown above while those corresponding to '- chirps' are shown below. (C) Averaged responses of TS neurons were similar when presented with stimulus waveforms associated with a given electrosensory object. (D) Tuning curve averaged from individual responses (mean ± SEM) for TS neurons. E. Invariance scores from single TS neurons for all stimulus waveforms, same-type chirp combinations only ('++/- -'), and opposite-type chirp combinations only '+-'.
-
Figure 4—source data 1
Source data for Figure 4.
- https://doi.org/10.7554/eLife.12993.015
Figure 4—figure supplement 1
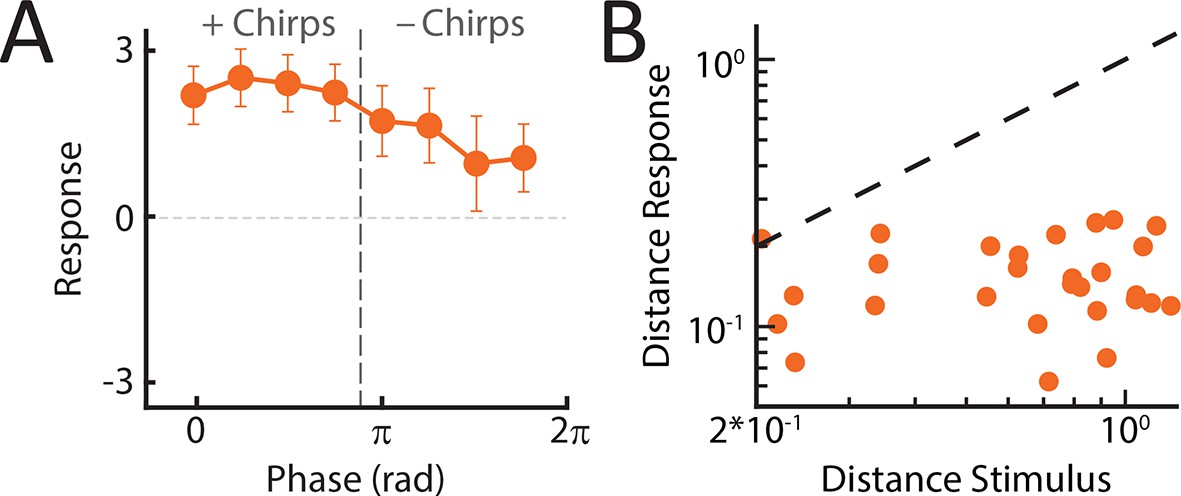
TS neurons respond more similarly and with excitation to all chirp waveforms.
(A) Population-averaged response tuning curve for TS neurons with invariance score greater than 0.25 (N = 13). (B) Plot of the distance between responses as a function of the distance between the corresponding stimulus waveforms for an example TS neuron.
-
Figure 4—figure supplement 1—source data 1
Source data for Figure 4—figure supplement 1.
- https://doi.org/10.7554/eLife.12993.017
Figure 5 with 1 supplement
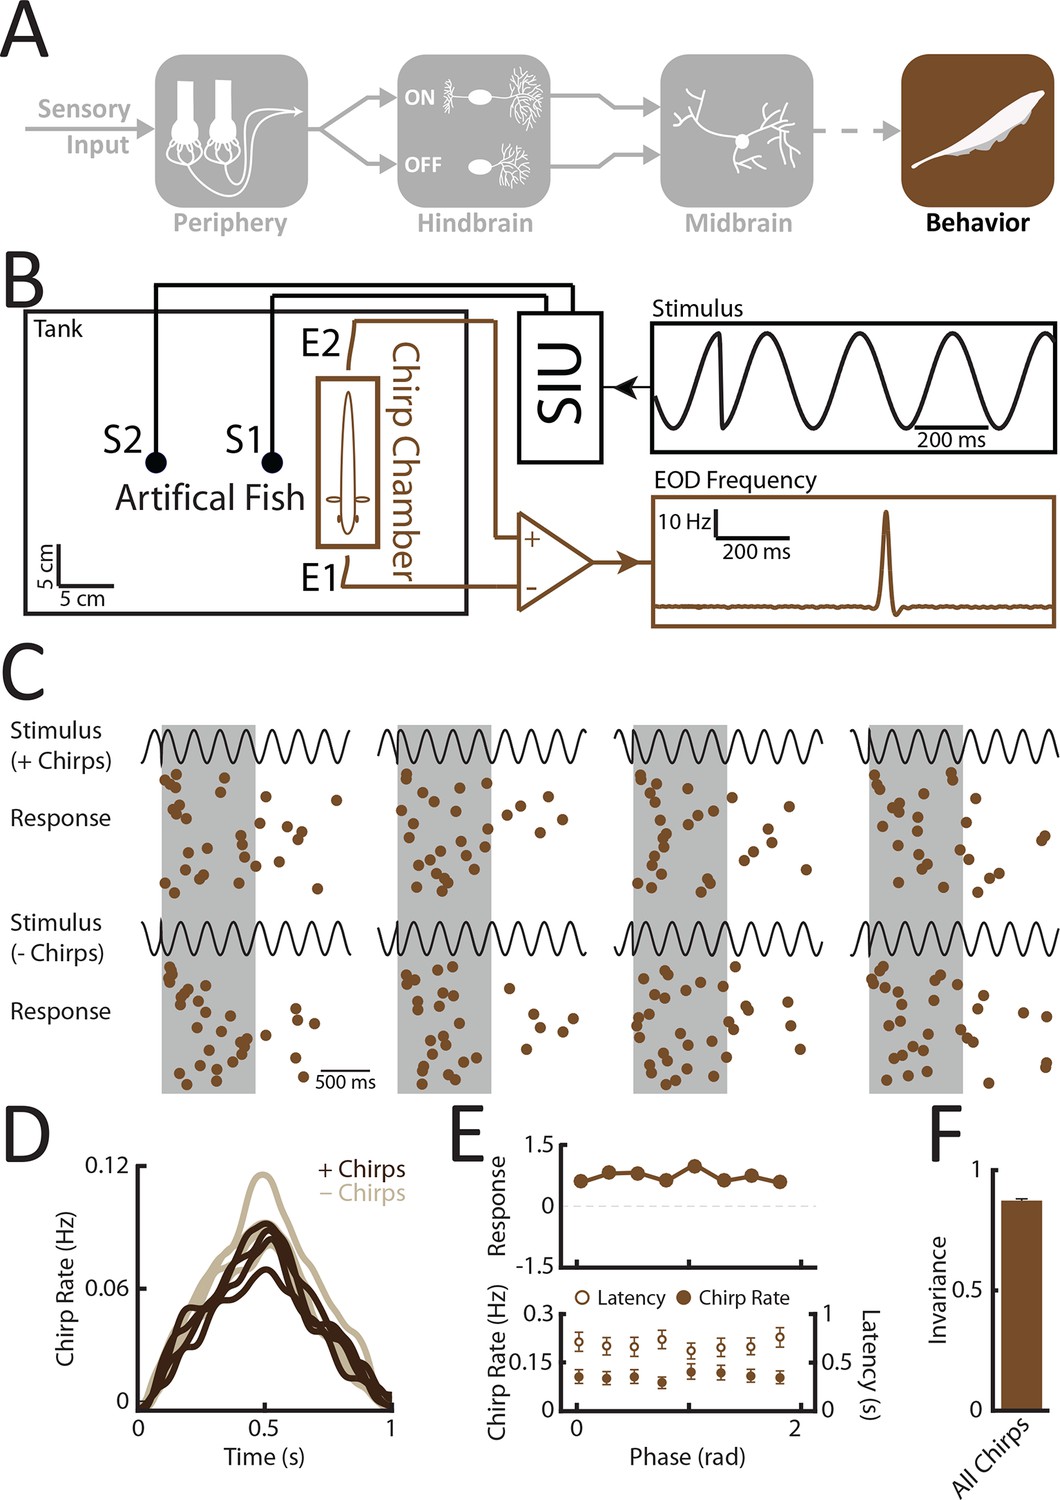
Behavioral responses indicate that perception is invariant to the different patterns of stimulation resulting from the same chirp occurring at different phases within the beat cycle.
(A) Schematic showing the different stages of processing in the electrosensory system. We recorded behavioral responses from N = 29 fish. (B) Experimental setup. The fish was placed in an enclosure within a tank (chirp chamber). Stimuli were applied via two electrodes (S1 & S2) perpendicular to the fish’s rostro-caudal axis. The fish’s EOD frequency was recorded by a pair of electrodes positioned at the head and tail of the animal (E1 & E2). Behavioral responses consisted of communication stimuli characterized by transient increases in EOD frequency in response to the presented stimulus. (C) Raster plots showing behavioral responses (brown) to repeated presentations of different stimulus waveforms (black) associated with the same electrosensory object. (D) Population-averaged time dependent behavioral response rates in response to '+ chirps' (dark brown) and '- chirps' (light brown). (E) Population-averaged tuning curve (top), as well time-averaged behavioral response rates (bottom, filled circles) and latency to first chirp (bottom, open circles) as a function of beat phase. (F) Population-averaged invariance score computed from behavioral responses. EOD, electric organ discharge.
-
Figure 5—source data 1
Source data for Figure 5.
- https://doi.org/10.7554/eLife.12993.019
Figure 5—figure supplement 1
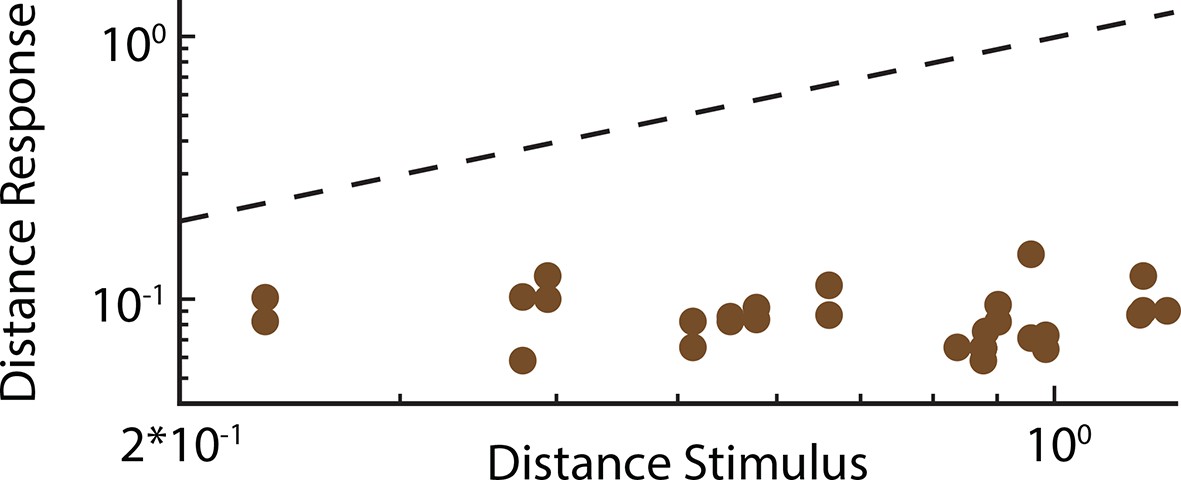
Behavioral responses are phase invariant.
Plot of the distance between responses as a function of the distance between the corresponding stimulus waveforms for behavioral echo chirp responses.
-
Figure 5—figure supplement 1—source data 1
Source data for Figure 5—figure supplement 1.
- https://doi.org/10.7554/eLife.12993.021
Figure 6
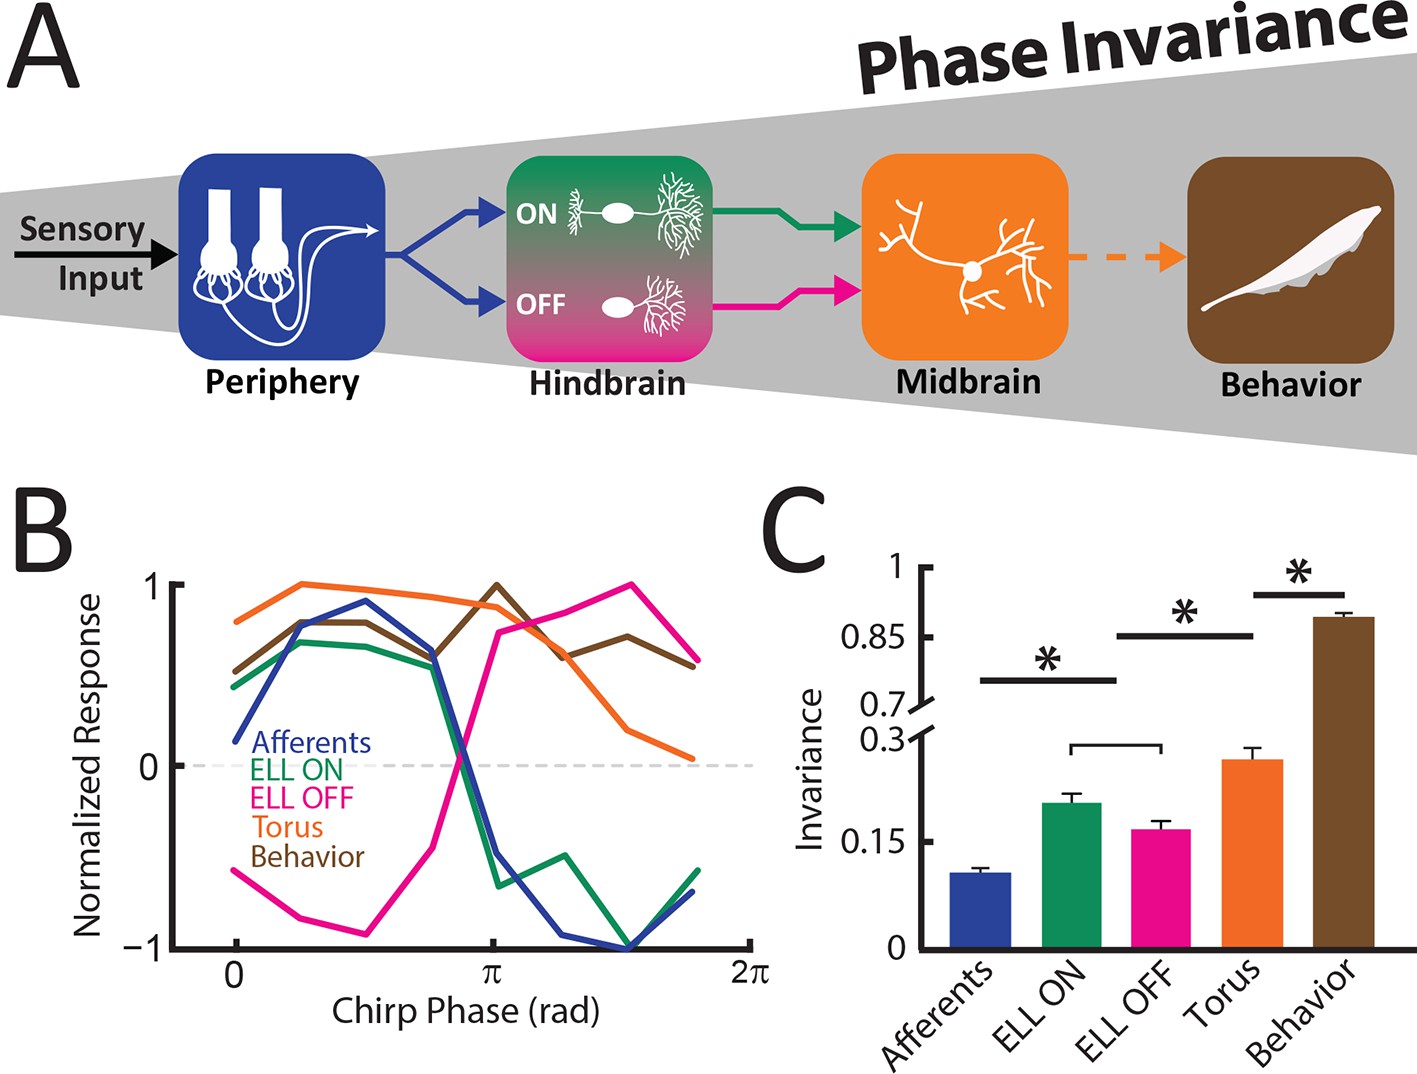
An invariant neural representation of natural communication stimuli emerges and is refined along ascending electrosensory brain areas, thereby giving rise to perception.
(A) Schematic showing how invariance increases across successive stages of electrosensory processing, thereby leading to behavior. (B) Normalized response tuning curves obtained for each stage of sensory processing as well as behavior. Note that tuning curves become progressively more independent of beat phase. (C) Invariance progressively increases across successive stages of electrosensory processing as well as behavior downstream brain areas and behavior. '*' indicates statistical significance at the p = 0.01 level using a one-way ANOVA with Bonferroni correction.
-
Figure 6—source data 1
Source data for Figure 6.
- https://doi.org/10.7554/eLife.12993.023
Download links
A two-part list of links to download the article, or parts of the article, in various formats.
Downloads (link to download the article as PDF)
Open citations (links to open the citations from this article in various online reference manager services)
Cite this article (links to download the citations from this article in formats compatible with various reference manager tools)
Neural correlations enable invariant coding and perception of natural stimuli in weakly electric fish
eLife 5:e12993.
https://doi.org/10.7554/eLife.12993


