Large-scale determination of previously unsolved protein structures using evolutionary information
- University of Washington, United States
- Howard Hughes Medical Institute, University of Texas Southwestern Medical Center, United States
- University of Texas Southwestern Medical Center, United States
- Facebook Inc., United States
- Howard Hughes Medical Institute, University of Washington, United States
Figures
Figure 1
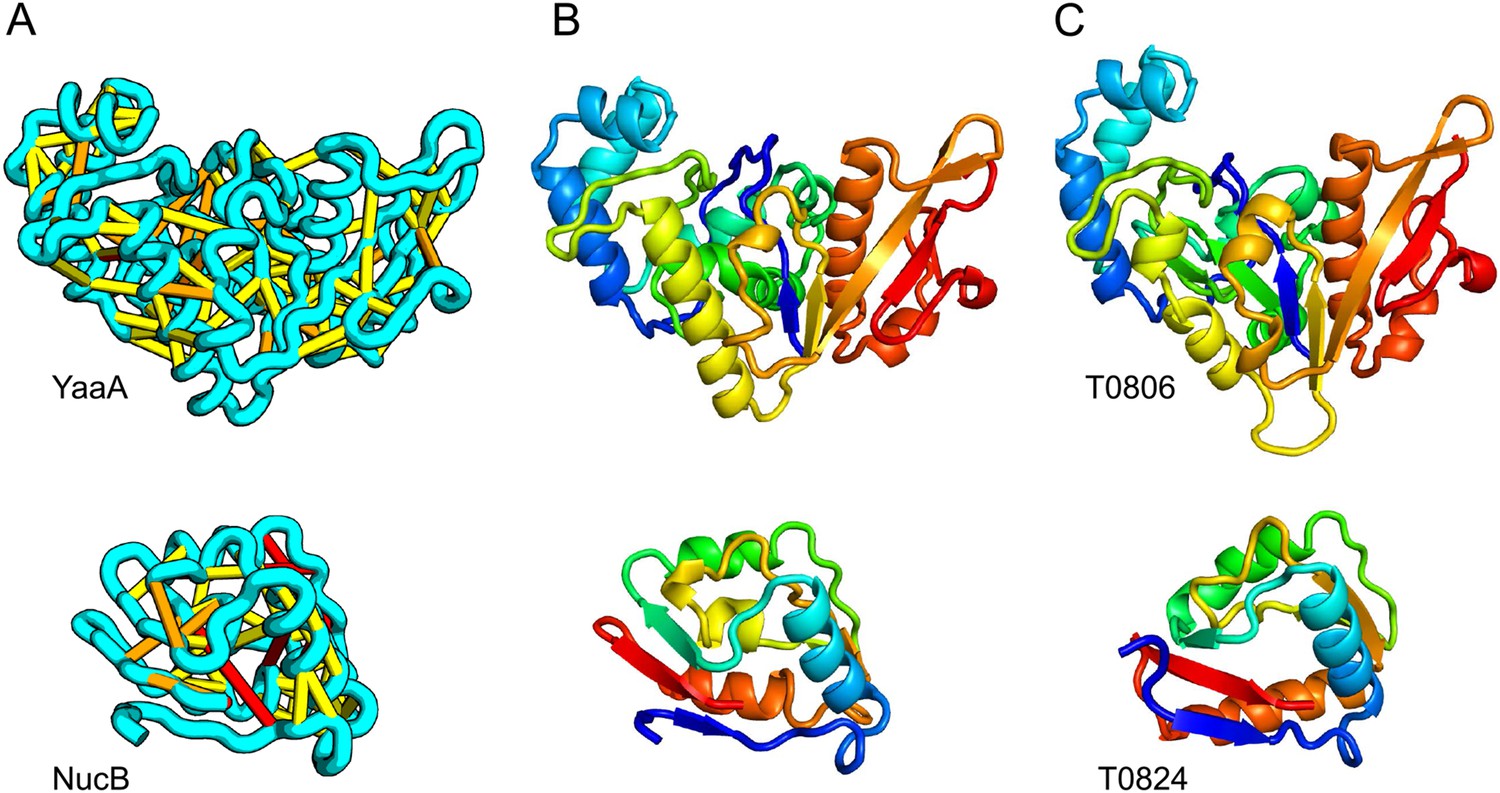
Accurate blind structure prediction of CASP11 targets T0806 and T0824.
(A) Location of the most strongly co-evolving residue pairs. Lines connect residue pairs with normalized coupling strength greater than 1.0; yellow, distance less than 5 Å; orange, distance less than 10 Å and red, greater than 10 Å in the models. (B) CASP11 submitted models, colored from N to C terminus (blue to red). (C) X-ray crystal structures. For T0806, the Cα RMSD over the full-length protein is 3.6 Å and 2.9 Å over 223 aligned residues. For T0824; the Cα RMSD over the full-length protein is 4.2 Å and 2.7 Å over 77 aligned residues. For statistics on all five models submitted during CASP, see Figure 1—source data 1.
-
Figure 1—source data 1
The Cκ-RMSD and GDT-TS calculations are over the full-length sequence.
The total GREMLIN score for the model is reported. The most accurate models have the best GREMLIN score.
- https://doi.org/10.7554/eLife.09248.032
Figure 2
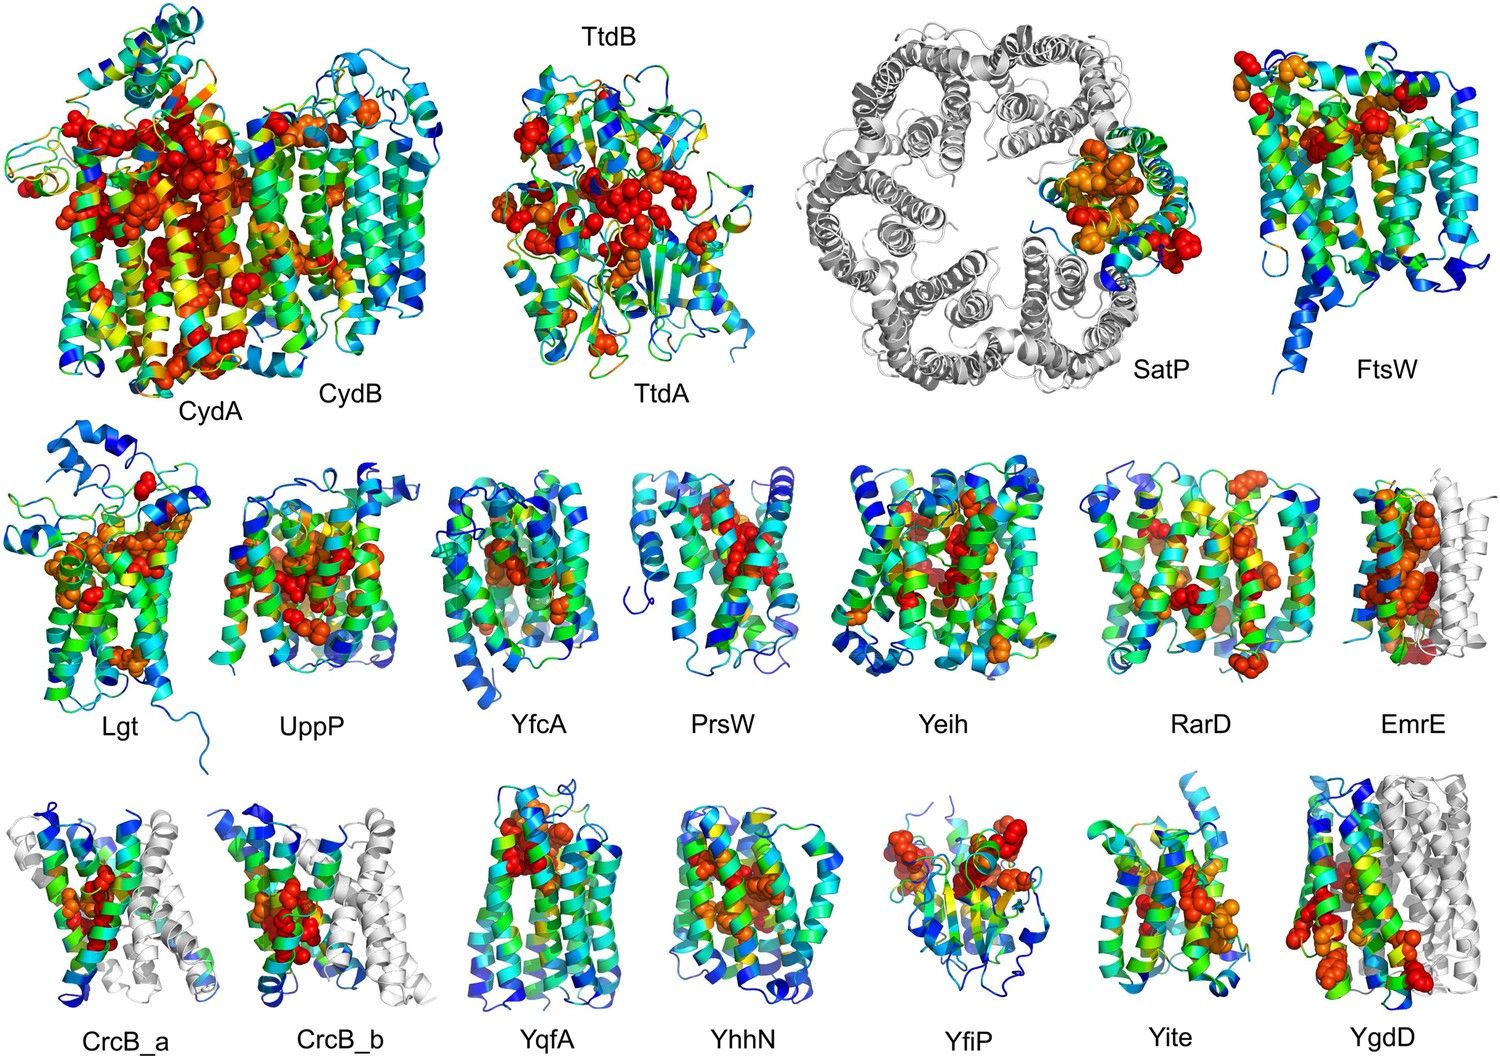
Conserved residues tend to cluster in the predicted structures.
Residue conservations from multiple sequence alignments were mapped to predicted structures using Al2Co (Pei and Grishin, 2001) and are colored in rainbow from blue (variable) to red (conserved). The most conserved residues (red or orange), displayed as spheres to highlight their positions, tend to line interaction surfaces and indicate potential functional sites.
Figure 3
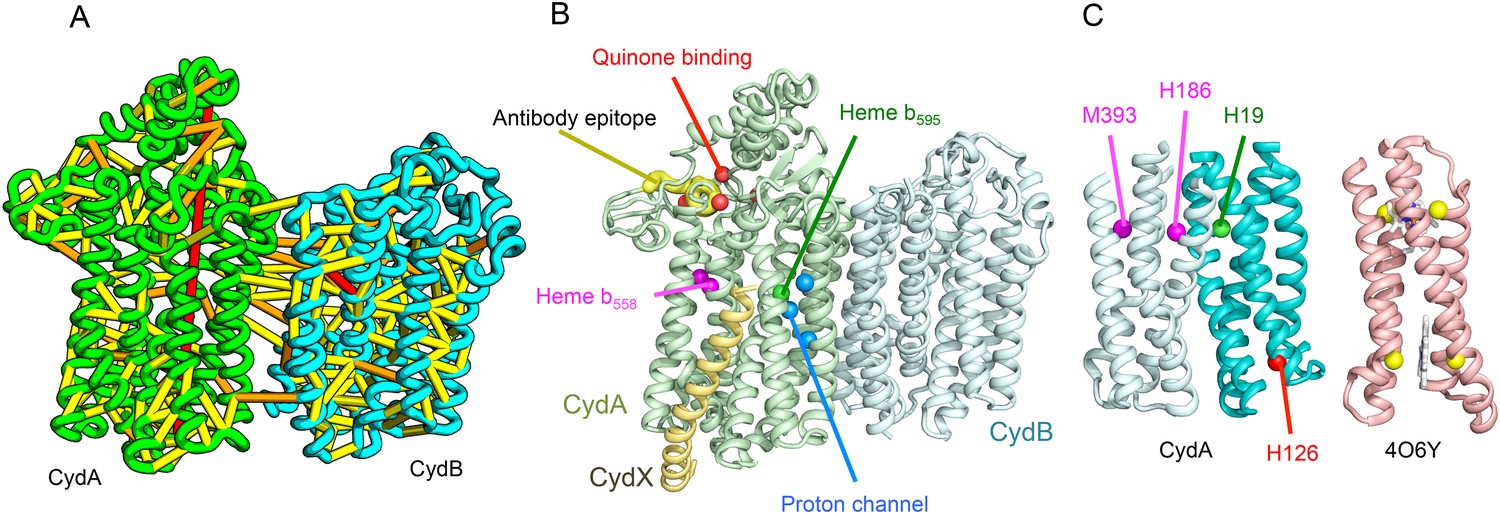
Predicted structure of the Cytochrome bd oxidase complex.
(A) Location of the top co-evolving residue pairs in our model. For clarity, the monomers have been pulled apart slightly. (B) Location of conserved and experimentally characterized residues (Borisov et al., 2011) on structure model. (C) Residues that coordinate heme in CydA are in the same location as histidines (yellow spheres) in Cytochrome b561 (PDB: 4O6Y). H126 (red sphere) overlaps one of these histidines and is the proposed as a heme d coordination site. For clarity, both the model of CydA and the structure of Cyt b562 (4O6Y) are trimmed to highlight the four helix bundle(s).
Figure 4

Predicted structure of the tartrate dehydratase heterotetramer composed of two copies each of ttdA and ttdB.
(A) Co-evolving residue pairs. The monomers have been pulled apart to reveal the contacts. (B) The ttdA subunit (rainbow) contains a 4Fe-4S cluster (white spheres) that is near the interface with ttdB (green).
Figure 5
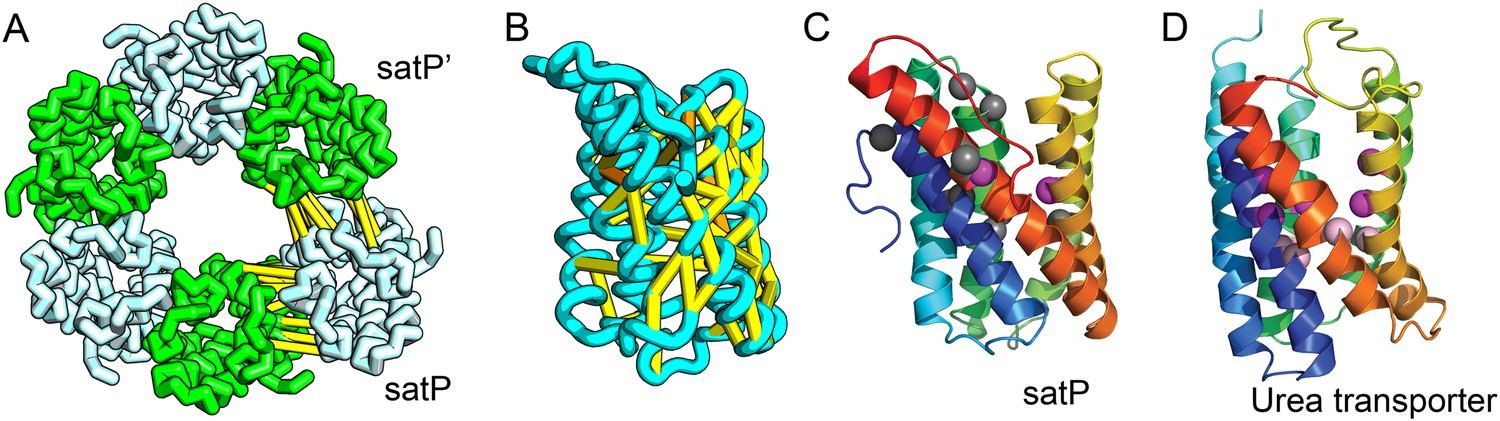
Succinate-acetate/proton symporter SatP (YaaH).
(A) Co-evolving residue pairs in homo-oligomer model. (B) Co-evolving residue pairs in SatP monomer model. (C) SatP co-evolution-based model places known acetate selective residues (magenta spheres) lining the channel. Conserved residues (gray spheres) line the periplasmic surface. The 6TMH channels are formed by threefold pseudo-symmetric TMH hairpins. (D) Proton-gated UreI channel protomer. C-alpha positions at the periplasmic constriction site (magenta spheres) and the cytoplasmic constriction site (pink spheres) are highlighted. The SatP model has the same fold as UreI (C vs D).
Figure 6
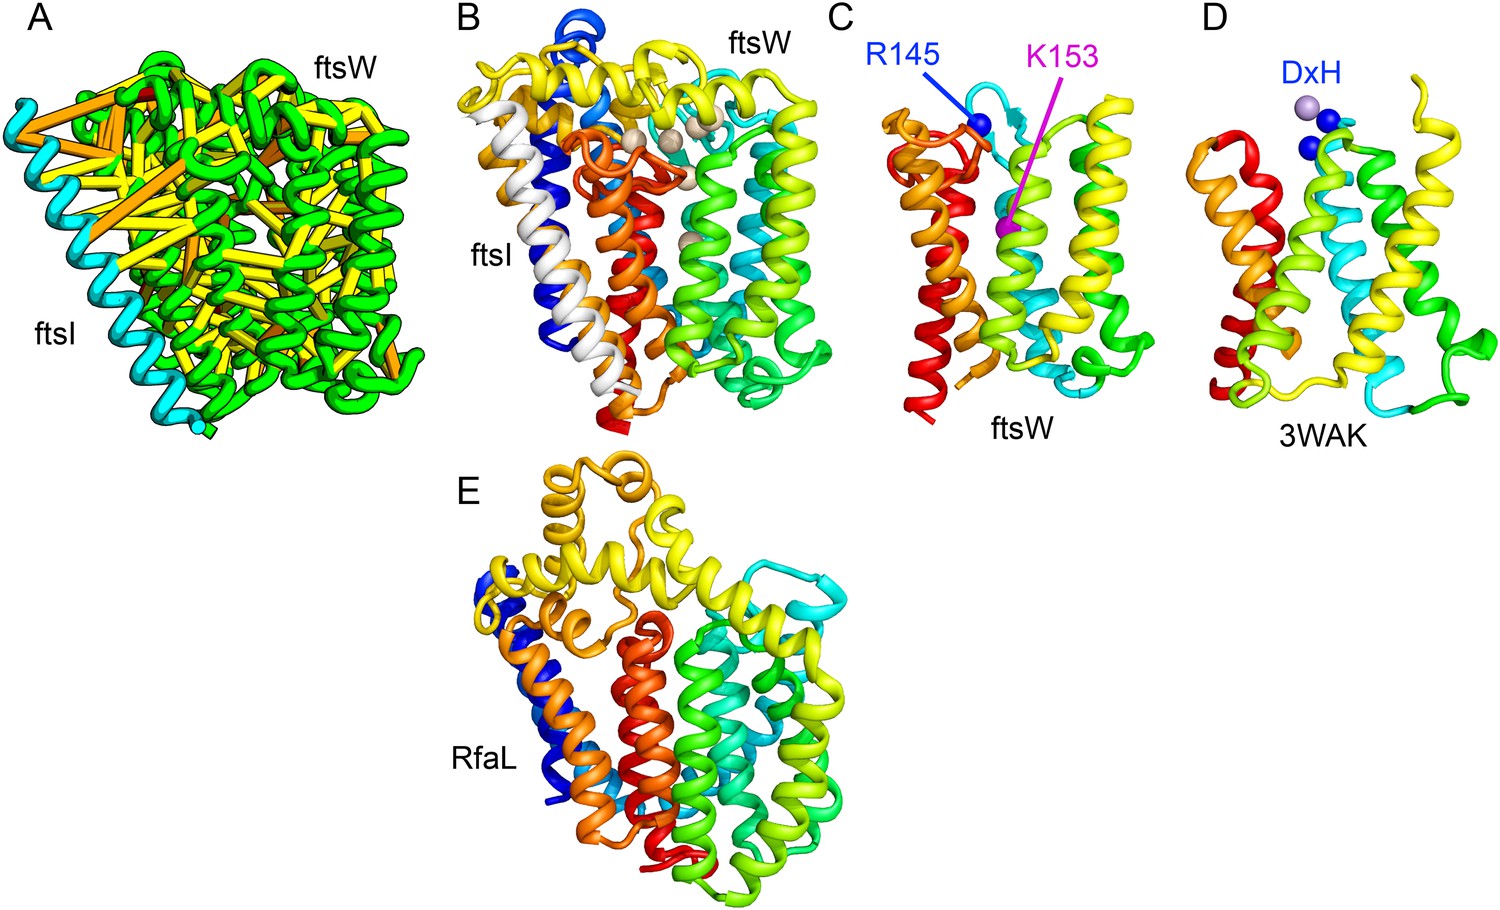
Lipid II flippase (FtsW) in complex with the transmembrane domain of Peptidoglycan synthase (FtsI).
FtsW is an essential cell division protein that transports lipids across the cytoplasmic membrane and is required for localization of FtsI. (A) Location of the top co-evolving residue pairs. (B) White spheres indicate conserved positions in FtsW that when mutated to alanine result in loss of flippase activity. (C, D) The last seven transmembrane (TM) helices of FtsW (TMH4-TMH10) adopting a similar topology as TMH4-TMH7 and TMH10-12 of the TM domain of STT3 (PDB: 3WAK). Both the model of FtsW and 3WAK was trimmed over the aligned helices for clarity. (C) Two residues from the corresponding TMH4 of FtsW (R145 and K153) are essential for flippase activity. (D) The side chain of R145 overlaps the residues that coordinate the divalent metal in the conserved DxH motif at the N-terminus of STT3 TMH4. (E) The model of RfaL adopts a similar fold as ftsW.
Figure 7
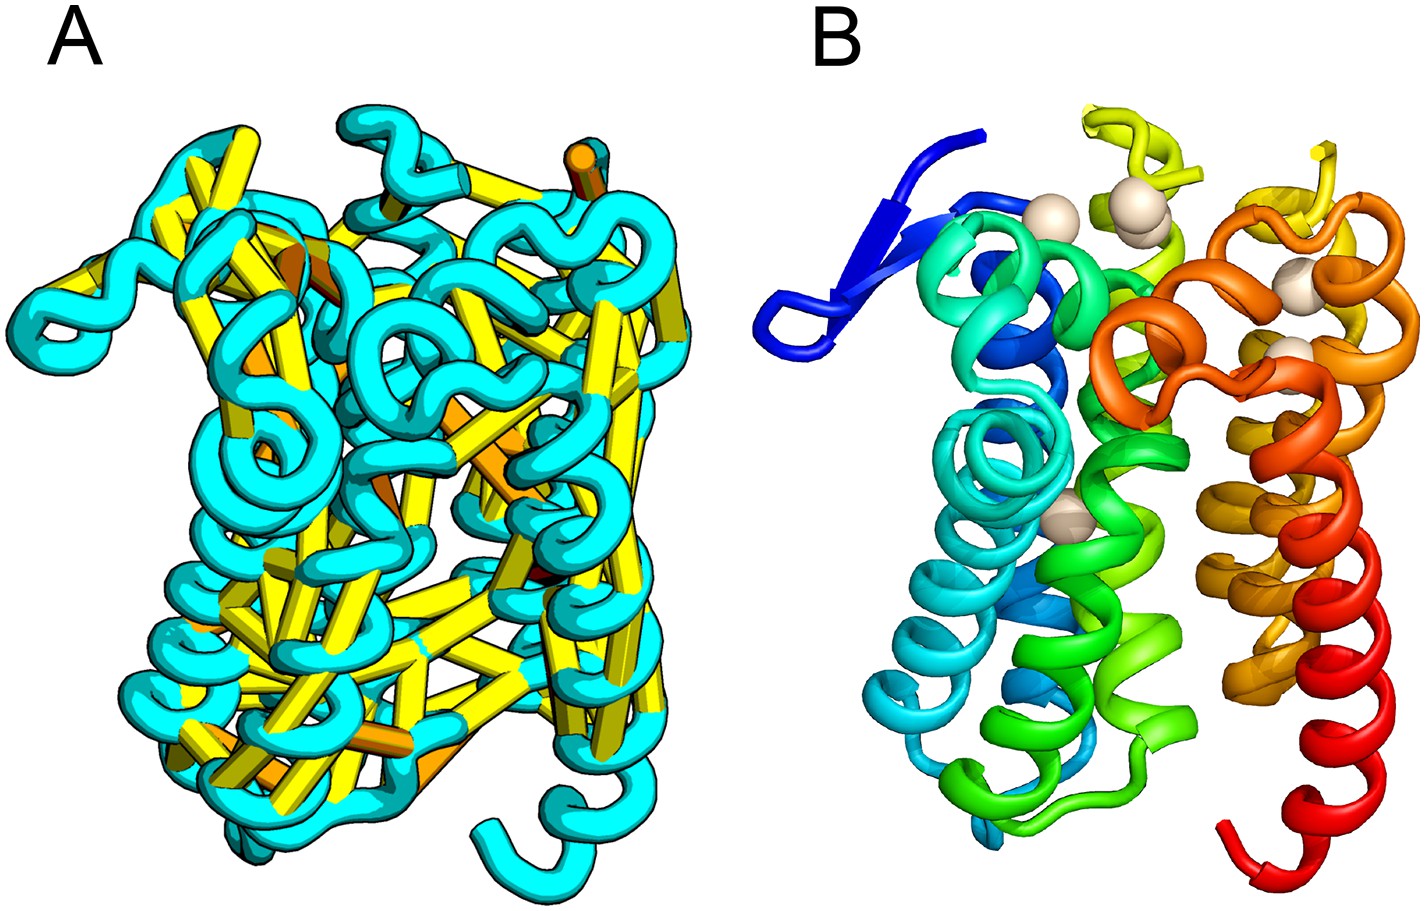
Prolipoprotein diacylglyceryl transferase (LGT).
(A) Predicted contacts indicated on model, (B) model with conserved positions at which alanine mutations result in loss in activity indicated in white spheres; five of these are clustered at the periplasmic end of the model.
Figure 8
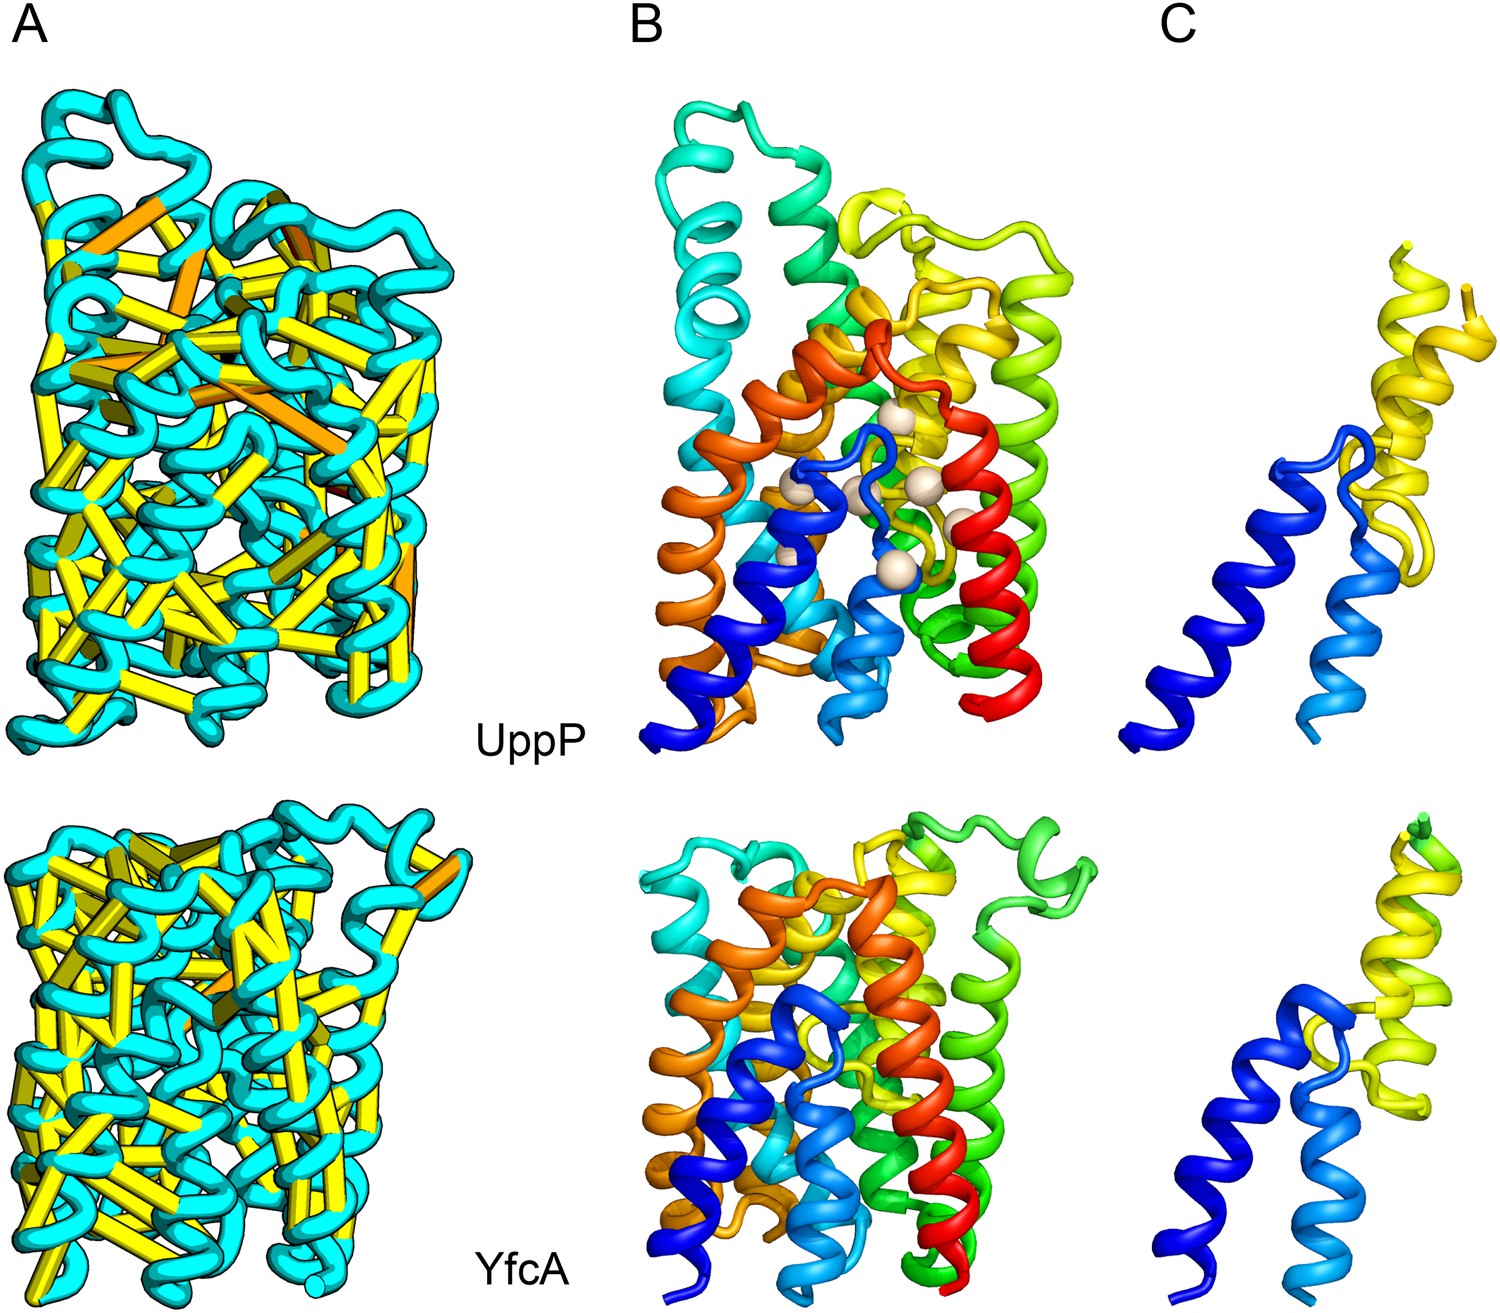
UppP catalyzes the dephosphorylation of undecaprenyl diphophate (UPP).
(A) Location of the top co-evolving residue pairs. (B) Spheres in white indicate conserved residues experimentally shown to decrease activity to <1% (Chang et al., 2014); all these residues are in the core in the model. YfcA, a protein of unknown function is a very distant sequence homologue of UppP (they are in different PFAM families); (C) the predicted structure of YfcA has the same fold as UppP with prominent broken helices (highlighted in blue and yellow).
Figure 9
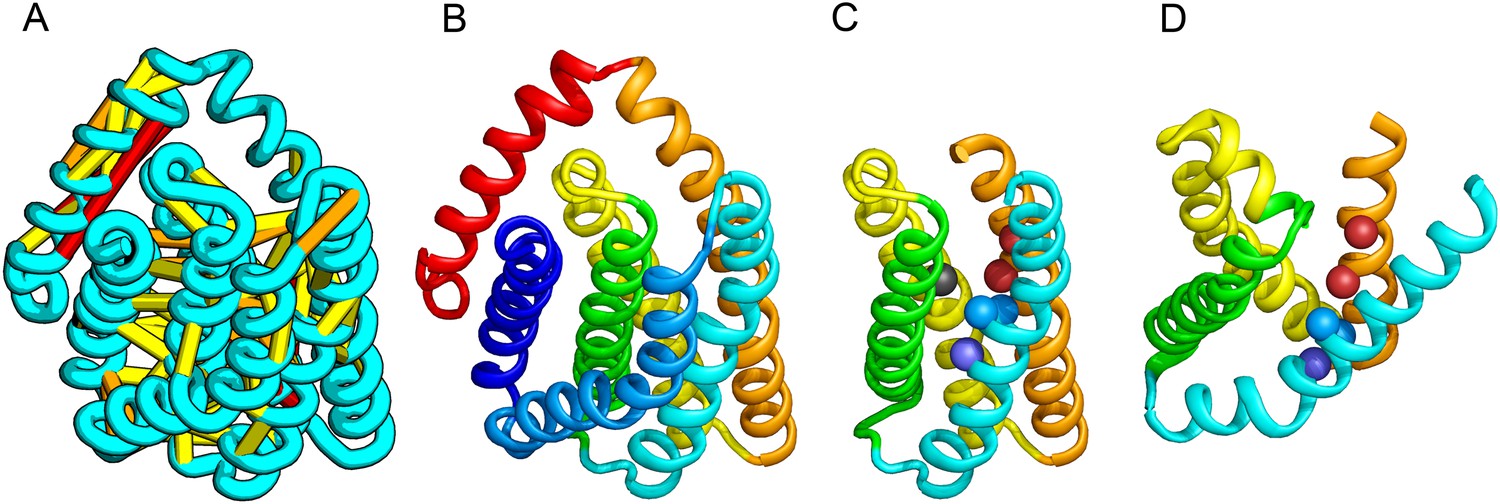
PrsW is an intramembrane protease that is crucial in the resistance to antimicrobial peptides.
(A) Location of the top co-evolving residue pairs. Our model of PrsW (B) contains a 4TMH substructure ([TMHs 3–6], (C) which is very similar to a substructure of type II CAAX prenyl protease [TMHs 4–7; D]). The predicted active site residues in PrsW motifs EExxK (TMH3; blue spheres, C) and HxxxD (TMH6; red spheres, C) are in positions similar to those of conserved residues in motifs EExxxR (TMH4; blue spheres, D) and HxxxN (TMH7; red spheres, D) of type II CAAX prenyl protease. Another conserved histidine in the fifth TMH of PrsW (but absent in type II CAAX prenyl protease) is also located in the predicted active site of PrsW (black sphere).
Figure 10
Our model of the inner membrane protein YeiH (A, B) is structurally similar to the structure of the antiporter NapA (C).
Lower panels: TM helices of core domains are highlighted in white and magenta: while these helices cross over each other in NapA (right), the core of our model of YeiH (left) is formed by two pairs of broken helices (TM5, 6 and TM8, 9) that exit the membrane on the same side.
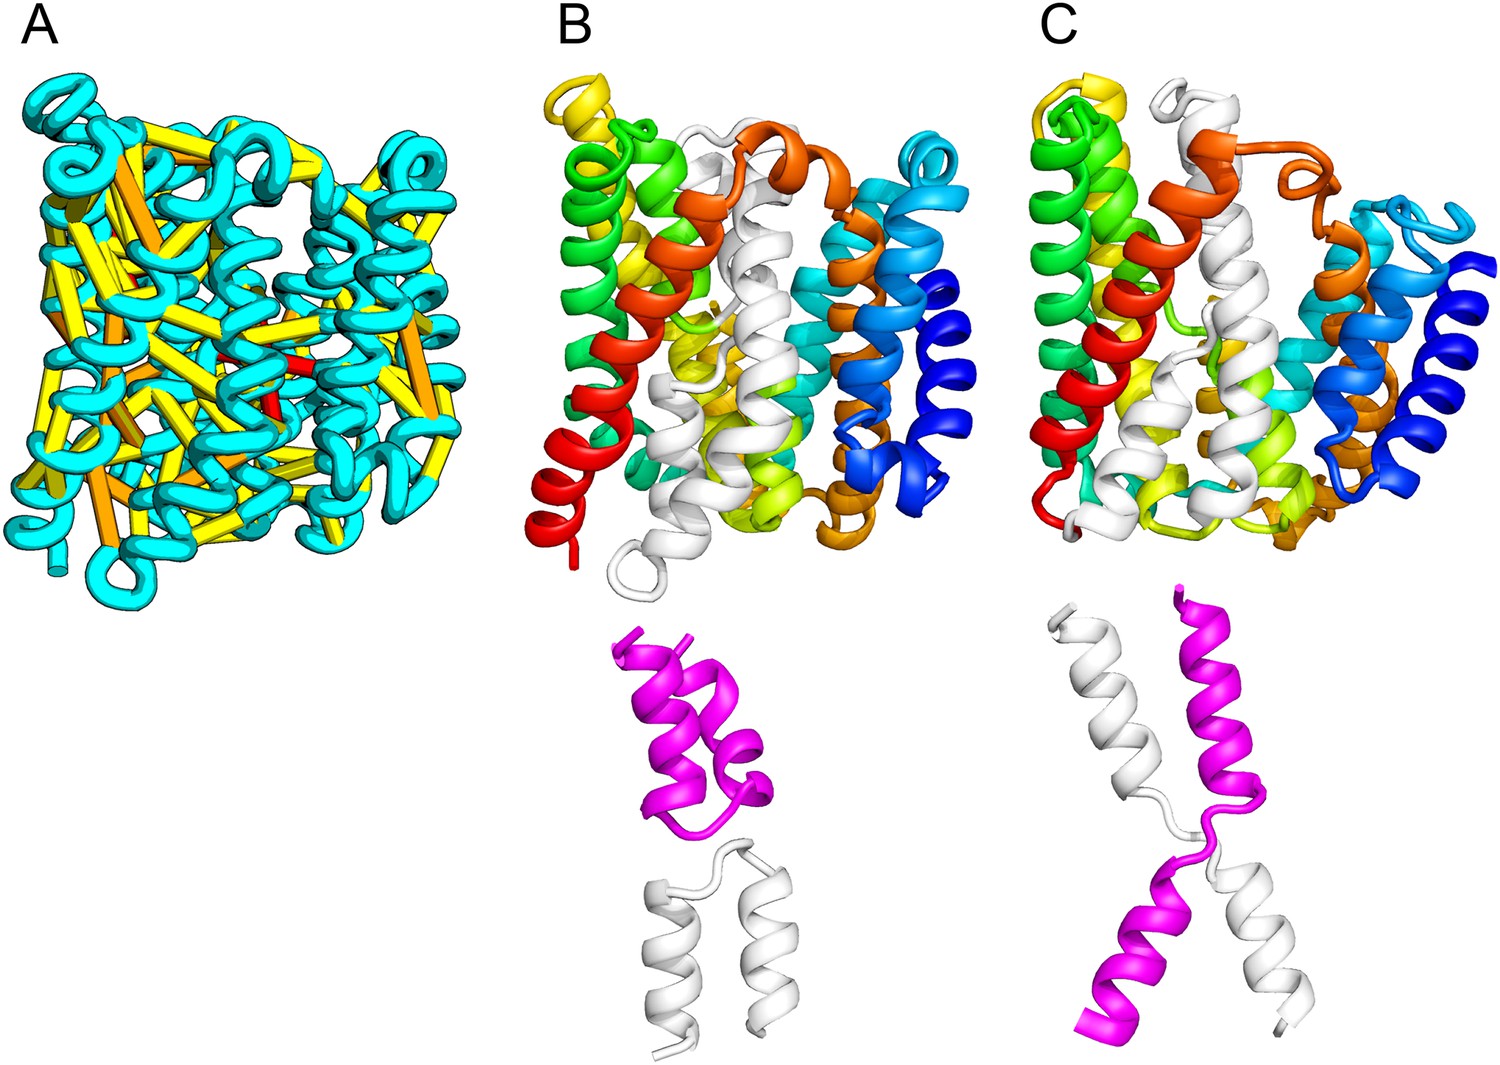
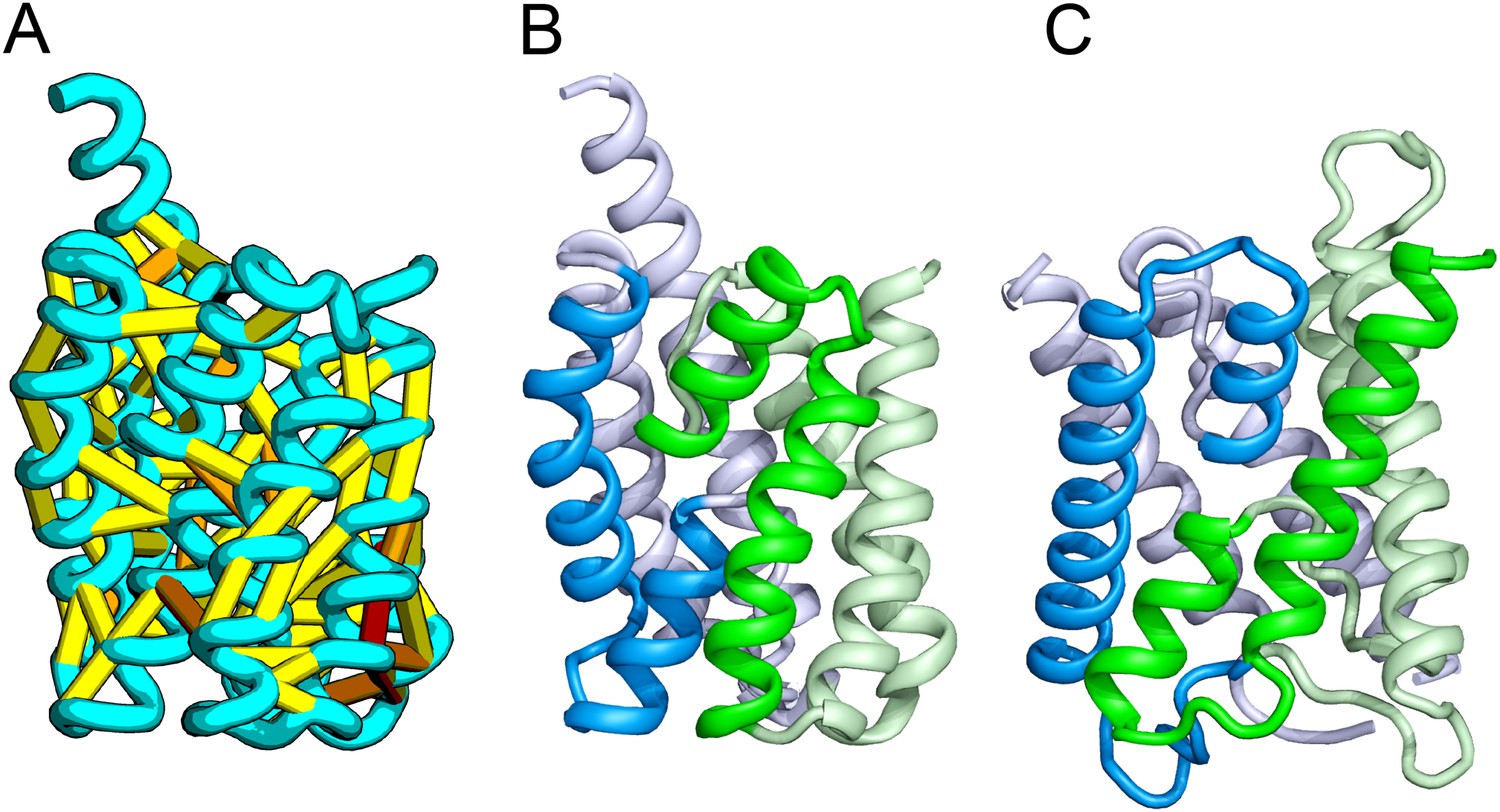
Figure 11
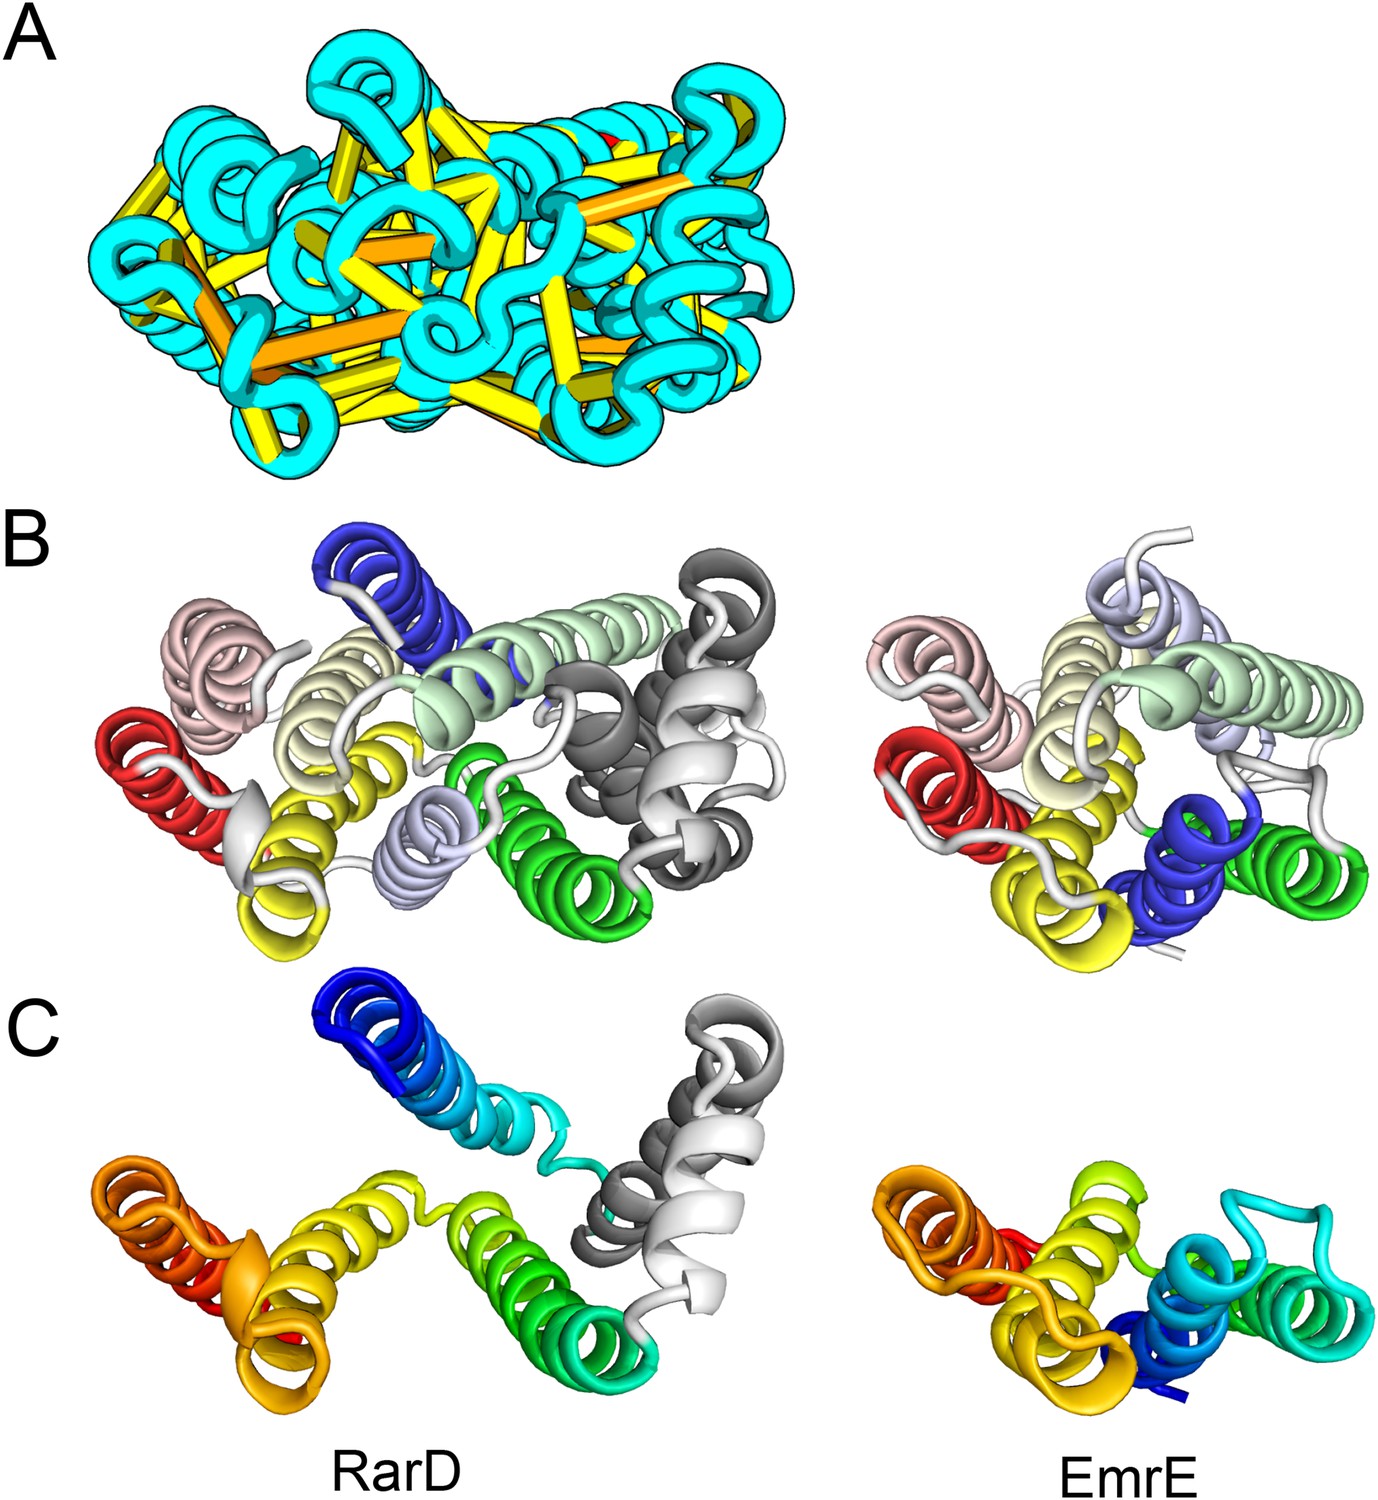
Our model of RarD has a similar architecture to EmrE but different fold.
(A, B) Full-length RarD and EmrE homodimer. (C) RarD internal repeat and EmrE monomer. The N-terminus helix (blue) is swapped in RarD relative to EmrE due to helix insertion (gray).
Figure 12
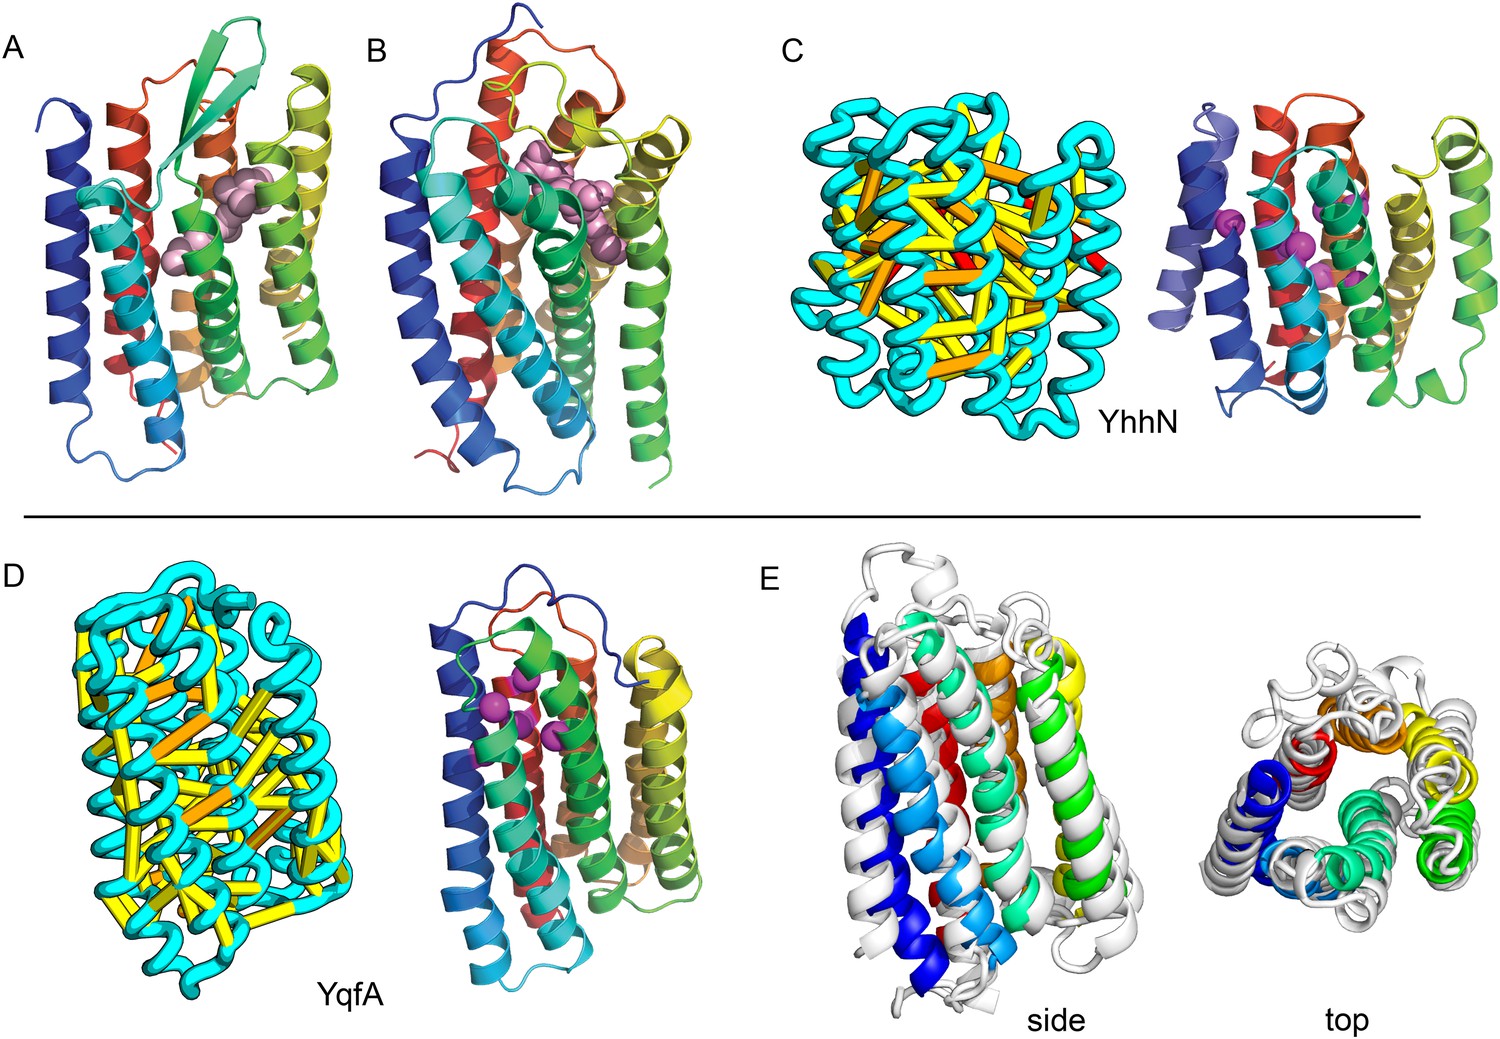
Predicted structures of YqfA and YhhN have topologies similar to G protein-coupled receptors (GPCR-like).
The core seven TM helix (TMH) fold exhibited by members of the GPCR superfamily is colored in rainbow from the N- to the C-terminus. (A) Bacteriorhodopsin binds retinal (pink spheres) in a pocket formed by TMH3-7 [PDB ID: 1m0k]. (B) The agonist (pink spheres) binding site of P2Y12 receptor is formed by the same set of helices [PDB ID: 4pxz]. (C) A co-evolution-based structure model for YhhN has the GPCR topology with an N-terminal TMH extension. Conserved residues that might form an active site (magenta spheres) cluster in a similar place as the YqfA catalytic residues. (D) Our co-evolution-based structure model for YqfA has a GPCR like topology and clusters residues that may form an active site (magenta spheres mark the Calpha position) in a region that corresponds to the GPCR ligand-binding pocket. (E) Side and top view of the TMalign superposition of YqfA model (in rainbow) over the recently released 3wxw (in white) human ortholog. The N- and C-terminal loops were trimmed for clarity. The TMalign score between the model and the homolog is 0.8.
Figure 13
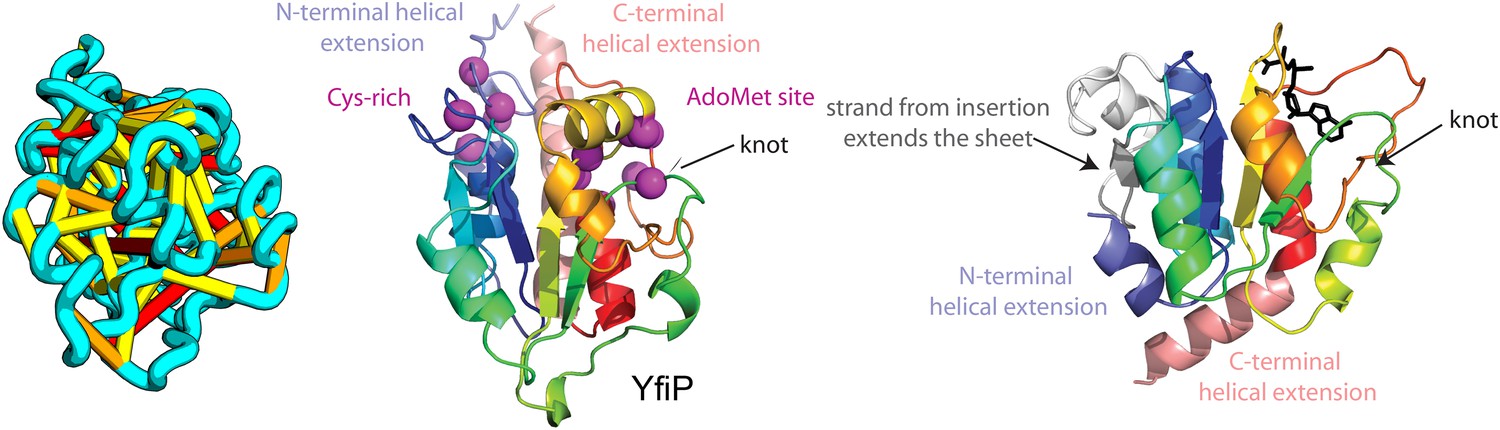
YfiP predicted structure has methyltransferase-like fold with knot.
Left: the top co-evolving residues pairs. Middle: conserved residues (magenta) surround the AdoMet-binding site and a conserved Cys could bind a Fe4S cluster. Right: 3nk7 methyltransferase bound to AdoMet.
Figure 14
Bacillus subtilis YitE model.
(A) The top co-evolving residues. YitE (B) has architecture similar to aquaporin (PDB:2B6P) (C), including the internal pseudo-symmetry (blue vs green), but completely different connectivity.
Figure 15
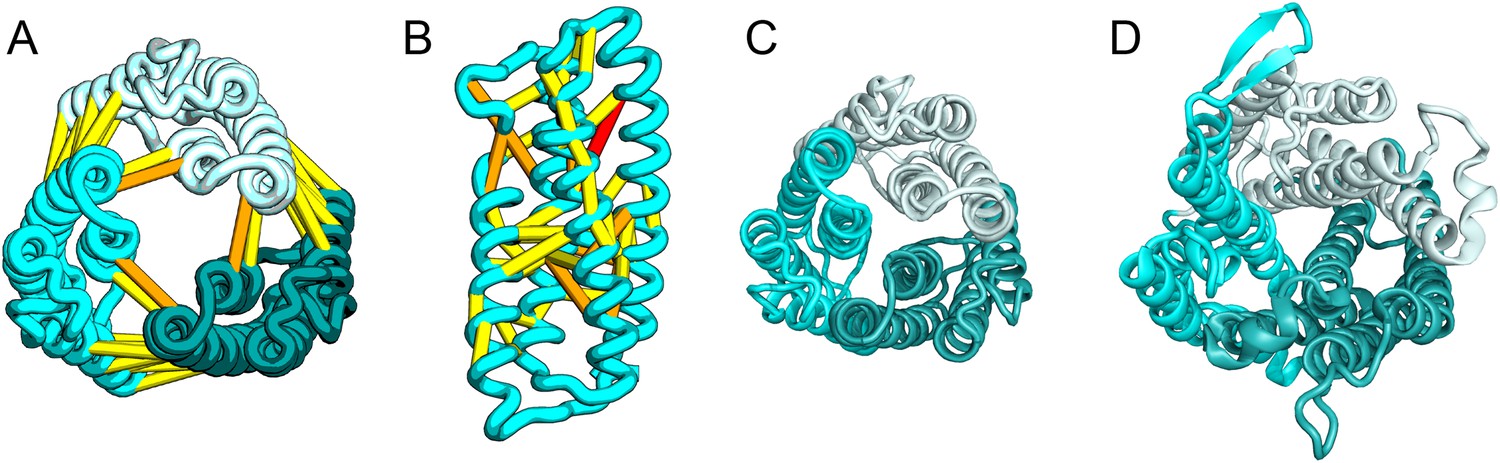
Escherichia coli protein YgdD.
Our model of the E. coli protein YgdD trimer (C) is based on predicted contacts satisfied within the monomer (B) and between monomers in the homo-trimer (A). Structural similarity to heme copper oxidase (D) along with a weak HHpred sequence match over part of the protein suggests that YgdD is evolutionarily related to heme–copper oxidases.
Figure 16 with 1 supplement
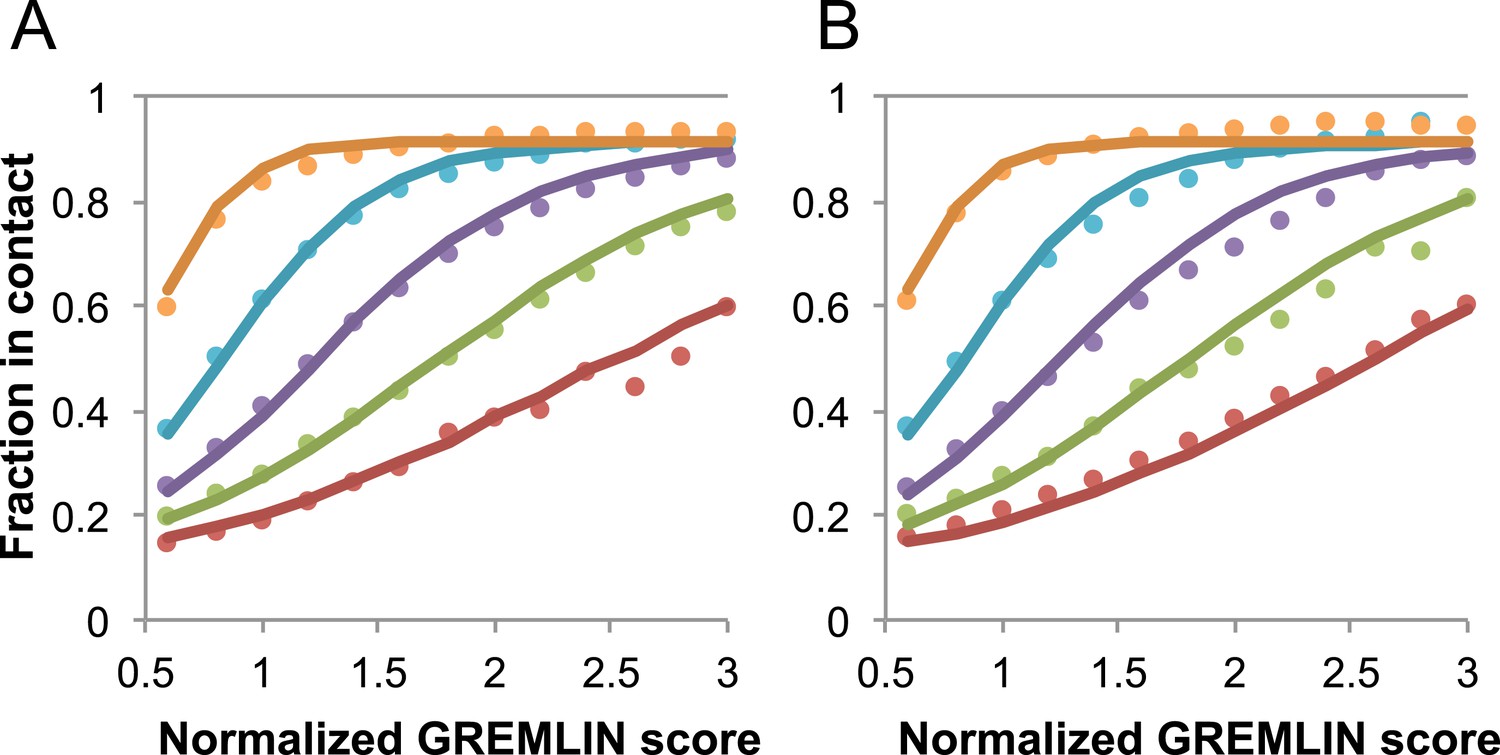
Dependence of the accuracy of predicted contacts on the normalized GREMLIN score (sco), the effective number of sequences (seq), the length (len), and the sequence separation (sep).
Contacts are defined based on amino acid specific Cβ-Cβ distance cutoffs as described in SI Table 3 in Kamisetty et al. (2013). (A) Observed vs predicted accuracies over a large data set of proteins of known structure with deep alignments (Supplementary file 3), sub sampled to different extents (seq/√(len) = 4 (red), 8 (green), 15 (purple), 32 (cyan), and 96 (orange)). Circles represent observed contact prediction accuracies, solid lines, a fit to a sigmoid function of the normalized coupling value, the number of sequences, the length, and the sequence separation (see Figure 16—figure supplement 1 and Figure 16—figure supplement 2). (B) Observed vs predicted accuracies in an independent data set of variable length alignments for 7047 pdb chains (Supplementary file 3), using maximum number of sequences obtained with HHblits as opposed to subsampling a large alignment. Circles again represent observed contact prediction accuracies; solid lines, the predicted accuracy using the model obtained by fitting to the data in (A). The contact prediction accuracy is correctly modeled for the independent data set, justifying its use on the unknown cases described in this article. The Equation use to calculate P(contact|sco,seq,len,sep) is
Figure 16—figure supplement 1
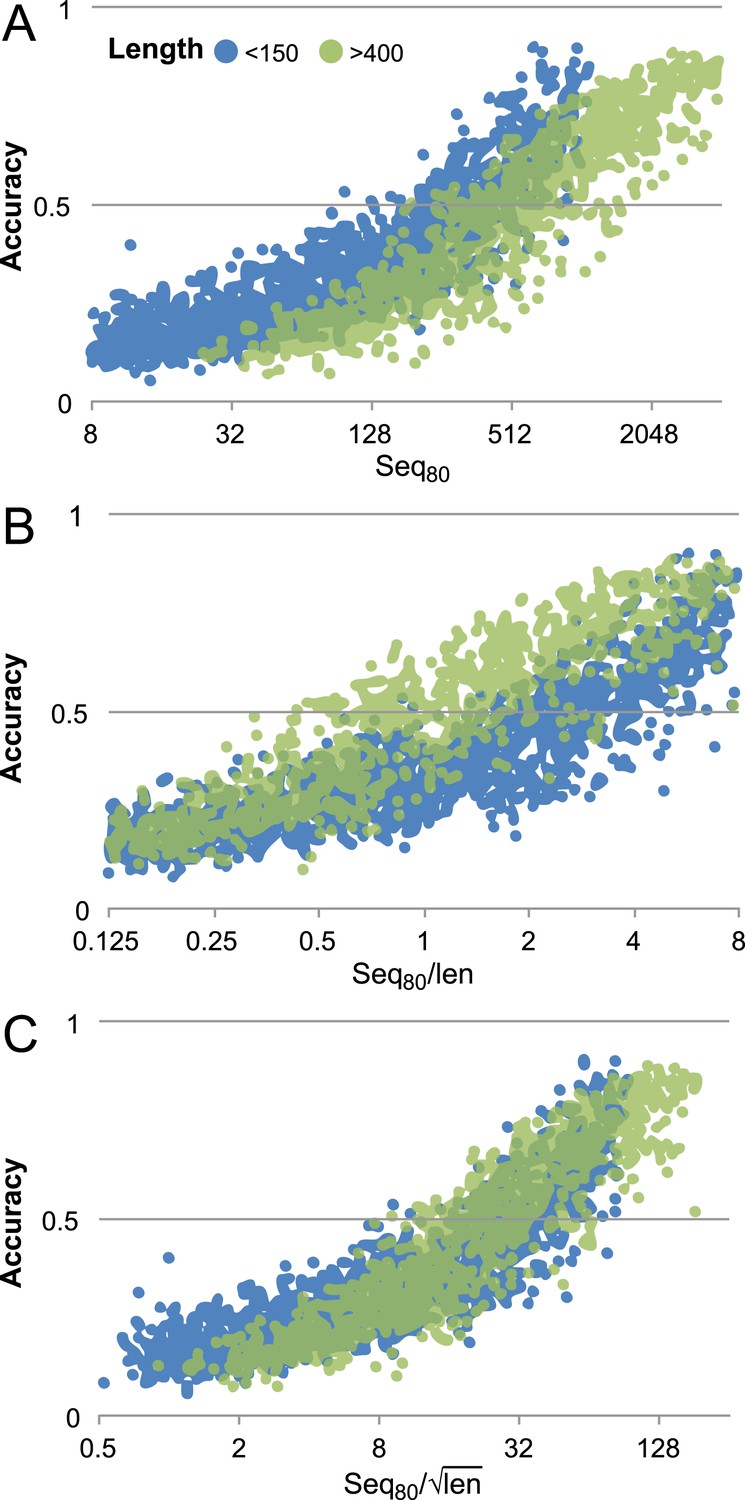
Contact prediction accuracy is better correlated with (#sequences/sqrt(length)) than with (#sequences/length).
Accuracy is computed for the top 3L/2 GREMLIN predictions, with sequence separation ≥3, based on Cβ-Cβ amino acid specific distance as described in SI Table 3 in Kamisetty et al. (2013). The number of sequences after reducing the redundancy to 80% is shown. A set of 7047 pdb chains (see Supplemental file 3) was divided into two groups by length (less than 150 and greater than 400). (A) Larger proteins with similar number of sequence were less accurate then the smaller proteins. (B) #Sequences/length as often used does not accurately account for length dependence. There is a clear separation between the blue and green distributions. (C) #Sequences/√length better accounts for the length dependency. The blue and green distributions overlap.
Figure 17
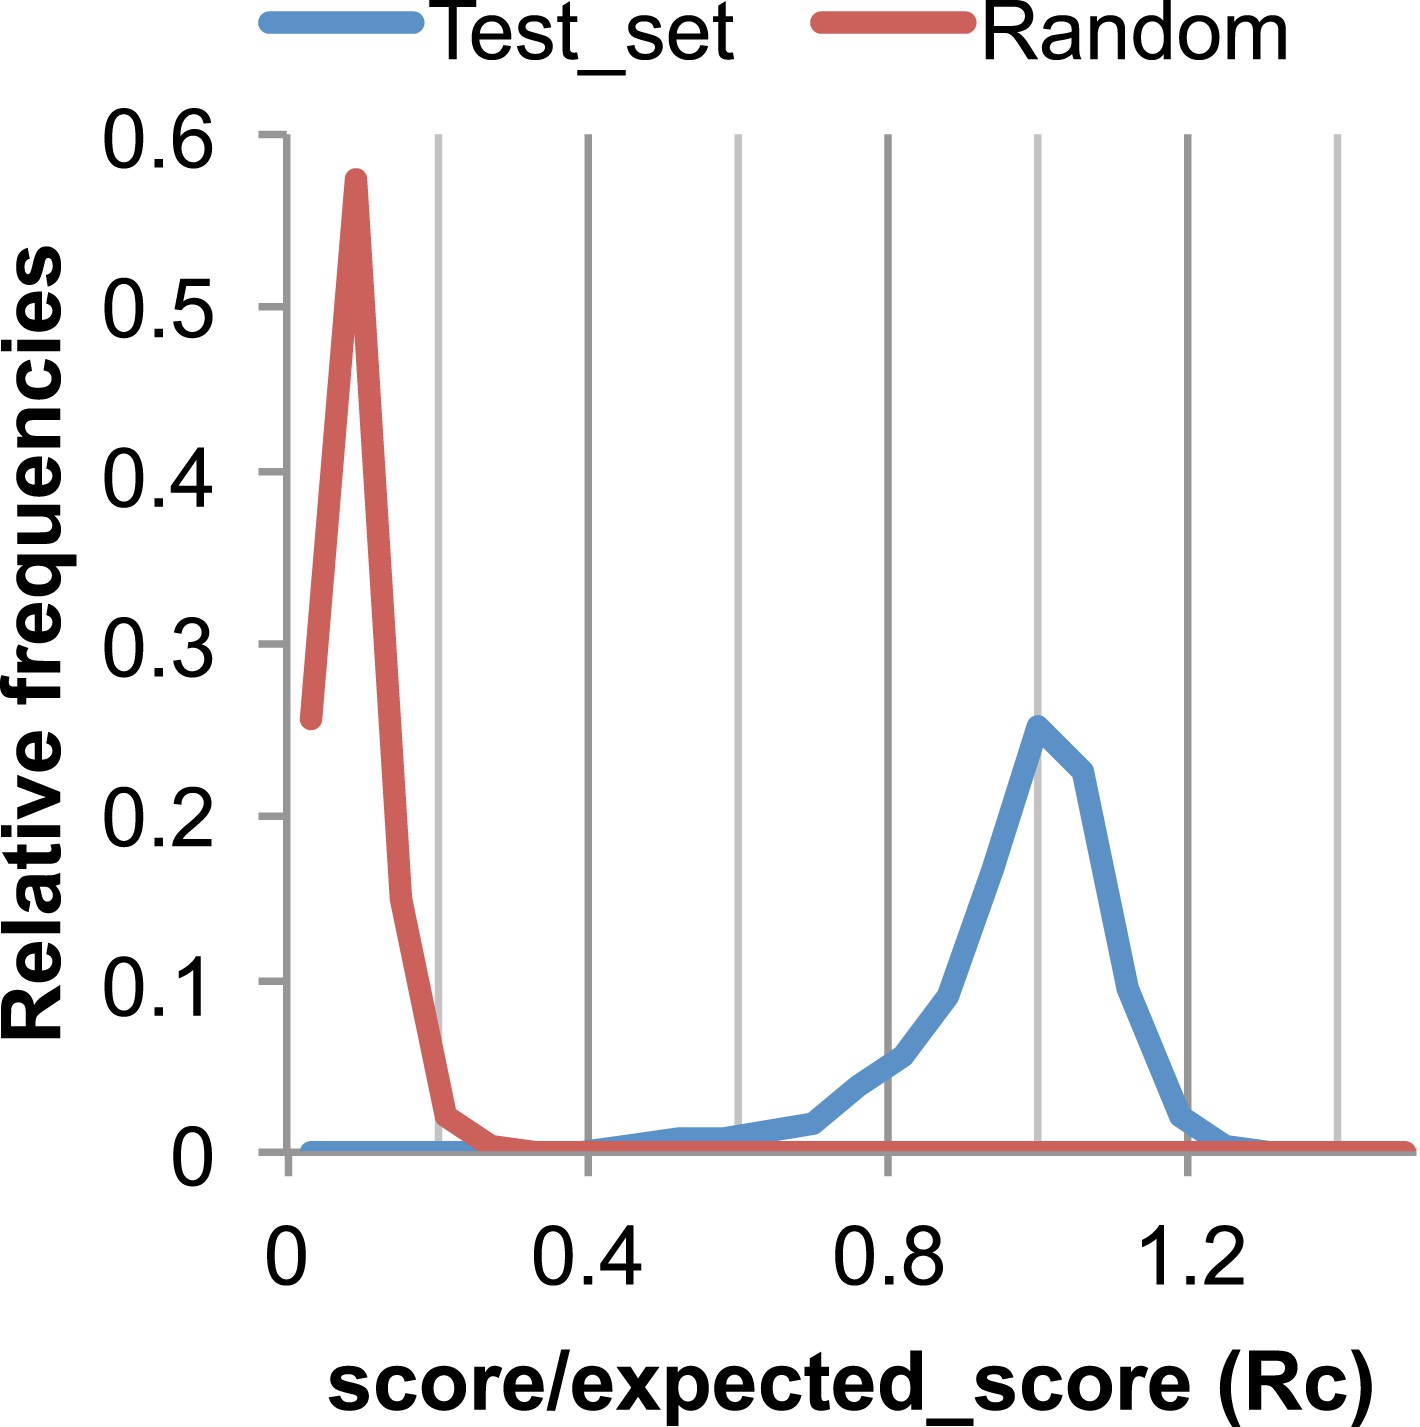
The Rc metric used to assess fit of predicted contacts to a model.
The expected total GREMLIN score if the structure was native was estimated by summing sco*P(contact|sco, seq, len, sep) over all contacts with sep ≥6. To evaluate the fit of a particular model to a predicted contact set, we take the ratio of the actual total GREMLIN score of the model to the expected total score computed as above; we refer to this ratio of observed and expected contact scores as ‘Rc’. Blue line: the distribution of Rc in native structures with 4L–10L sequences; Red line: distribution of Rc after randomly reassigning contact predictions to structures. Rc values less than 0.7 are very infrequently observed for native structures; we use this value as a cutoff to evaluate the fit of a predicted contact set to a model.
Tables
Table 1
Transmembrane protein benchmark
| PDB | Name | Seq/len | Full protein | Converged | Aligned | |||
|---|---|---|---|---|---|---|---|---|
| rmsd | Length | rmsd | Length | rmsd | Length | |||
| 4HE8_H (3.3) | NADH-quinone oxidoreductase subunit 8 | 17.3 | 4.9 | 269 | 2.1 | 183 | 2.2 | 234 |
| 1SOR_A (N/A) | Aquaporin-0 | 26.2 | 2.7 | 221 | 2.1 | 188 | 2.0 | 200 |
| 4Q2E_A (3.4) | Phosphatidate cytidylyltransferase | 18.6 | 5.4 | 262 | 3.5 | 176 | 2.8 | 178 |
| 4HTT_A (6.8) | Sec-independent protein translocase protein | 14.6 | 3.9 | 225 | 1.8 | 124 | 2.4 | 181 |
| 4P6V_E (3.5) | Na(+)-translocating NADH-quinone reductase subunit D | 14.3 | 5.0 | 194 | 1.4 | 49 | 2.8 | 155 |
| 4J72_A (3.3) | Phospho-N-acetylmuramoyl-pentapeptide-transferase | 19.9 | 6.6 | 323 | 3.1 | 251 | 2.4 | 237 |
| 3V5U_A (1.9) | Sodium/Calcium exchanger | 10.2 | 3.9 | 297 | 3.7 | 284 | 2.3 | 245 |
| 4PGS_A (2.5) | Uncharacterized protein YetJ | 15.4 | 3.5 | 207 | 2.7 | 175 | 2.2 | 183 |
| 4QTN_A (2.8) | Vitamin B3 transporter PnuC | 9.0 | 4.2 | 202 | 3.0 | 155 | 2.8 | 178 |
| 4OD4_A (3.3) | 4-hydroxybenzoate octaprenyltransferase | 22.8 | 3.9 | 275 | 3.4 | 242 | 2.8 | 231 |
| 4O6M_A (1.9) | CDP-alcohol phosphotransferase | 13.3 | 4.1 | 188 | 4.0 | 165 | 2.3 | 159 |
| 4WD8_A (2.3) | Bestrophin domain protein | 5.94 | N/A | 268 | Not converged | |||
| 4F35_A (3.2) | Transporter, NadC family | 14.5 | N/A | 434 | Not converged | |||
-
Column 1, PDB code (resolution of the crystal structure); column 2, protein name; column 3, sequences per length, after filtering to reduce the redundancy to 90%; column 4, RMSD of predicted structure to native structure; column 5, length of native structure modeled; column 6, RMSD over converged and constrained region; column 7, length of converged and constrained region; column 8, RMSD over TM-align structural alignment; column 9, length of structurally aligned region.
Table 2
Comparison of fold recognition and Rosetta models for large protein families
| Known function | Rc | TMscore | ||||||
|---|---|---|---|---|---|---|---|---|
| Name | #seq | Ev | HH | SP | M | M_HH | M_SP | HH_SP |
| WECH: O-acetyltransferase (YiaH) | 24,750 | −2.4 | 0.0 | 0.1 | 0.9 | 0.1 | 0.2 | 0.1 |
| SATP: Succinate-acetateproton symporter (YaaH) | 2298 | −2.1 | 0.4 | 0.5 | 1.1 | 0.3 | 0.3 | 0.8 |
| LSPA: Lipoprotein signal peptidase | 8156 | −2.0 | 0.2 | 0.1 | 1.0 | 0.2 | 0.3 | 0.3 |
| YADH: ABC-type multidrug transport permease | 42,626 | −2.0 | 0.1 | 0.1 | 0.7 | 0.3 | 0.2 | 0.2 |
| YEBZ: Putative copper export protein | 4067 | −2.0 | 0.1 | 0.1 | 0.8 | 0.2 | 0.3 | 0.2 |
| CRCB: Fluoride ion exporter | 7829 | −1.8 | 0.2 | 0.3 | 1.0 | 0.2 | 0.2 | 0.3 |
| LPTG: Lipopolysaccharide export system permease | 8101 | −1.8 | 0.0 | 0.1 | 0.9 | 0.1 | 0.1 | 0.2 |
| FTSW: Lipid II flippase | 14,900 | −1.7 | 0.0 | 0.1 | 1.0 | 0.1 | 0.2 | 0.2 |
| RFAL: O-antigen ligase | 13,535 | −1.7 | 0.2 | 0.1 | 0.9 | 0.3 | 0.2 | 0.2 |
| CCMB: Heme exporter protein B | 2433 | −1.6 | 0.1 | 0.1 | 0.7 | 0.2 | 0.2 | 0.2 |
| MLAE: ABC transporter permease for lipid asymmetry | 7662 | −1.4 | 0.0 | 0.1 | 0.9 | 0.1 | 0.2 | 0.3 |
| SULP: Sulfate permease | 6647 | −1.2 | 0.1 | 0.0 | 0.8 | 0.2 | 0.2 | 0.2 |
| TOLQ: Biopolymer transport protein | 9256 | −1.2 | 0.1 | 0.1 | 0.7 | 0.2 | 0.2 | 0.2 |
| LGT: Prolipoprotein diacylglyceryl transferase | 8121 | −1.1 | 0.1 | 0.2 | 1.0 | 0.2 | 0.3 | 0.3 |
| Q97UR7: N-methylhydantoinase B (HyuB-3) | 4491 | −1.0 | 0.1 | 0.1 | 1.1 | 0.1 | 0.1 | 0.1 |
| YGAZ: putative L-valine exporter | 6435 | −1.0 | 0.1 | 0.2 | 0.9 | 0.2 | 0.3 | 0.2 |
| CCMC: Heme exporter protein C | 5965 | −0.8 | 0.1 | 0.1 | 1.1 | 0.2 | 0.2 | 0.2 |
| YEDZ: Sulfoxide reductase heme-binding subunit | 2247 | −0.7 | 0.2 | 0.2 | 1.0 | 0.2 | 0.3 | 0.3 |
| YIAM: TRAP transporter small permease protein | 10,715 | −0.7 | 0.1 | 0.2 | 1.1 | 0.3 | 0.3 | 0.2 |
| TTDA: Tartrate dehydratase, alpha subunit | 4238 | −0.6 | 0.0 | 0.1 | 1.2 | 0.1 | 0.1 | 0.1 |
| UPPP: Undecaprenyl pyrophosphate phosphatase | 7842 | −0.6 | 0.0 | 0.1 | 1.0 | 0.2 | 0.2 | 0.2 |
| PLSY: Probable glycerol-3-phosphate acyltransferase | 6112 | −0.4 | 0.1 | 0.2 | 1.1 | 0.2 | 0.4 | 0.2 |
| FLIL: Flagellar protein | 2690 | −0.3 | 0.7 | 0.5 | 0.8 | 0.5 | 0.4 | 0.9 |
| CYDB: Cytochrome bd oxidase 2 | 6864 | 0.0 | 0.1 | 0.1 | 1.0 | 0.2 | 0.2 | 0.1 |
| CYDA: Cytochrome bd oxidase 1 | 6200 | 0.1 | 0.0 | 0.1 | 1.2 | 0.1 | 0.2 | 0.2 |
| MOTA: Motility protein A, flagellar motor proton conductor | 4734 | 0.3 | 0.1 | 0.1 | 0.9 | 0.1 | 0.1 | 0.2 |
| SLYB: Outer membrane lipoprotein | 1860 | 0.3 | 0.1 | 0.2 | 0.8 | 0.2 | 0.2 | 0.1 |
| MRED: Rod shape-determining protein | 1546 | 0.6 | 0.5 | 0.5 | 0.8 | 0.5 | 0.4 | 0.6 |
| ZUPT: Zinc transporter | 10,517 | 0.6 | 0.1 | 0.1 | 0.8 | 0.2 | 0.1 | 0.2 |
| YOHK: Putative effector of murein hydrolase LrgB | 3941 | 2.3 | 0.2 | 0.1 | 0.9 | 0.4 | 0.2 | 0.2 |
| PRSW: Membrane proteinase | 2500 | 5.3 | 0.2 | 0.2 | 0.9 | 0.3 | 0.3 | 0.7 |
| DDG: Lipid A biosynthesis palmitoleoyl acyltransferase | 9430 | 5.8 | 0.4 | 0.1 | 1.0 | 0.4 | 0.2 | 0.2 |
| Unknown function | Rc | TMscore | ||||||
|---|---|---|---|---|---|---|---|---|
| Name | #seq | Ev | HH | SP | M | M_HH | M_SP | HH_SP |
| YQFA: UPF0073 inner membrane protein | 7596 | −2.6 | 0.1 | 0.4 | 1.1 | 0.2 | 0.5 | 0.3 |
| YCED: Uncharacterized protein | 1604 | −2.5 | 0.1 | 0.2 | 0.9 | 0.2 | 0.2 | 0.2 |
| YPHA: Inner membrane protein | 2986 | −2.2 | 0.1 | 0.4 | 1.0 | 0.2 | 0.3 | 0.2 |
| YADS: UPF0126 inner membrane protein | 5222 | −1.9 | 0.1 | 0.1 | 0.9 | 0.2 | 0.3 | 0.2 |
| YHHN: Uncharacterized membrane protein | 2529 | −1.9 | 0.1 | 0.2 | 0.9 | 0.2 | 0.3 | 0.2 |
| YIDH: Inner membrane protein | 1041 | −1.9 | 0.1 | 0.2 | 0.6 | 0.3 | 0.3 | 0.2 |
| YITE: UPF0750 membrane protein | 8326 | −1.7 | 0.1 | 0.1 | 0.9 | 0.2 | 0.3 | 0.3 |
| HDED: Acid resistance membrane protein | 2885 | −0.6 | 0.1 | 0.2 | 0.8 | 0.2 | 0.2 | 0.2 |
| YFIP: DTW domain-containing protein | 3100 | −1.5 | 0.2 | 0.2 | 0.9 | 0.2 | 0.2 | 0.1 |
| YPJD: ABC-type uncharacterized permease | 6180 | −1.4 | 0.2 | 0.2 | 0.9 | 0.2 | 0.3 | 0.2 |
| YJFL: UPF0719 inner membrane protein | 1581 | −1.3 | 0.1 | 0.1 | 0.7 | 0.2 | 0.3 | 0.3 |
| YTEJ: Uncharacterized membrane protein | 5733 | −1.2 | 0.1 | 0.1 | 1.0 | 0.2 | 0.2 | 0.2 |
| YIHY: UPF0761 membrane protein | 10,144 | −0.9 | 0.1 | 0.1 | 0.9 | 0.1 | 0.2 | 0.2 |
| YQAA: Inner membrane protein | 2187 | −0.9 | 0.1 | 0.3 | 1.0 | 0.2 | 0.4 | 0.3 |
| YHID: Uncharacterized protein | 4416 | −0.7 | 0.2 | 0.2 | 1.0 | 0.2 | 0.1 | 0.2 |
| YLOU: Uncharacterized protein | 3738 | −0.7 | 0.4 | 0.5 | 0.9 | 0.3 | 0.3 | 0.8 |
| YGDD: UPF0382 inner membrane protein | 3025 | −0.6 | 0.5 | 0.3 | 1.0 | 0.3 | 0.2 | 0.4 |
| YJCH: Inner membrane protein | 1307 | −0.5 | 0.3 | 0.2 | 0.8 | 0.4 | 0.2 | 0.2 |
| YFCA: UPF0721 transmembrane protein | 18,846 | 0.0 | 0.1 | 0.1 | 1.0 | 0.2 | 0.3 | 0.2 |
| YOHJ: Putative effector of murein hydrolase | 3608 | 0.4 | 0.2 | 0.3 | 0.5 | 0.3 | 0.4 | 0.6 |
| YHHQ: Inner membrane protein | 3398 | 0.7 | 0.4 | 0.2 | 1.0 | 0.4 | 0.3 | 0.2 |
| YAII: UPF0178 protein | 3144 | 0.8 | 0.6 | 0.7 | 1.1 | 0.5 | 0.5 | 0.4 |
| YUXK: Predicted thiol-disulfide oxidoreductase | 1881 | 1.3 | 0.3 | 0.3 | 1.1 | 0.3 | 0.3 | 0.5 |
| YICC: UPF0701 protein | 4293 | 1.5 | 0.1 | 0.1 | 1.0 | 0.1 | 0.1 | 0.1 |
| YEIH: UPF0324 inner membrane protein | 4863 | 4.2 | 0.3 | 0.2 | 0.9 | 0.4 | 0.5 | 0.7 |
| RARD: Putative chloramphenical resistance permease | 74,507 | 6.3 | 0.1 | 0.1 | 1.0 | 0.3 | 0.3 | 0.2 |
-
Column 2: number of unique proteins in family; Column 3: negative log10 of E-value of top match found in HHsearch profile–profile search of PDB; Columns 4–6: fit to predicted contacts (Rc value) of best fitting of top 10 HHsearch hits (column 4), of best fitting of top 10 SPARKS-X hits (column 5), and Rosetta model (column 6). Native structures have Rc values ranging from 0.7 to 1.2 (Figure 17). Columns 7–9: structural similarity (TMscore) between Rosetta model (M) and best fitting HHsearch model, between Rosetta model and best fitting SPARKS-X model, and between best fitting HHsearch and SPARKS-X models. The Rosetta models fit the contacts as well as expected for native structures and are very different from best fitting HHsearch and SPARKS-X models. For RARD and YEIH, the HHsearch E-value is less than 1E-04, the recommended threshold for inclusion in the same Pfam clan (Xu and Dunbrack, 2012), but the fit with the co-evolutionary contacts was very poor (Rc < 0.3); these two cases are discussed in sections below. For FLIL and YAII, the Rc values for very weak HHSearch and SPARKS-X hits (E-values worse than 0.1) are greater than 0.6 but the contacts constrain only a portion of the structure.
Table 3
Comparison of methods on CASP11 targets
| BAKER* | Jones-UCL* | Evfold-web server | ||||
|---|---|---|---|---|---|---|
| Targets | Cα-RMSD | GDT-TS | Cα-RMSD | GDT_TS | Cα-RMSD | GDT-TS |
| T0806 | 3.6 | 60.4 | 6.8 | 34.3 | 8.2 | 30.0 |
| T0824 | 4.2 | 55.3 | 9.2 | 41.4 | 8.1 | 32.6 |
-
*
Full-length Cα-RMSD and GDT-TS calculation based on the best of five models submitted to CASP11 from BAKER and Jones-UCL groups. For Evfold, the values for best of 50 models generated by the web server are reported, sorted by full-length Cα-RMSD. For the comparison, the alignments used during CASP11 were provided as input to the Evfold-web server, with PLM option selected. For T0824, the minimal number of sequence limit was set to 0 to allow Evfold-web server to run. PLM, pseudo-likelihood.
Table 4
Comparison of methods on transmembrane benchmark set
| BAKER | Evfold-web server | |||
|---|---|---|---|---|
| Targets | Cα-RMSD | GDT-TS | Cα-RMSD | GDT-TS |
| 4HE8_H | 4.9 | 54.5 | 5.3 | 50.3 |
| 1SOR_A (aquaporin) | 2.7 | 69.7 | 6.1 | 44.5 |
| 4Q2E_A | 5.4 | 45.6 | 12.9 | 21.7 |
| 4HTT_A | 3.9 | 60.6 | 6.4 | 41.8 |
| 4P6V_E | 5.0 | 56.6 | 7.4 | 31.8 |
| 4J72_A | 6.6 | 67.1 | 12.9 | 33.8 |
| 3V5U_A | 3.9 | 58.8 | 4.6 | 47.1 |
| 4PGS_A | 3.5 | 66.3 | 4.6 | 48.1 |
| 4QTN_A | 4.2 | 59.6 | 4.9 | 51.4 |
| 4OD4_A | 3.9 | 55.6 | 4.1 | 53.4 |
| 4O6M_A | 4.1 | 64.0 | 11.2 | 33.0 |
-
The Cα-RMSD and GDT-TS calculations are over the full sequence. For Evfold web server results, we report the best Cα-RMSD of 50 models returned. For the comparison, the alignments we used were provided as input to the Evfold-web server, and the pseudo-likelihood method was selected.
Additional files
-
Supplementary file 1
Detailed table containing all 131 large protein families. Also the complete list of protein coding genes from E. coli (ECOLI), B. subtilis (BACSU) Halobacterium salinarum (HALSA), and Sulfolobus solfataricus (SULSO) along with number of sequences are provided.
- https://doi.org/10.7554/eLife.09248.027
-
Supplementary file 2
Detailed table containing 58 proteins modeled.
- https://doi.org/10.7554/eLife.09248.028
-
Supplementary file 3
Table of 10,440 PDB chains used in the study and the number of sequences for each.
- https://doi.org/10.7554/eLife.09248.029
Download links
A two-part list of links to download the article, or parts of the article, in various formats.
Downloads (link to download the article as PDF)
Open citations (links to open the citations from this article in various online reference manager services)
Cite this article (links to download the citations from this article in formats compatible with various reference manager tools)
Large-scale determination of previously unsolved protein structures using evolutionary information
eLife 4:e09248.
https://doi.org/10.7554/eLife.09248


