The preRC protein ORCA organizes heterochromatin by assembling histone H3 lysine 9 methyltransferases on chromatin
- University of Illinois at Urbana-Champaign, United States
- Centre National de la Recherche Scientifique, France
- Howard Hughes Medical Institute, University of Illinois at Urbana-Champaign, United States
Figures
Figure 1 with 1 supplement

ORCA interacts with multiple repressive histone lysine methyltransferases.
(A) a IP using origin recognition complex-associated (ORCA) Ab from U2OS cells. ORCA, G9a, and Suv39H1 were analyzed by immunoblotting (IB). b IP using G9a Ab from U2OS cells. Endogenous ORCA, G9a, and Suv39H1 were analyzed by IB. (B) a and b Immunoprecipitation (IP) using ORCA antibody (Ab) from cells expressing T7-ORCA and different Flag-KMTs: a H3K9 KMTs G9a; b H3K9 KMT GLP and Suv39H1. (C) U2OS 2-6-3 CLTon cells co-transfected with individual YFP-LacI-KMTs and CFP-ORCA. Inset represents 150% magnification of the boxed region. (D) IP using T7 ab from cells co-expressing T7-ORCA and; a Flag-G9a or b Flag-Suv39H1 in the presence (+) or absence (−) of EtBr. (E) Direct interaction of ORCA and a G9a or b SUV39H1 using purified proteins. ‘*’ denotes cross reacting band and ‘ ’denotes ORCA.
Figure 1—figure supplement 1
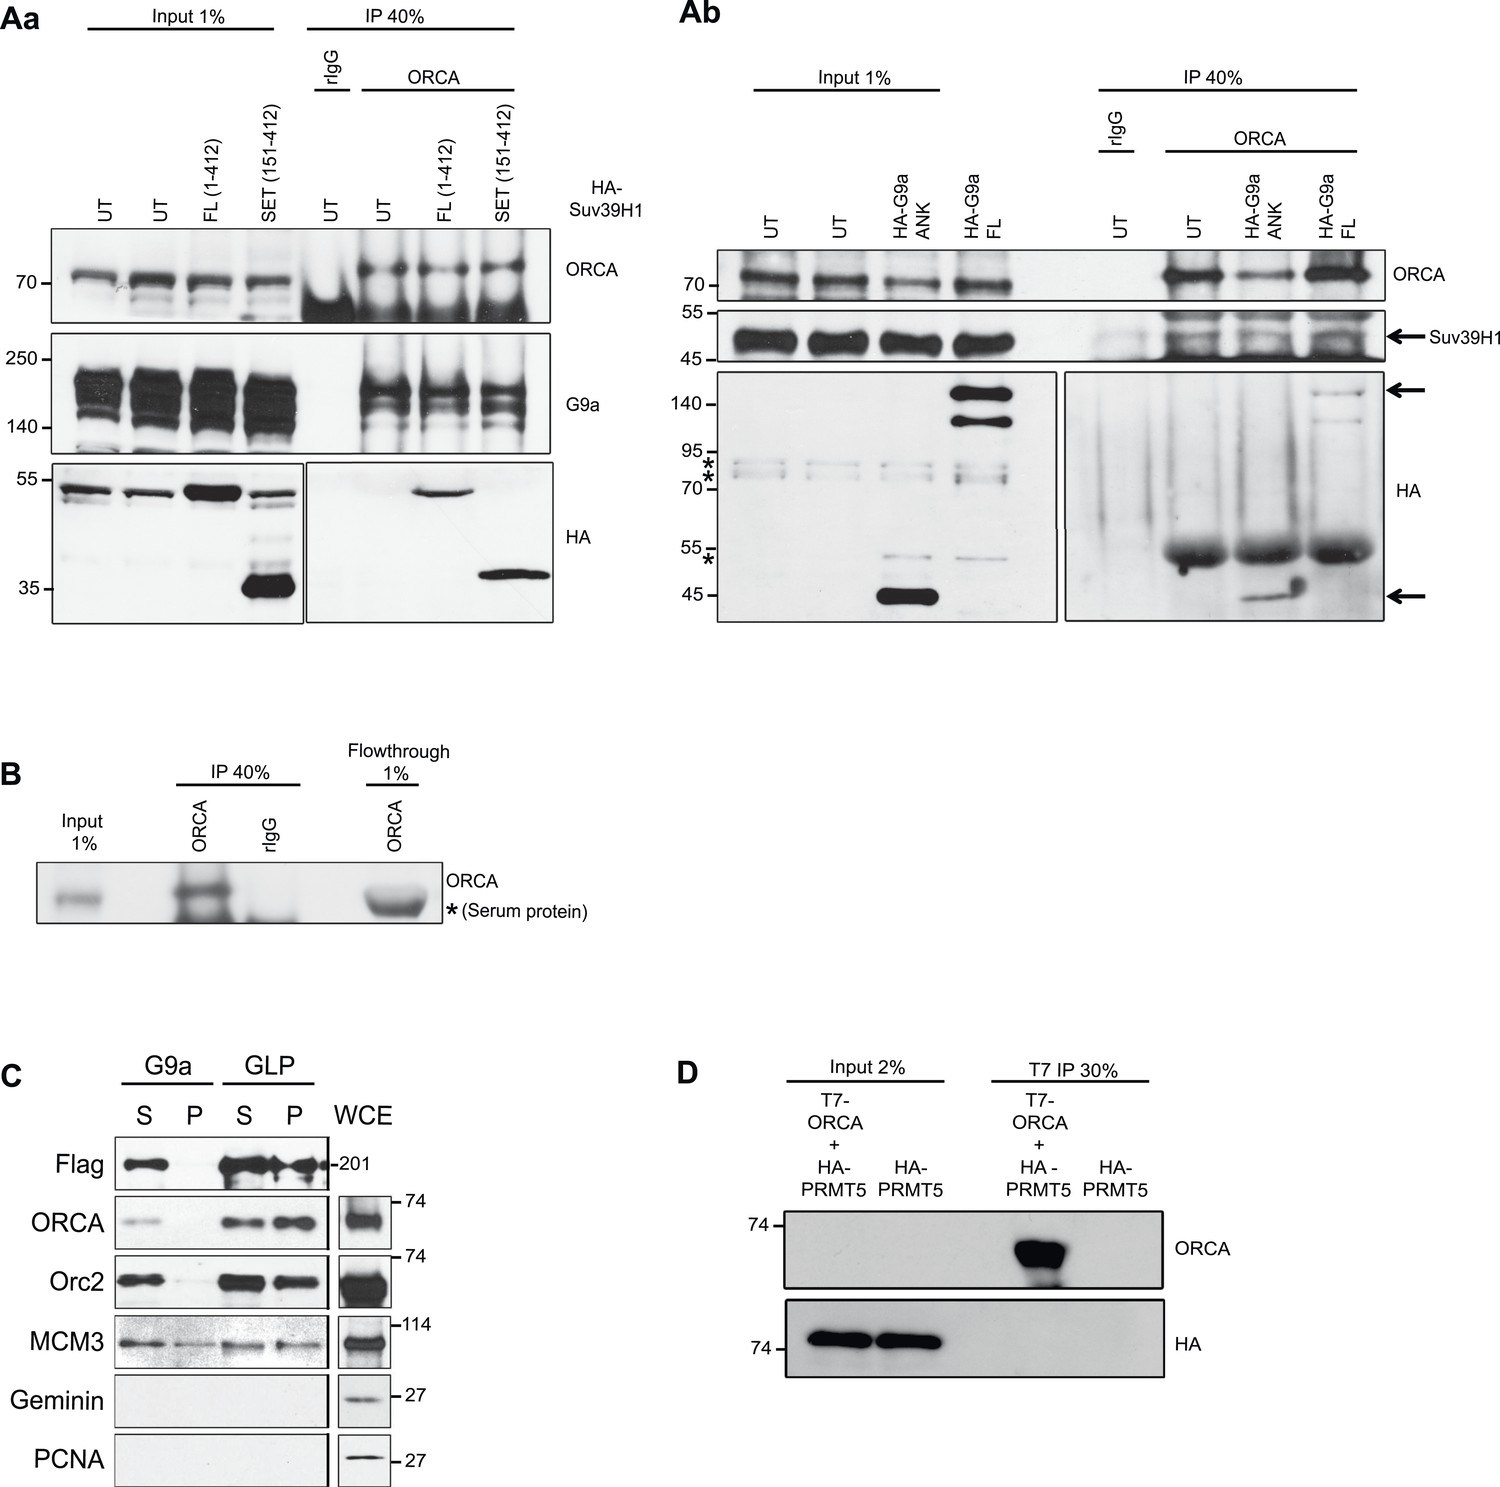
Interaction of ORCA with histone methyltransferases.
(A) a. Endogenous ORCA IP in untransfected (UT) U2OS and in U2OS cells expressing full length (FL) or the SET domain of HA-Suv39H1. b. Endogenous ORCA IP in untransfected (UT) U2OS and in U2OS cells expressing full length (FL) or the Ankyrin (ANK) domain of HA-G9a. (B) IB showing efficient depletion of endogenous ORCA from U2OS nuclear extract by using ORCA antibody. (C) Flag IP in Hela cells stably expressing Flag-HA-G9a or Flag-HA-GLP. IPs were conducted using nuclear soluble (S) or chromatin (P) fractions and endogenous ORCA, ORC2, MCM3, Geminin and PCNA were analyzed by IB. (D) ORCA does not interact with arginine methyltransferase (RMT) PRMT5. IP using T7 Ab from cells expressing T7-ORCA and HA-PRMT5.
Figure 2 with 1 supplement
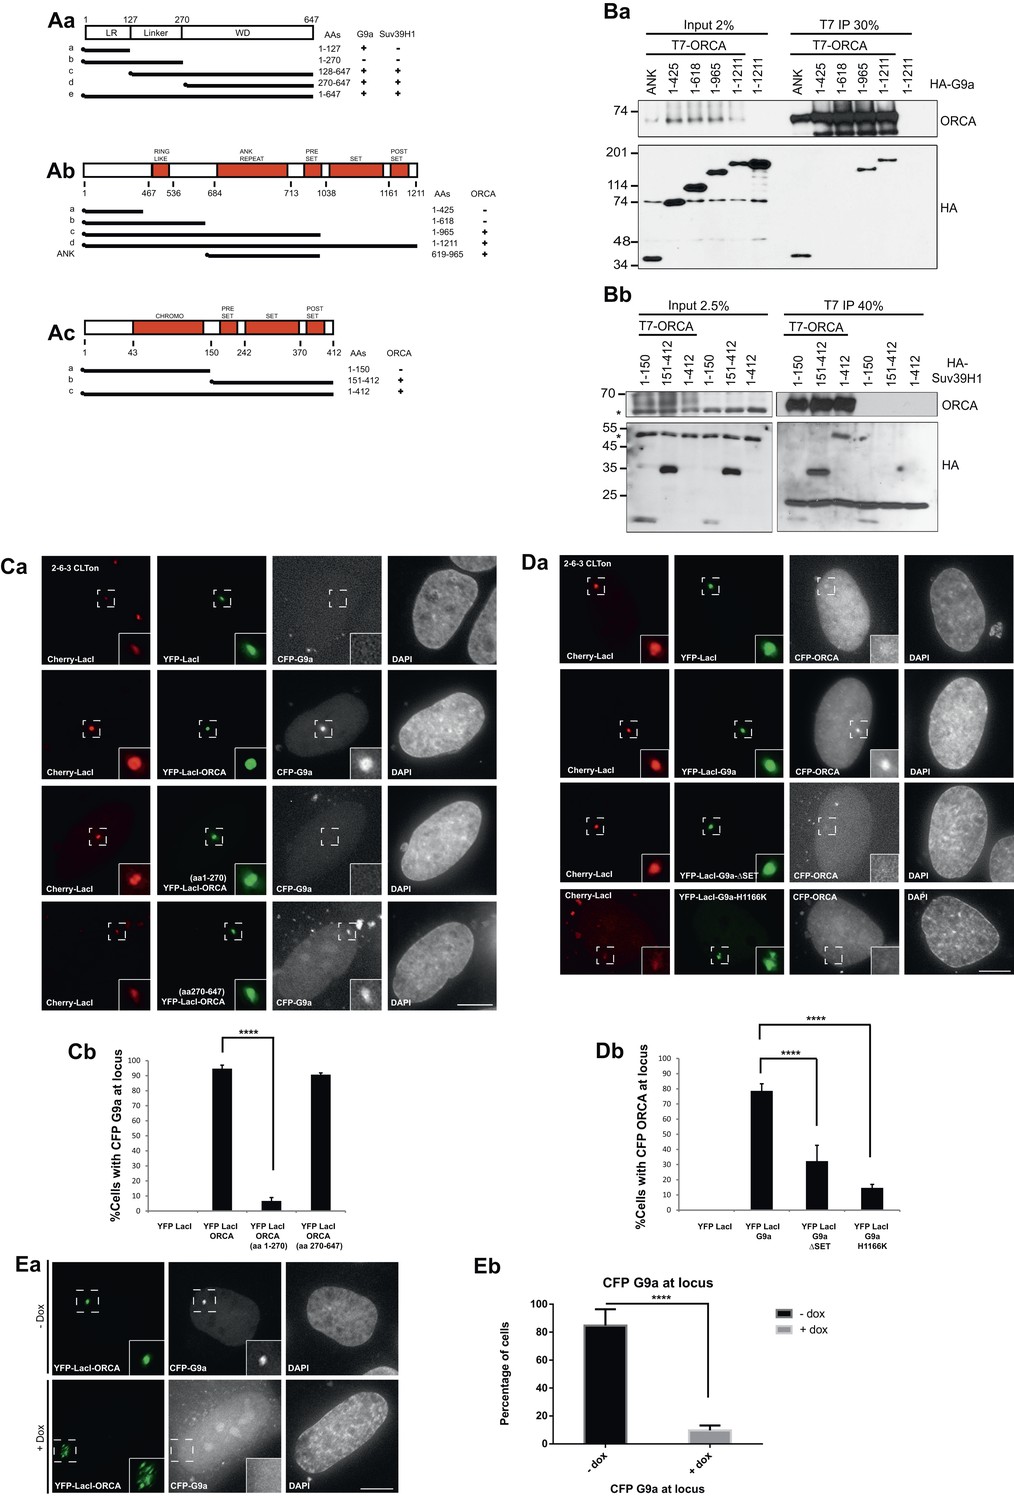
ORCA associates with KMTs in a chromatin context-dependent manner.
(A) a Schematic representation of various truncation mutants of ORCA containing a T7-epitope on the N-terminus. The specific domains that can associate with G9a and Suv39H1 based on–IB (Figure 2—figure supplement 1Aa,Ab) is depicted as ‘+’. b Schematic representation of various truncation mutants of G9a containing a HA-epitope on the N-terminus. The interaction domain of G9a that interacts with ORCA (Figure 2Ba) is denoted as ‘+’. c Schematic representation of various truncation mutants of Suv39H1 containing a HA-epitope on the N-terminus. The interaction domain of Suv39H1 that interacts with ORCA (Figure 2Bb) is denoted as ‘+’. (B) a IP in U2OS cells expressing various HA-G9a mutants and T7-G9a using T7 Ab and analysis by T7 and HA-IB. b IP in U2OS cells expressing various HA-Suv39H1 mutants and T7-G9a using T7 Ab and analysis by T7 and HA IB. ‘*’ denotes the cross-reacting band. (C) a Cells co-transfected with YFP-LacI (negative control) and CFP-G9a or YFP-LacI-ORCA or the truncation mutants along with CFP G9a in CLTon cells. b The % of cells with CFP-G9a recruited to the locus is plotted. (D) a Cells co-transfected with YFP-LacI (negative control) and CFP-ORCA or YFP-LacI-G9a wild type and the mutants, which are catalytically inactive along with CFP-ORCA in CLTon cells. b The % of cells with CFP-ORCA recruited to the locus. (E) a U2OS 2-6-3 CLTon cells co-transfected with YFP-LacI-ORCA and CFP-G9a in the presence and absence of doxycycline. b The % of cells with CFP-G9a recruited to the locus in both conditions. Scale bars equal 10 μm. Inset represents 150% magnification of the boxed region. Error bars represent s.d., n = 3. ****p < 0.0001.
Figure 2—figure supplement 1
WD domain of ORCA interacts with H3K9 KMTs.
(A) a. IP in U2OS cells expressing various T7-ORCA mutants and FLAG-G9a using T7 Ab and analysis of G9a by IB. b. IP in U2OS cells expressing various T7-ORCA mutants and HA-Suv39H1 using T7 Ab and analysis of Suv39H1 by IB. (B) a. Cells were co-transfected CFP-LacI and YFP-G9a (negative control) or CFP-LacI-ORCA along with YFP-G9a truncation mutants. b. The % of cells with YFP-G9a truncation mutants recruited to the locus is plotted. Note the significant reduction in the recruitment of YFP-G9a (aa1-965), the mutant lacking the SET domain, to the locus. Error bars represent s.d, n=3. ****p<0.0001. span=""> <0.0001. span="">(C) Localization of H3K9me2 in CLTon cells in cells with (+) or without (-) the expression of YFP-LacI-G9a. Note the H3K9me2 accumulation in YFP-LacI-G9a expressing cells. (D) IP in U2OS cells expressing T7-ORCA and GFP-G9a-full length and ∆SET mutant using T7 Ab and analysis of GFP-G9a by IB. (E) Localization in CLTon cells expressing CFP-LacI-ORCA, of HP1α and YFP-CDK9, at heterochromatic (-Dox) as well as decondensed locus (+Dox). the expression of YFP-LacI-G9a. Note the loss of HP1α and accumulation of YFP-CDK9 upon decondensation of the locus. Scale bar, 10µm. Inset represents 150% magnification of the boxed region. (F) Tethering of YFP-LacI-Orc3 recruits Orc2 at heterochromatic (-Dox) as well as decondensed locus (+Dox). Scale bar, 10µm. Inset represents 150% magnification of the boxed region.
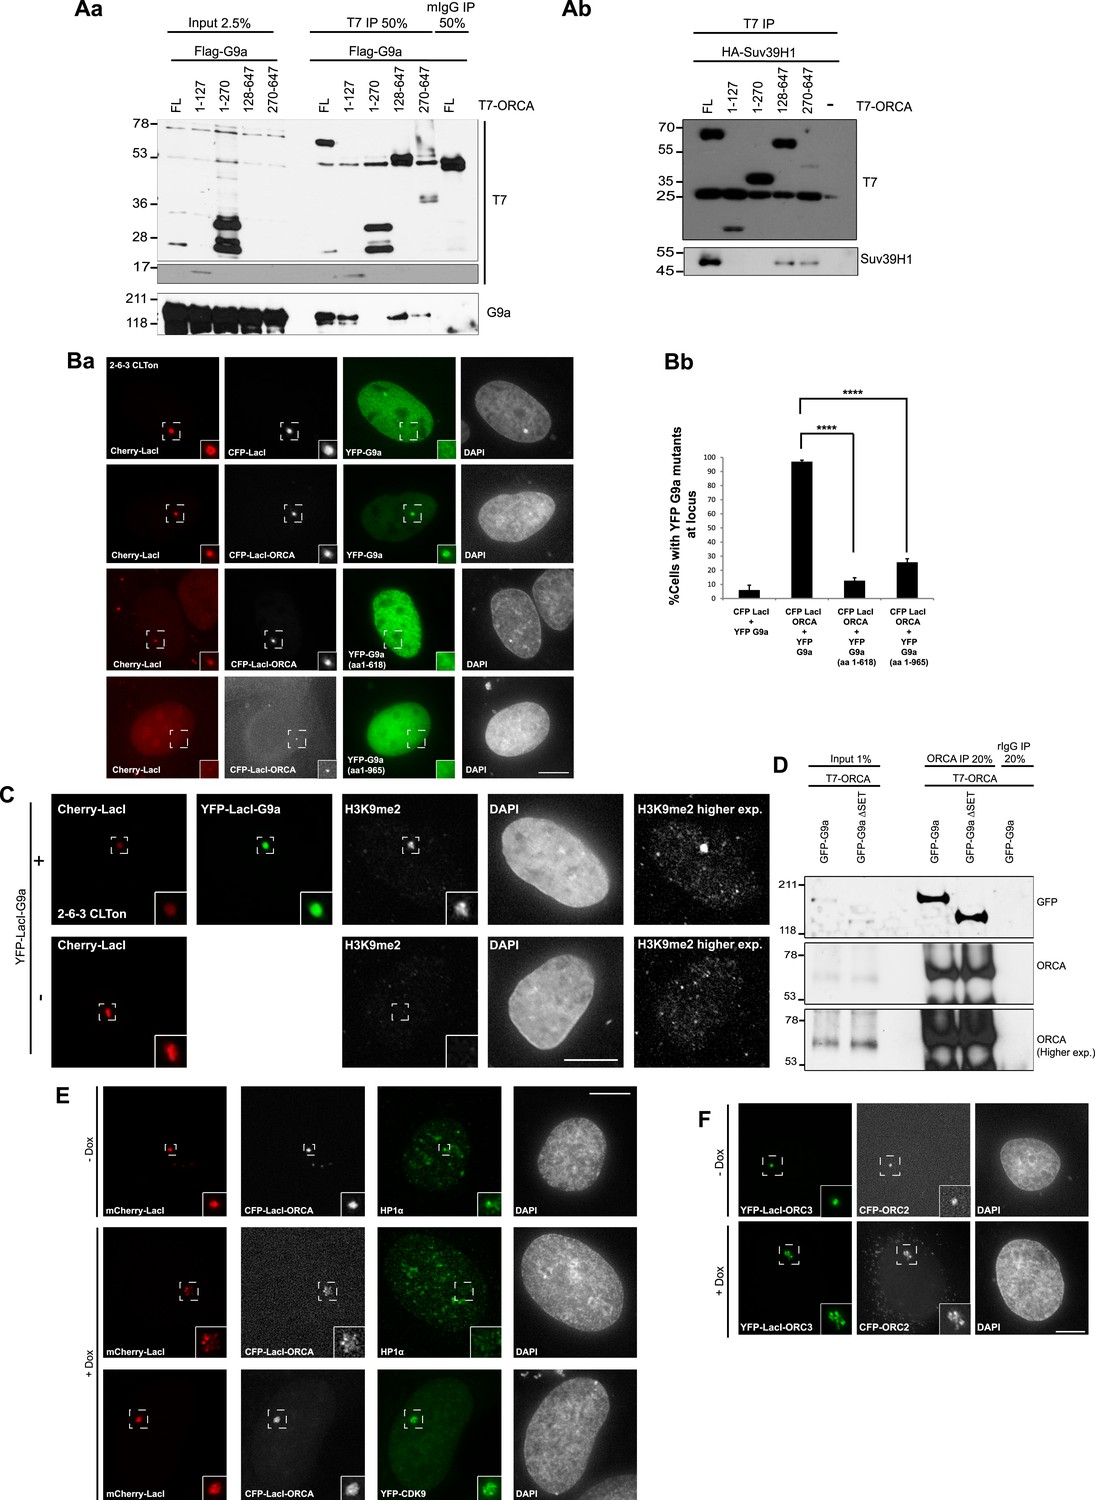
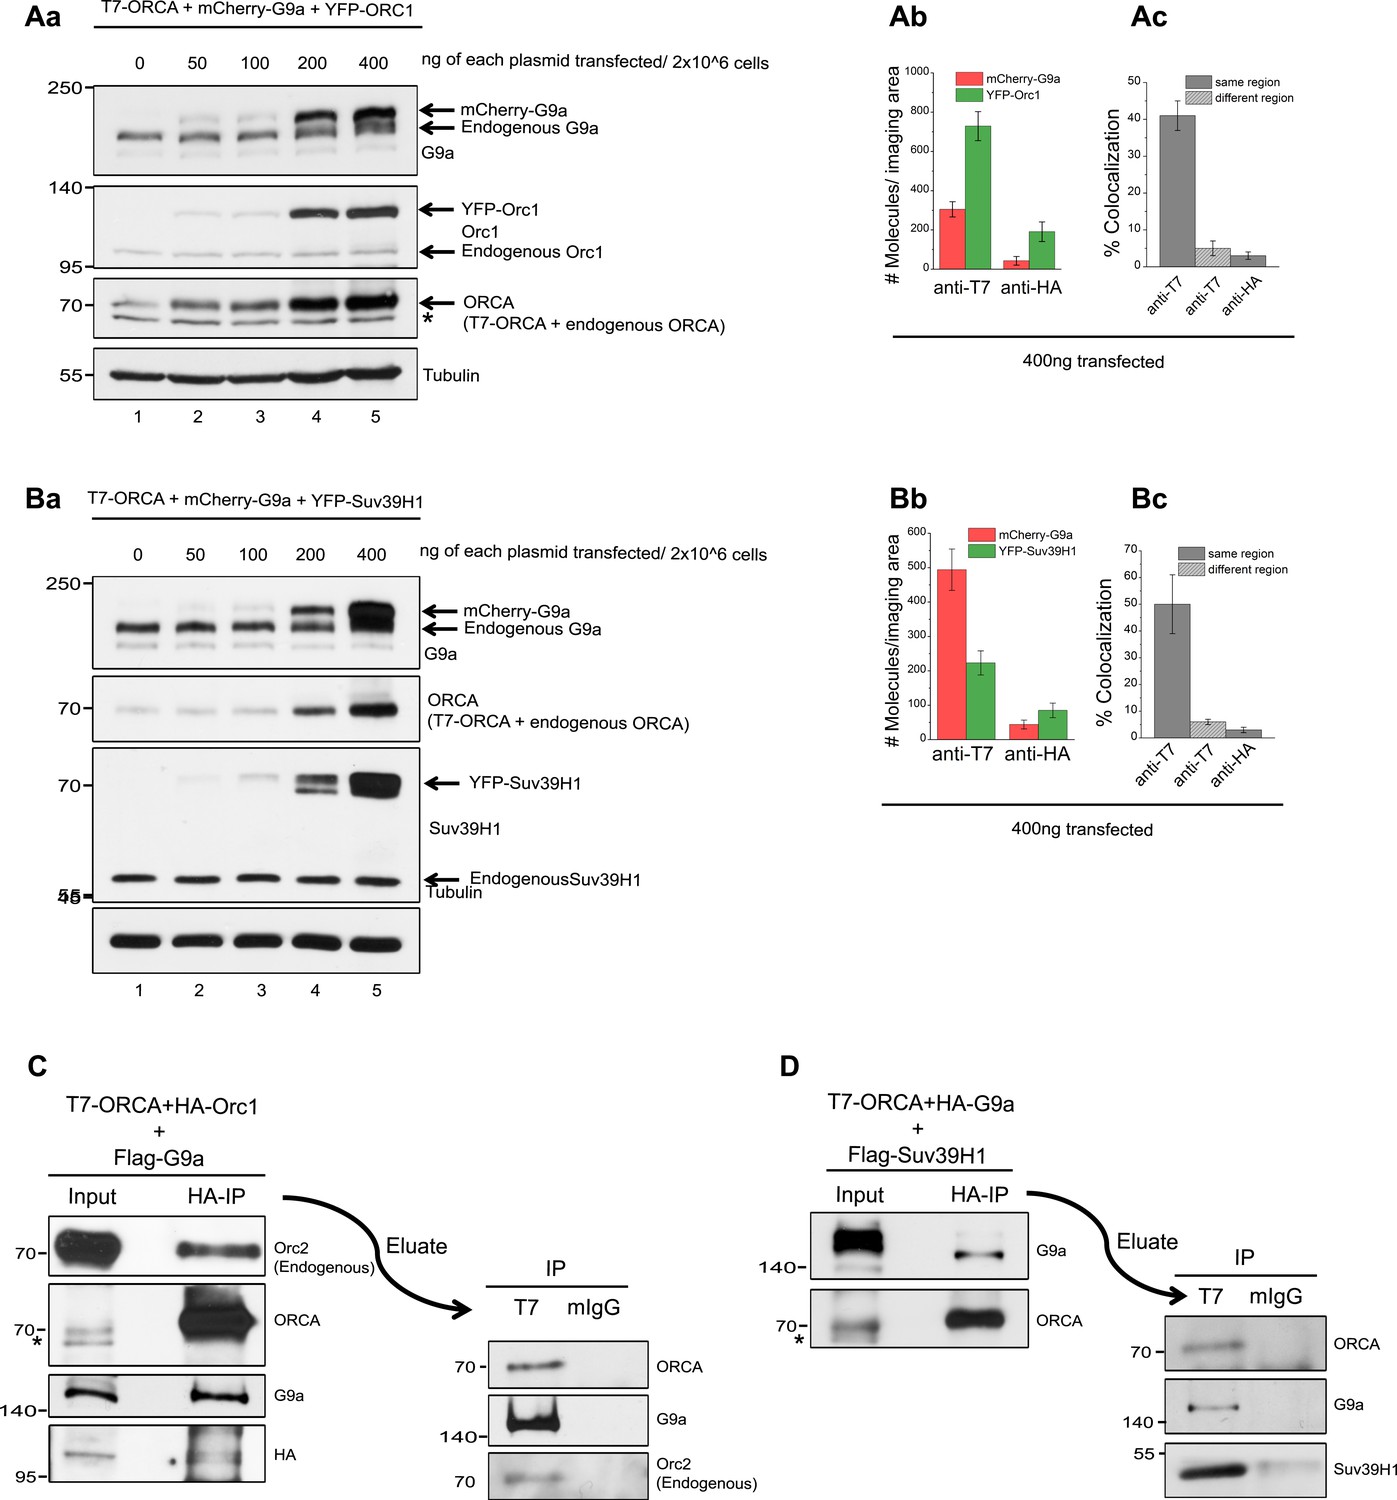
Figure 3 with 1 supplement

ORCA and H3K9 KMTs exist in one multimeric complex.
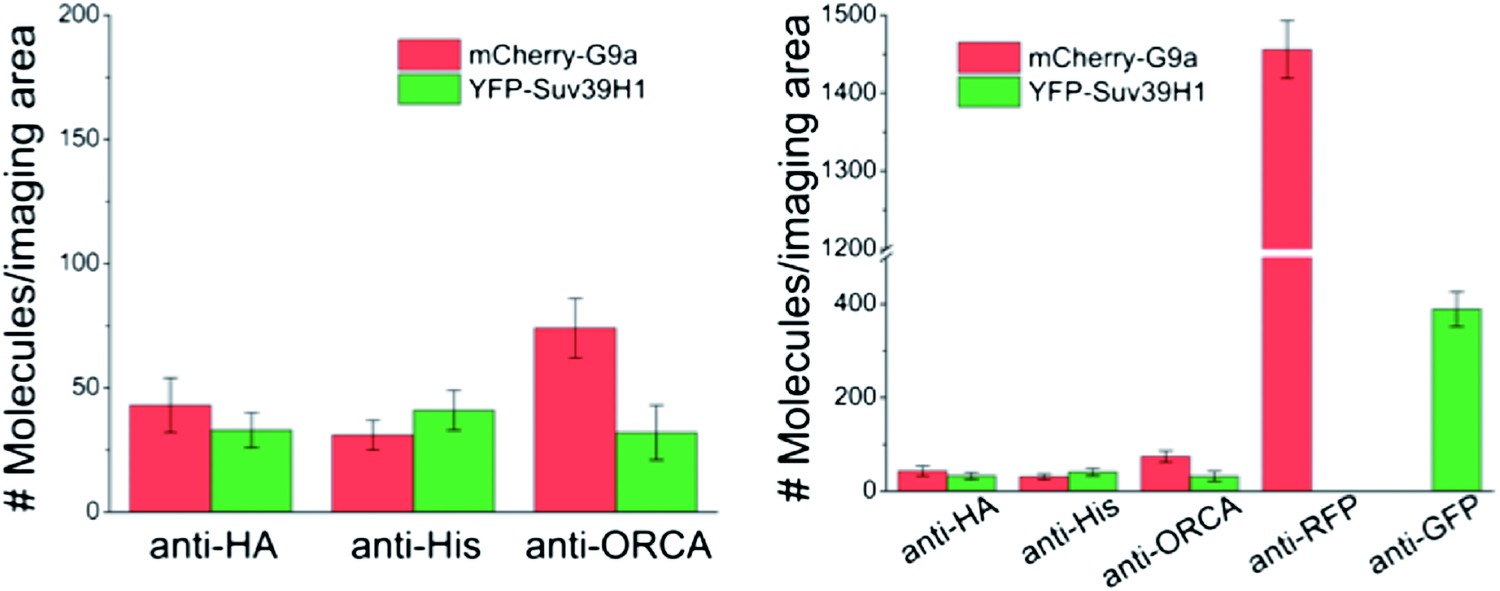
(A) a Representative single-molecule fluorescence time trajectories for YFP-tagged molecules that exhibit one-step, two-step, and three-step photobleaching. b Key to the schematics of the SiMPull assay. (B) a and b Schematic and total internal reflection fluorescence (TIRF) images of YFP molecules pulled down from U2OS cell lysates expressing T7-ORCA and YFP-ORC1 using biotinylated T7 Ab. The same lysate incubated with biotinylated HA Ab served as the control. c Average number of YFP fluorescent molecules per imaging area (5000 μm2). d Photobleaching step distribution for YFP-ORC1 bound to T7-ORCA. Note 1:1 ratio of ORCA to Orc1. e Intensity profiles of the YFP-ORC1 molecules bound to T7-ORCA. (C) a–d ORCA-G9a pulldown. Shown are YFP molecules pulled down from U2OS cell lysates expressing T7-ORCA and YFP-G9a. Note 1:1 or 1:2 ratio of ORCA to G9a. e Intensity profiles of YFP-G9a molecules bound to T7-ORCA. (D) a–d ORCA-Suv39H1 pulldown. Shown are YFP molecules pulled down from U2OS cell lysates expressing T7-ORCA and YFP-Suv39H1. Note 1:1 ratio of ORCA to Suv39H1. e Intensity profiles of YFP-Suv39H1 molecules bound to T7-ORCA. (E) a–c Determination of ORCA complexes containing both ORC and G9a by SiMPull and colocalization analyses. a Schematic of YFP and mCherry molecules pulled down from U2OS cell lysates expressing T7-ORCA, YFP-ORC1, and mCherry-G9a using biotinylated T7 Ab. The same lysate incubated with biotinylated HA Ab served as the control. b Average number of YFP and mCherry fluorescent molecules per imaging area (5000 μm2). c Note 39 ± 5% overlap. Transfection condition used as indicated in Figure 3—figure supplement 1Aa, lane3. (F) a–c Determination of ORCA complexes containing multiple H3K9 KMTs by SiMPull and colocalization analyses. a Schematic of YFP and mCherry molecules pulled down from U2OS cell lysates expressing T7-ORCA, YFP-Suv39H1, and mCherry-G9a using biotinylated T7 Ab. The same lysate incubated with biotinylated HA Ab served as the control. b Average number of YFP and mCherry fluorescent molecules per imaging area (5000 μm2). c Note 55 ± 7% colocalization. Transfection condition used as indicated in Figure 3—figure supplement 1Ba, lane3. Scale bars, 10 μm. Error bars represent s.d., n = 3.
Figure 3—figure supplement 1
ORC-ORCA-H3K9 KMTs exist in a single complex.
(A) a.Titration of T7-ORCA, mCherry-G9a and YFP-ORC1 plasmids in U2OS cells. b-c. Determination of ORCA complexes containing both ORC and G9a by SiMPull and colocalization analyses. b. Average number of YFP and mCherry fluorescent molecules per imaging area (5000µm2). c. Note 41±4% overlap. Transfection condition used as indicated in Fig. S3Aa, lane 5. (B) a.Titration of T7-ORCA, mCherry-G9a and YFP-Suv39H1 plasmids in U2OS cells. b-c. Determination of ORCA complexes containing both G9a and Suv39H1 by SiMPull and colocalization analyses. b. Average number of YFP and mCherry fluorescent molecules per imaging area (5000µm2). c. Note 46±11% overlap. Transfection condition used as indicated in Fig. S3Ba, lane 5. (C) Sequential IP of HA-Orc1 followed by T7-ORCA from U2OS extracts expressing T7-ORCA, HA-Orc1 and Flag-G9a. IB of G9a corroborated the presence of Orc1-ORCA-G9a triple complex. (D) Sequential IP of HA-G9a followed by T7-ORCA from U2OS extracts expressing T7-ORCA, HA-G9a and Flag-Suv39H1. IB of Suv39H1 corroborated the presence of G9a-ORCA-Suv39H1 triple complex.
Figure 4 with 1 supplement

ORCA binds and regulates levels of H3K9 methylation.
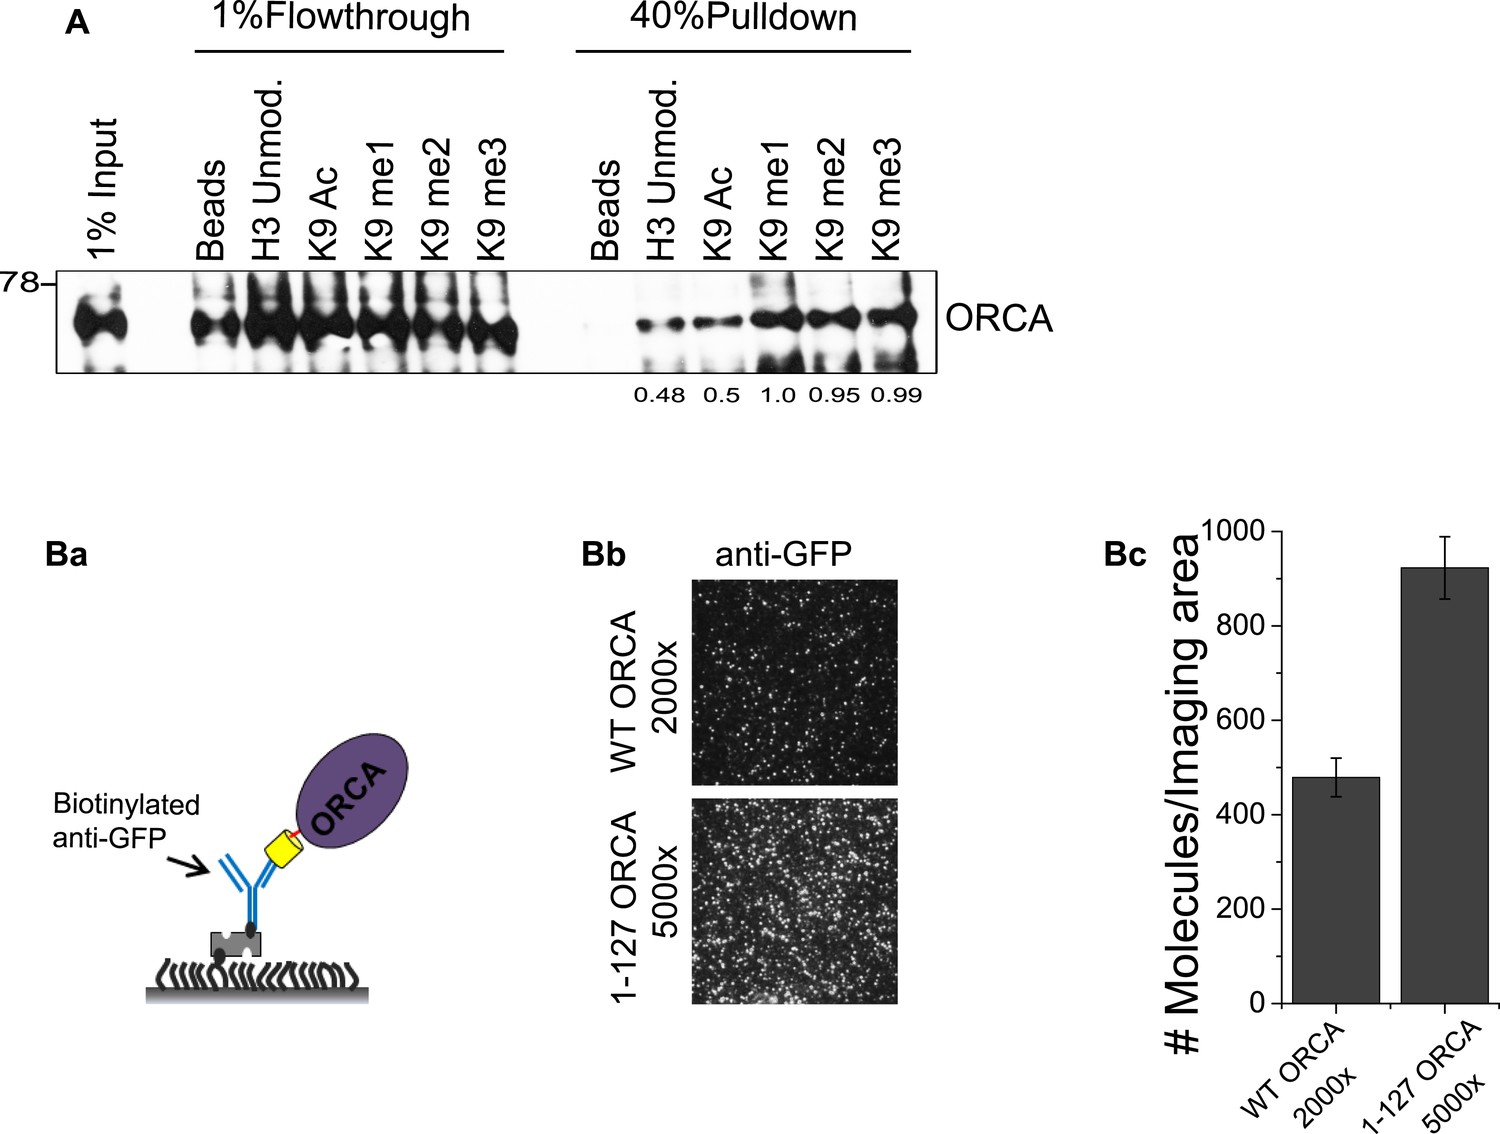
(A) a Schematic of experimental setup for peptide pulldown and analyses by SiMPull. b TIRF images of YFP-ORCA WT and 1–127 aa pulled down by H3K9 modified peptides. Note that the YFP-ORCA WT and 1–127 aa truncation mutant expressing lysates were diluted so that the concentration of the overexpressed proteins is comparable (200 and 800 times, respectively for WT and 1–127 aa). c Average number of fluorescent molecules per imaging area. Scale bars, 10 μm. (B) a Chromatin fractionation in ORCA-depleted U2OS cells followed by IB analysis of H3K9me2 and me3. b Chromatin fractionation in ORCA-depleted diploid fibroblasts, WI38 followed by IB analysis of H3K9me2 and me3. Splicing factor, SRSF1 is shown as a loading control. Error bars represent s.d., n = 3. S and S2-cytosolic; S3-nuclear soluble and MNase sensitive; P: nuclear; P3: nuclear insoluble and MNase resistant fraction.
Figure 4—figure supplement 1
ORCA binding to H3K9 peptides.
(A) Peptide pulldown using baculovirally purified His-ORCA and N-terminal histone H3 peptides, which are unmodified or acetylated, mono-, di- or tri methylated at K9. (B) a. Schematic of GFP pulldown to quantitate YFP-ORCA expression levels by SiMPull. b. TIRF images of YFP-ORCA WT and aa1-127 pulled down by GFP Ab. Note that the aa1-127 truncation mutant is much more highly expressed compared to WT (5000 fold dilution of aa1-127 shows greater number of molecules/imaging area compared to 2000 fold diluted WT. c. Quantitation of average number of fluorescent molecules (YFP-ORCA WT and aa1-127) per imaging area in (Bb).
Figure 5 with 1 supplement
Loss of ORCA leads to significant reduction in H3K9 methylation.
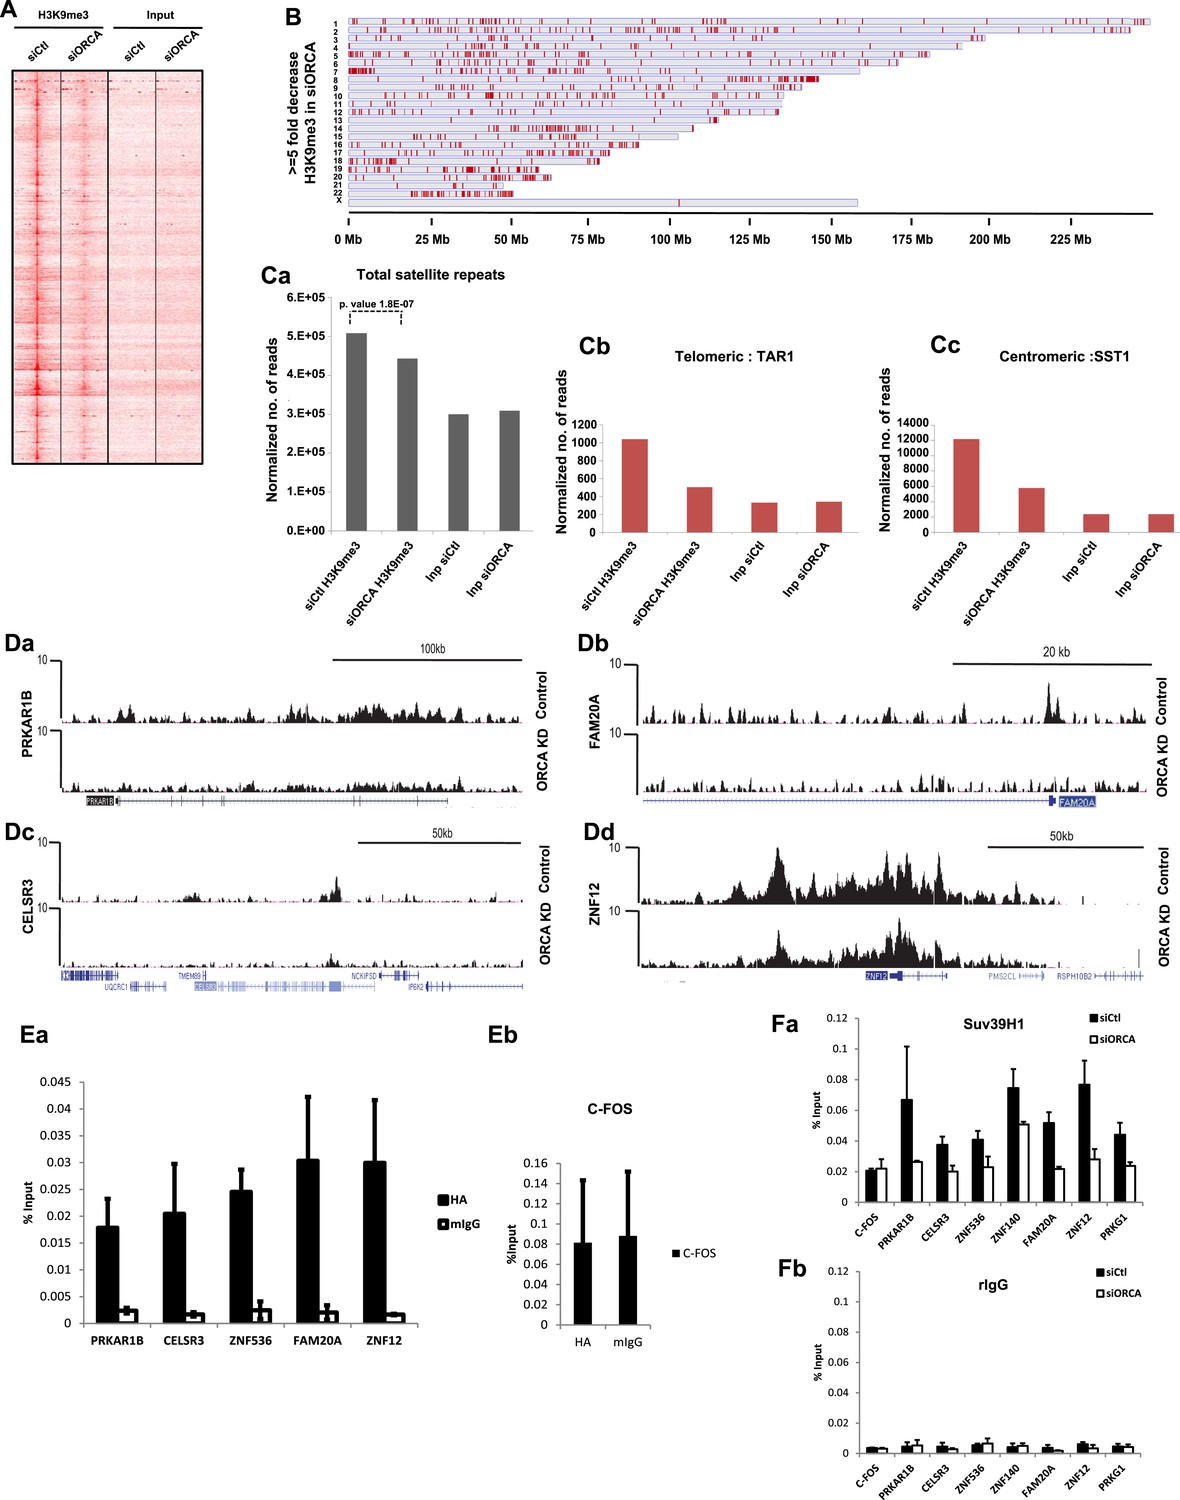
(A) Model-based analysis of ChIP-sequencing (MACS) 1.4 peaks analysis of H3K9me3 ChIP-seq in control and ORCA-depleted cells. (B) Regions showing greater than fivefold decrease in H3K9me3 upon ORCA knockdown (KD) plotted along the length of the chromosomes in which they reside. (C) a Normalized number of reads of repetitive sequences in control and ORCA KD H3K9me3 ChIP-seq. Normalized number of reads of-b Telomeric repetitive sequences and c Centromeric repetitive sequences in control and ORCA KD H3K9me3 ChIP-seq. (D) a–d Representative regions showing significant decrease in reads in H3K9me3 ChIP on ORCA KD compared to the control. (E) a HA-ORCA ChIP at H3K9me3-target sites and (b) C-FOS. (F) a Suv39H1 ChIP and b IgG ChIP at regions showing decrease in H3K9me3. Error bars represent s.d., n = 3. C-FOS is shown as negative control.
Figure 5—figure supplement 1
ORCA depletion causes changes in chromatin architecture.
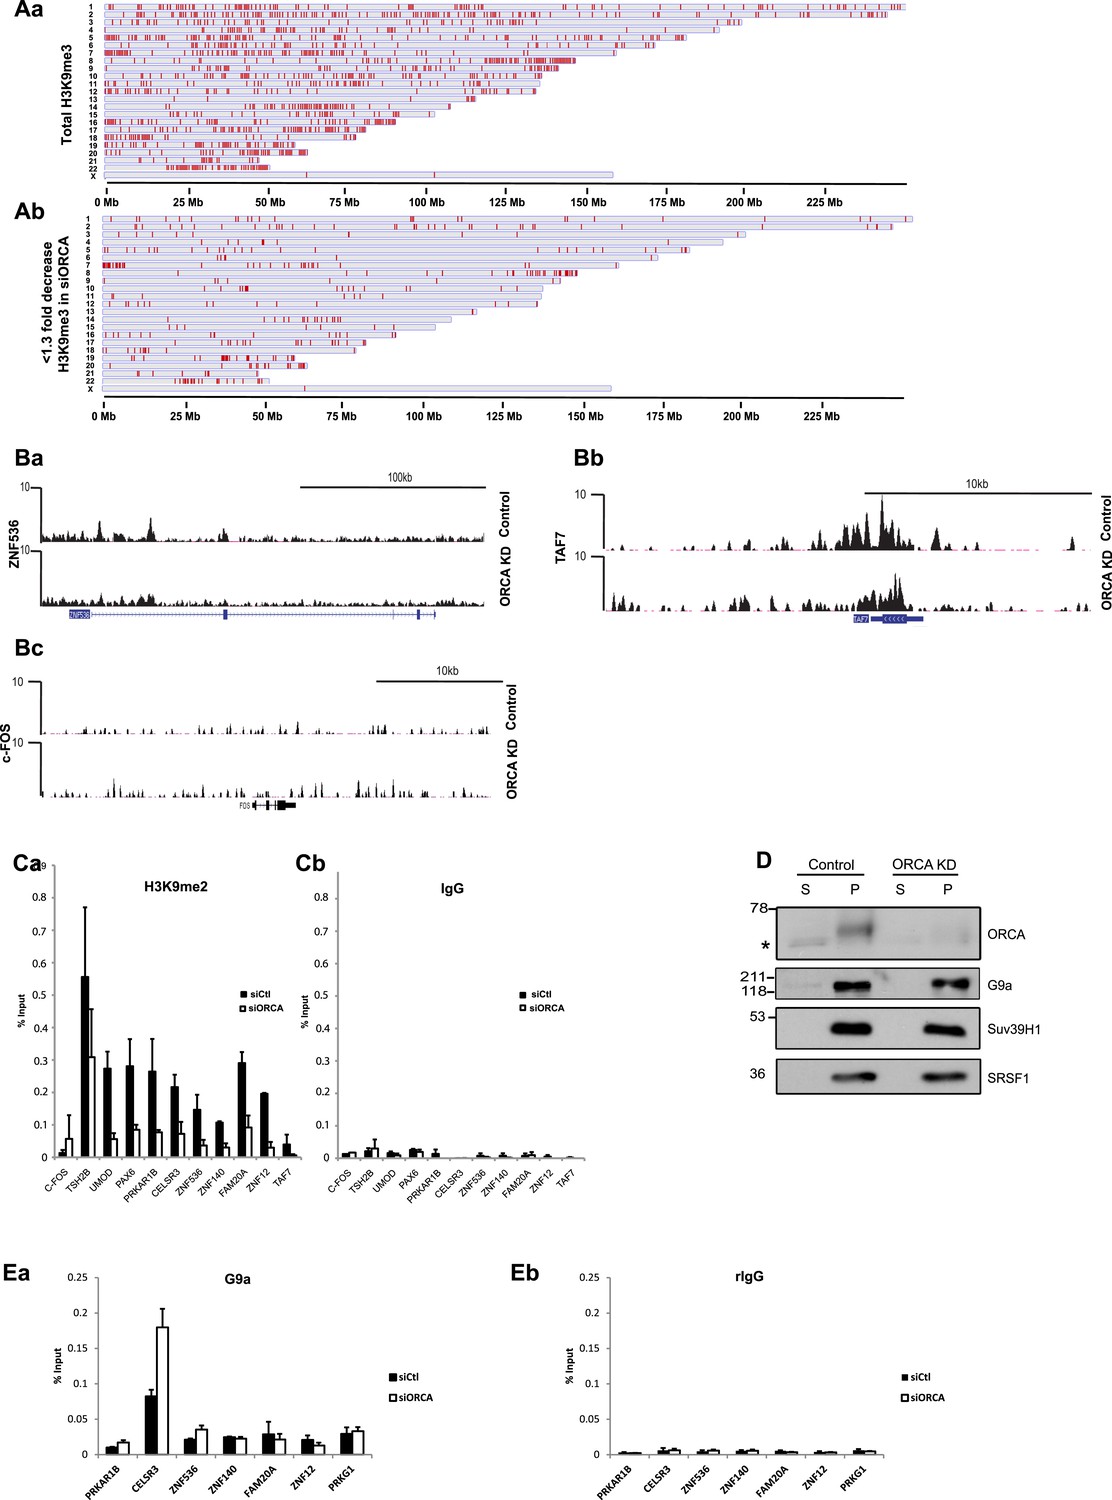
(A) a. Regions with H3K9me3 peaks detected by ChIP-seq plotted along the length of the chromosomes in which they reside. Chromosome scale indicated at the bottom of the chromosomes. b. Regions showing less than 1.3 fold decreases in H3K9me3 upon ORCA knockdown plotted along the length of the chromosomes in which they reside. Chromosome scale is indicated at the bottom of the chromosomes. (B) a-c. Representative regions showing significant decrease in the reads in H3K9me3 ChIP on ORCA knockdown. c-FOS, a region which doesn’t show decrease in H3K9me3 is also shown. (C) a-b. H3K9me2 ChIP at regions showing decrease in H3K9me3. (D) Chromatin fractionation in ORCA depleted U2OS cells and G9a and Suv39H1 IB analyses. SRSF1, a splicing factor, was used as loading control. (E) a. G9a ChIP and b. IgG ChIP at regions showing alterations in H3K9me2 and me3. Error bars represent s.d, n=3.
Figure 6
ORCA is a scaffold for G9a-Suv39H1 complexes.
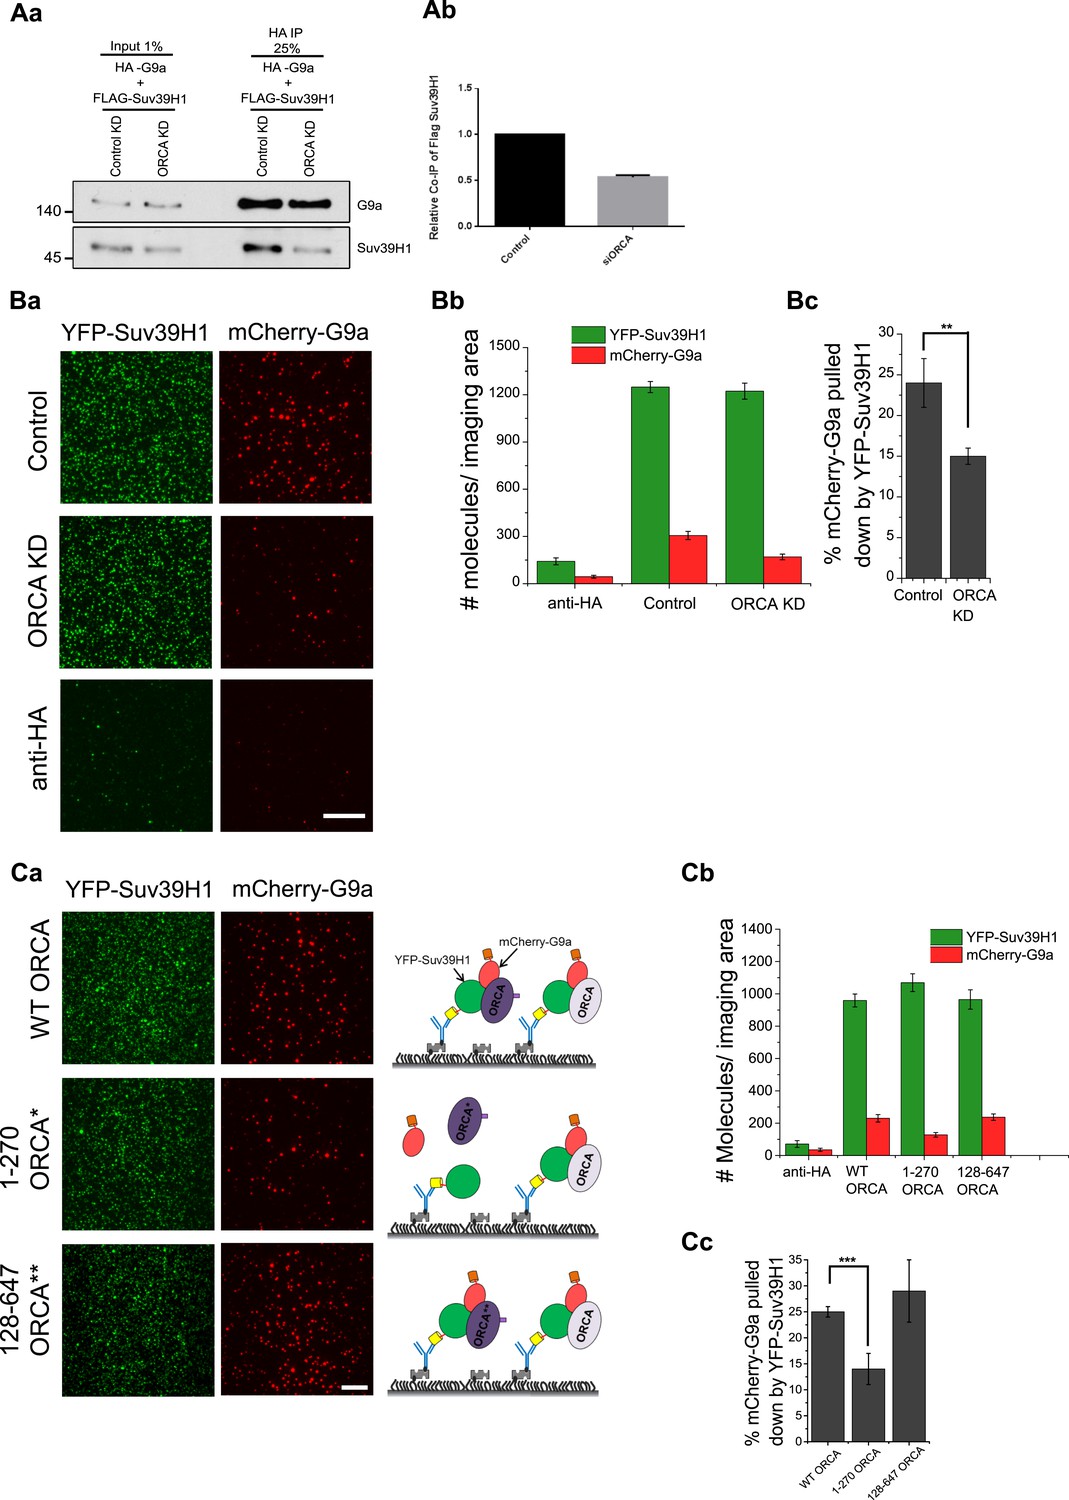
(A) a–b HA-IP in control and ORCA-depleted U2OS cells co-expressing with HA-G9a and Flag-Suv39H1. (B) a TIRF images of GFP SiMPull in control and ORCA-depleted U2OS cells co-transfected with YFP-Suv39H1 and mCherry-G9a. The same lysates incubated with biotinylated HA Ab served as the control. b Average number of YFP fluorescent molecules per imaging area (5000 μm2). c The % of mCherry-G9a pulled down by YFP Suv39H1 in control and ORCA KD. (C) a TIRF images of GFP SiMPull in U2OS cells transiently transfected with YFP-Suv39H1, mCherry-G9a, and T7-ORCA full-length or truncation mutant 1–270 or 128–647. The same lysates incubated with biotinylated HA Ab served as the control. b Average number of YFP fluorescent molecules per imaging area (5000 μm2). c The % of mCherry-G9a pulled down by YFP-Suv39H1. The % of mCherry-G9a pulled down by YFP-Suv39H1 in WT-ORCA is 25 ± 1%; 1–270 ORCA is 14 ± 3%; and 128–647 ORCA is 29 ± 6%. Scale bars, 20 μm. Error bars represent s.d., n = 3. **p < 0.01, ***p < 0.001.
Figure 7 with 1 supplement
Loss of ORCA causes defects in heterochromatin organization.
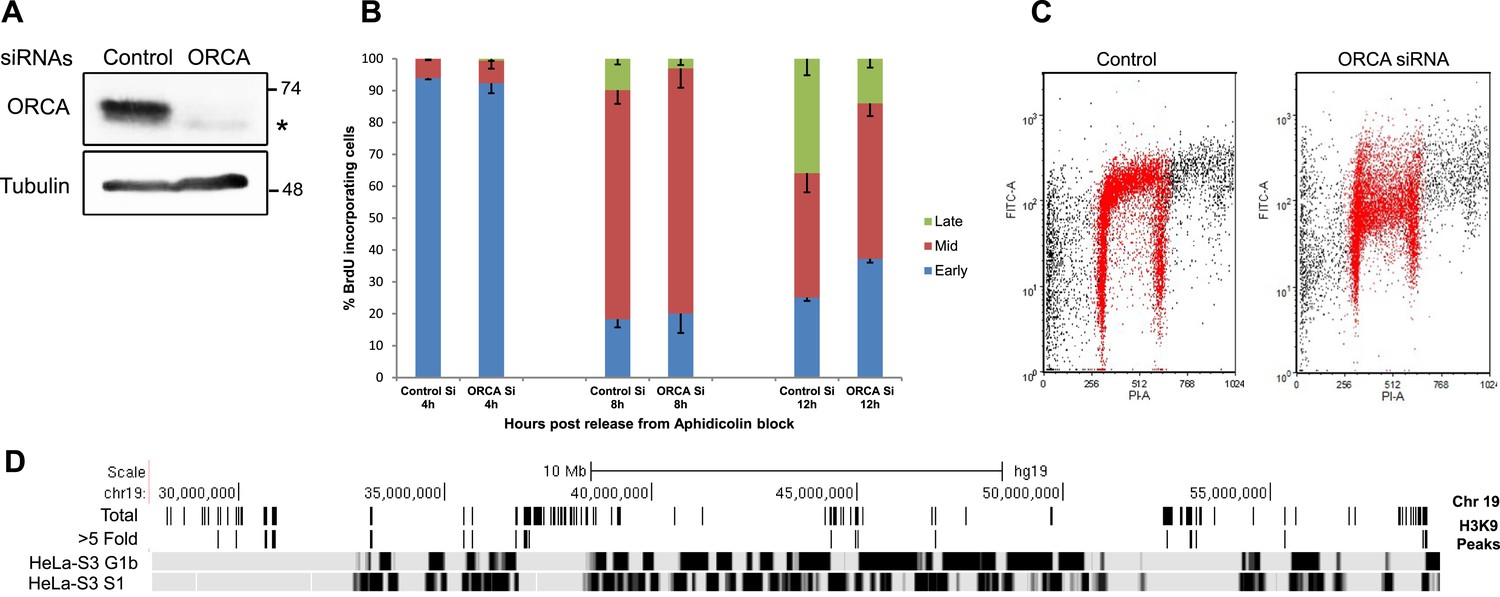
(A) IB showing efficient siRNA-mediated KD of ORCA. (B) Distribution of S-phase cells displaying early, mid, and late replication patterns in control and ORCA KD cells. Error bars represent s.d., n = 3 independent experiments with 500 BrdU positive cells scored in each. (C) BrdU-PI flow cytometry of control and ORCA KD cells. (D) Replication timing of genomic regions that show reduced H3K9me3 upon ORCA KD. Gray bars represent late-replicating domains, and black bars denote early replicating domains. HeLa-S3 G1b and HeLa-S3 S1 are late G1 and early S cell cycle fractions that together represent the early replicating regions of the genome.
Figure 7—figure supplement 1
Depletion of ORCA alters the replication timing.
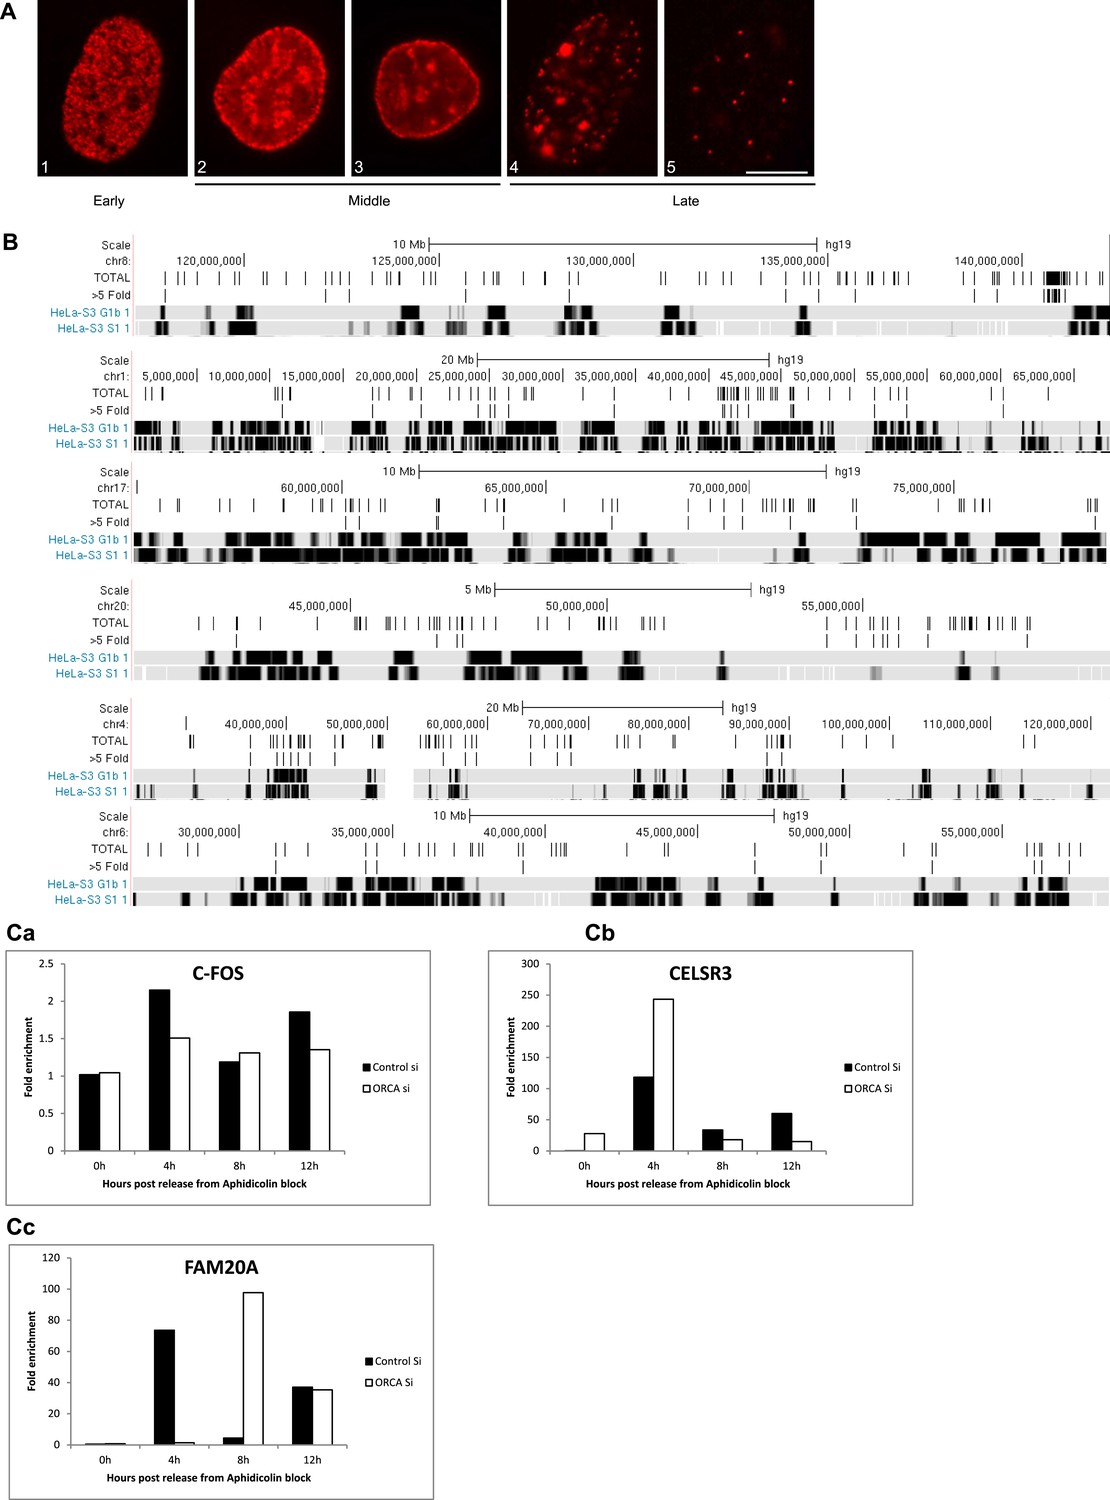
(A) Patterns of BrdU incorporation in S phase. Examples of early (1), mid (2 and 3) and late (4 and 5) S patterns. Scale bar, 10µm. (B) Replication timing of genomic regions that show reduced H3K9me3 upon ORCA knockdown. Gray bars represent late replicating domains and black bars denote early replicating domains. (C) BrdU ChIP in S phase in control and ORCA knockdown cells. Note the changes in replication timing of CELSR3 (b) and FAM20A (c) upon loss of ORCA. C-FOS locus is used as a control region whose replication timing remains unaffected upon loss of ORCA (a). Fold enrichment in the graph represents the % input of BrdU ChIP over % input of rIgG ChIP.
Figure 8 with 1 supplement
Heterochromatin organization role of ORCA is independent of its role in preRC assembly.
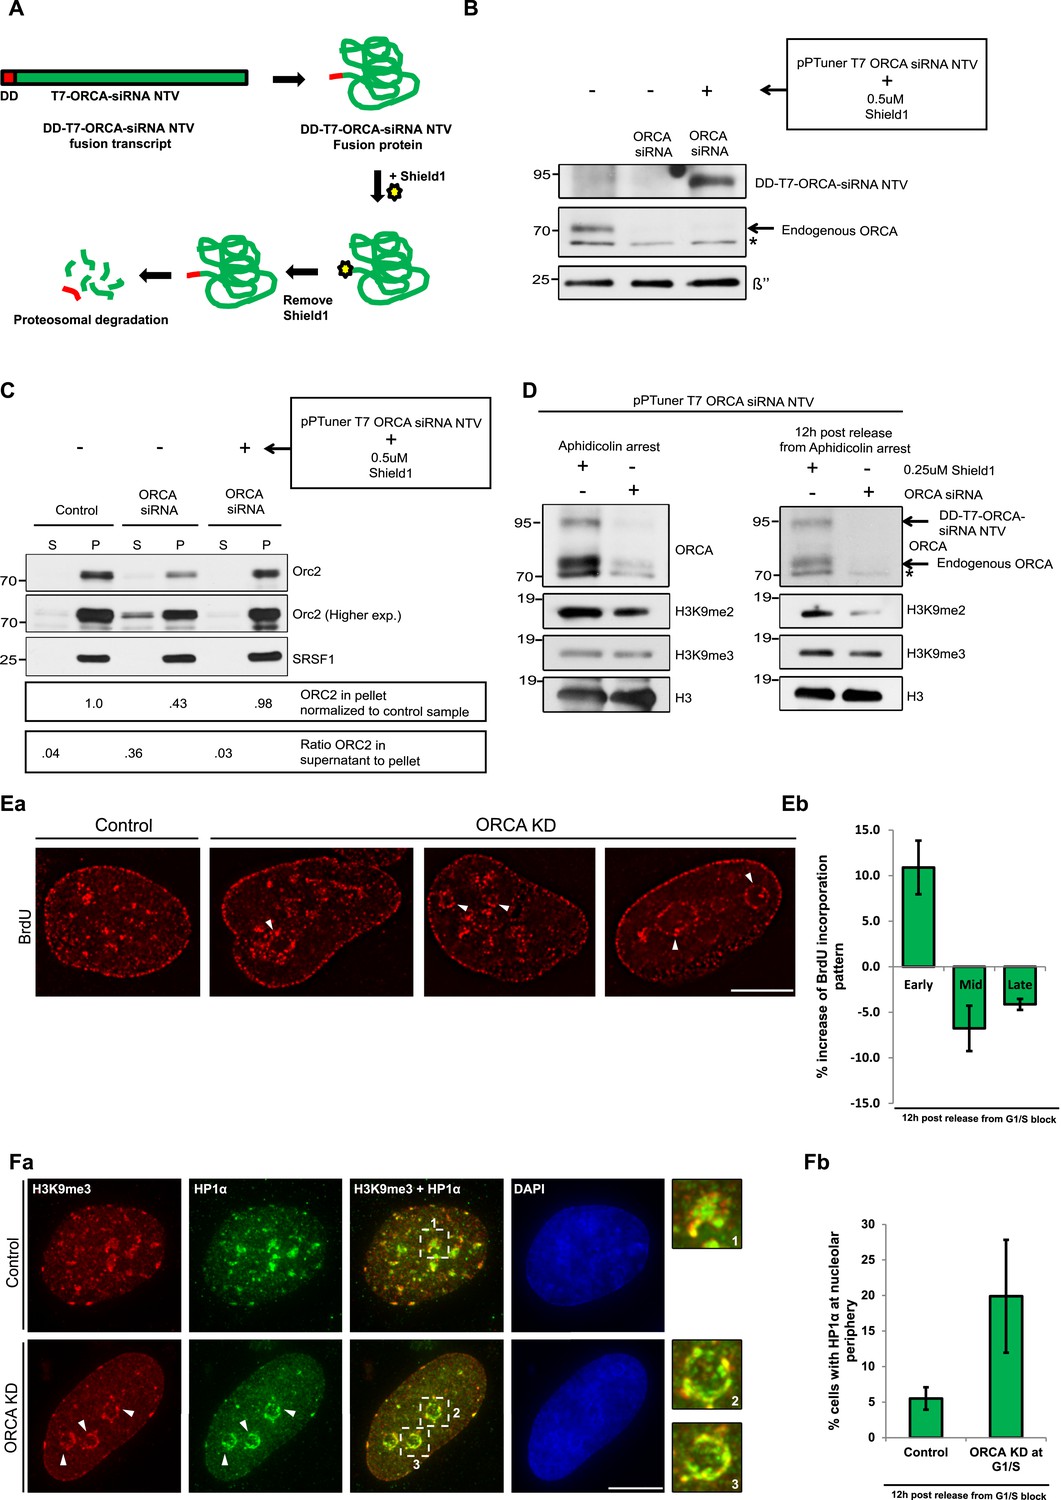
(A) Schematic of depletion of ORCA using the proteotuner system. (B) Western blotting showing the levels of endogenous and exogenous ORCA in the presence of control and ORCA siRNA. β′′, a nuclear speckle protein, serves as the loading control. Note that the DD-T7-ORCA-siRNA non-targetable version (NTV) is stabilized upon the addition of Shield1. (C) Chromatin fractionation and IB showing the levels of chromatin bound Orc2 in control and ORCA siRNA-treated cells (either in the absence or presence of exogenous ORCA). Note the reduction in chromatin bound Orc2 in the absence of ORCA and the rescue of its levels upon expression of exogenous ORCA. Also note the increase in the soluble pool of Orc2 in the absence of ORCA and the decrease of its levels upon expression of exogenous ORCA. Splicing factor, SRSF1 is shown as a loading control. (D) IB showing the levels of endogenous and exogenous ORCA at G1/S and 12 hr post-release from aphidicolin. H3 is used as loading control. (E) a–b Patterns of BrdU incorporation in control and ORCA-depleted cells in late S-phase. The white arrowheads indicate preferential incorporation of BrdU incorporation at perinucleolar regions upon loss of ORCA. Scale bar, 10 μm. b % increase in S-phase cells displaying early and % decrease of the mid and late replication patterns in ORCA-depleted cells compared to control cells. Error bars represent s.d., n = 3 independent experiments with ∼450 BrdU positive cells scored in each. (F) a H3K9me3 and HP1α immunofluorescence in control and ORCA-depleted cells. The white arrowheads indicate H3K9me3 and HP1α immunofluorescence at perinucleolar regions upon loss of ORCA. Representative regions in control and ORCA-depleted cells marked by white dotted squares (1, 2, and 3) are shown at 3× magnification on the right. Scale bar, 10 μm. b The % of cells with HP1α at nucleolar periphery in control and ORCA-depleted cells. Error bars represent s.d., n = 3.
Figure 8—figure supplement 1
BrdU incorporation preferentially at perinucleolar regions in cells lacking ORCA.
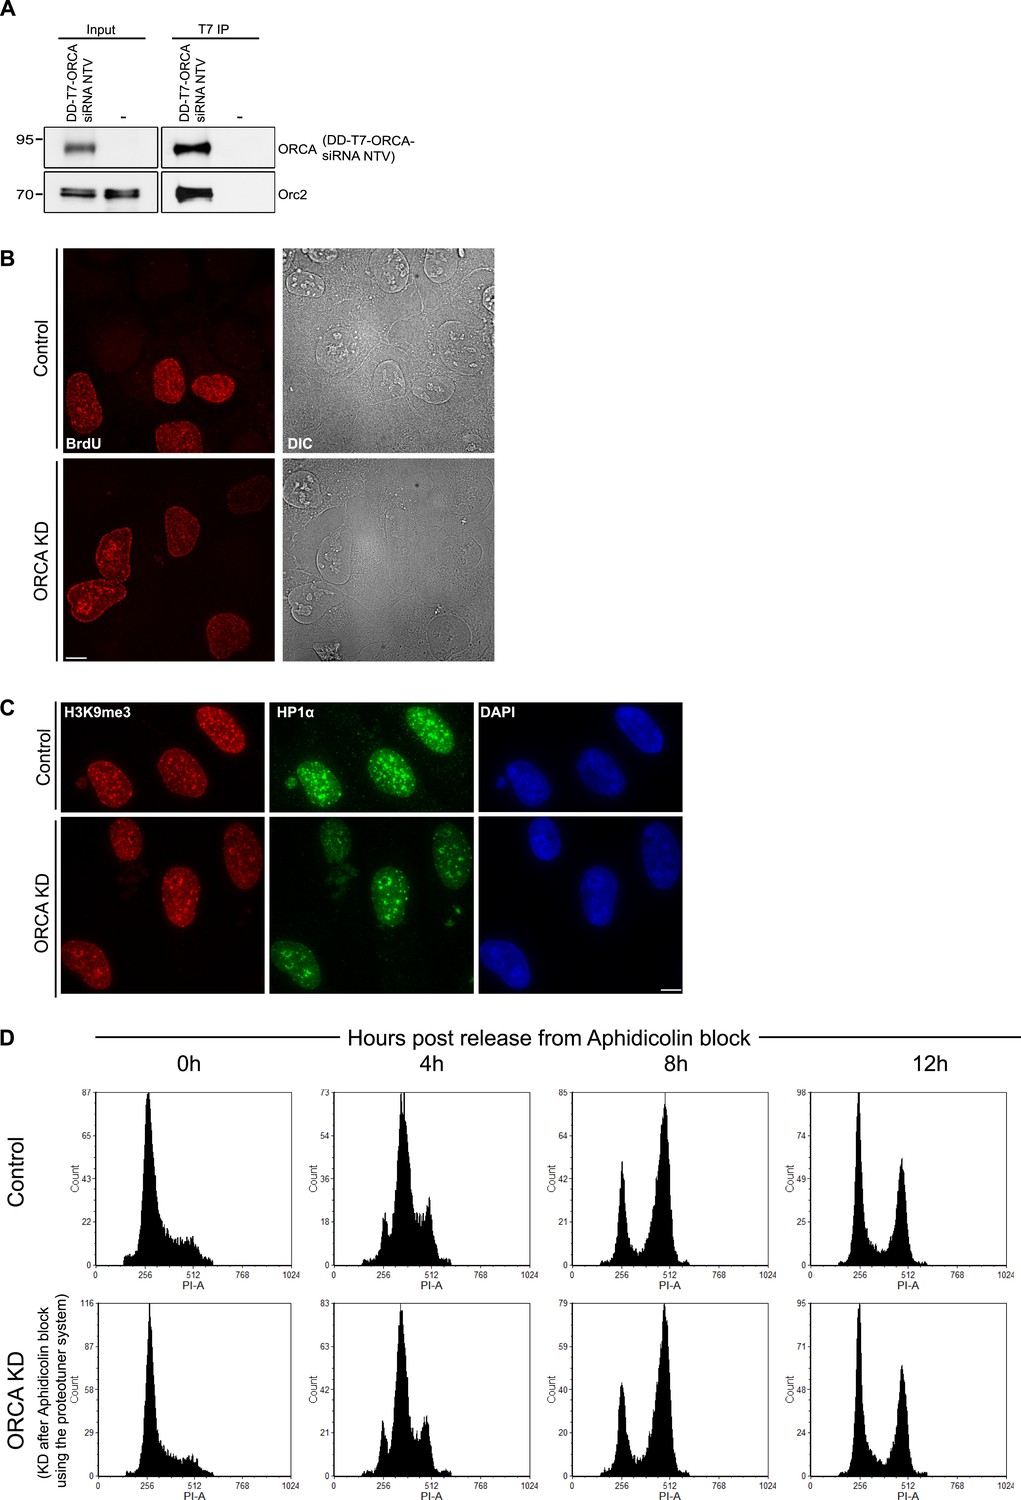
(A) IP of DD-T7-ORCA siRNA NTV from U2OS cells using T7 Ab. DD-T7-ORCA siRNA NTV and endogenous Orc were analyzed by IB. (B) Patterns of BrdU incorporation in control and ORCA depleted cells in late S phase. Scale bar, 10µm. (C) H3K9me3 and HP1α immunofluorescence in control and ORCA depleted cells. Scale bar, 10µm. (D) Flow cytometry of control and ORCA knockdown cells at 0, 4, 8 and 12h post release from Aphidicolin block.
Figure 9
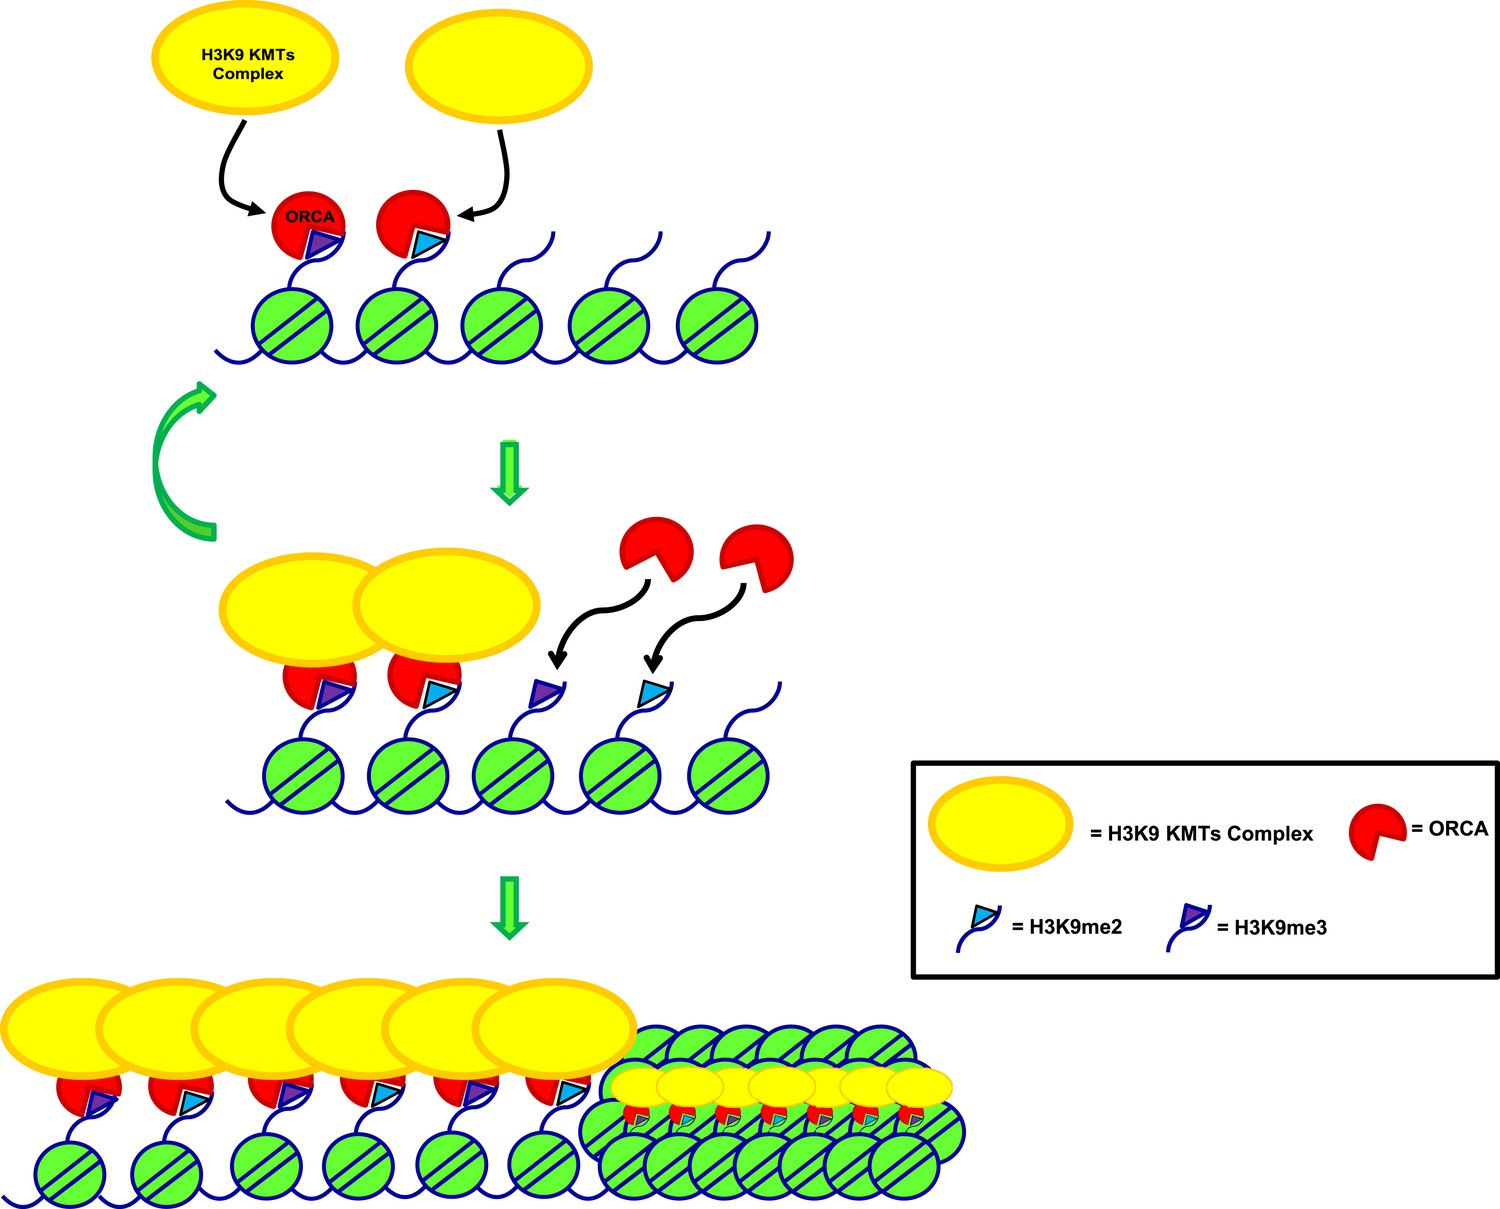
Model depicting the role of ORCA in organizing heterochromatin.
Model representing mode of regulation of heterochromatin by ORCA.
Author response image 1
Additional files
-
Supplementary file 1
H3K9me3 ChIP-seq peaks in control and ORCA-depleted samples.
- https://doi.org/10.7554/eLife.06496.019
-
Supplementary file 2
Primers used for validation of ChIP-seq. Our attempts on H3K9me2 ChIP-seq did not succeed because of the technical challenge associated with sequencing the broad H3K9me2 peaks. Similar problems with H3K9me2 ChIP-seq have been previously reported by other studies (Yuan et al., 2009). As an alternate, regions that showed significant reduction of H3K9me3 in the ChIP-seq experiment (as evident by the wiggle plots; Figure 5Da–Dd and Figure 5—figure supplement 1Ba,Bb) were chosen for H3K9me2 ChIP-qPCR validation (Supplementary file 2).
- https://doi.org/10.7554/eLife.06496.020
Download links
A two-part list of links to download the article, or parts of the article, in various formats.
Downloads (link to download the article as PDF)
Open citations (links to open the citations from this article in various online reference manager services)
Cite this article (links to download the citations from this article in formats compatible with various reference manager tools)
The preRC protein ORCA organizes heterochromatin by assembling histone H3 lysine 9 methyltransferases on chromatin
eLife 4:e06496.
https://doi.org/10.7554/eLife.06496


