The transcriptional cofactor TRIM33 prevents apoptosis in B lymphoblastic leukemia by deactivating a single enhancer
- Cold Spring Harbor Laboratory, United States
- Stony Brook University, United States
- University of Tokyo, Japan
Figures
Figure 1 with 2 supplements
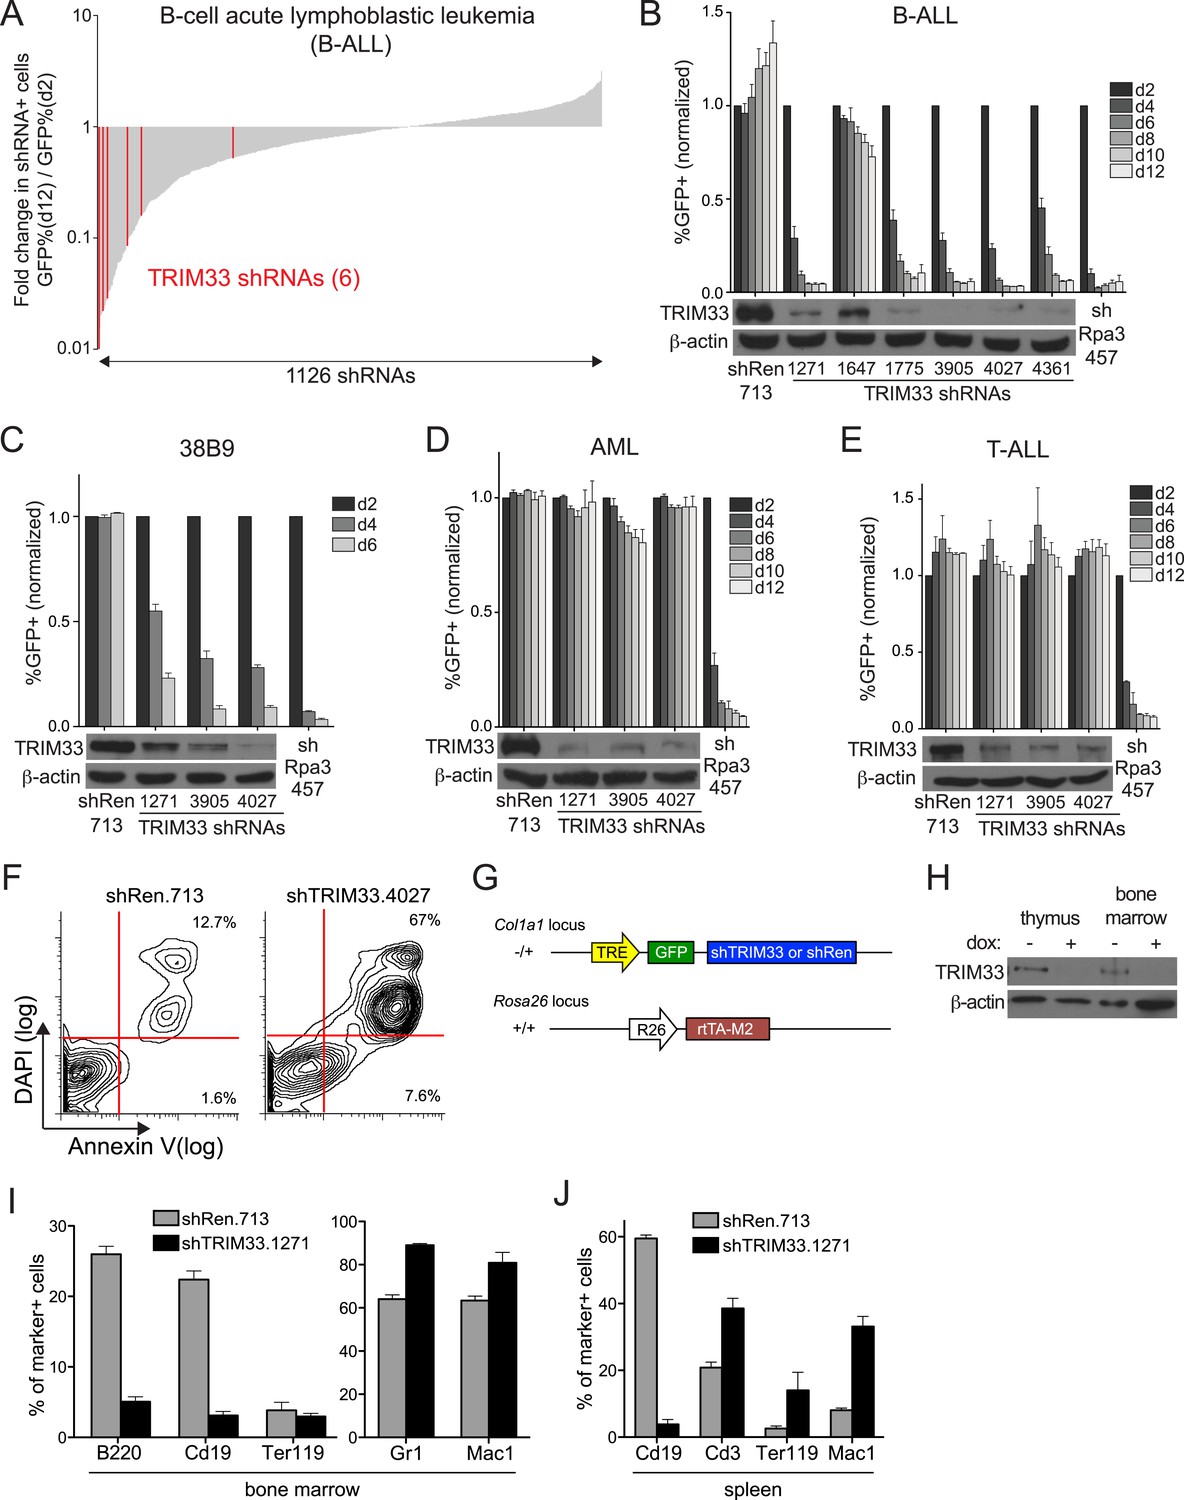
RNAi screen identifies TRIM33 as a lineage dependency in cancers of B cell origin.
(A) Negative selection shRNA screen targeting chromatin regulators in murine B cell acute lymphoblastic leukemia (B-ALL). shRNAs are rank ordered by the fold-change in GFP positivity over 10 days in culture, which represents a competition-based assay in which loss of GFP positivity reflects shRNA-postive cells becoming outcompeted by shRNA-negative cells. (B–E) Competition-based assays and Western blotting to evaluate the effect of TRIM33 shRNAs on B-ALL, 38B9, acute myeloid leukemia (AML), or T-cell acute lymphoblastic leukemia (T-ALL) cells. GFP percentages are normalized to day 2 measurements. Results are the average of three biological replicates. (F) Annexin V/DAPI staining following transduction of B-ALL cells with the indicated MLS shRNAs on day 3 post-transduction. Representative experiment of three biological replicates is shown. (G) shRNA transgenic mouse strategy. TRE: tet(doxycycline) response element; rtTA-M2: reverse tet transactivator M2 variant (tet-on). (H) Western blotting performed of indicated tissue lysates prepared from mice treated with dox for 4 weeks. Representative experiment of three biological replicates is shown. (I–J) Flow cytometry analysis using the indicated antibody stainings of whole bone marrow or spleen. B220 and Cd19: B lymphoid, Ter119: erythroid, Gr1 and Mac1: myeloid, Cd3: T lymphoid. Gating was performed on GFP+/shRNA+ cells prior to quantifying marker positivity. The GFP+ percentage in bone marrow was ∼75% and in the spleen was ∼15%. Mice were administered dox for 1 week or 4 weeks, with both timepoints giving similar results. Results shown are the average 4 or 5 mice. All error bars in this figure represent S.E.M.
Figure 1—figure supplement 1
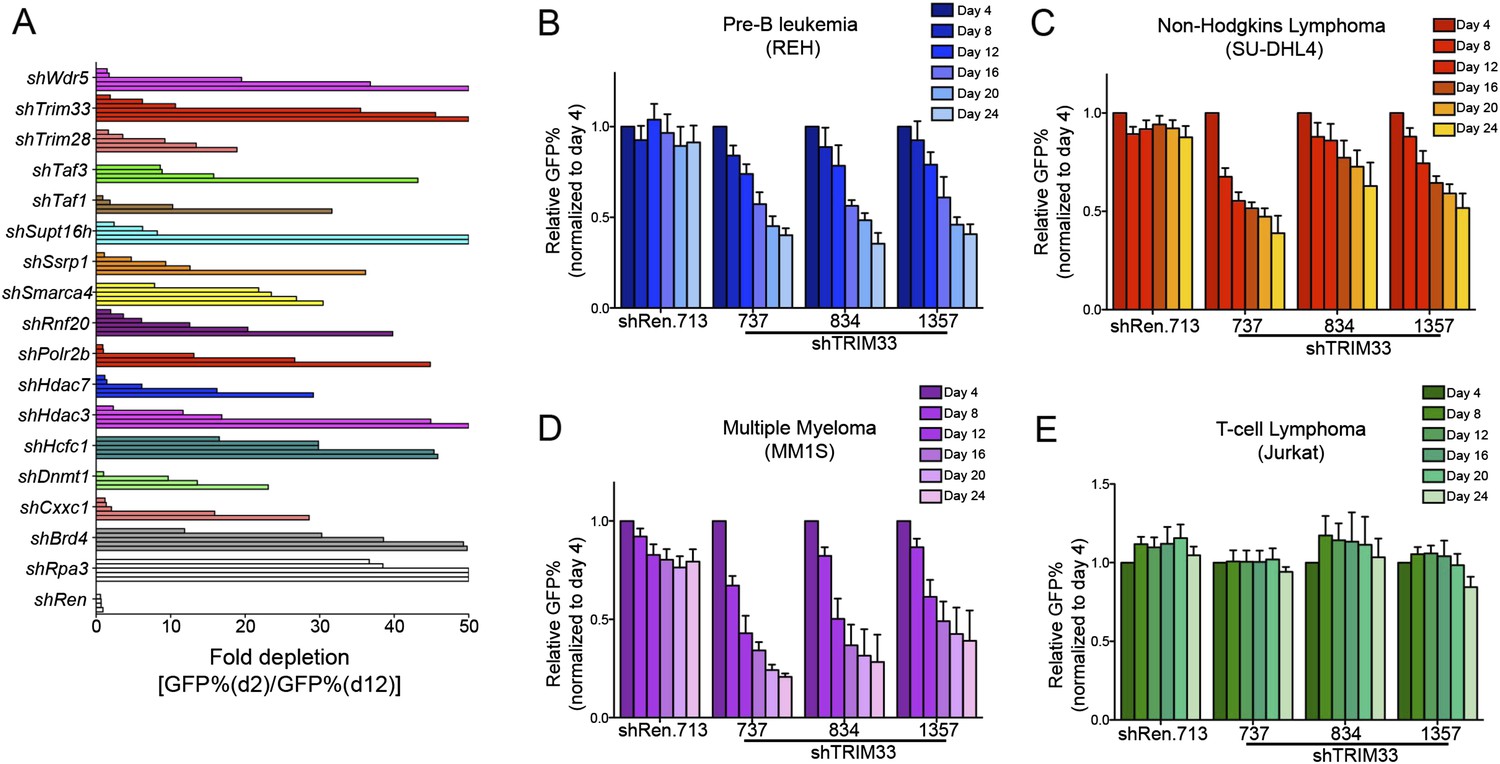
Hits identified in the shRNA screen and validation experiments in human cell lines.
(A) B-ALL chromatin regulator dependencies identified in the shRNA screen. 68 shRNAs in the primary screen were depleted >10-fold over 10 days in culture. By setting a criteria of having at least 2 independent shRNAs targeting the same gene exhibiting >10-fold GFP depletion, we identified 16 dependencies, indicated here. An Rpa3 shRNA was included as a positive control. A Renilla luciferase shRNA was included as a negative control. Each horizontal bar represents an independent shRNA, except for Rpa3 and Renilla controls which are independent experiments with the same shRNA. Fold-depletion was capped at 50-fold for visualization purposes. Results were compared with prior screening results and validation experiments performed in MLL-AF9/NrasG12D AML to identify TRIM33 was a unique dependency in B-ALL (Zuber et al., 2011b). (B–E) Competition-based proliferation assays using the indicated TRIM33 or Ren shRNA expressing MLS-E vectors, which were transduced into the indicated human cell lines. All experiments shown represent the average of three biological replicates. Error bars represent S.E.M.
Figure 1—figure supplement 2
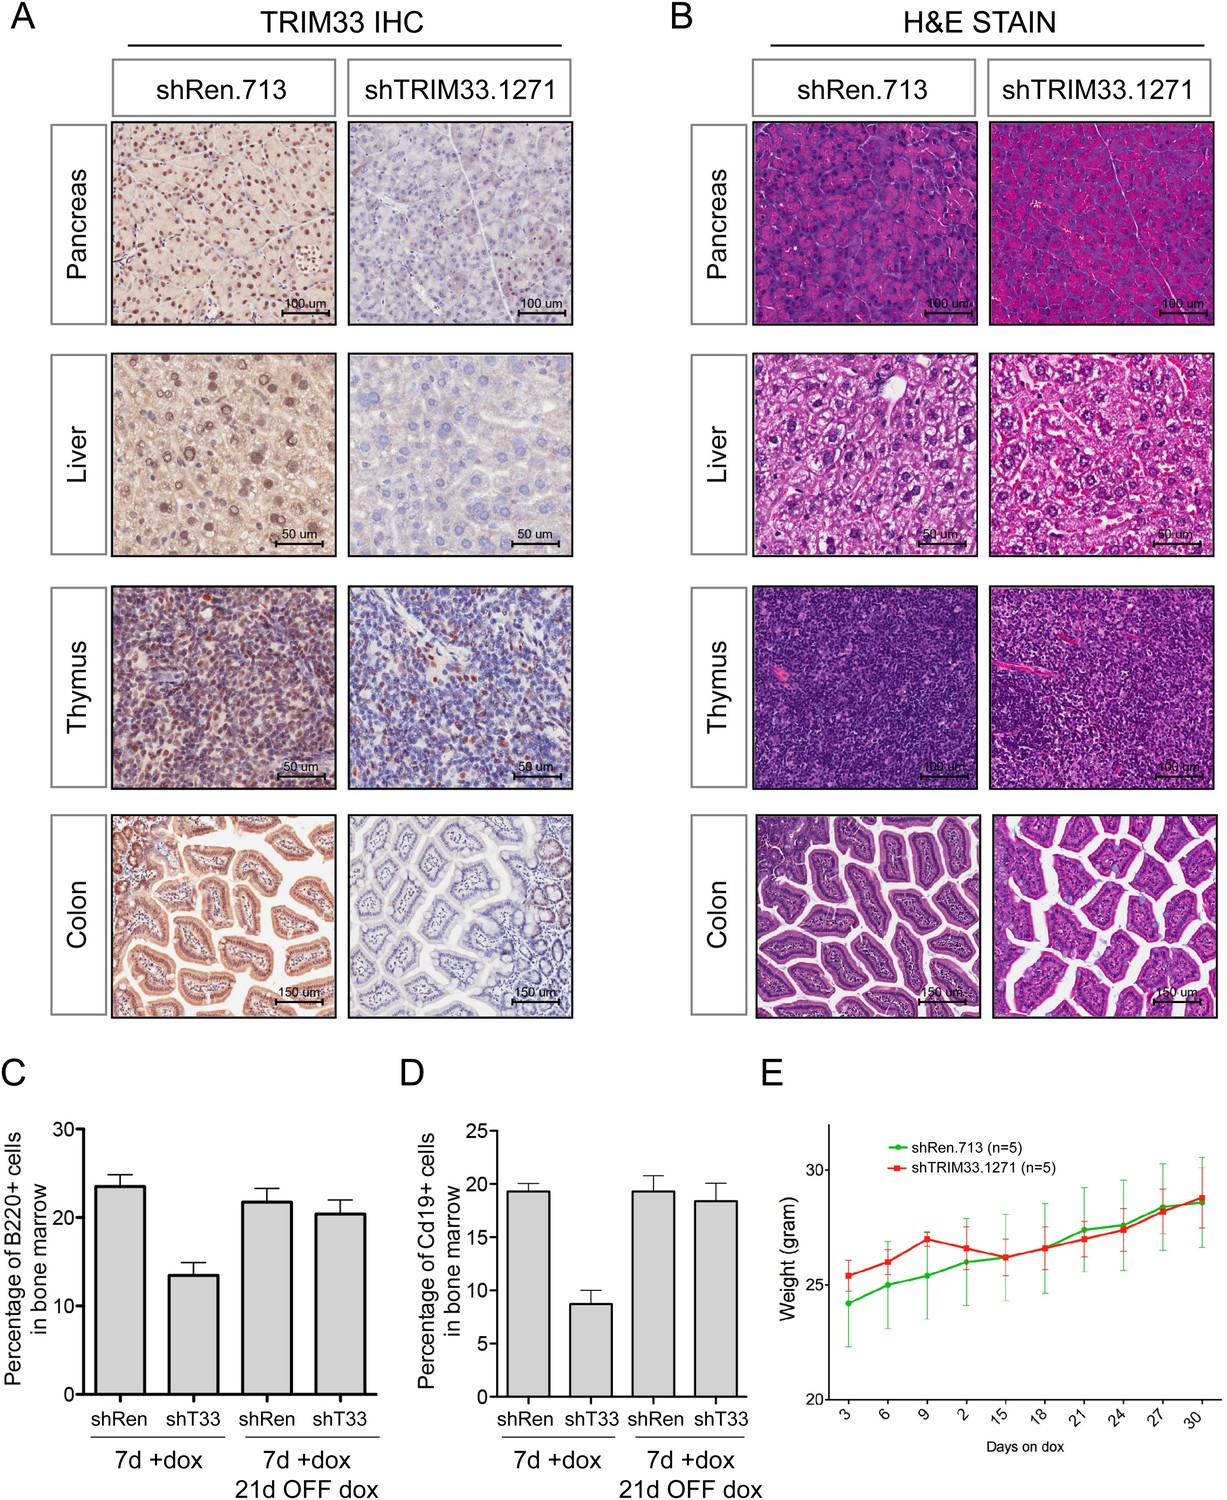
Additional analysis of TRIM33 shRNA transgenic mice.
(A) Immunohistochemical analysis of anti-TRIM33 antibody staining shTRIM33 or shRen adult mice (heterozygous) following 30 days of doxycycline administration. All mice were homozygous for the ROSA26-rtTA-M2 transgene. Counterstaining was performed with Hematoxylin. (B) Hematoxylin and Eosin staining of indicated tissues. (C and D) Analysis of the reversibility of the B cell phenotype in TRIM33 knockdown mice as compared to Renilla shRNA control. Mice were treated for 7 days ON dox or were treated with 7 days ON dox followed by 21 days OFF dox, as indicated. GFP gating was not performed for this analysis, since in the OFF dox condition the GFP reporter is extinguished. n = 4 or 5. (E) Animal weight measurements following dox administration. Error bars represent S.E.M.
Figure 2 with 4 supplements
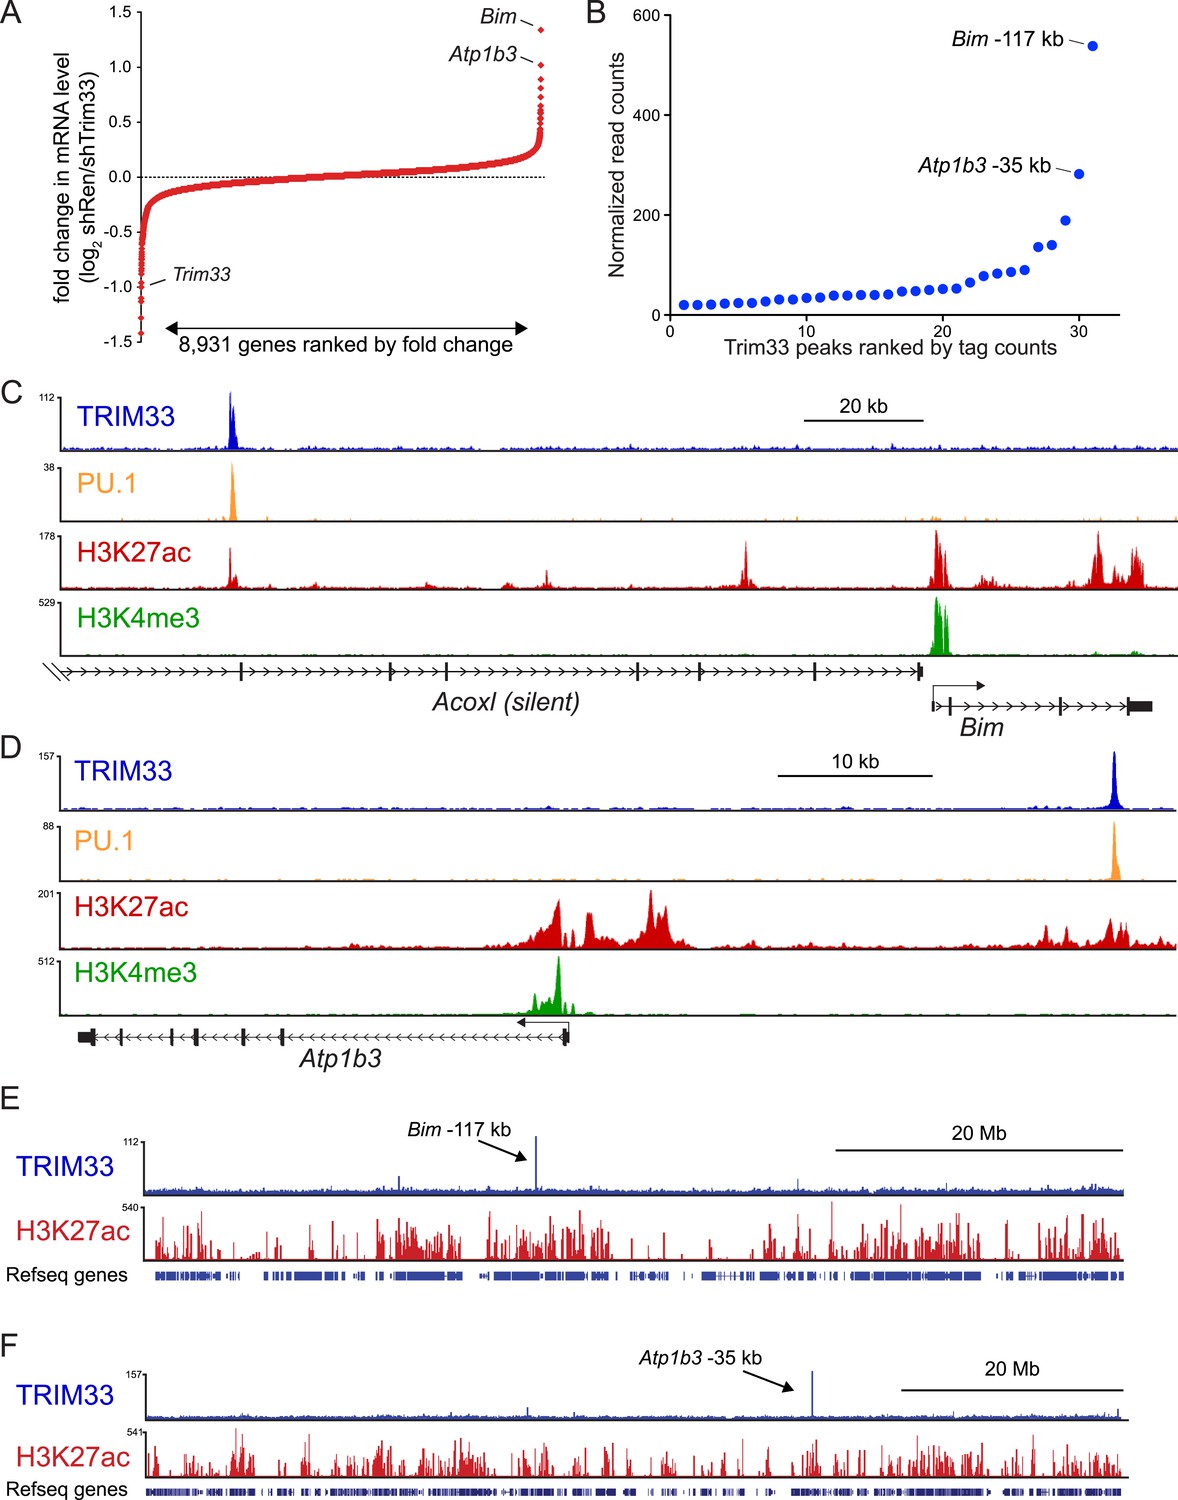
TRIM33 preferentially associates with two lineage-specific enhancers in B lymphoblastic leukemia cells.
(A) RNA-seq analysis of B-ALL cells transduced with shTRIM33.1271. shRNA+/GFP+ cells were sorted on day 3 or 4 post-infection. Plotted is the average fold-change in mRNA level of two independent biological replicates. (B) Ranking of TRIM33 occupied sites based on average tag counts obtained from B-ALL ChIP-seq analysis. The 31 regions shown represent the significant reproducible peaks identified in two independent biological replicates. (C–F) B-ALL ChIP-seq occupancy profiles using the indicated antibodies. The y-axis reflects the number of cumulative tag counts in the vicinity of each region. Validated transcript models from the mm9 genome assembly are depicted below.
Figure 2—figure supplement 1
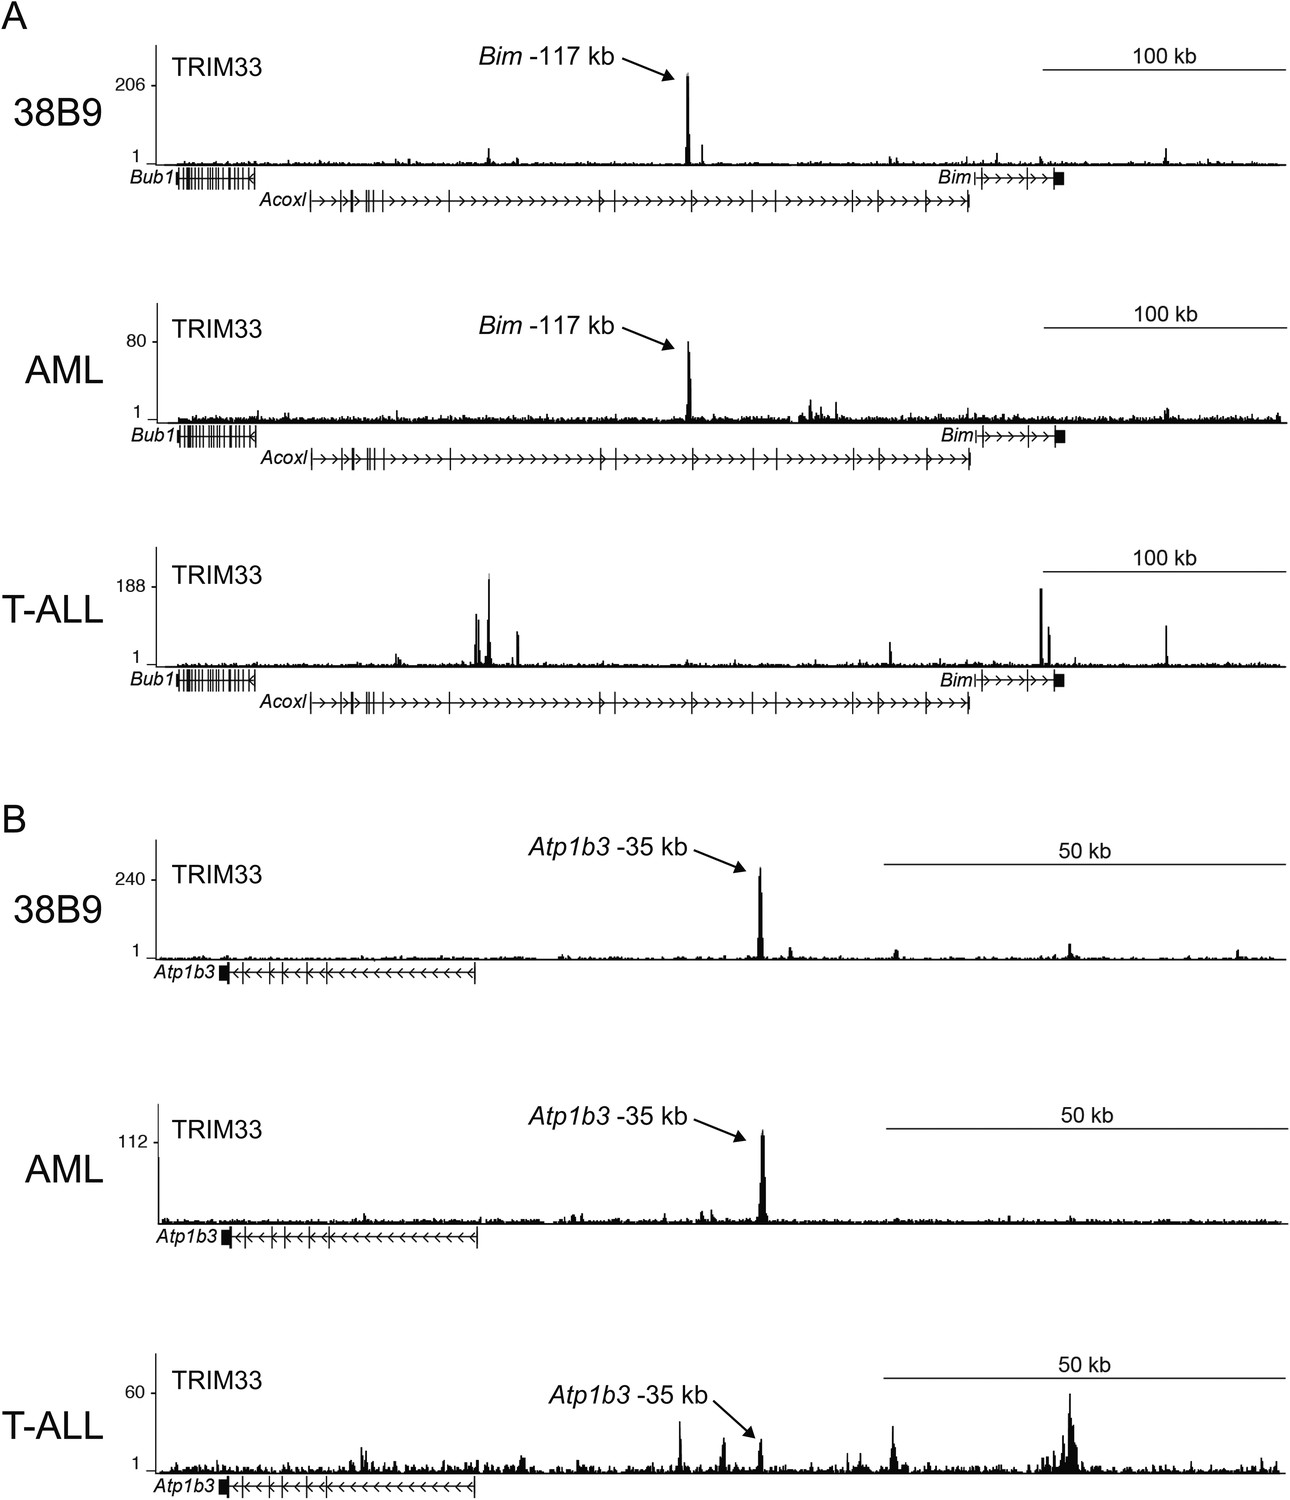
(A–B) TRIM33 ChIP-seq occupancy profiles at the Bim locus (A) and the Atp1b3 locus (B) in the indicated cell types.
Validated transcript models from the mm9 genome assembly are depicted below.
Figure 2—figure supplement 2
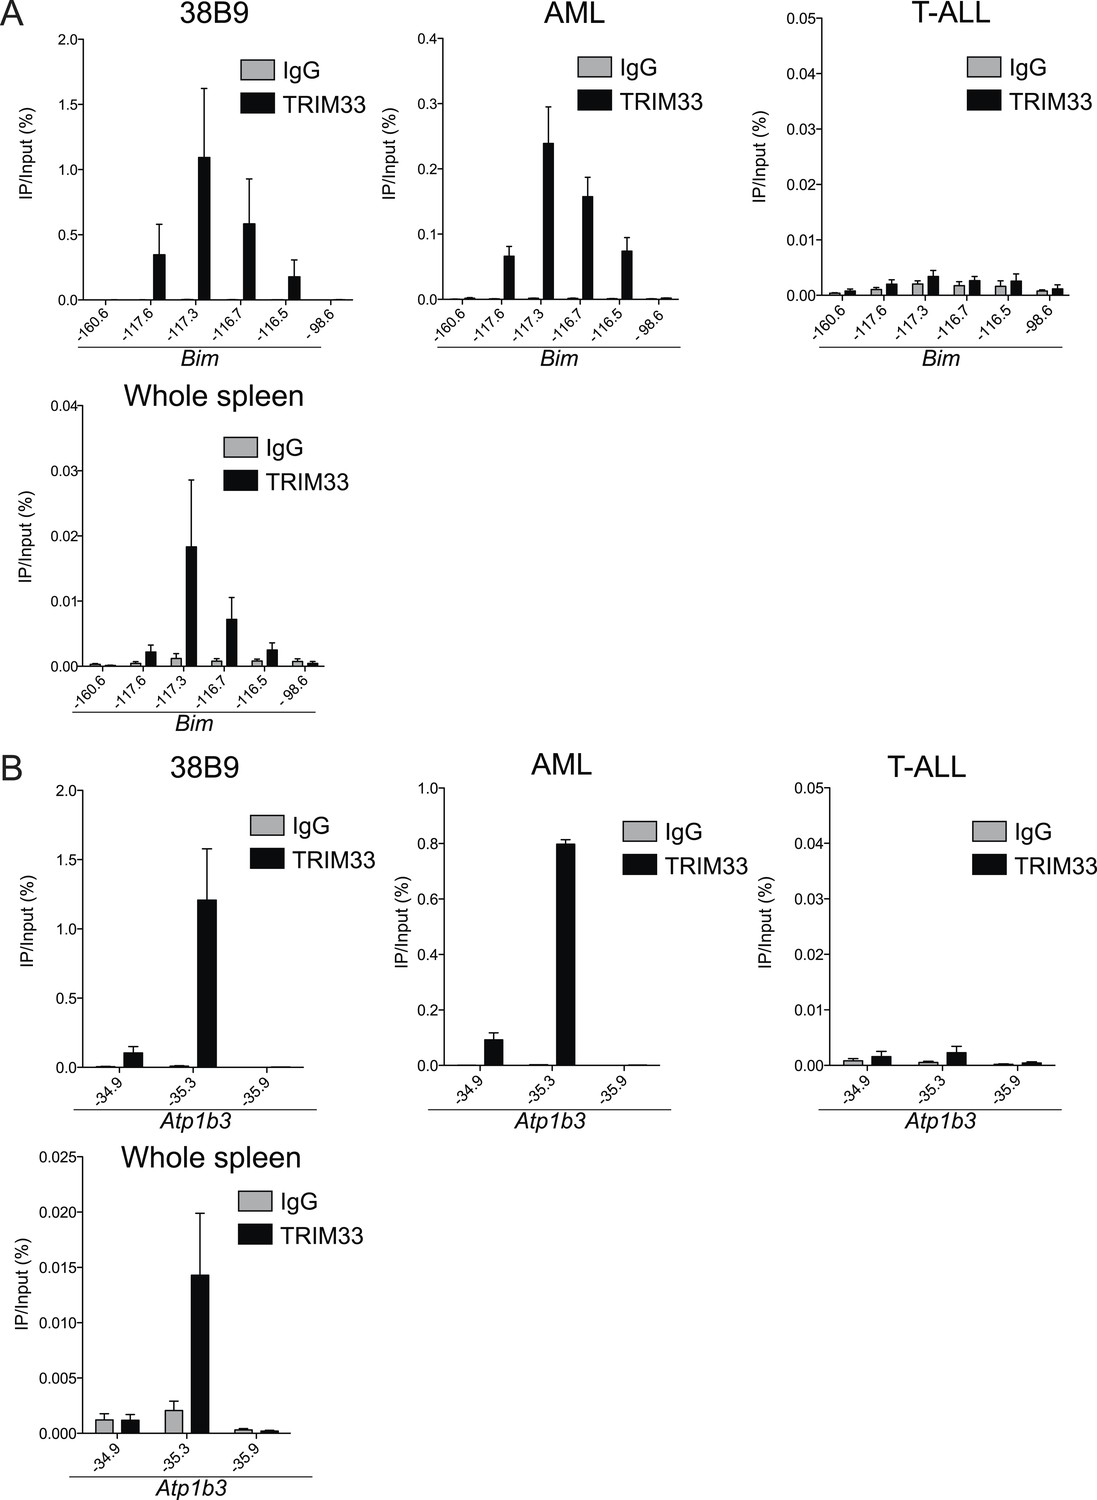
Trim33 ChIP-qPCR analysis in various cell lines.
(A–B) ChIP-qPCR validation of TRIM33 occupancy at the Bim or Atp1b3 loci in the indicated cell lines. qPCR amplicons were designed at the indicated locations of the Bim or Atp1b3 loci. Labels refer to kilobase distance relative to Bim or Atp1b3 transcriptional start site (TSS). Plotted is the average of three biological replicates. Error bars denote S.E.M.
Figure 2—figure supplement 3

(A–D) Comparison of two independent TRIM33 ChIP-seq biological replicates in B-ALL.
https://doi.org/10.7554/eLife.06377.009
Figure 2—figure supplement 4
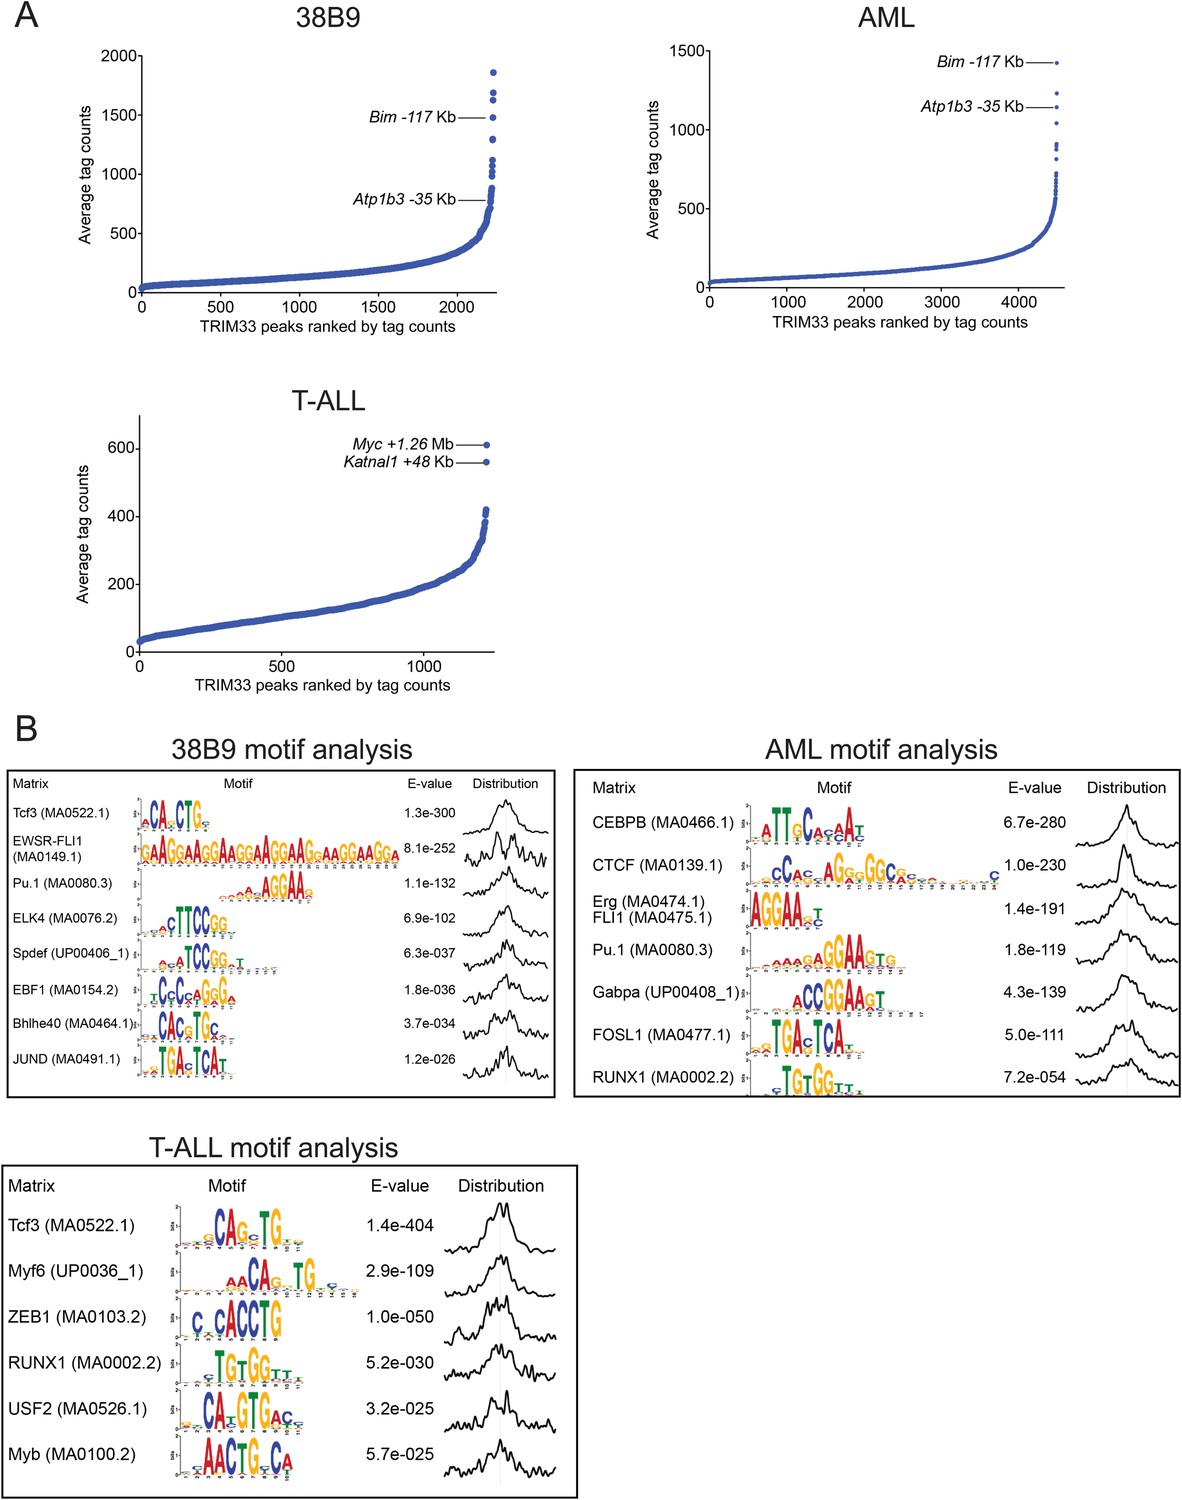
TRIM33 ChIP-seq analysis in 38B9, AML, and T-ALL.
(A) Ranking of TRIM33 occupied sites based on average tag counts obtained from ChIP-seq analysis in the indicated cell lines. The regions shown represent the reproducible peaks identified in each of two independent biological replicates. The Bim-117 and Atp1b3-35 regions are as indicated in 38B9 and AML. In T-ALL we did not identify these regions as robust peaks and instead we labeled the top two outlier TRIM33 peaks in this cell type. (B) MEME-based motif analysis at 400 bp windows centered on TRIM33 occupied peaks shown in A. The distribution of motifs in this window is indicated on the right.
Figure 3 with 4 supplements

TRIM33 is recruited by PU.1 to select enhancers and antagonizes PU.1 function to promote B-ALL survival.
(A) Motif analysis using the FIMO/MEME algorithm. The table indicates the number of motif matches in each sequence interval. (B) Schematic diagram of PU.1 motif (MA0080.3) locations across the indicated cis elements. (C) Analysis of PU.1 motifs (MA0080.3) counts at all of the 2682 PU.1 peaks identified by ChIP-seq. (D–I) ChIP-qPCR analysis at the indicated locations of the Bim locus in B-ALL. Labels refer to the kilobase distance relative to the Bim TSS. For TRIM33 knockdown experiments (G–I), both shRen and shTRIM33 were introduced into B-ALL cells harboring a Bim shRNA. Plotted is the average of three biological replicates. (J) Competition-based assay evaluating effect of a PU.1 shRNA on the sensitivity of B-ALL cells to TRIM33 knockdown. shRen or shPU1 linked to GFP were introduced first into B-ALL cells and then were subsequently transduced with shTRIM33 or shRen linked to mCherry. The GFP/mCherry double positive population was measured over time. Results are normalized to day 2 measurements. Plotted is the average of three biological replicates. All error bars in this figure represent S.E.M.
Figure 3—figure supplement 1
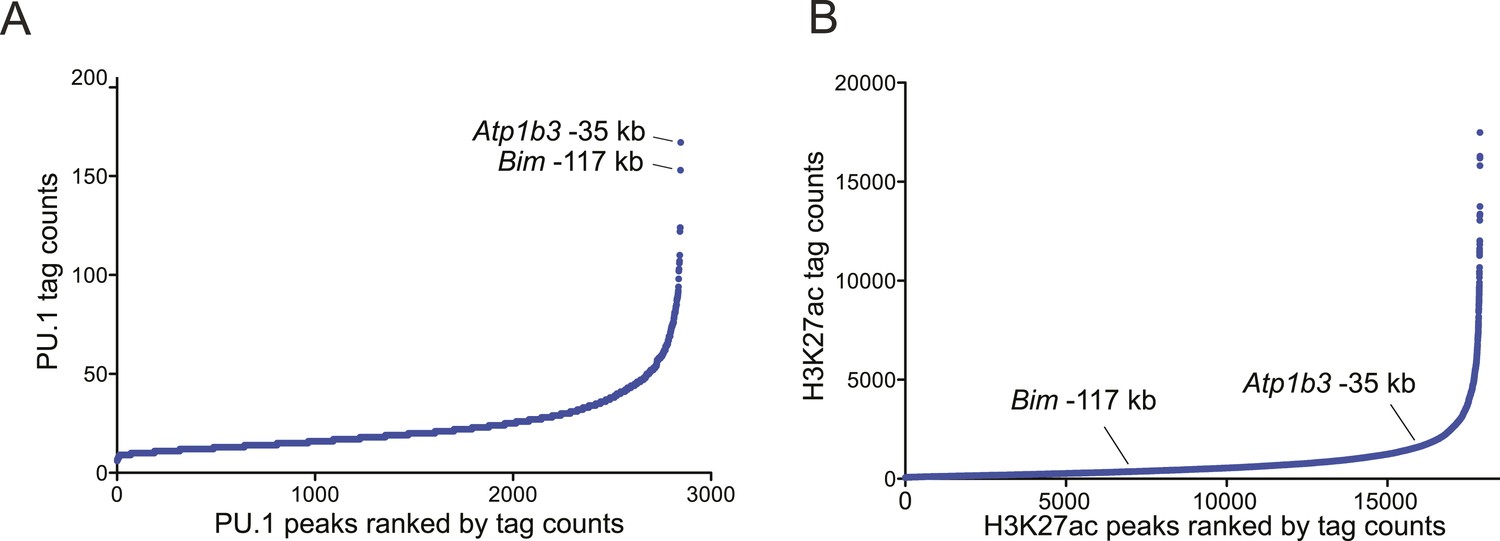
(A–B) Ranked ordering of PU.1 and H3K27 acetylation peaks identified using ChIP-seq analysis in B-ALL.
Peaks were ranked based on sequence tag counts. Positions of Bim-117 and Atp1b3-35 are indicated.
Figure 3—figure supplement 2
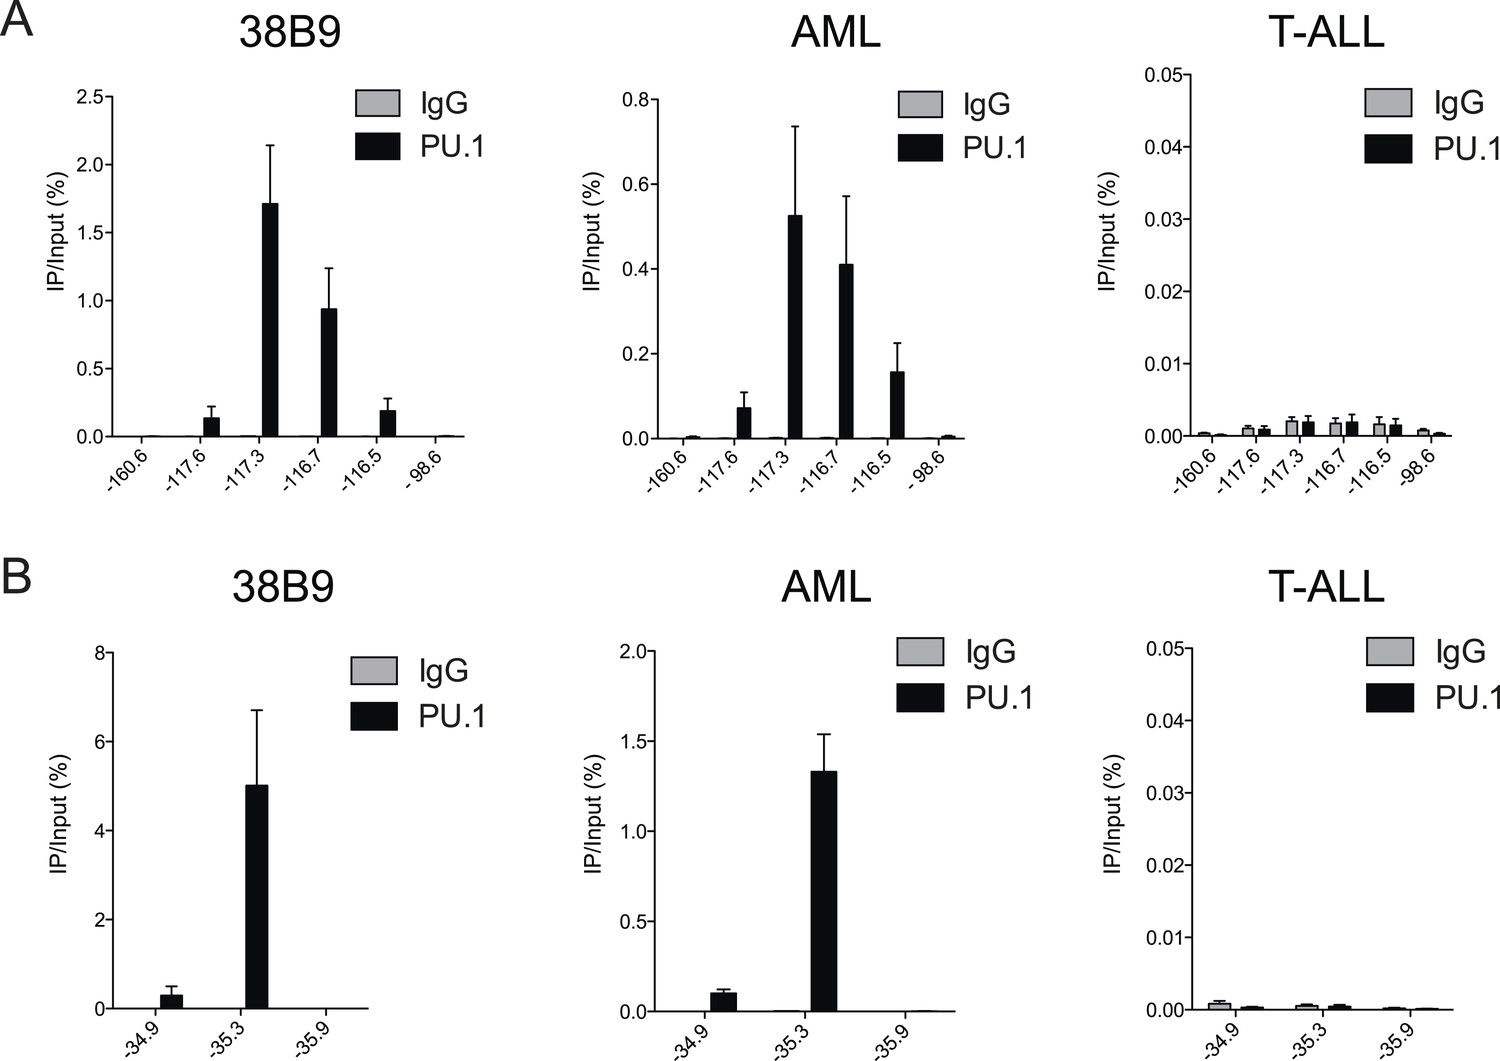
(A–B) PU.1 ChIP-qPCR analysis at the indicated locations of Bim (A) and Atp1b3 (B) loci in 38B9, AML, and T-ALL.
Labels refer to kilobase distance relative to TSS. Plotted is the average of three biological replicates. Error bars denote S.E.M.
Figure 3—figure supplement 3
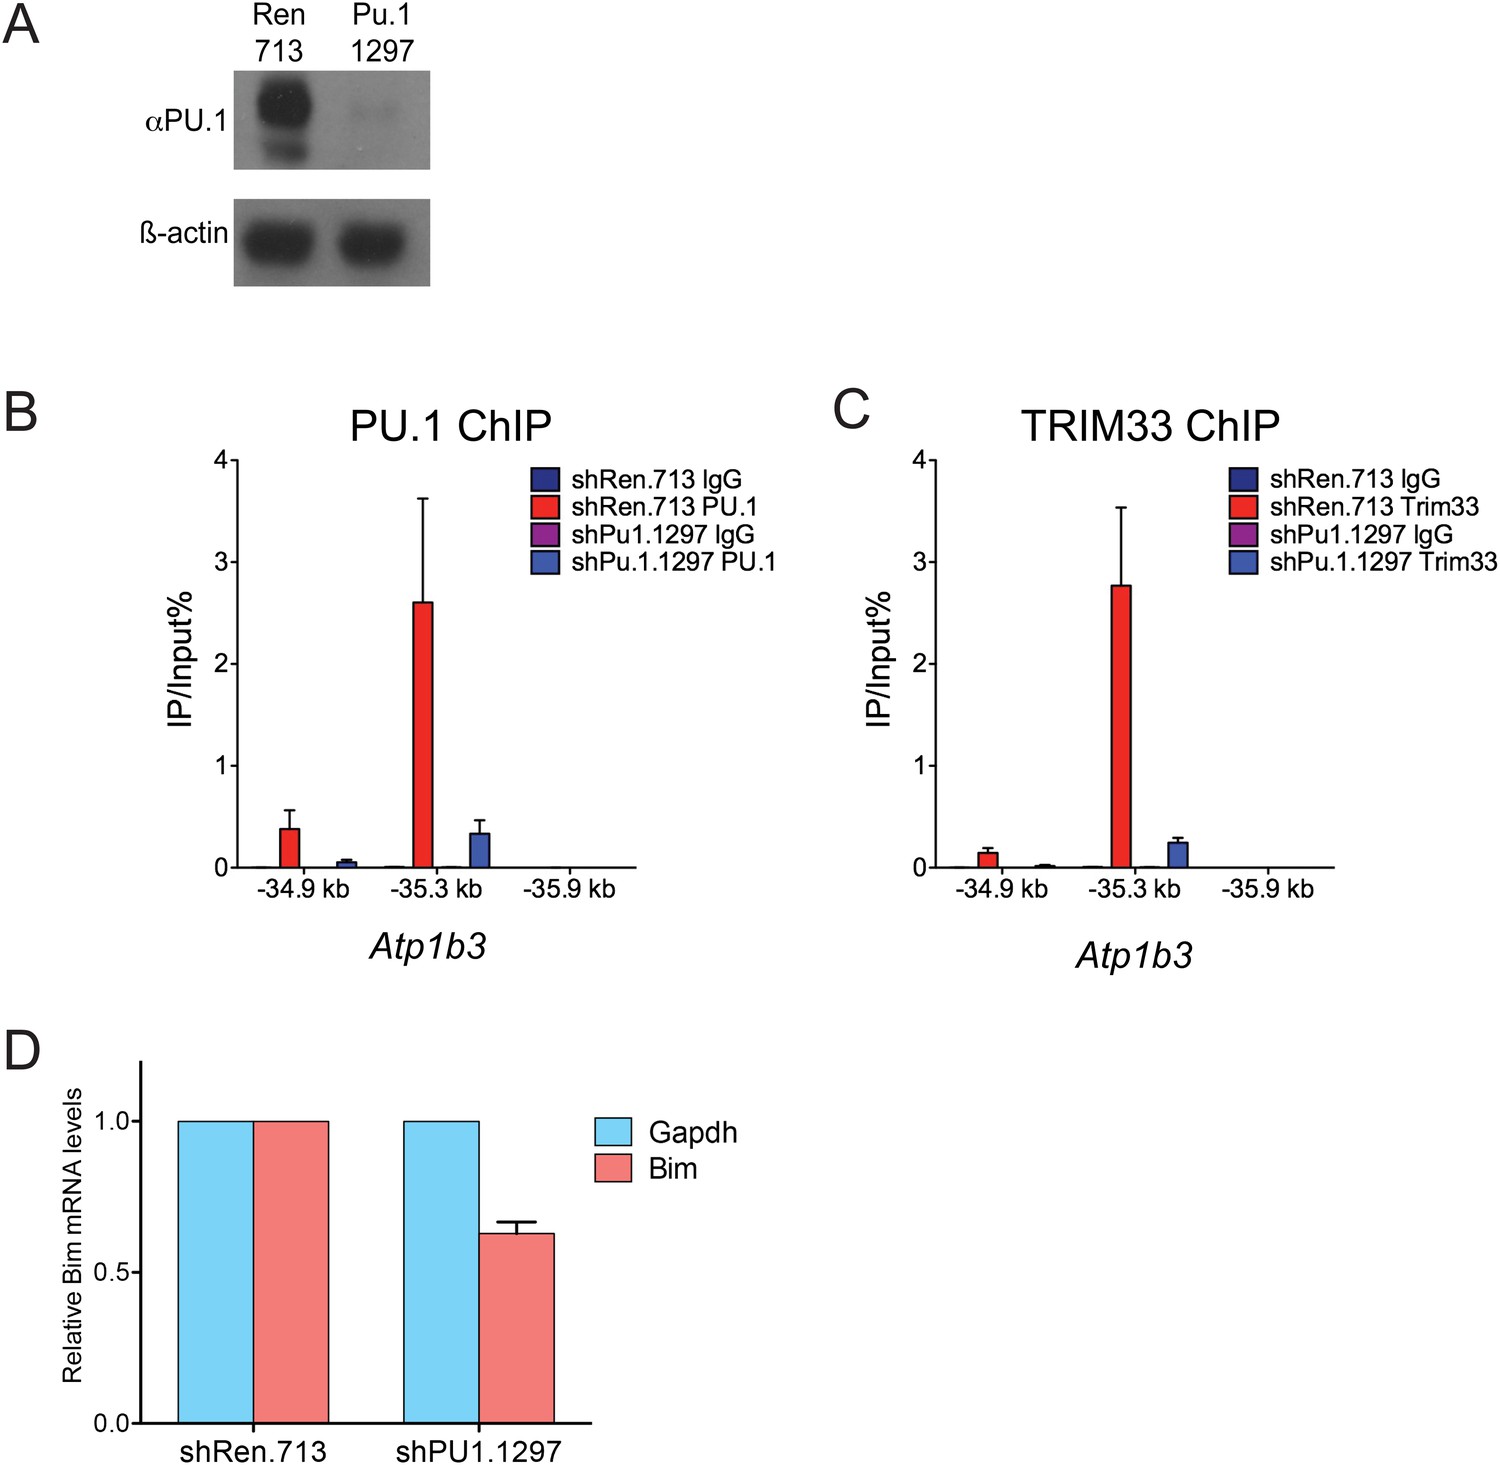
Additional PU.1 knockdown experiments.
(A) Validation of Pu.1 shRNA by Western blotting. Experiment was performed in MLP-GFP transduced B-ALL cells following puromycin selection. (B–C) Effect of PU.1 knockdown on TRIM33 occupancy at Atp1b3. ChIP-qPCR analysis at the indicated locations of the Atp1b3 locus in B-ALL. Labels refer to kilobase distance relative to Atp1b3 TSS. Plotted is the average of three biological replicates. Error bars denote S.E.M. (D) Effect of PU.1 knockdown on Bim expression. RNA was prepared from B-ALL cells transduced with indicated shRNAs and used for reverse transcription. Plotted is the average of three biological replicates. Results were normalized to Gapdh.
Figure 3—figure supplement 4
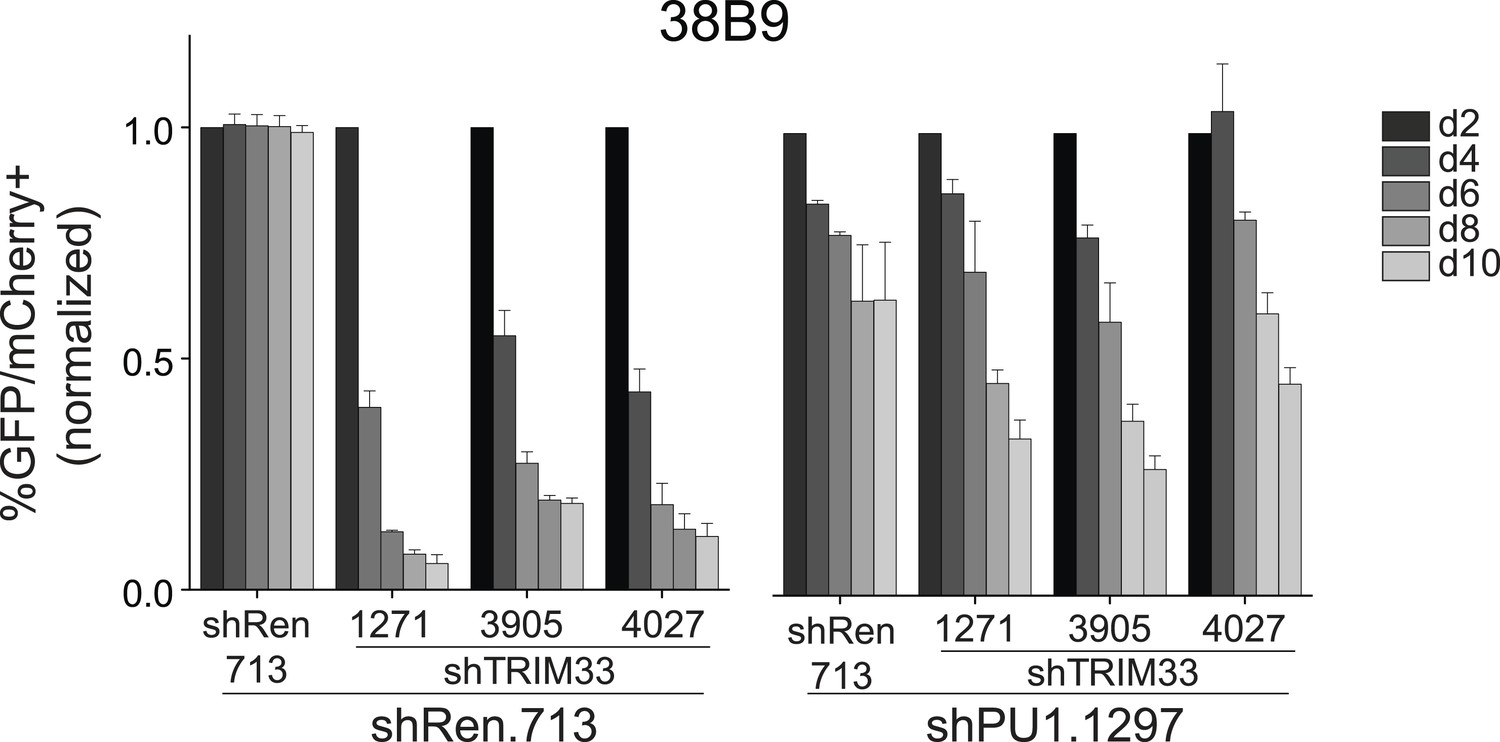
Competition-based assay evaluating effect of a PU.1 shRNA on the sensitivity of 38B9 cells to TRIM33 knockdown.
shRen or shPU1 linked to GFP were introduced first into B-ALL cells and then were subsequently transduced with shTRIM33 or shRen. The GFP/mCherry double positive population was measured over time. Results are normalized to day 2 measurements. Plotted is the average of three biological replicates. All error bars in this figure represent S.E.M.
Figure 4 with 2 supplements
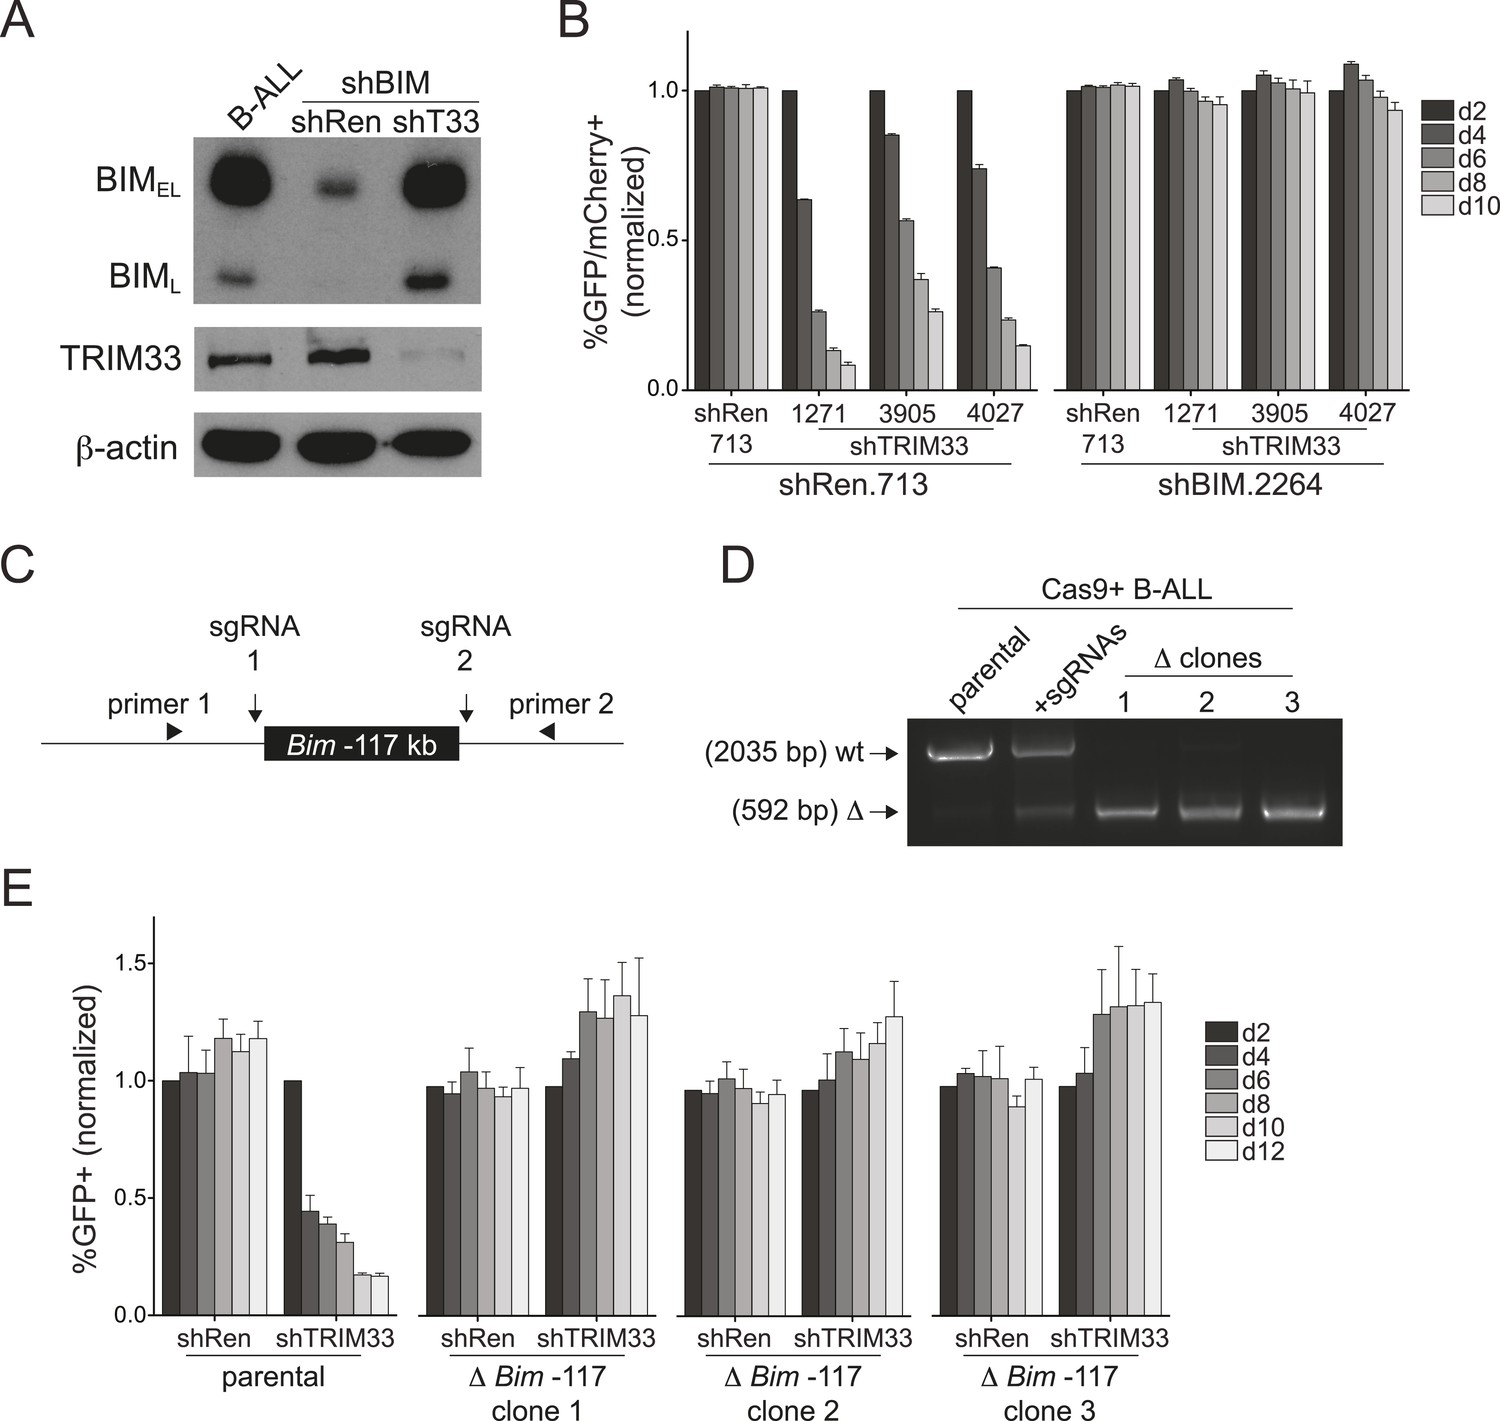
TRIM33 occupancy at a single Bim enhancer accounts for its essential function in B-ALL.
(A) Western blot performed on extracts prepared from B-ALL following transduction with the indicated shRNAs. Labeled are two of the known Bim isoforms. TRIM33.3905 shRNA was used. (B) Competition-based assay evaluating the effect of Bim knockdown on the sensitivity of B-ALL cells to TRIM33 knockdown. shRen or shBim linked to GFP were introduced first into B-ALL cells and then were subsequently transduced with shTRIM33 or shRen linked to mCherry. The GFP/mCherry double positive population was measured over time. Results are normalized to day 2 measurements. Plotted is the average of three biological replicates. (C) Experimental design for generating a homozygous deletion of the Bim –117 region using CRISPR-Cas9. sgRNAs were designed to cut at locations flanking the TRIM33 binding site to delete the intervening 1.4 kb. Location of PCR primers used for genotyping are indicated. (D) Genotyping PCR to track the CRISPR-based deletion. Parental refers to Cas9+ B-ALL cells. +sgRNAs refers to Cas9+ B-ALL cells co-transduced with two sgRNAs targeting the Bim –117 element linked to mCherry reporters. Three clonal lines were derived by limiting dilution. (E) Competition-based assay evaluating the effect of the Bim –117 deletion on the sensitivity to TRIM33 knockdown. B-ALL cells were transduced with indicated shRNAs linked to GFP reporters. TRIM33.3905 shRNA was used. Results are normalized to day 2 measurements. Plotted is the average of three biological replicates. All error bars in this figure represent S.E.M.
Figure 4—figure supplement 1

Additional experiments evaluating the role of Bim in 38B9 cells.
(A) Competition-based assay evaluating the effect of Bim knockdown on the sensitivity of 38B9 cells to TRIM33 knockdown. shRen or shBim linked to GFP were introduced first into 38B9 cells and then were subsequently transduced with shTRIM33 or shRen linked to mCherry. The GFP/mCherry double positive population was measured over time. Results are normalized to day 2 measurements. Plotted is the average of three biological replicates. (B) Genotyping PCR to track the CRISPR-based deletion, as described in Figure 4D. Parental refers to Cas9+ 38B9 cells. +sgRNAs refers to Cas9+ 38B9 cells co-transduced with two sgRNAs targeting the Bim-117 element linked to mCherry reporters. Three clonal lines were derived by limiting dilution. (C) Competition-based assay evaluating the effect of the Bim-117 deletion on the sensitivity to TRIM33 knockdown. 38B9 cells were transduced with indicated shRNAs linked to GFP reporters. TRIM33.3905 shRNA was used. Results are normalized to day 2 measurements. Plotted is the average of three biological replicates. All error bars in this figure represent S.E.M.
Figure 4—figure supplement 2
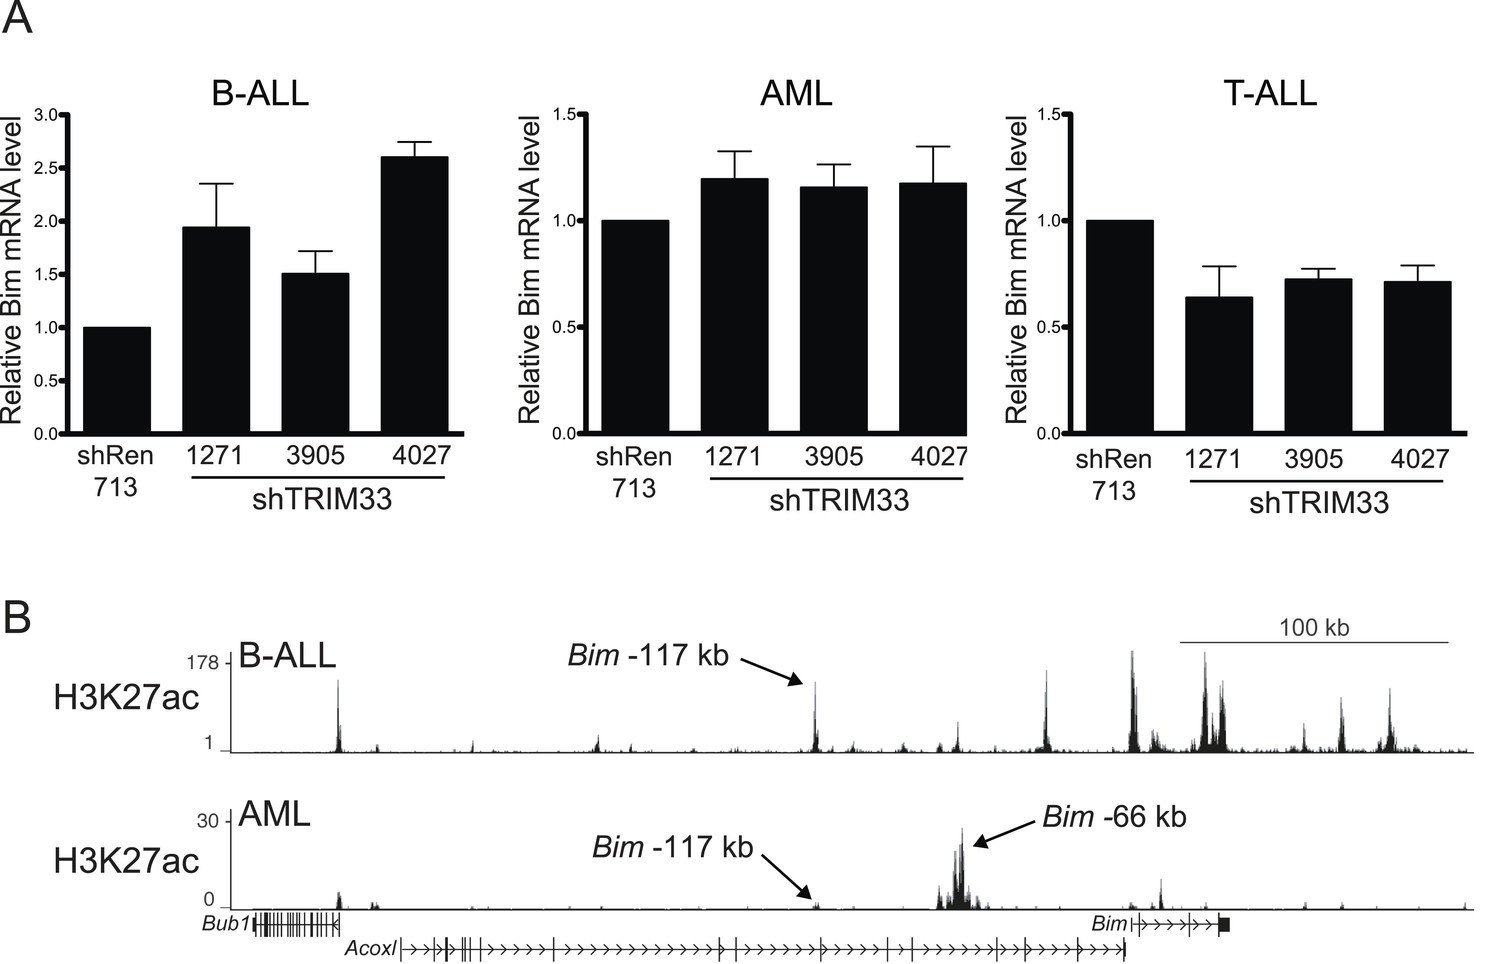
Additional experiments evaluating the role of TRIM33 in AML and T-ALL.
(A) RT-qPCR analysis of Bim mRNA levels following TRIM33 shRNA transduction into the indicated cell lines. Plotted is the average of three biological replicates. Results were normalized to Gapdh. (B) ChIP-seq occupancy profile of H3K27 acetylation in the indicated cell lines. Arrows indicate the location of the Bim-117 and -66 regions (see text). The H3K27ac ChIP-seq data from AML was derived from (Shi et al., 2013).
Author response image 1
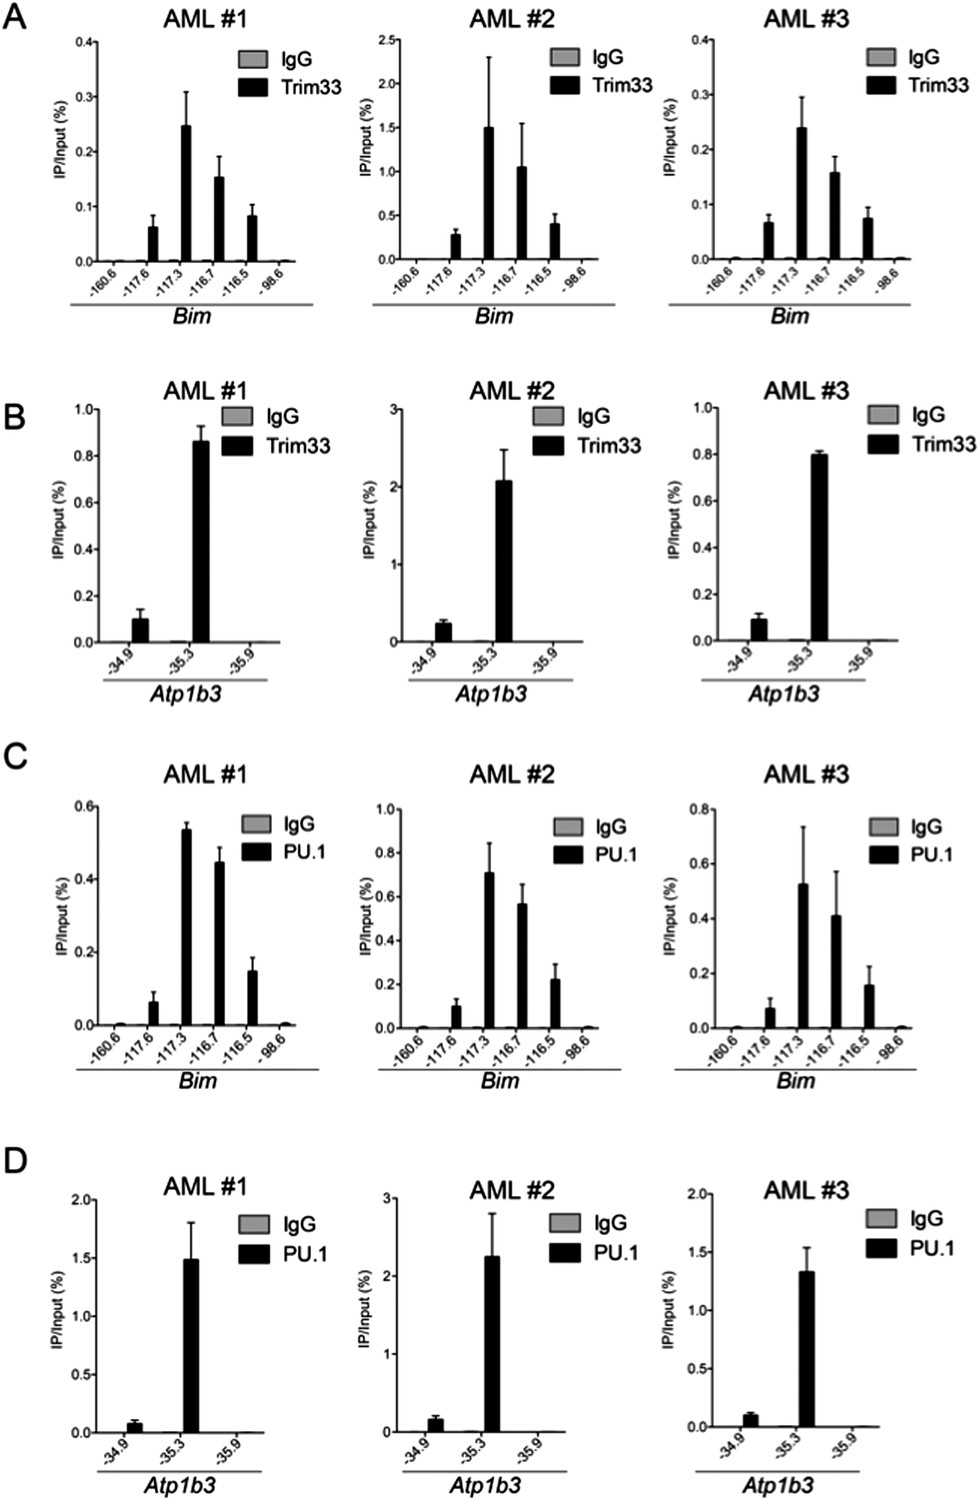
ChIP-qPCR of TRIM33 and PU.1 in 3 independent MLL-AF9/NrasG12D acute myeloid leukemia cell lines, which are all early passage cultures derived from leukemic mice.
Additional files
-
Supplementary file 1
B-ALL shRNA screen data.
- https://doi.org/10.7554/eLife.06377.019
-
Supplementary file 2
Sequences of primers, shRNAs, and sgRNAs used in this study.
- https://doi.org/10.7554/eLife.06377.020
Download links
A two-part list of links to download the article, or parts of the article, in various formats.
Downloads (link to download the article as PDF)
Open citations (links to open the citations from this article in various online reference manager services)
Cite this article (links to download the citations from this article in formats compatible with various reference manager tools)
The transcriptional cofactor TRIM33 prevents apoptosis in B lymphoblastic leukemia by deactivating a single enhancer
eLife 4:e06377.
https://doi.org/10.7554/eLife.06377


