A map of directional genetic interactions in a metazoan cell
- European Molecular Biology Laboratory, Germany
- German Cancer Research Center (DKFZ), Germany
- Heidelberg University, Germany
Figures
Figure 1 with 3 supplements
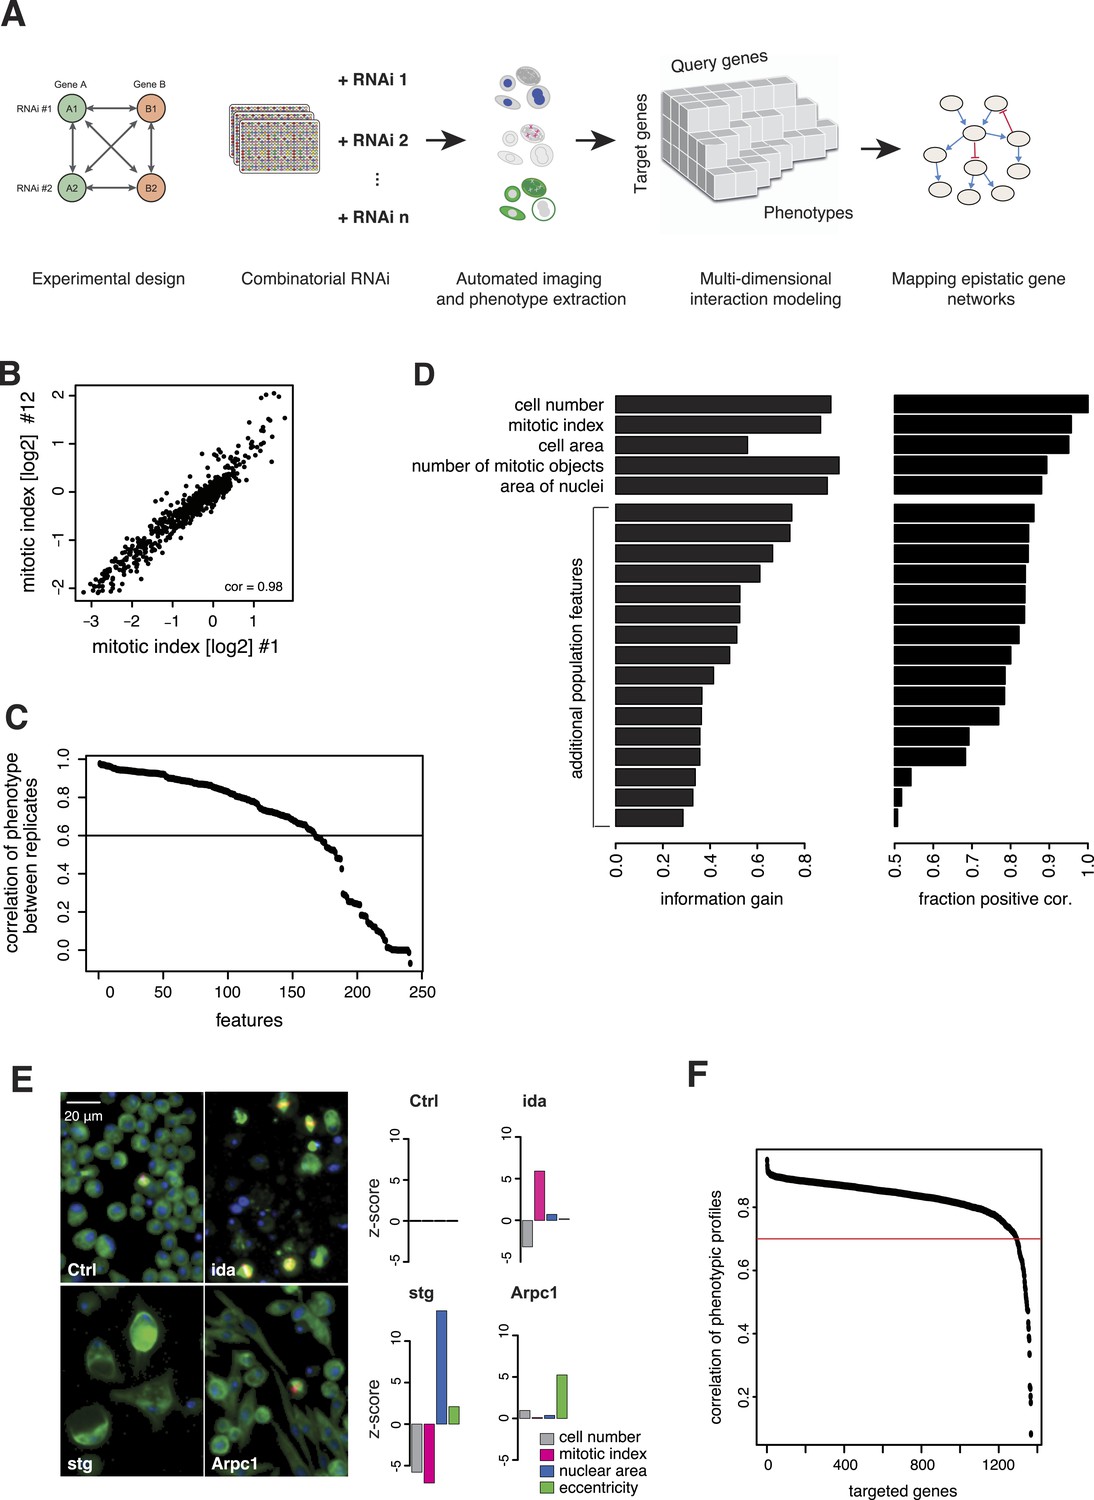
Combinatorial RNAi to map multi-phenotype genetic interactions.
(A) Workflow for multi-phenotype genetic interaction analysis by RNAi. (B) Reproducibility of phenotypic measurements. Plot shows replicate measurements for 1293 target genes at the beginning and end of the screening campaign. No batch effects on phenotypes were observed. (C) Each point in the plot corresponds to one of the phenotypic features. The y-axis shows the Pearson correlation coefficient of the feature's values between two replicates. Along the x-axis, features are ordered by their correlation coefficient. (D) Selection of non-redundant features proceeded step-wise, starting with cell number, mitotic index and cell area. In the left panel, the x-axis shows the information gain (as measured by the correlation of the residuals between replicates) for the selected features. Features are ordered as selected. In the right panel, the x-axis shows the fraction of positively correlated residual features remaining, which is used as a stop criterion (Laufer et al., 2013). (E) Representative image regions are shown for negative control (Ctrl), imaginal discs arrested (ida), string (stg) and actin-related protein 2/3 complex, subunit 1 (Arpc1). Bar charts display measured quantitative features. (F) Two independent dsRNA reagents per gene were used to assess on-target specificity. The plot shows the correlation coefficient (r) between the two reagents across all phenotypic features and 72 query dsRNAs. Only genes with r > 0.7 (red line) were included in further analyses.
Figure 1—figure supplement 1
Experimental design.
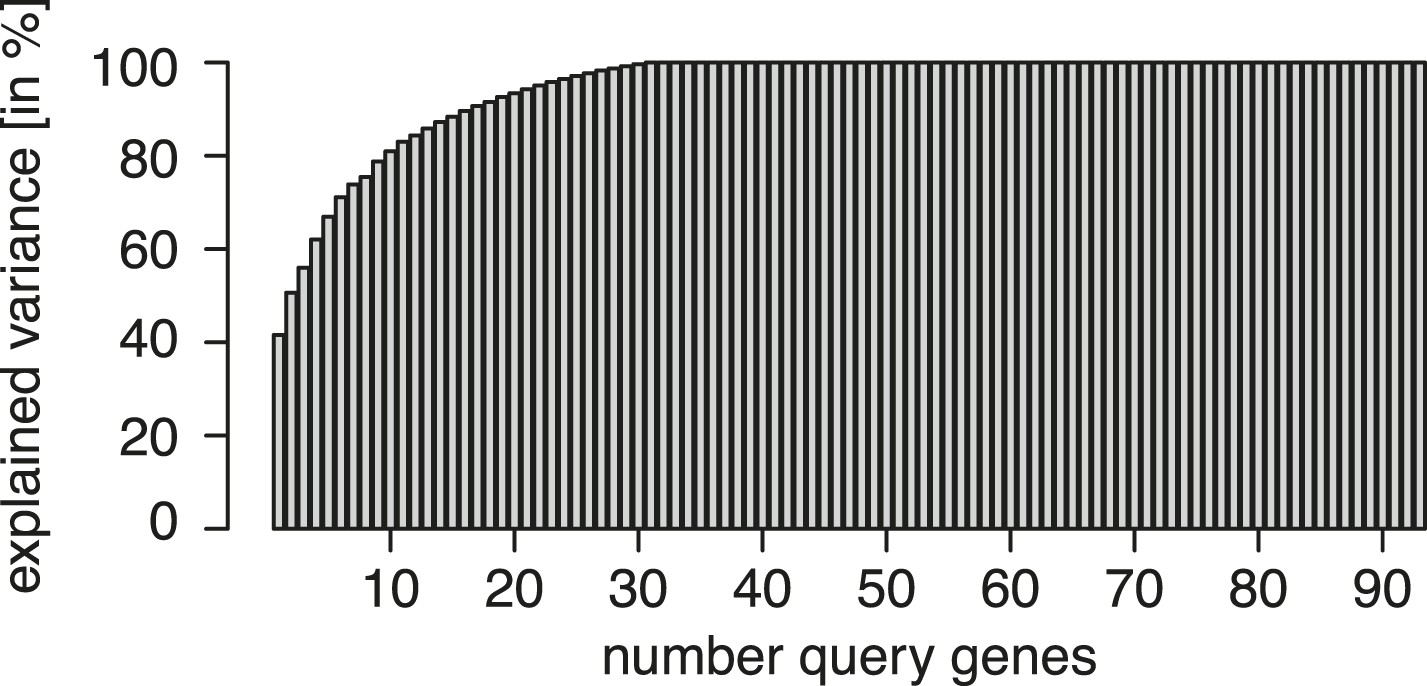
Re-analysis of the multi-parametric genetic interaction data set of Horn et al. (2010), a square matrix of all pairwise combinations of 93 genes. Matrix columns (playing the role of query genes) were ordered from left to right according to their ability to explain the data in the remaining columns. The explained variance is shown on the y-axis as a function of the number of query genes. The graph illustrates that already 17 suitably selected query genes are sufficient to explain 90% of the variance in the data.
Figure 1—figure supplement 2
Selection of query genes.
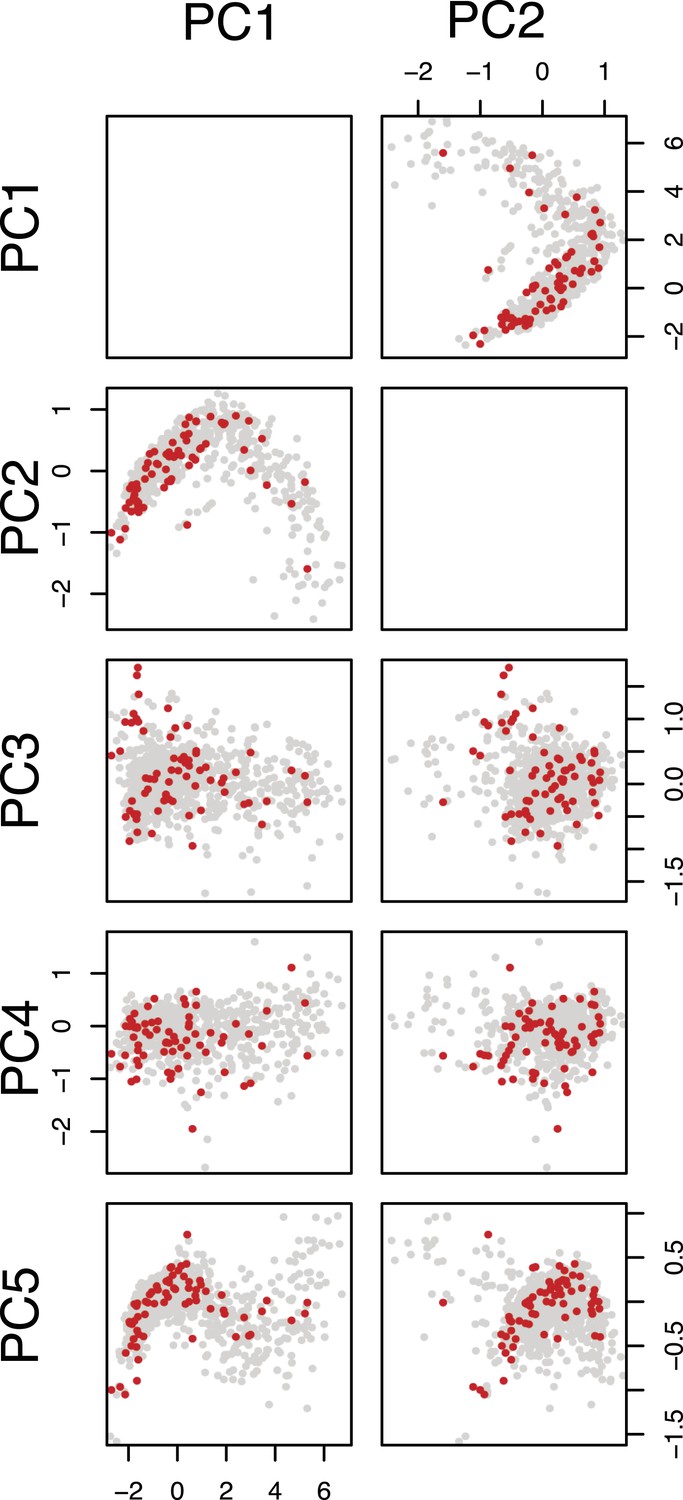
Pairwise scatter plots of the first five principal components of the feature space (multivariate phenotypes) of the single-dsRNA effects against all target genes are shown. The genes selected as query genes are coloured in red.
Figure 1—figure supplement 3
Comparison of phenotypes.
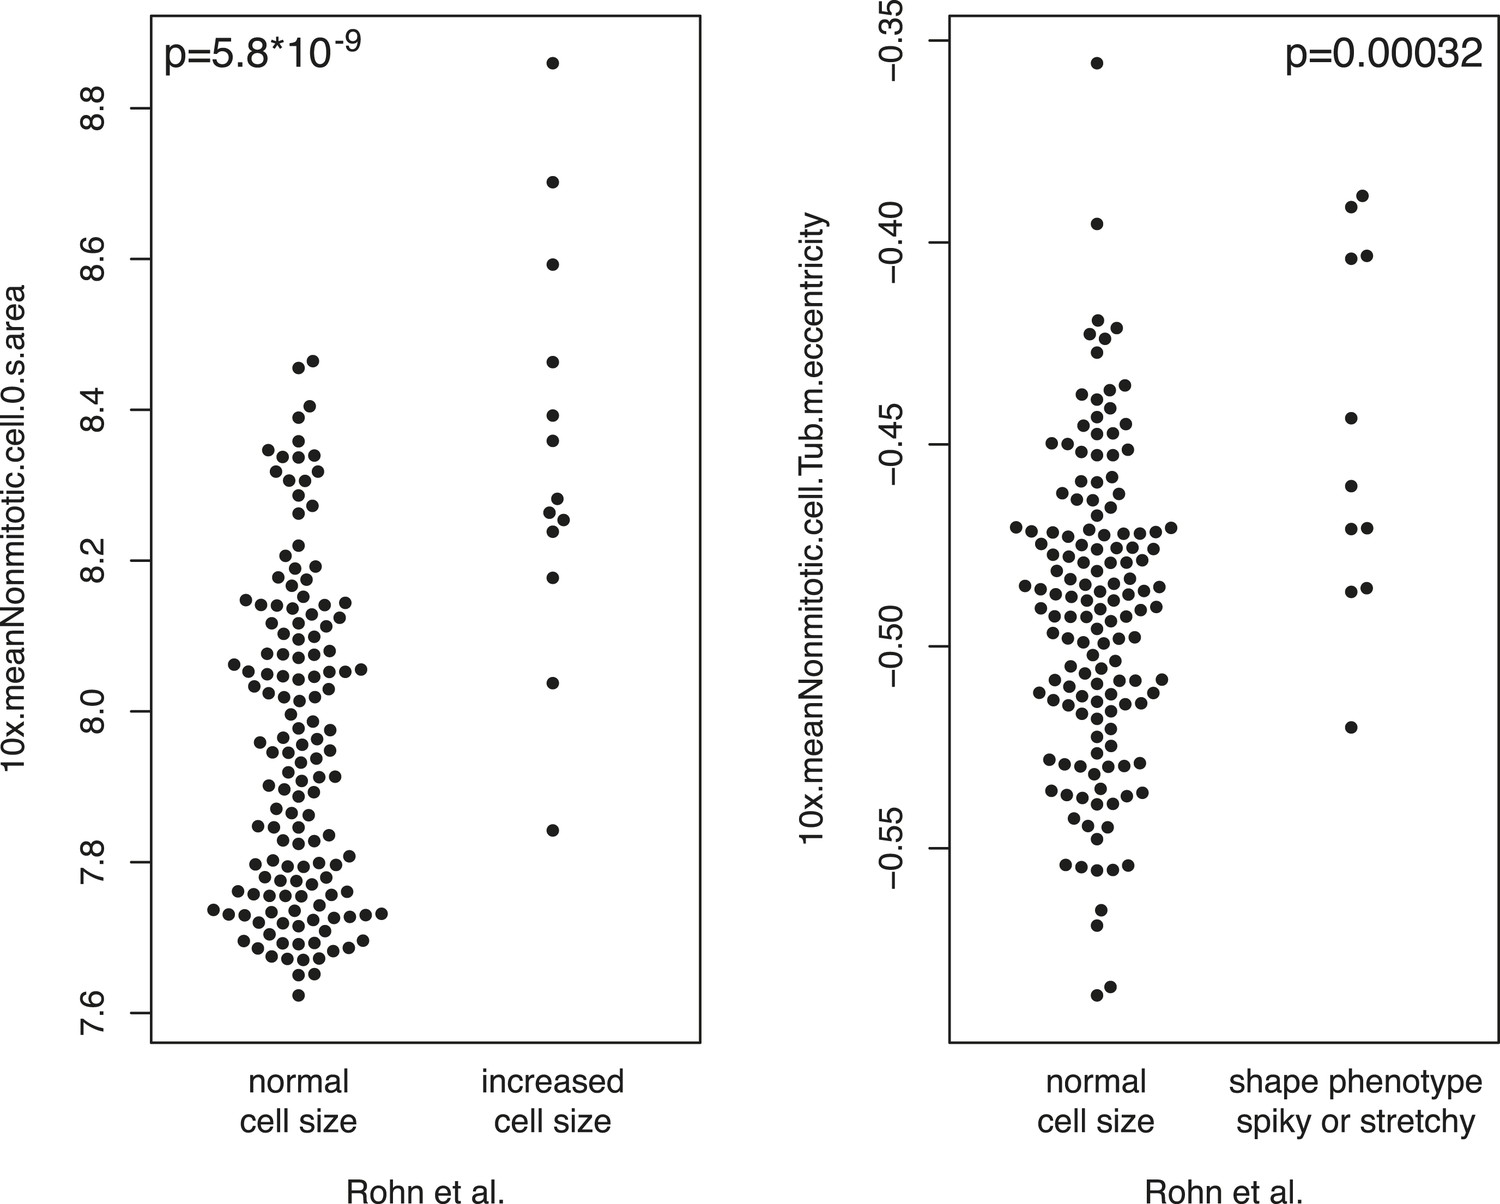
The measured single gene phenotypes were compared between this study and the study by Rohn et al. (2011) on the overlapping set of genes. The y-axis shows single gene phenotypes of this study. The x-axis shows the categorical phenotypes of Rohn. Statistical significance was computed by anova (F-test).
Figure 2
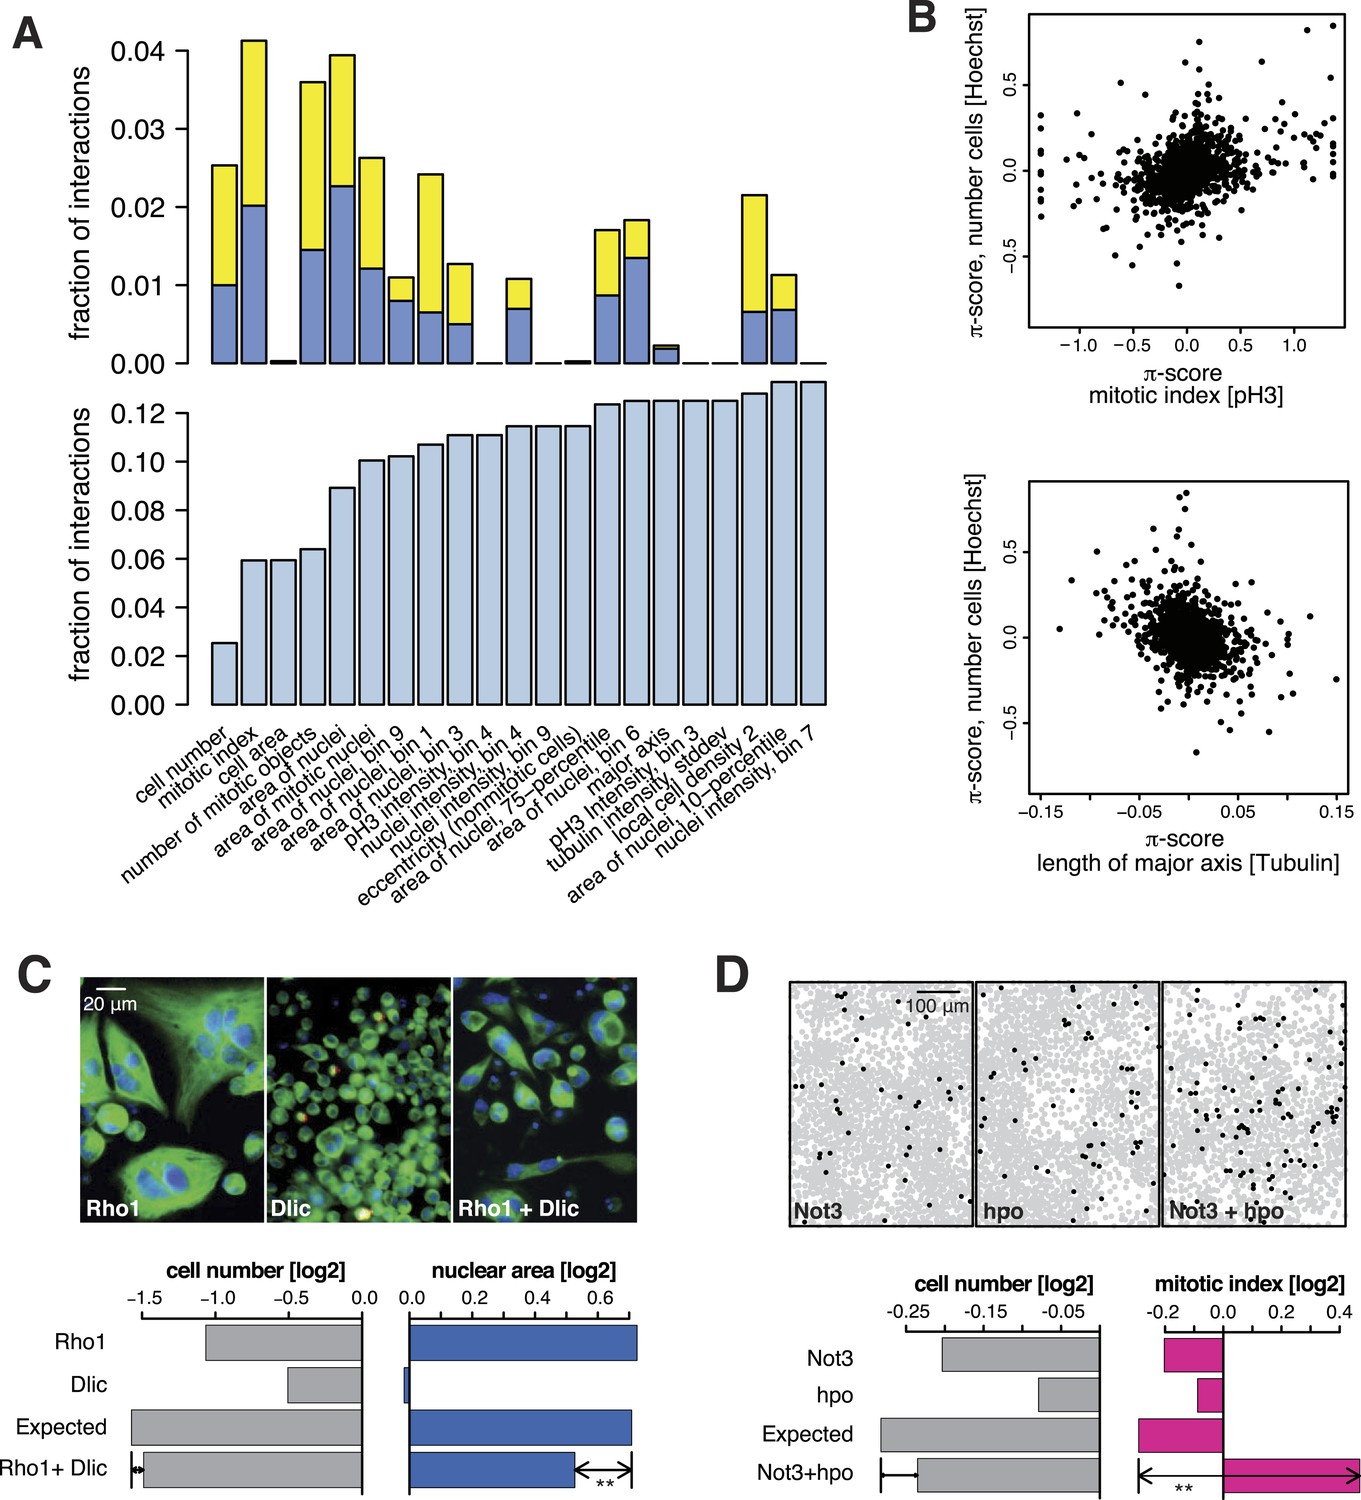
Genetic interactions across multiple phenotypes.
(A) On top, the fraction of genetic interactions over all gene pairs (at FDR 0.01) for each feature is shown. Blue: negative interactions, yellow: positive interactions. The lower panel shows the cumulative distribution of genetic interactions. The kth bar shows the fraction of gene pairs that show a genetic interaction in at least one of the first k features. (B) Genetic interactions for different phenotypes were non-redundant. Plots compare genetic interactions affecting cell number, mitotic index and length of major cell axis. (C and D) Many genetic interactions were phenotype-specific. Interactions at a FDR of 0.01 for a moderated t-test (See ‘Materials and methods’) are marked by (**). Images in (C) show cells after RNAi of Rho1 (left), Dlic (center) and both together (right). Bar charts show single-gene effects, effects expected without a genetic interaction, and effects observed by the double-RNAi. Images in (D) show cell centres identified by image analysis after RNAi of Not3 (left), hpo (center) and both (right). Black and grey colours indicate whether a cell was pH3-positive or negative (mitotic state).
Figure 3 with 2 supplements

A landscape of statistical genetic interactions.
(A) Correlation network of genetic interaction profiles. Pearson correlation coefficients were computed for each pair of genes using the profile of all genetic interactions of these two genes to all other genes in all phenotypic features. An edge is drawn in the graph for each gene pair with correlation coefficient ≥0.6. Genes were placed by a graph layout algorithm (Fruchtermann–Reingold). Genes with similar genetic interaction profiles are proximal. The colour code depicts different biological processes that were separated by the correlation network. (B) Subgraphs of the correlation graph shown in Figure 2 highlight the wiring within and between the annotated complexes.
Figure 3—figure supplement 1
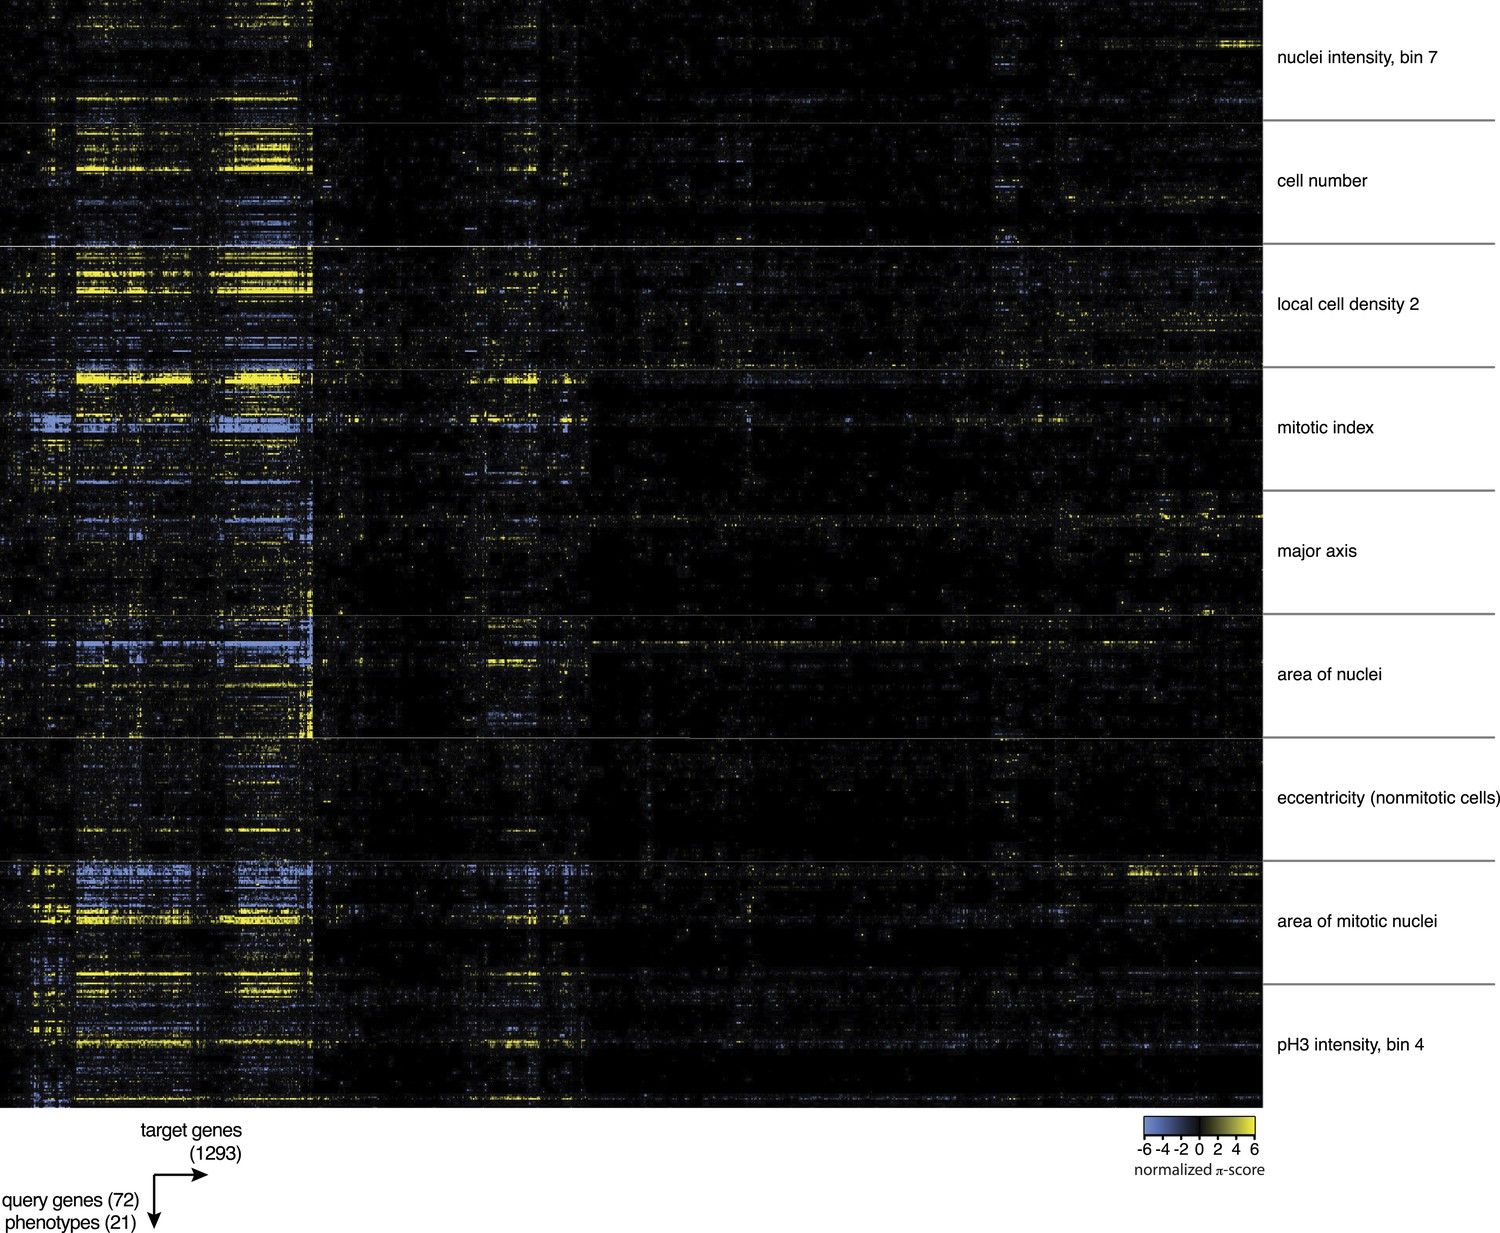
Heatmap of multi-parametric genetic interactions.
Heatmap of all interaction coefficients between 1293 target genes and 72 query genes for nine of the phenotypic features. Blue colour indicates negative genetic interactions and yellow are positive genetic interactions.
Figure 3—figure supplement 2
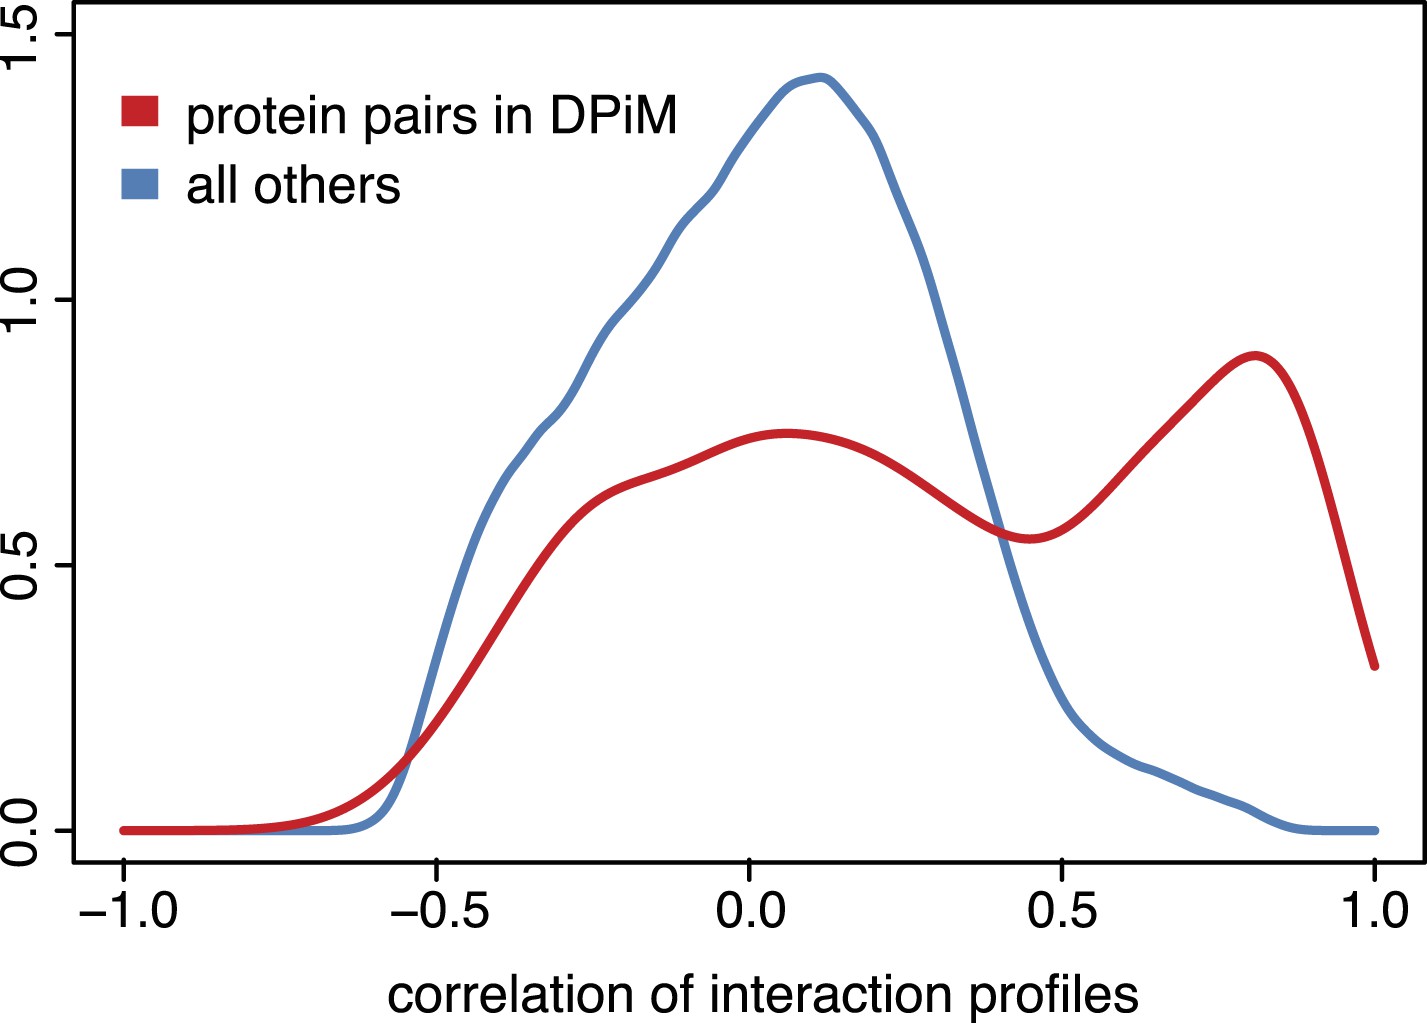
Genetic interaction profiles and protein complexes.
Distribution of pairwise Pearson correlation coefficients across 21 phenotypes for gene pairs detected by co-purification and mass spectrometry according to the DPiM dataset (Guruharsha et al., 2011) (red line) and for all other gene pairs (blue line).
Figure 4 with 2 supplements

Deriving directional genetic interactions.
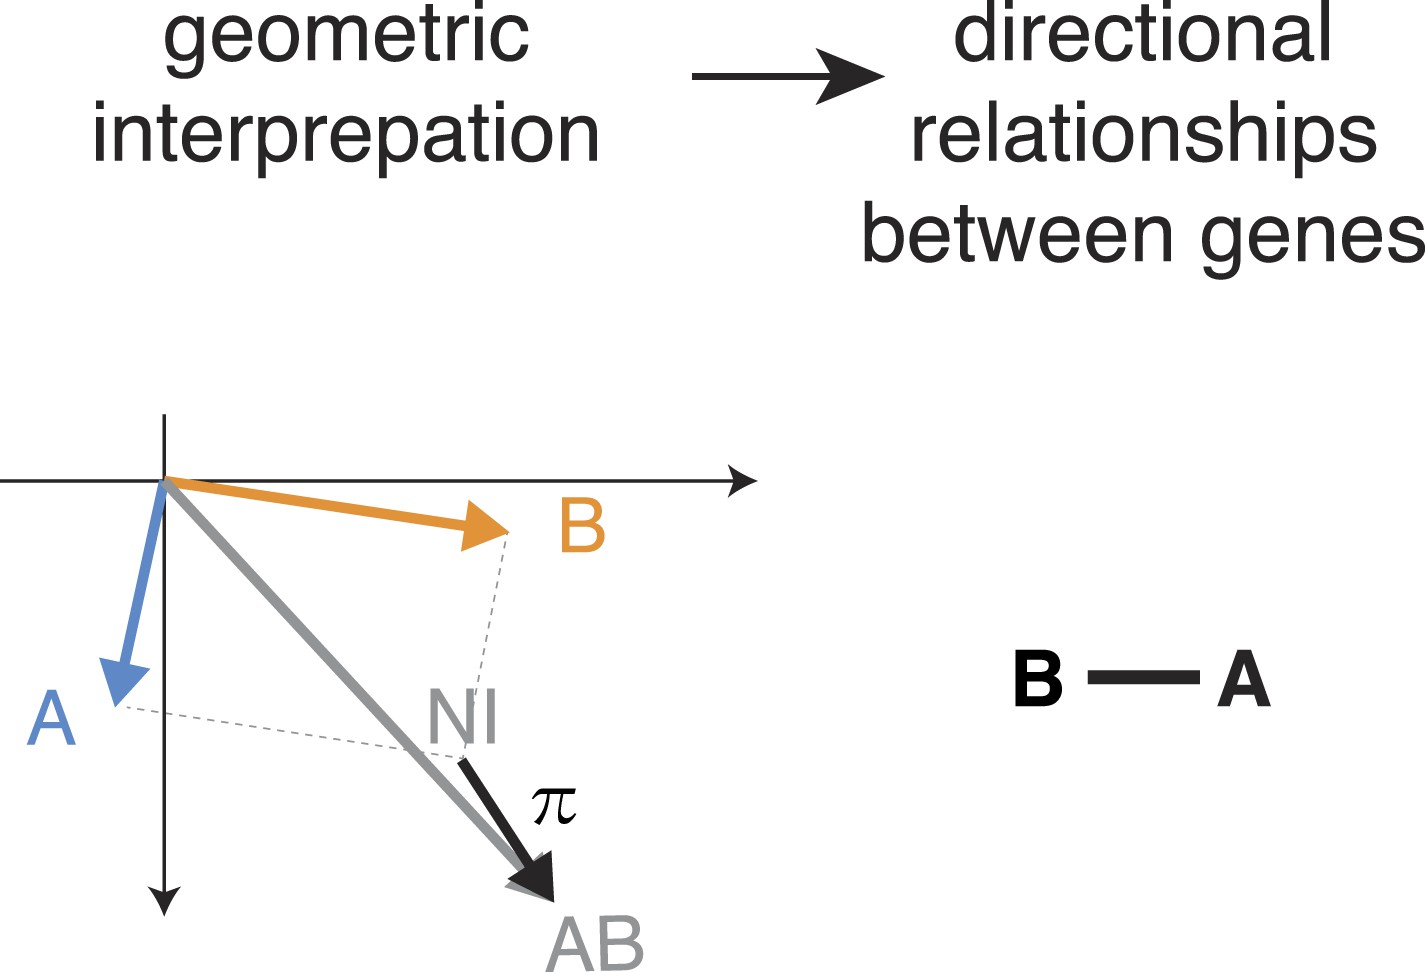
(A) Multiparametric phenotypes are extracted for single and double knockdowns. Genetic interaction scores are computed for each double knockdown experiment. The schematic plots in the third column show the model for identifying directional genetic interactions between gene A and gene B using two exemplary phenotypes. The single knockdown phenotypes of genes A and B and the measured double knockdown phenotypes (AB) are depicted as arrows. The expected double knockdown phenotype for non-interacting (NI) genes, which is the sum of the single gene effects, is depicted by the symbol NI. Black arrows depict the genetic interaction π. The first row shows the case where genes A and B are not interacting. Below, four types of interaction between the genes A and B are shown: gene A is alleviating to gene B, gene A is aggravating to gene B; and in reverse, B alleviates or aggravates gene A. Whenever the genetic interaction (black arrows) is parallel or anti- parallel to one of the single gene effects, a directional genetic interaction is called. (B–D) A directional interaction detected between Cdc23 and sti. (C) The two orange and two blue arrows show the phenotypes (nuclei area and cell number) of the two dsRNAs designed for sti and Cdc23. The grey dots show the expected double knockdown effect for the two genes. The black arrows, indicating the genetic interaction, are directed opposite to the phenotype of sti, indicating that functional Cdc23 is required for the phenotype of sti. (D) Graphical annotation of the detected alleviating epistasis from Cdc23 to sti as shown in (B–C).
Figure 4—figure supplement 1
Directed genetic interactions.
Example when a direction of the genetic interaction is not determined. The pairwise interaction (π) is not parallel to one of the single gene effects.
Figure 4—figure supplement 2
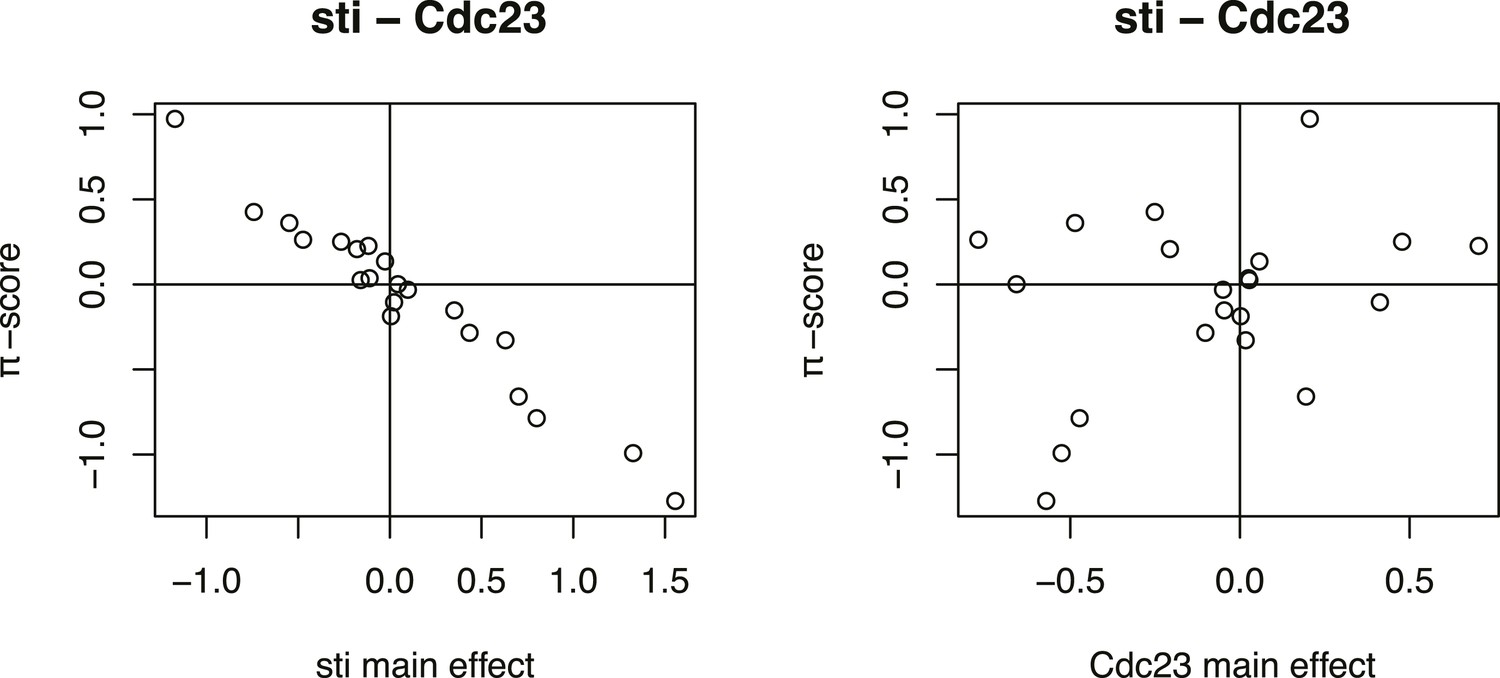
Inference of directed genetic interaction of Cdc23 and sti.
Testing for directed genetic interactions for the gene pair Cdc23 and sti. Fit of the 21-dimensional π-score vector as linear function of the single gene effects. Each dot shows the π-score and single gene effect in one phenotype. The π-scores are negatively correlated to the single gene effects of sti, indicating that the knockdown phenotypic effect of sti is strongly reduced by a depletion of Cdc23.
Figure 5
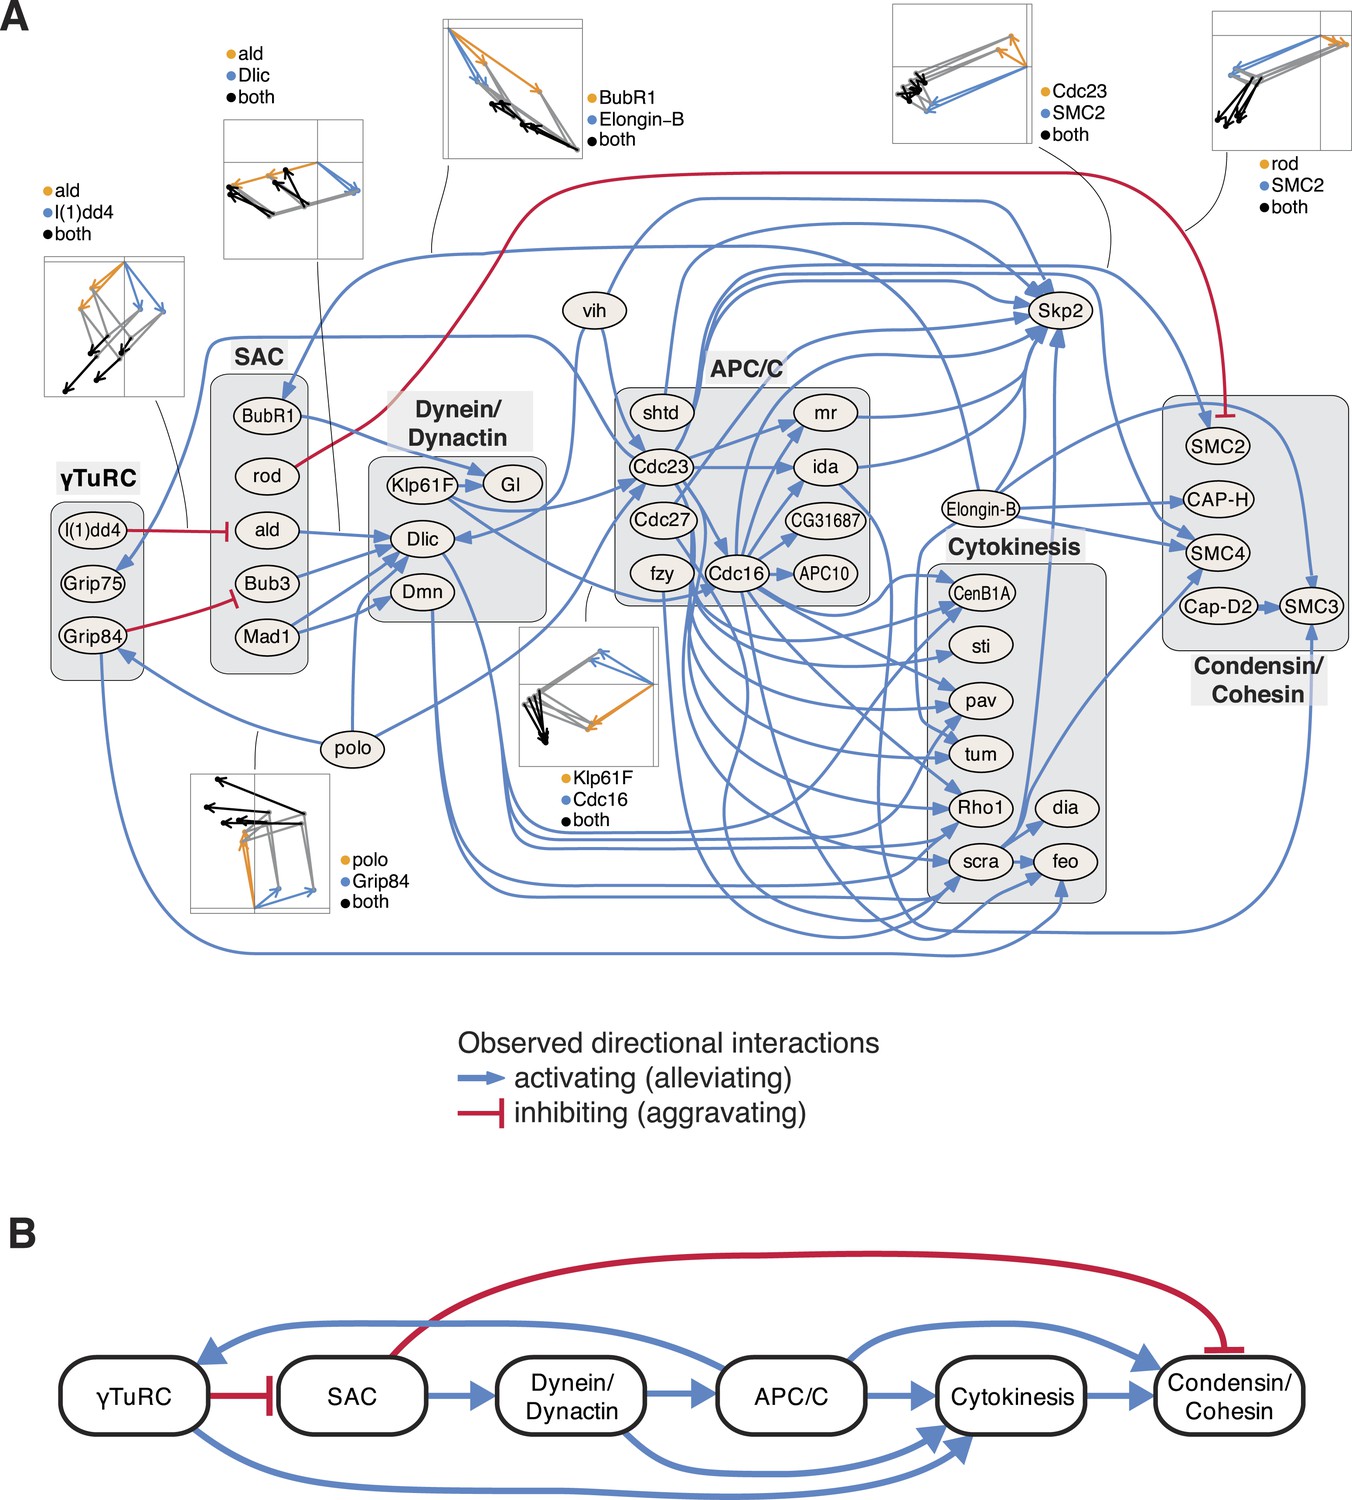
An epistatic network of mitotic genes.
(A) Graph showing data-derived epistatic interactions of genes that are key regulators of cell cycle events, including polo, and members of the γTuRC, SAC, APC/C, the dynein/dynactin complex, sister chromatid cohesion complexes and cytokinesis genes. Blue arrows show alleviating epistatic interactions and red arrows show aggravating epistatic interactions. Exemplarily, the underlying data is shown for epistatic interactions. (B) Epistatic network of complexes that regulate mitotic events, as derived from the epistatic interactions between the members of the complexes.
Figure 6 with 1 supplement
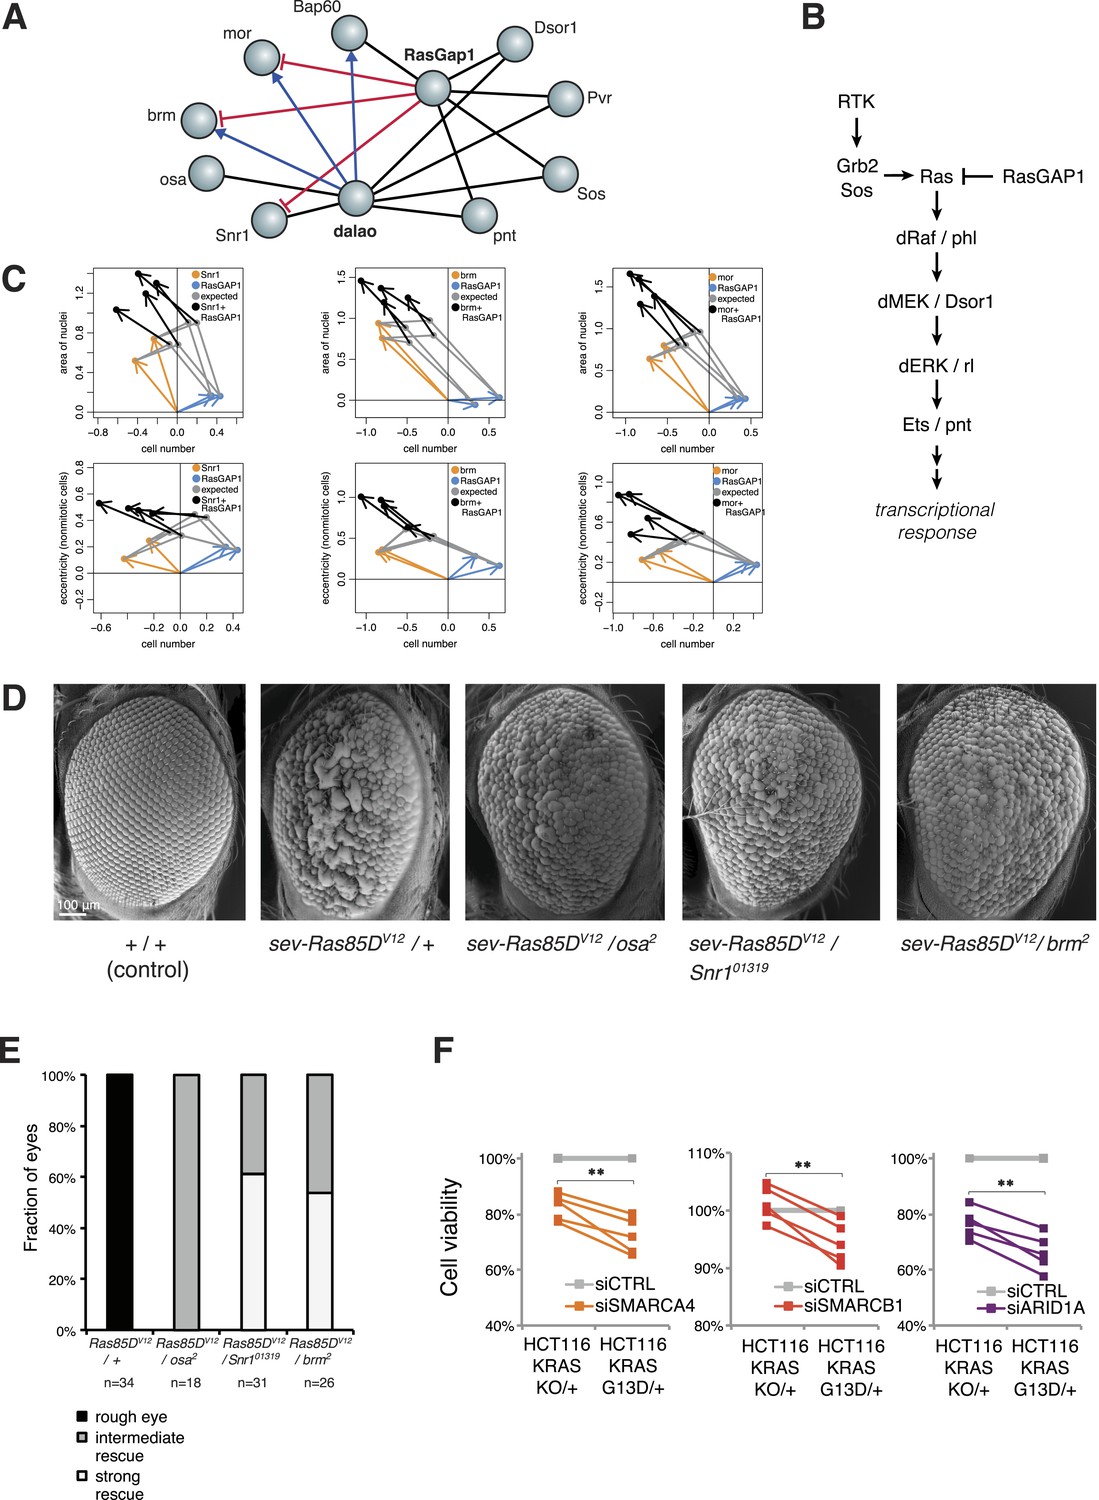
Genetic interactions between Ras signalling and chromatin remodelling.
(A) Edges show the detected genetic interactions in the interaction screen of members of the SWI/SNF complex with RasGAP1 and members of the Ras pathway. An edge is drawn if a significant interaction (FDR 0.01) was detected for at least one phenotype. Edges with attributed epistatic interactions are shown in blue (alleviating epistasis) and red (aggravating epistasis). Black edges indicate gene pairs for which a genetic interaction was detected, but directionality could not be assigned. (B) Scheme of the Ras/MAP kinase pathway. RasGAP1 inhibits the activity of the pathway by catalysing the intrinsic GTPase activity of Ras. (C) Exemplary the cell number, area of nuclei and eccentricity phenotypes are shown that guide the directionality estimate. Blue arrows indicate the RasGap1 phenotype, the SWI/SNF phenotype is depicted by orange arrows and the black arrows show the genetic interaction between SWI/SNF and RasGap1. (D) In vivo validation of genetic interaction of SWI/SNF and constitutively active Ras85D. From left to right: Normal eye in wild type flies (Oregon-R, +/+). Rough eye phenotype upon expression of Ras85DV12 under the sevenless promotor (sev-Ras85DV12/+). Strong rescue after heterozygous removal of the SWI/SNF complex members osa (sev-Ras85DV12/osa2), Snr1 (sev-Ras85DV12/Snr101319) and brm (sev-Ras85DV12/brm2). (E) Quantification of the rescue of the rough eye phenotype. Black colour: expression of Ras85DV12 in the eye of otherwise wild-type flies results in a rough eye phenotype. Grey to white colour scale shows the strength of the rescue of the rough eye phenotype in flies expressing Ras85DV12 in the eye and with heterozygous mutants of SWI/SNF complex members osa (sev-Ras85DV12/osa2), Snr1 (sev-Ras85DV12/Snr101319) and brm (sev-Ras85DV12/brm2). (F) Cell viability of isogenic HCT116 cells 96 hr after siRNA against members of the SWI/SNF complex (SMARCA4, SMARCB1, and ARID1A). Right: parental HCT116 KRAS mutant cells (KRASG13D/+); left: isogenic cell line HCT116 KRAS wt (KRASKO/+). The experiment was performed in four biological replicates.
Figure 6—figure supplement 1
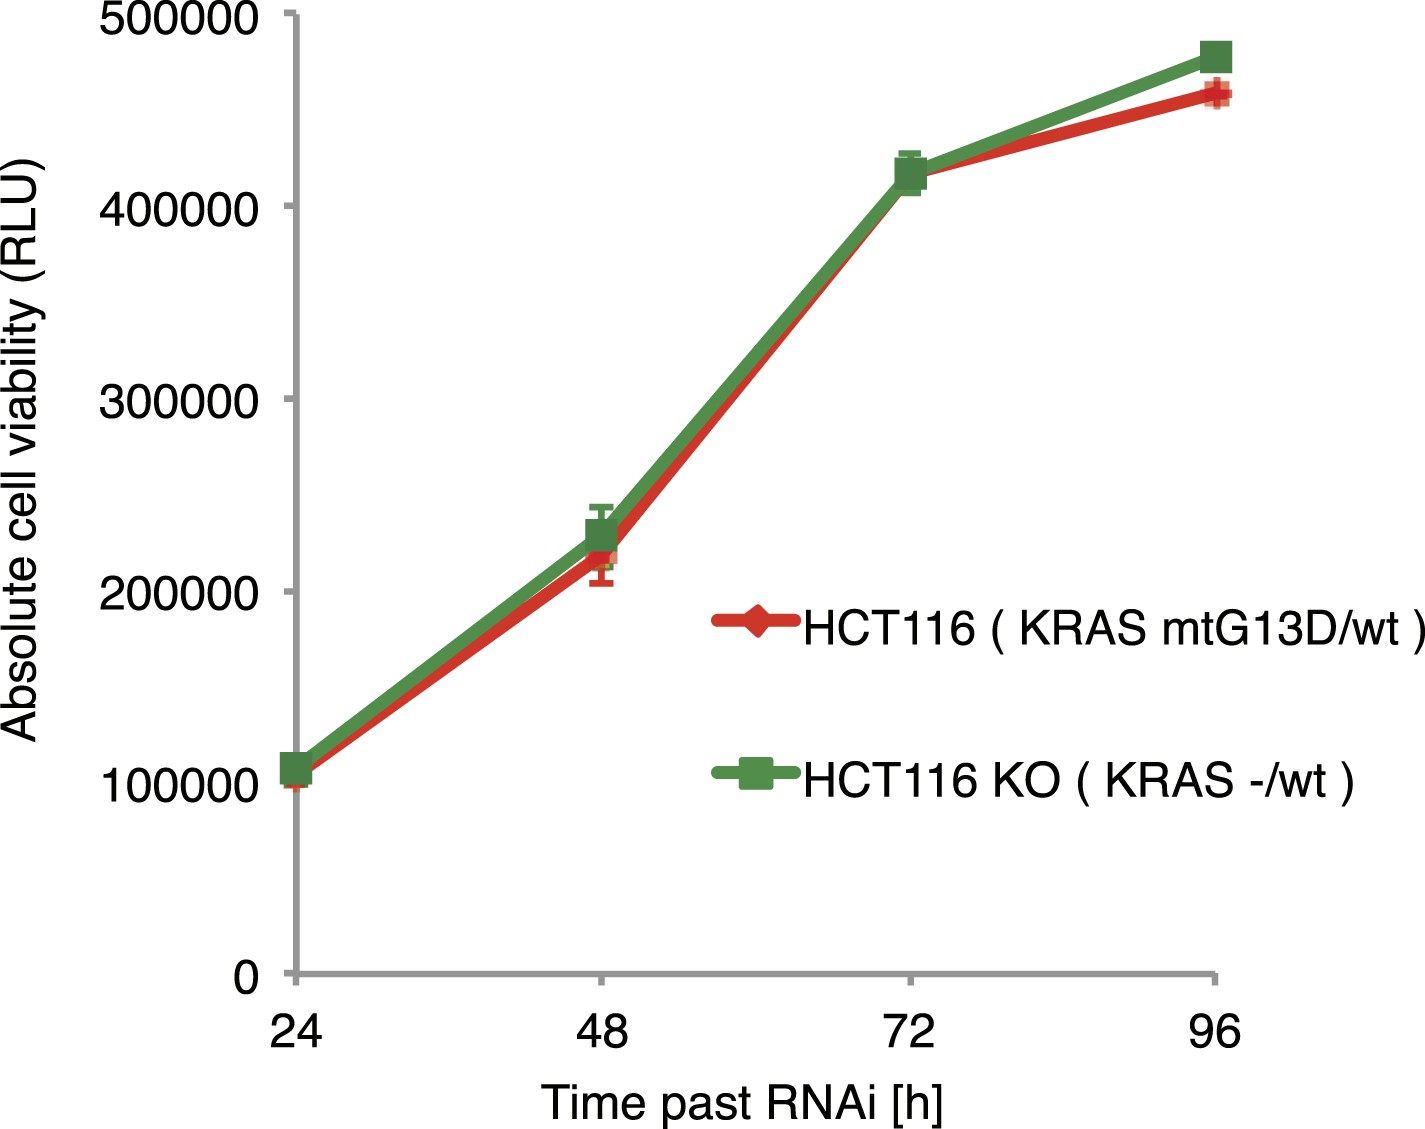
Ras-induced cell growth requires SWI/SNF complex function.
Cell viability of parental HCT116 KRAS mutant cells (KRASG13D/+) and isogenic HCT116 KRAS wild type cells (KRASKO/+).
Figure 7

Recurrently mutated genes.
(A–E) Subnetworks showing detected directional genetic interactions of recurrently mutated cancer genes. Recurrently mutated genes as reported by Tamborero et al. (2013) are coloured dark. Red arrows depict aggravating interactions and blue arrows depict alleviating interactions.
Tables
Table 1
siRNAs
| Gene | Target sequence | Cat # |
|---|---|---|
| CTRL/control | SIGENOME NON TARGET POOLNO2 | D-00120614-20 |
| ARID1A | GCAACGACAUGAUUCCUAU | MU-017263-01 (siGENOME) D-017263-01 |
| ARID1A | GAAUAGGGCCUGAGGGAAA | MU-017263-01 (siGENOME) D-017263-02 |
| ARID1A | AGAUGUGGGUGGACCGUUA | MU-017263-01 (siGENOME) D-017263-03 |
| ARID1A | UAGUAUGGCUGGCAUGAUC | MU-017263-01 (siGENOME) D-017263-04 |
| SMARCA4 | GAAAGGAGCUGCCCGAGUA | MU-010431-00 (siGENOME) D-010431-01 |
| SMARCA4 | CCAAGGAUUUCAAGGAAUA | MU-010431-00 (siGENOME) D-010431-02 |
| SMARCA4 | GAAAGUGGCUCAGAAGAAG | MU-010431-00 (siGENOME) D-010431-03 |
| SMARCA4 | AGACAGCCCUCAAUGCUAA | MU-010431-00 (siGENOME) D-010431-04 |
| SMARCB1 | GAAACUACCUCCGUAUGUU | MU-010536-01 (siGENOME) D-010536-01 |
| SMARCB1 | CCACAACCAUCAACAGGAA | MU-010536-01 (siGENOME) D-010536-02 |
| SMARCB1 | GUGACGAUCUGGAUUUGAA | MU-010536-01 (siGENOME) D-010536-03 |
| SMARCB1 | AGACCUACGCCUUCAGCGA | MU-010536-01 (siGENOME) D-010536-04 |
Additional files
-
Supplementary file 1
A table of primer and dsRNA sequences for all targeted genes.
- https://doi.org/10.7554/eLife.05464.019
-
Supplementary file 2
A table of query genes.
- https://doi.org/10.7554/eLife.05464.020
-
Supplementary file 3
A table of extracted features.
- https://doi.org/10.7554/eLife.05464.021
-
Supplementary file 4
A table of selected non-redundant features.
- https://doi.org/10.7554/eLife.05464.022
-
Supplementary file 5
A table of genes passed quality control.
- https://doi.org/10.7554/eLife.05464.023
-
Supplementary file 6
A table of directed genetic interactions.
- https://doi.org/10.7554/eLife.05464.024
-
Source code 1
Documented source code for reproducing all figures and tables.
- https://doi.org/10.7554/eLife.05464.025
Download links
A two-part list of links to download the article, or parts of the article, in various formats.
Downloads (link to download the article as PDF)
Open citations (links to open the citations from this article in various online reference manager services)
Cite this article (links to download the citations from this article in formats compatible with various reference manager tools)
A map of directional genetic interactions in a metazoan cell
eLife 4:e05464.
https://doi.org/10.7554/eLife.05464


