Transcriptomic studies reveal a key metabolic pathway contributing to a well-maintained photosynthetic system under drought stress in foxtail millet (Setaria italica L.)
- Published
- Accepted
- Subject Areas
- Molecular Biology, Plant Science
- Keywords
- co-regulation network, drought tolerance, photosynthesis, RNA sequencing, foxtail millet (Setaria italica L.)
- Copyright
- © 2018 Shi et al.
- Licence
- This is an open access article distributed under the terms of the Creative Commons Attribution License, which permits unrestricted use, distribution, reproduction and adaptation in any medium and for any purpose provided that it is properly attributed. For attribution, the original author(s), title, publication source (PeerJ Preprints) and either DOI or URL of the article must be cited.
- Cite this article
- 2018. Transcriptomic studies reveal a key metabolic pathway contributing to a well-maintained photosynthetic system under drought stress in foxtail millet (Setaria italica L.) PeerJ Preprints 6:e26860v1 https://doi.org/10.7287/peerj.preprints.26860v1
Abstract
Drought stress is one of the most important abiotic factors limiting crop productivity. A better understanding of the effects of drought on millet (Setaria italica L.) production, a model crop for studying drought tolerance, and the underlying molecular mechanisms responsible for drought stress responses is vital to improvement of agricultural production. In this study, we exposed the drought resistant F1 hybrid, M79, and its parental lines E1 and H1 to drought stress. Subsequent physiological analysis demonstrated that M79 showed higher photosynthetic energy conversion efficiency and drought tolerance than its parents. A transcriptomic study using leaves collected six days after drought treatment, when the soil water content was about ~20%, identified 3066, 1895, and 2148 differentially expressed genes (DEGs) in M79, E1 and H1 compared to the respective untreated controls, respectively. Further analysis revealed 17 Gene Ontology (GO) enrichments and 14 Kyoto Encyclopedia of Genes and Genomes (KEGG) pathways in M79, including photosystem II (PSII) oxygen-evolving complex, peroxidase (POD) activity, plant hormone signal transduction, and chlorophyll biosynthesis. Co-regulation analysis suggested that these DEGs in M79 contributed to the formation of a regulatory network involving multiple biological processes and pathways including photosynthesis, signal transduction, transcriptional regulation, redox regulation, hormonal signaling, and osmotic regulation. RNA-seq analysis also showed that some photosynthesis-related DEGs were highly expressed in M79 compared to its parental lines under drought stress. These results indicate that various molecular pathways, including photosynthesis, respond to drought stress in M79, and provide abundant molecular information for further analysis of the underlying mechanism responding to this stress.
Author Comment
This is a submission to PeerJ for review.
Supplemental Information
Descriptive statistical analysis of RNA-seq of 18 samples
GO enrichment analysis of DEGs in M79 and E1 under normal conditions
GO enrichment analysis of DEGs in M79 and H1 under normal conditions
GO enrichment analysis of DEGs in M79 and E1 after drought treatment
GO enrichment analysis of DEGs in M79 and H1 after drought treatment
GO enrichment analysis of DEGs that were up-regulated in all three drought-treated cultivars
GO enrichment analysis of DEGs that were down-regulated in all three drought-treated cultivars
DEGs that were expressed in all three drought-treated cultivars
GO enrichment analysis of M79-specific DEGs after drought stress
GO enrichment analysis of E1-specific DEGs after drought stress
GO enrichment analysis of H1-specific DEGs after drought stress
KEGG analysis of M79-specific DEGs after drought stress
KEGG analysis of E1-specific DEGs after drought stress
KEGG analysis of H1-specific DEGs after drought stress
Functional classification of drought resistance-related DEGs in M79
Pearson correlation coefficients of physiological data and the expression data of photosynthesis-related DEGs
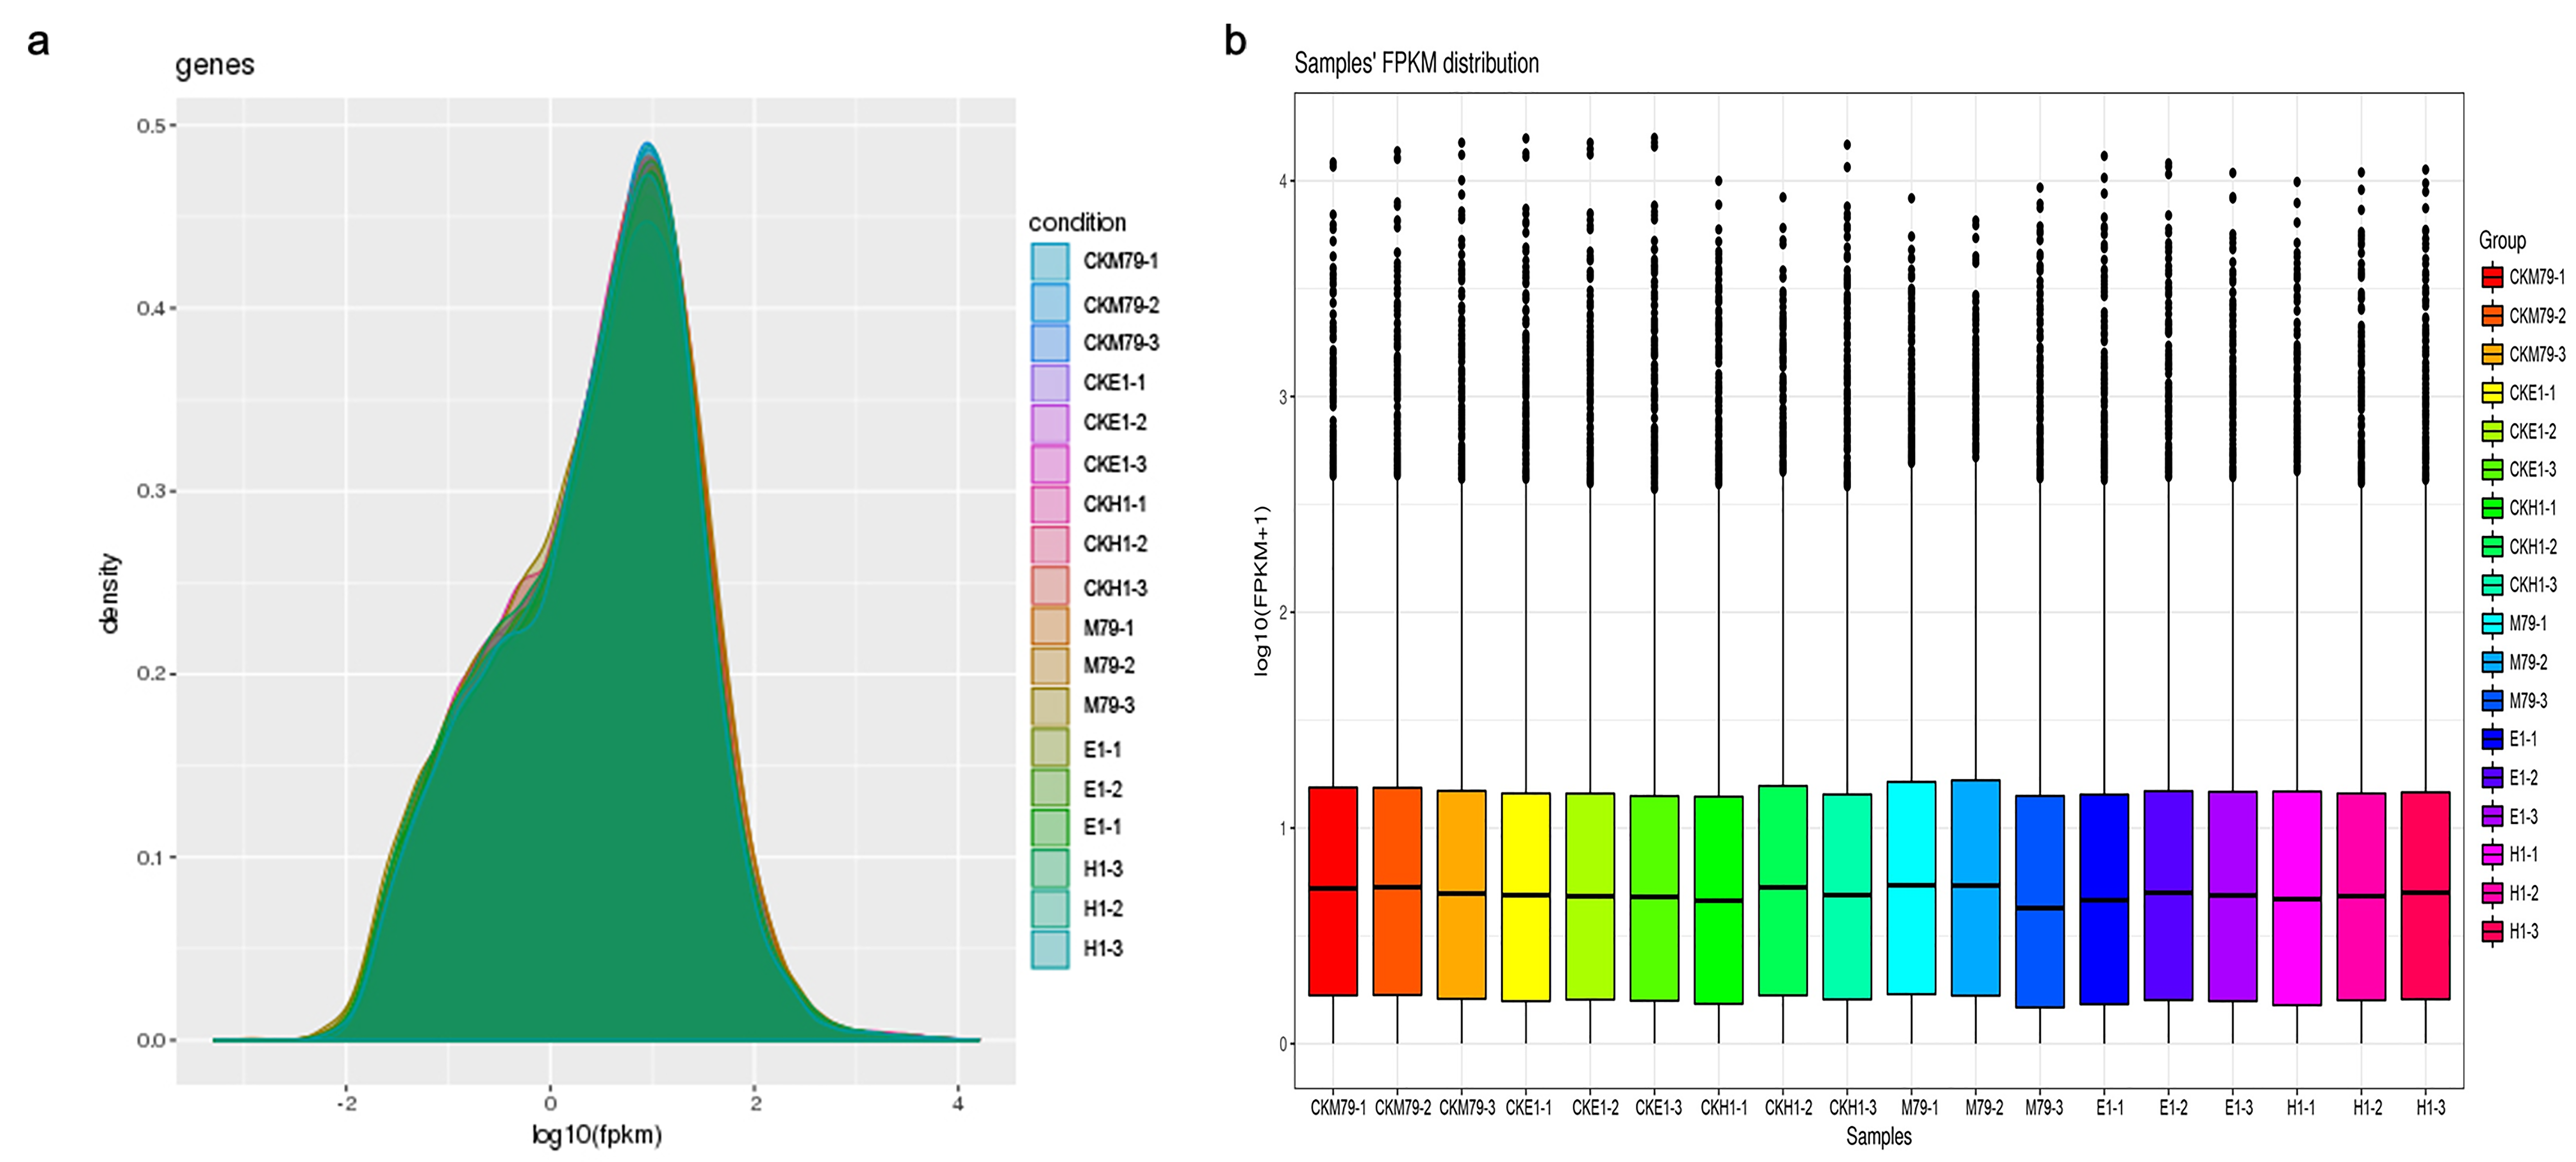
Distribution of gene expression (FPKM) in 18 samples after drought treatment
a: Density distribution; b: box-plot.