


-
Arabica coffee (Coffea arabica), hereinafter referred to as coffee, is an evergreen tree or shrub belonging to the Coffea genus in the Rubiaceae family, and originated from Ethiopia. It was introduced to Europe from Arabia in the 17th century and is now one of the three most popular drinks in the world[1−2]. Coffee is welcomed by consumers for its pleasant flavor, but its sensory qualities are easily affected by the varieties, producing area, processing technology and other factors. Recent research on coffee sensory quality mainly focus on roasting and brewing technology, and there are relatively few research on sterilization methods. Yu et al.[3] found that the roasting speed could affect the aroma and flavor of coffee. Zhi et al.[4] found that the amount of coffee flavor substance was affected by the production area, and the coffee in Panama has a unique flavor. Zhu[5] discussed the influence of brew temperature on the aroma of Colombian coffee, and concluded that low temperature brew coffee had more fruity notes. Kulapichitr et al.[6] studied the fact that heat pump drying helping preserve the overall flavor of Arabica coffee.
Cold brew coffee, made by soaking coffee grind in unheated water for 12 h or more, had a sweeter taste and better flavor. The global cold brew coffee market size is expected to register a CAGR of 25.1% from 2019 to 2025 (valued at USD $339.7 million in 2018)[7]. The processing procedure inevitably causes loss of many flavor components of cold brew coffee[8−9]. Sterilization is a key step during the production of cold brew coffee, and different sterilization methods cause different influence on the flavor of beverages including coffee liquid[10]. Zhang et al.[11] found that ultra-high pressure sterilization can improve the flavor of fermented pear juice, and Cui et al.[12] found that ultrasonic sterilization can better maintain the taste of fruit and vegetable juice. By comparing sterilization methods, it is found that ultrasonic sterilization can better maintain the flavor of fruit and vegetable juice, with little damage to the nutrients. The sterilization methods commonly used can be divided into heat sterilization and non-heat sterilization. The usual heat sterilization technologies are pasteurization and ultra-high temperature sterilization. Pasteurization is commonly used for dairy products and ultra-high temperature sterilization is suitable for products that do not contain granular materials, due to its higher temperature requirements (130−150 °C). Non-heat sterilizations include ultrasonic sterilization, ultra-high pressure sterilization and ultraviolet sterilization[13−15].
This research used five methods to sterilize cold brew coffee, the sterilized coffee was then measured for pH value and concentration of organic acid. The sensory attributes were also analyzed through electronic nose (E-nose) and electronic tongue (E-tongue) combined with sensory evaluation. The results of the research can provide theoretical reference for the production and processing of coffee.
-
The sun-dried green bean of Arabica coffee from Yirgacheffe, Ethiopia was used and was purchased from Kunshan Yiguo International Trade Co., Ltd (Kunshan Development Zone, Suzhou City, Jiangsu Province). Methanol and acetonitrile were HPLC grade solvents and were acquired from TEDIA Co., Ltd (USA). Ultrapure water was used in all experiments.
Methods
Cold-brewing
-
Green coffee beans were roasted to a medium-light degree with a PROBAT roaster and stored at room time for 72 h. The equipment was adjusted to the 5th lever and the roast coffee bean were ground to a powder. Cold brew beverages were extracted by static immersion, using 0−10 °C water to brew for 8−10 h (powder : water = 1:5 − 1:6). The coffee liquid was collected when Brix reached 7.0 (± 0.2).
Sterilization
-
The coffee beverage was then sterilized. The methods used were pasteurization, back pressure sterilization, high pressure short-term sterilization, membrane filtration and high pressure processing. The sterilized coffee was the experimental sample used in this research. The specific process parameters of each sterilization method are shown in Table 1, and the acronyms of each sample will be used for convenience in the following paragraph. The control sample was cold brew beverage without sterilization and was hereinafter referred to as CK.
Table 1. Parameters of each sterilization method.
Category of treatment No. Method Temperature Pressure Duration Notes Sample Heat sterilization 1 Pasteurization 65 °C / 30 min / PS 2 Back pressure sterilization 121 °C 1.5 bar 30 min / BPS 3 High pressure short-term sterilization 110 °C / 5 s / HTS Non-heat sterilization 4 Membrane filtration 25 °C / / Ceramic membrane, 200 μm MF 5 High pressure processing 25 °C 5,000 bar 5 min / HPP pH measurement
-
The coffee was mixed evenly and the pH was measured using a pH meter (FE28, METTLER TOLEDO Co., Switzerland).
Organic acid determination
-
Organic acids were detected by HPLC with a ultraviolet detector (1260, Agilent Technologies Co., Ltd, USA) and were separated using a C18 chromatographic column (4.6 mm × 250 mm, 5 μm, OSAKA SODA CO., Ltd).
(1) Chlorogenic acids compounds
For sample pretreatment please refer to the method in Hu et al.[16]. One to two gram samples were weighed in a 50 mL brown volumetric flask. Thirty millilitres of 30 methanol-0.1% phosphoric acid (50:50, V/V) solution were added, followed by ultrasonic treatment for 20 min. Methanol-0.1% phosphoric acid (50:50, V/V) solution was then added to the volume scale, and filtered through 0.22 μm organic membrane. The samples were then stored at 4 °C in the dark.
The chlorogenic acid concentration was then measured by HPLC, and the parameters are shown in Table 2.
Table 2. Chromatographic parameters for organic acid measurement.
Parameters Chlorogenic acids Tartaric acid, Citric acid, Malic acid,
Succinic acid, Fumaric acidSpeed 1.0 mL/min 0.3 mL/min Column temperature 30 °C 40 °C Wavelength 327 nm 210 nm Moving phase Methanol (A) -0.1% phosphoric acid solution (B) Methanol (A) -0.1% phosphoric acid solution (B) Elution program 0.00−20.00 min: 20%A−80%B
20.01−45.00 min: 35%A−65%B
45.01−55.00 min: 40%A−60%B
55.01−60.00 min: 20%A−80%B0.00−20.00 min: 10%A−90%B
20.01−25.00 min: 100%A
25.01−35.00 min: 10%A−90%B(2) Tartaric acid, malic acid, citric acid, succinic acid, fumaric acid
For sample pretreatment please refer to the method in GB5009.157-2016[17]. 1−2 g samples were weighed in a 50 mL volumetric flask. Thirty millilitres of 0.1% phosphoric acid solution was added, followed by ultrasonic treatment for 20 min. 0.1% phosphoric acid solution was added to the volume scale, then filtered through 0.22 μm organic membrane. The samples were stored at 4 °C in the dark.
The acid concentrations were then measured by HPLC, and the parameters are shown in Table 2.
Volatile Compound (VCs) determination
-
Two gram samples were weighed in a 20 mL headspace bottle, then determined by Ultra-fast E-nose (Heracles NEO, Alpha MOS Co., France)[18].
Taste determination
-
Ten millilitre samples were measured into sample cups, then assesed using the taste sensing system (E-tongue) (TS-5000Z, INSENT Co., Japan).
Sensory evaluation
-
Refered to the SCA coffee cup-testing in Hu et al.[19]. The samples were then assesed from six aspects, such as aroma, flavor, acidity, aftertaste, body, balance and overall taste. The score range of each aspect is between 6−10 points, and each score unit is 0.25 points. Thus, 16 degrees in total.
Statistic analysis
-
The samples for each experiment was measured in triplicate. Raw data was preliminary processed by ExcelTM. Statistical difference was performed at p < 0.05 with Duncan Test in an one-way ANOVA using SPASS 23. Graphs were drawn using Origin 2017 and Photoshop CS5.
-
The results of pH value and organic acid concentration of the samples are shown in Table 3. In the quality evaluation of coffee, pH value is an important index[15]. Organic acids produced during coffee bean roasting, are the main compounds that affect the pH value[20]. The pH value quantifies the concentration of hydrogen ions and provides a metric description for deprotonated acid molecules in the sample. According to Table 3, BPS had lower pH value, and this may relate to the long time heat treatment.
Table 3. pH value and organic acid concentration (g/kg) of each sample.
Sample CK PS BPS HTS MF HPP pH value 4.92 ± 0.006cd 4.89 ± 0b 4.65 ± 0a 4.91 ± 0.006bc 4.93 ± 0.021d 4.9 ± 0.006bc Neochlorogenic acid 1.45 ± 0.07a 1.49 ± 0.02ab 2.13 ± 0.02c 1.47 ± 0.01ab 1.47 ± 0.04ab 1.53 ± 0.02b Chlorogenic acid 3.39 ± 0.18b 3.46 ± 0.06b 2.87 ± 0.04a 3.42 ± 0.02b 3.45 ± 0.09b 3.48 ± 0.04b Cryptochlorogenic acid 1.8 ± 0.09a 1.84 ± 0.03a 2.12 ± 0.03b 1.82 ± 0.01a 1.83 ± 0.04a 1.87 ± 0.02a Isochlorogenic acid A 0.04 ± 0a 0.04 ± 0b 0.04 ± 0b 0.04 ± 0ab 0.04 ± 0b 0.04 ± 0b Isochlorogenic acid B 0 ± 0a 0.01 ± 0.01ab 0.02 ± 0.01ab 0 ± 0ab 0.01 ± 0.01a 0.02 ± 0b Isochlorogenic acid C 0.04 ± 0ab 0.04 ± 0c 0.04 ± 0a 0.04 ± 0bc 0.05 ± 0c 0.04 ± 0c Tartaric acid 6.71 ± 0.35a 6.88 ± 0.11a 7.21 ± 0.09b 6.78 ± 0.04a 6.85 ± 0.18a 6.98 ± 0.08ab Malic acid 5.88 ± 0.56a 5.85 ± 0.14a 6.07 ± 0.33a 5.88 ± 0.23a 5.81 ± 0.09a 5.85 ± 0.18a Citric acid 1.08 ± 0.48a 1.26 ± 0.04a 1.29 ± 0.09a 1.22 ± 0.03a 1.21 ± 0.03a 1.39 ± 0.15a Succinic acid 4.26 ± 0.18a 4.28 ± 0.46a 7.57 ± 0.82b 4.71 ± 0.12a 4.6 ± 0.04a 4.45 ± 0.18a Fumaric acid 0.19 ± 0.16a 0.2 ± 0.18a 0.29 ± 0.25a 0.19 ± 0.17a 0.21 ± 0.18a 0.18 ± 0.16a Total 0.03 ± 0ab 0.03 ± 0ab 0.03 ± 0b 0.03 ± 0a 0.03 ± 0ab 0.03 ± 0ab Different letters in the same row indicated significant difference (p < 0.05) The chromatogram of each organic acid compound standard is shown in Fig. 1a & b, which showed that each compound had been well separated. The regression equation of sample concentration X to peak area Y, and the correlation coefficient R2 (> 0.999) was obtained. CGA is an important nonvolatile substance in coffee, and significantly affects the taste and flavor of coffee. Chlorogenic acid can produce different derivatives and volatile components under different processing conditions, which can affect the sensory quality of coffee[21]. According to Table 3, chlorogenic acid, neochlorogenic acid and cryptochlorogenic acid were the main compounds in CK, and the concentration of isochlorogenic acid was relatively lower. Compared to CK, BPS had higher neochlorogenic acid and cryptochlorogenic acid concentration, but lower chlorogenic acid concentration. It might be that the conditions of back pressure sterilization were more likely to cause the degradation of chlorogenic acid and led to the conversion of chlorogenic acid compounds into isochlorogenic acid and cryptochlorogenic acid compounds. According to Table 3, the citric acid concentration was significantly decreased in BPS, while there was no significant difference in the concentrations of tartaric acid, malic acid, succinic acid and fumaric acid among all the samples.
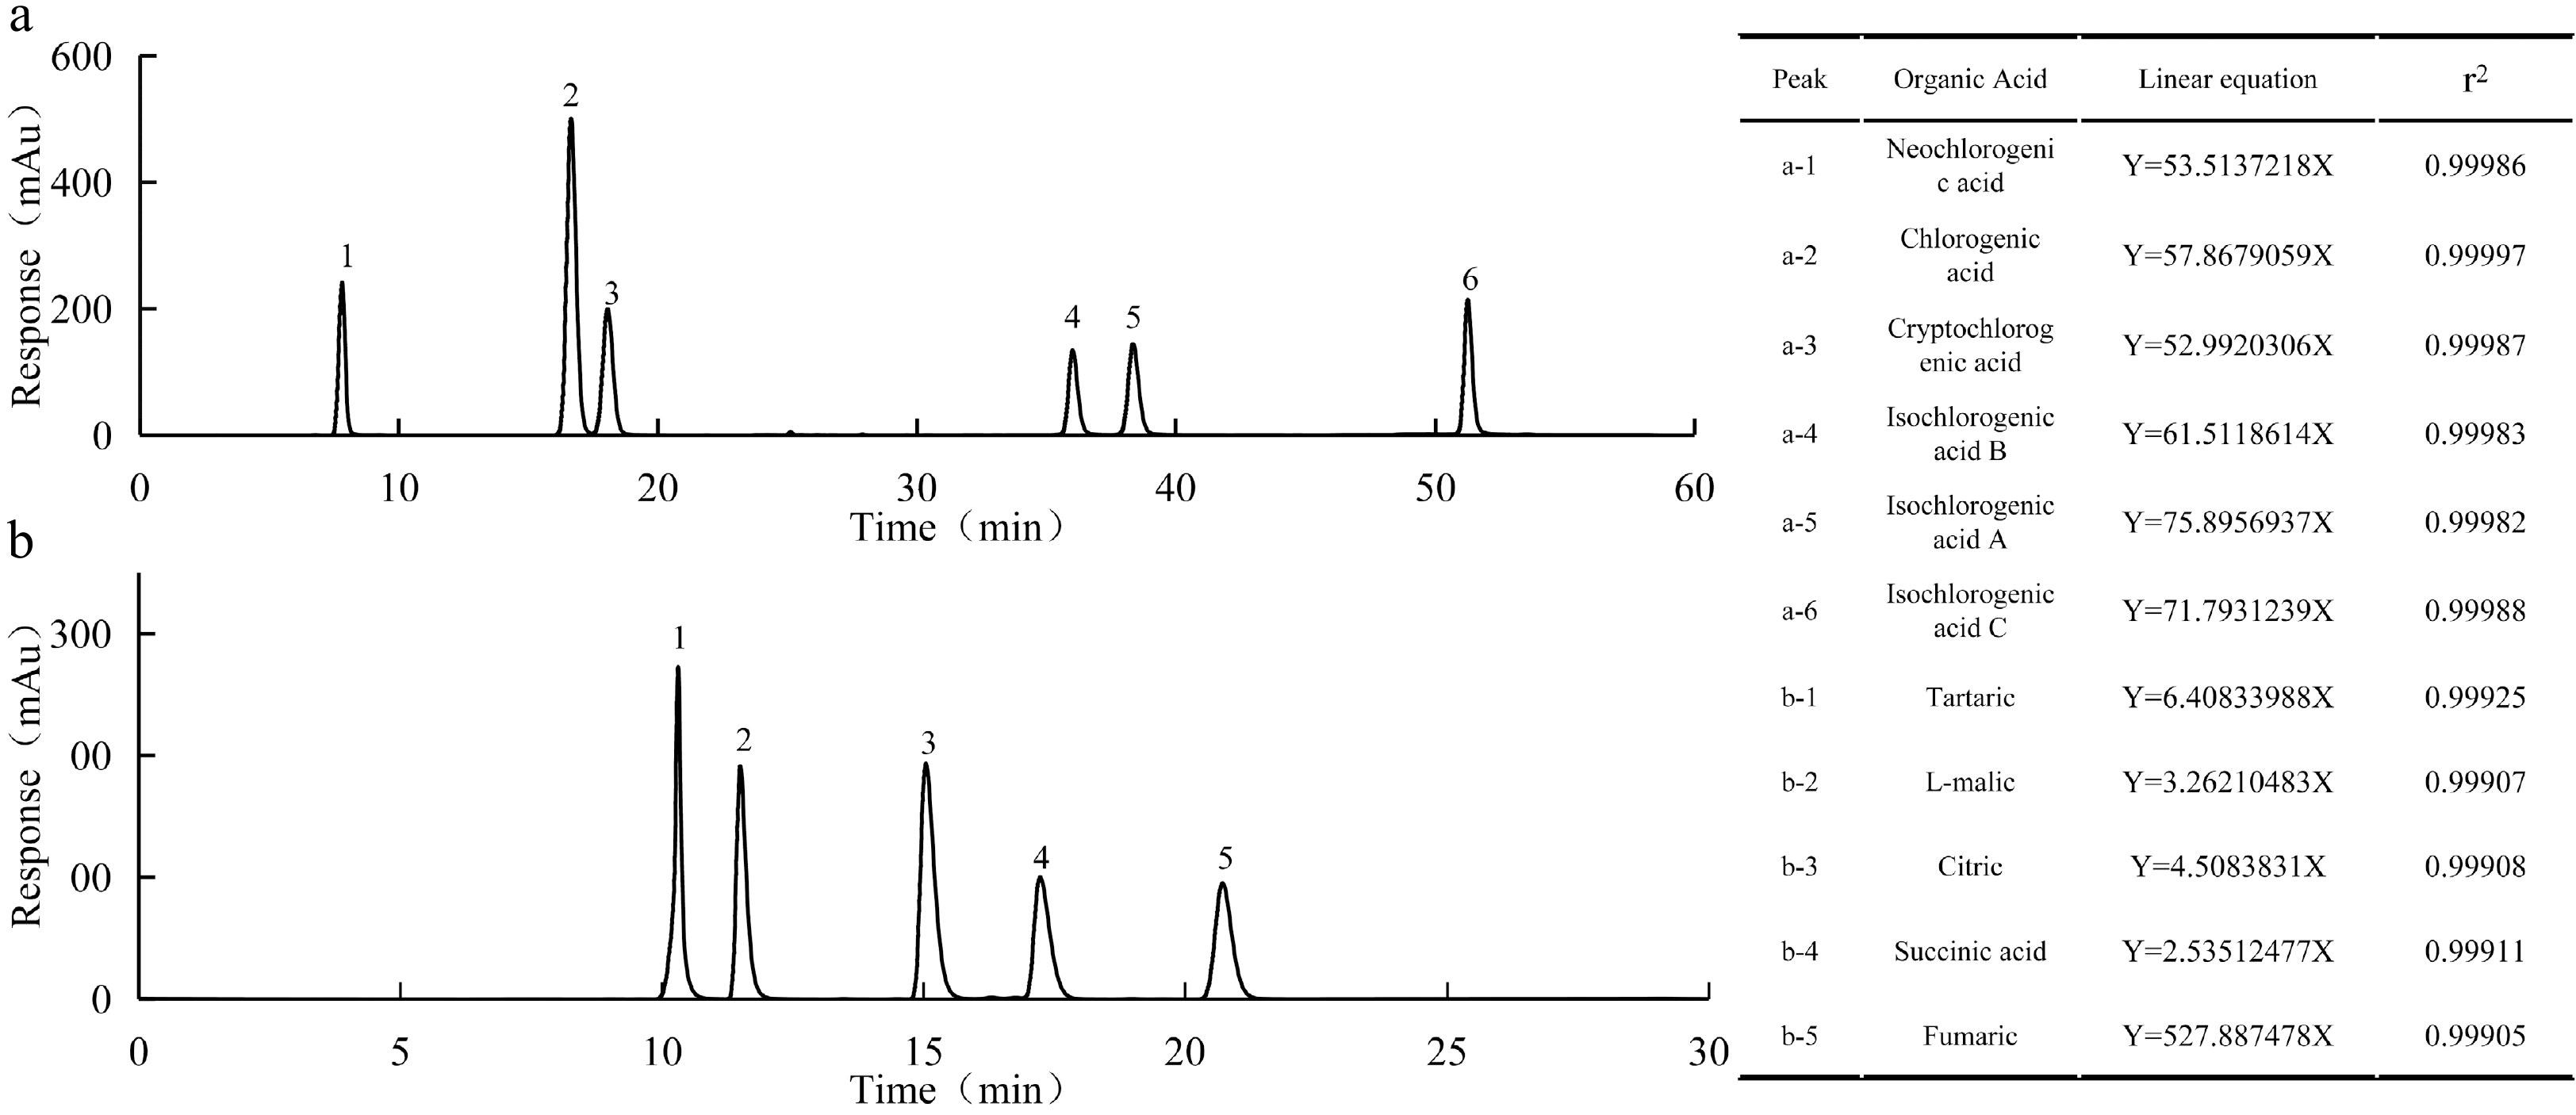
Figure 1. High Performance Liquid Chromatogram of organic acid concentration.
Thus, compared to other sterilization method, back pressure sterilization influenced the pH value and the organic acid concentration of coffee more obviously, and may lower the quality of coffee.
Effect of sterilization on VCs of cold brew coffee
Analysis on chromatograms
-
According to Fig. 2a, the retention time of each peak of the samples were similar, while the intensity of some peaks decreased, which indicated that different sterilization methods may not have a significant effect on the composition of VCs of coffee, but have a negative effect on the concentration of VCs. According to Fig. 2b, all the sterilization methods, except high pressure processing, had a negative influence on the total aroma amount of coffee, especially the back pressure sterilization and pasteurization (decreased by 50.5% and 12.5% respectively). The effect of high temperature sterilization on the total aroma amount of coffee was relatively low (decreased by 8.0%), which had no obvious difference from that of MF. Overall, non-heat sterilization had little effect, as its milder sterilization process conditions led to lower aroma loss.
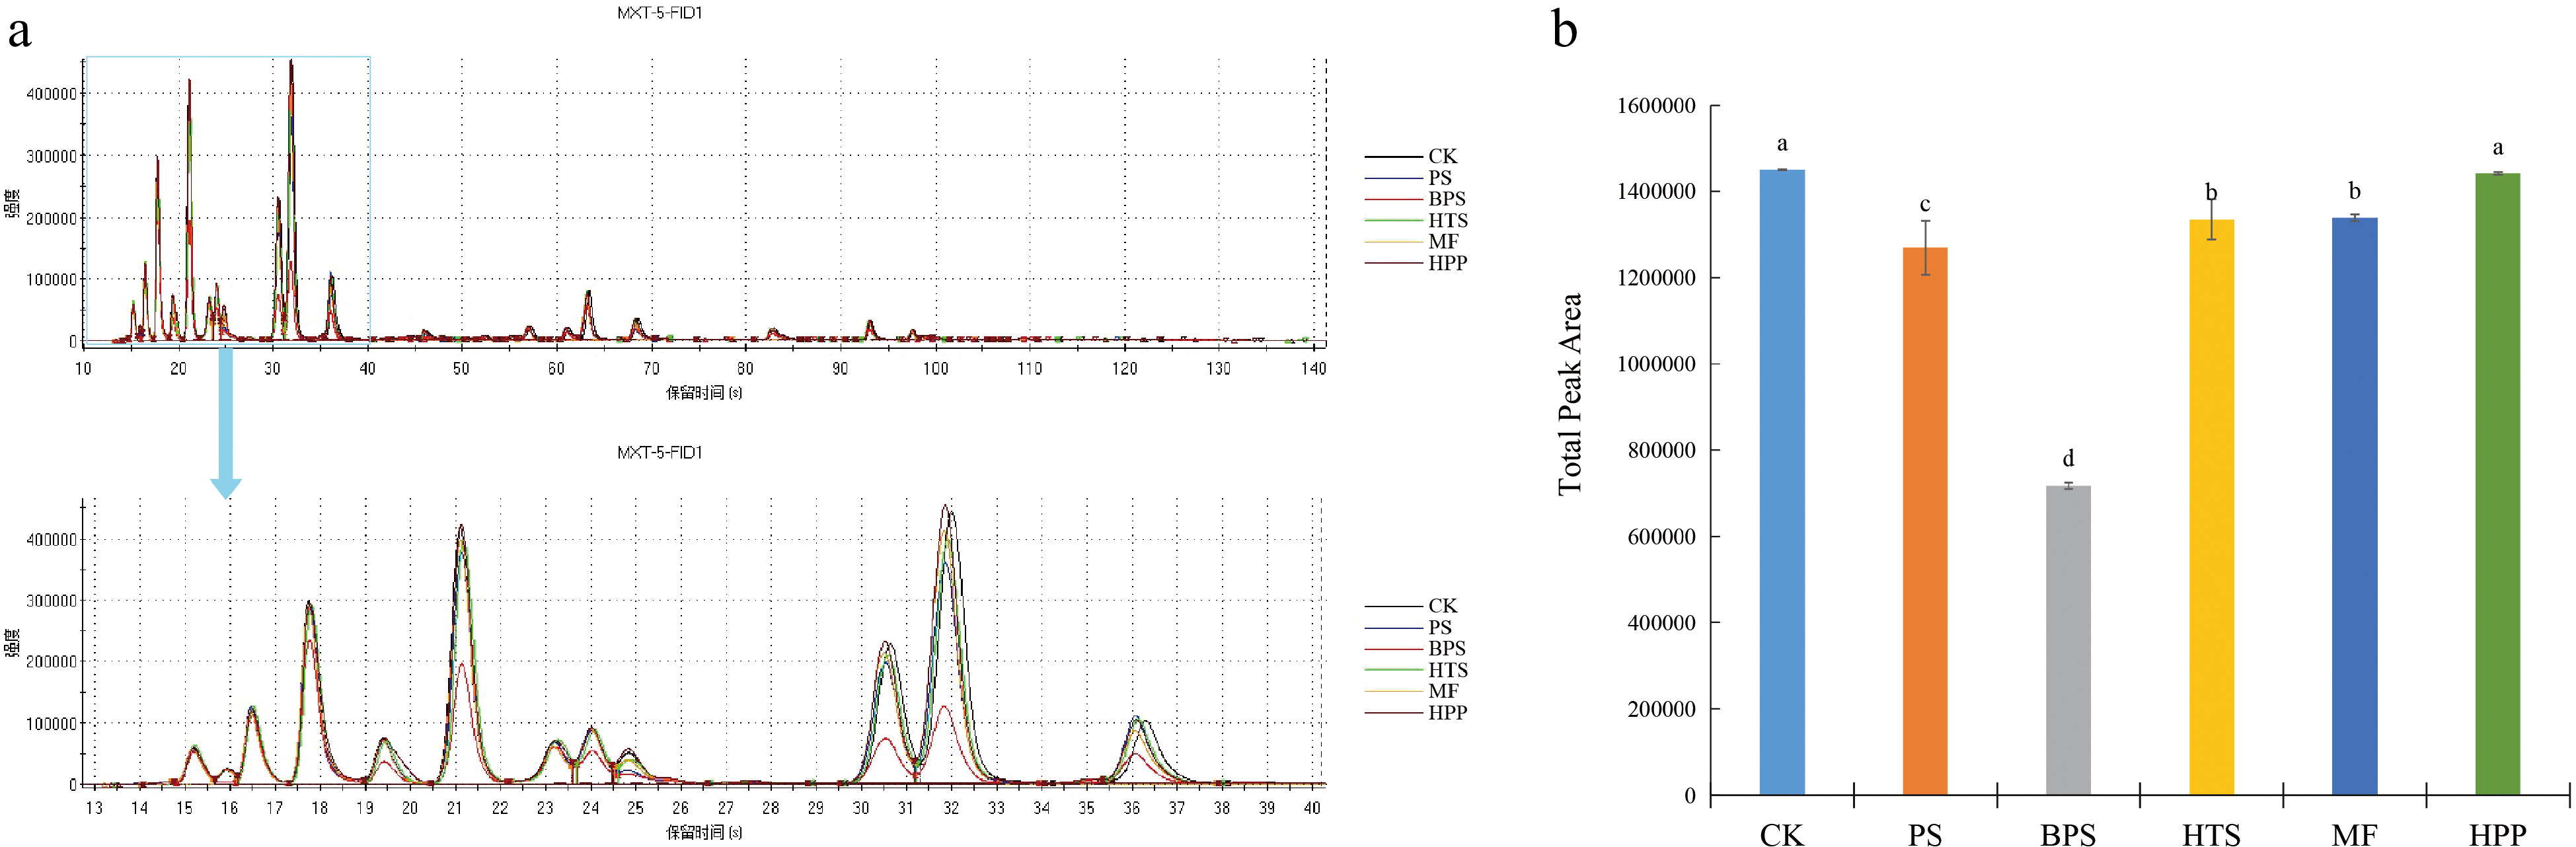
Figure 2. (a) E-nose gas chromatogram; (b) total peak area.
Analysis on VCs
-
Combined with the retention index of MXT-5 and MXT-1701 columns, the main VCs were retrieved by AroChemBase database of E-nose analysis software, and the possible compounds were obtained, as shown in Table 4. VCs were classified into different categories (aldehydes, pyrazines, ketones, alcohols, esters, acids, pyrrole, pyridine and other), then the total peak area of each category was summed up, as shown in Fig. 3. Among CK, PS, HTS, MF and HPP, there was no obvious difference among the distribution of each VCs category, and aldehydes, pyrazines, ketones and alcohols were the main compounds. In BPS, the content of aldehydes and pyrazines are obviously lower. Compared to that of CK, they were decreased by 43.7% and 50.9% respectively.
Table 4. Information of main possible VCs.
No. Retention time (s) Retention index Possible VCs Sensory description Category 1 15.2 415 Acetaldehyde Fruit, pleasant, spicy Aldehydes 2 15.9 430 Methanol Alcohol, spicy, strong Alcohols 3 16.5 441 Ethanol Alcohol, spicy, strong Alcohols 4 17.7 468 Propionaldehyde Cocoa, nut, plastic, spicy Aldehyde 5 19.4 502 Ethyl formate Fruit, green, spicy, rose Esters 6 21.1 537 2-methylpropionaldehyde Baked potatoes, fruit, malt, roasted Aldehyde 7 23.1 580 N-butyraldehyde Cocoa, chocolate, green, malt, musty Aldehyde 8 24.0 597 2-butanone Butter, cheese, chocolate, pleasant Ketones 9 24.8 605 2-methylfuran Charred, chocolate, metal Other 10 27.5 627 Isobutanol Alcohol, bitter, licorice, sweet Alcohols 11 29.3 641 Isopropyl acetate Bananas, fruit, sweet Esters 12 30.5 650 3-Methylbutyraldehyde Almonds, cheese, chocolate, malt, peach, roasted Aldehyde 13 31.8 661 2-ethylfuran Burnt, acidic, sweet, rubber, malt Other 14 35.1 686 2-pentanone Bananas, fruit, sweet Ketones 15 36.1 694 2,3-pentanedione Almond, apple, cream candy, caramel, cheese, cream, fruit, malt, nut Ketones 16 38.5 709 3-pentanol Fruit, green, nutty, greasy, sweet Alcohols 17 41.5 726 Glutaraldehyde Almonds, berries, fruits, green, nutty, malt, herbal Aldehyde 18 43.6 737 Pyrazine Bitter, corn, hazelnut, nutty, sweet, spicy, strong Pyrazine 19 44.8 744 Isoamyl alcohol Alcohol, sesame oil, bitterness, cheese, fruit, malt, spicy, whisky, charred Alcohols 20 46.0 750 pyridine Burnt, amine, spicy Pyridine 21 48.1 762 2-methylglutaraldehyde Cheese, fruit Aldehyde 22 49.6 771 N-pentanol Alcohol, fruit, sesame oil, fennel, sweet, spicy Alcohols 23 50.8 777 1-hexene-3-alcohol Freshly cut grass, rum Alcohols 24 52.2 784 2-hexanone Fruit, cinnamon, fungi, meat, spicy Ketones 25 54.0 794 N-hexanal Herbal, dense, sweet, oak, butter Aldehyde 26 55.0 800 2-Hexanol Broccoli, fruit, wine Alcohols 27 56.9 808 Propyl propionate Apple, fruit, pineapple, fruity (sweet) Esters 28 58.7 815 Bread ketone Nuts, coffee, bread Ketones 29 59.5 819 2-hydroxy-3-pentanone Butter, nuts, peanuts, truffles Ketones 30 60.9 824 Ethyl isovalerate Fennel, apple, fruit, sweet Esters 31 63.1 833 Furan formaldehyde Almond, aromatic, roasted, sweet, woody Aldehyde 32 68.2 855 Isovaleric acid Cheese, fruit, sour Acids 33 70.8 865 N-hexanol Medicinal, plant, branch, sweet, woody, barbecue Alcohols 34 76.3 888 2,4-dimethylthiazole Cocoa, coffee, meat, beef flavor Other 35 79.9 904 2-methoxypyrazine Chocolate, cocoa, nuts, sweet Pyrazine 36 82.7 919 Valeric acid Sour, sweet, spicy, rotten Acids 37 86.0 936 4,5-dimethylthiazole Roasted, smoked, nutty, earthy Other 38 86.8 940 Isovaleraldehyde propylene glycol acetal Caramel, fruit, sweet, sour Aldehyde 39 88.3 948 Propyl isovalerate Apple, fruit, sweet Esters 40 89.7 956 2-ethoxythiazole Nut (roasted), coffee, burning Other 41 91.0 963 Tetrahydrothiophene-3-one Roasted, garlic, onion flavored Ketones 42 93.0 973 Filbertone Hazelnut, nut Ketones 43 97.5 997 2-Acetylthiazole Bread, burnt, caramel, grain, peanuts, hazelnuts, popcorn, roasted Other 44 99.0 1007 Caproic acid Cheese, goat, sour, sweet, rotten Acids 45 100.0 1015 Heptadiene aldehyde Cinnamon, greasy, nutty, rancid Aldehyde 46 101.7 1028 2-acylpyrrole Popcorn, roasted Pyrrole 47 103.2 1040 2-acetylpyridine Biscuits, bread, greasy, popcorn, tobacco Pyridine 48 105.1 1055 Furanone methyl ether Caramel, fruit, mushroom, burning Other 49 105.8 1061 2-methyl-5-vinyl pyrazine Roasted, sweet, coffee, nut Pyrazine 50 106.3 1065 2-acetylpyrrole Nuts, walnuts, caramel, fennel, licorice Pyrrole 51 107.1 1071 3-methylcyclopentane-1,2-dione Caramel, coffee, sweet, maple Ketones 52 109.1 1086 2-acetylpyrazine Cocoa, coffee, popcorn Pyrazine 53 111.2 1104 2-Nonanol Apple, banana (ripe), cherry, orange, fruity Alcohols 54 122.7 1194 Ethyl octanoate Fennel, roasted fruit, fruit Esters 55 132.4 1269 Nonanoic acid Cheese, dairy products, sour Acids 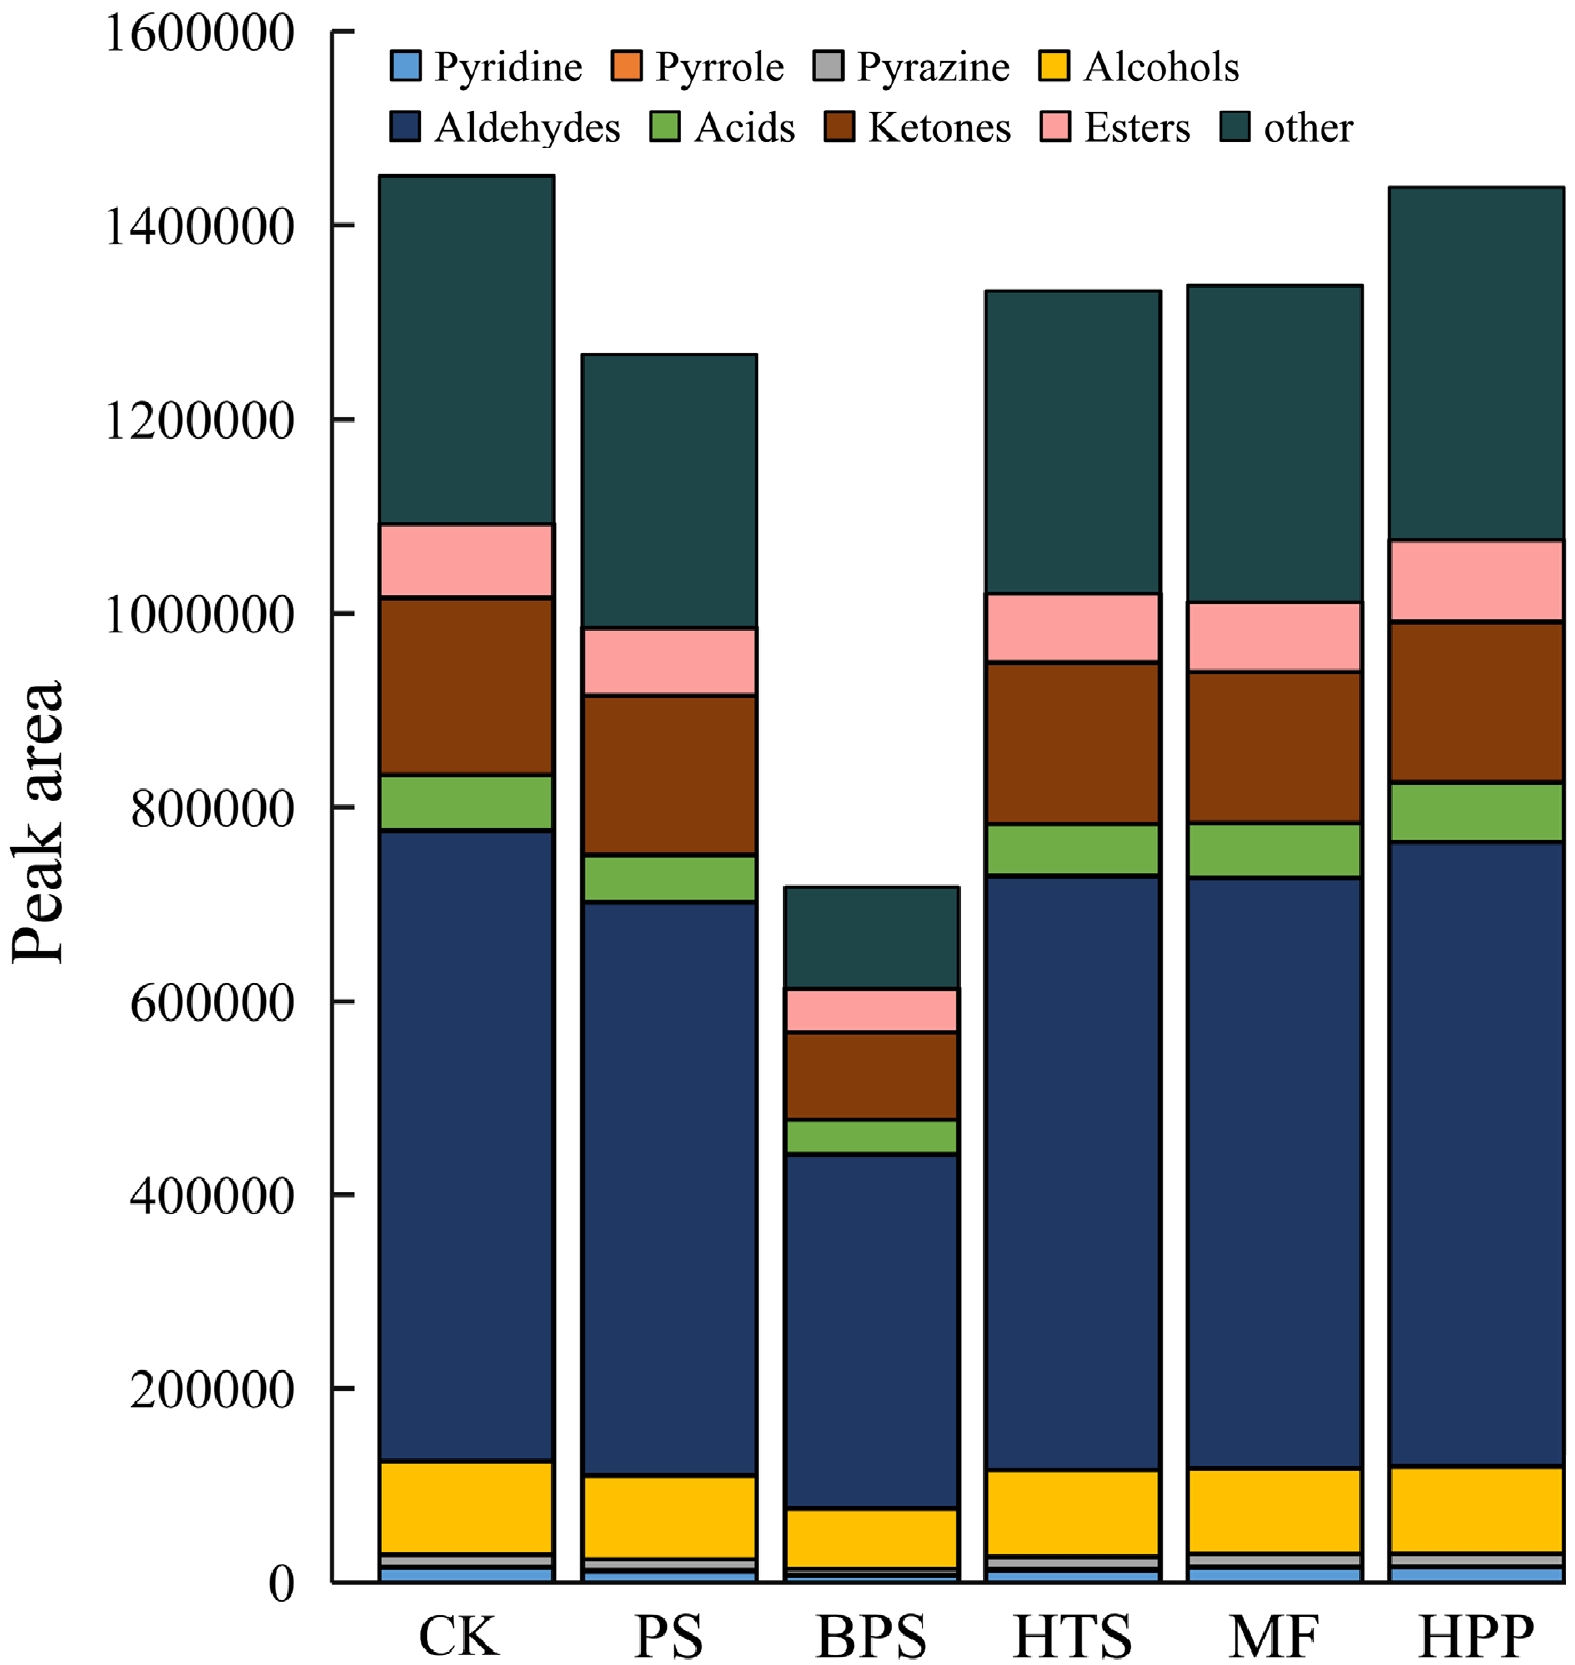
Figure 3. Comparison of total peak area of different category VCs.
Analysis on aroma type
-
Based on the sensory description in Table 4, the aroma of coffee can be classified to corny odor, sour/fermented odor, fruit/floral odor, caramel odor, nutty/cocoa odor and toasty odor. The main odors of CK were caramel odor, nutty/cocoa odor, toasty odor and corny odor. Compared to CK, BPS had a more sour/fermented odor but lower corny odor. Other samples were similar with CK, showing a little decrease in caramel odor and nutty/cocoa odor ( Fig. 4).
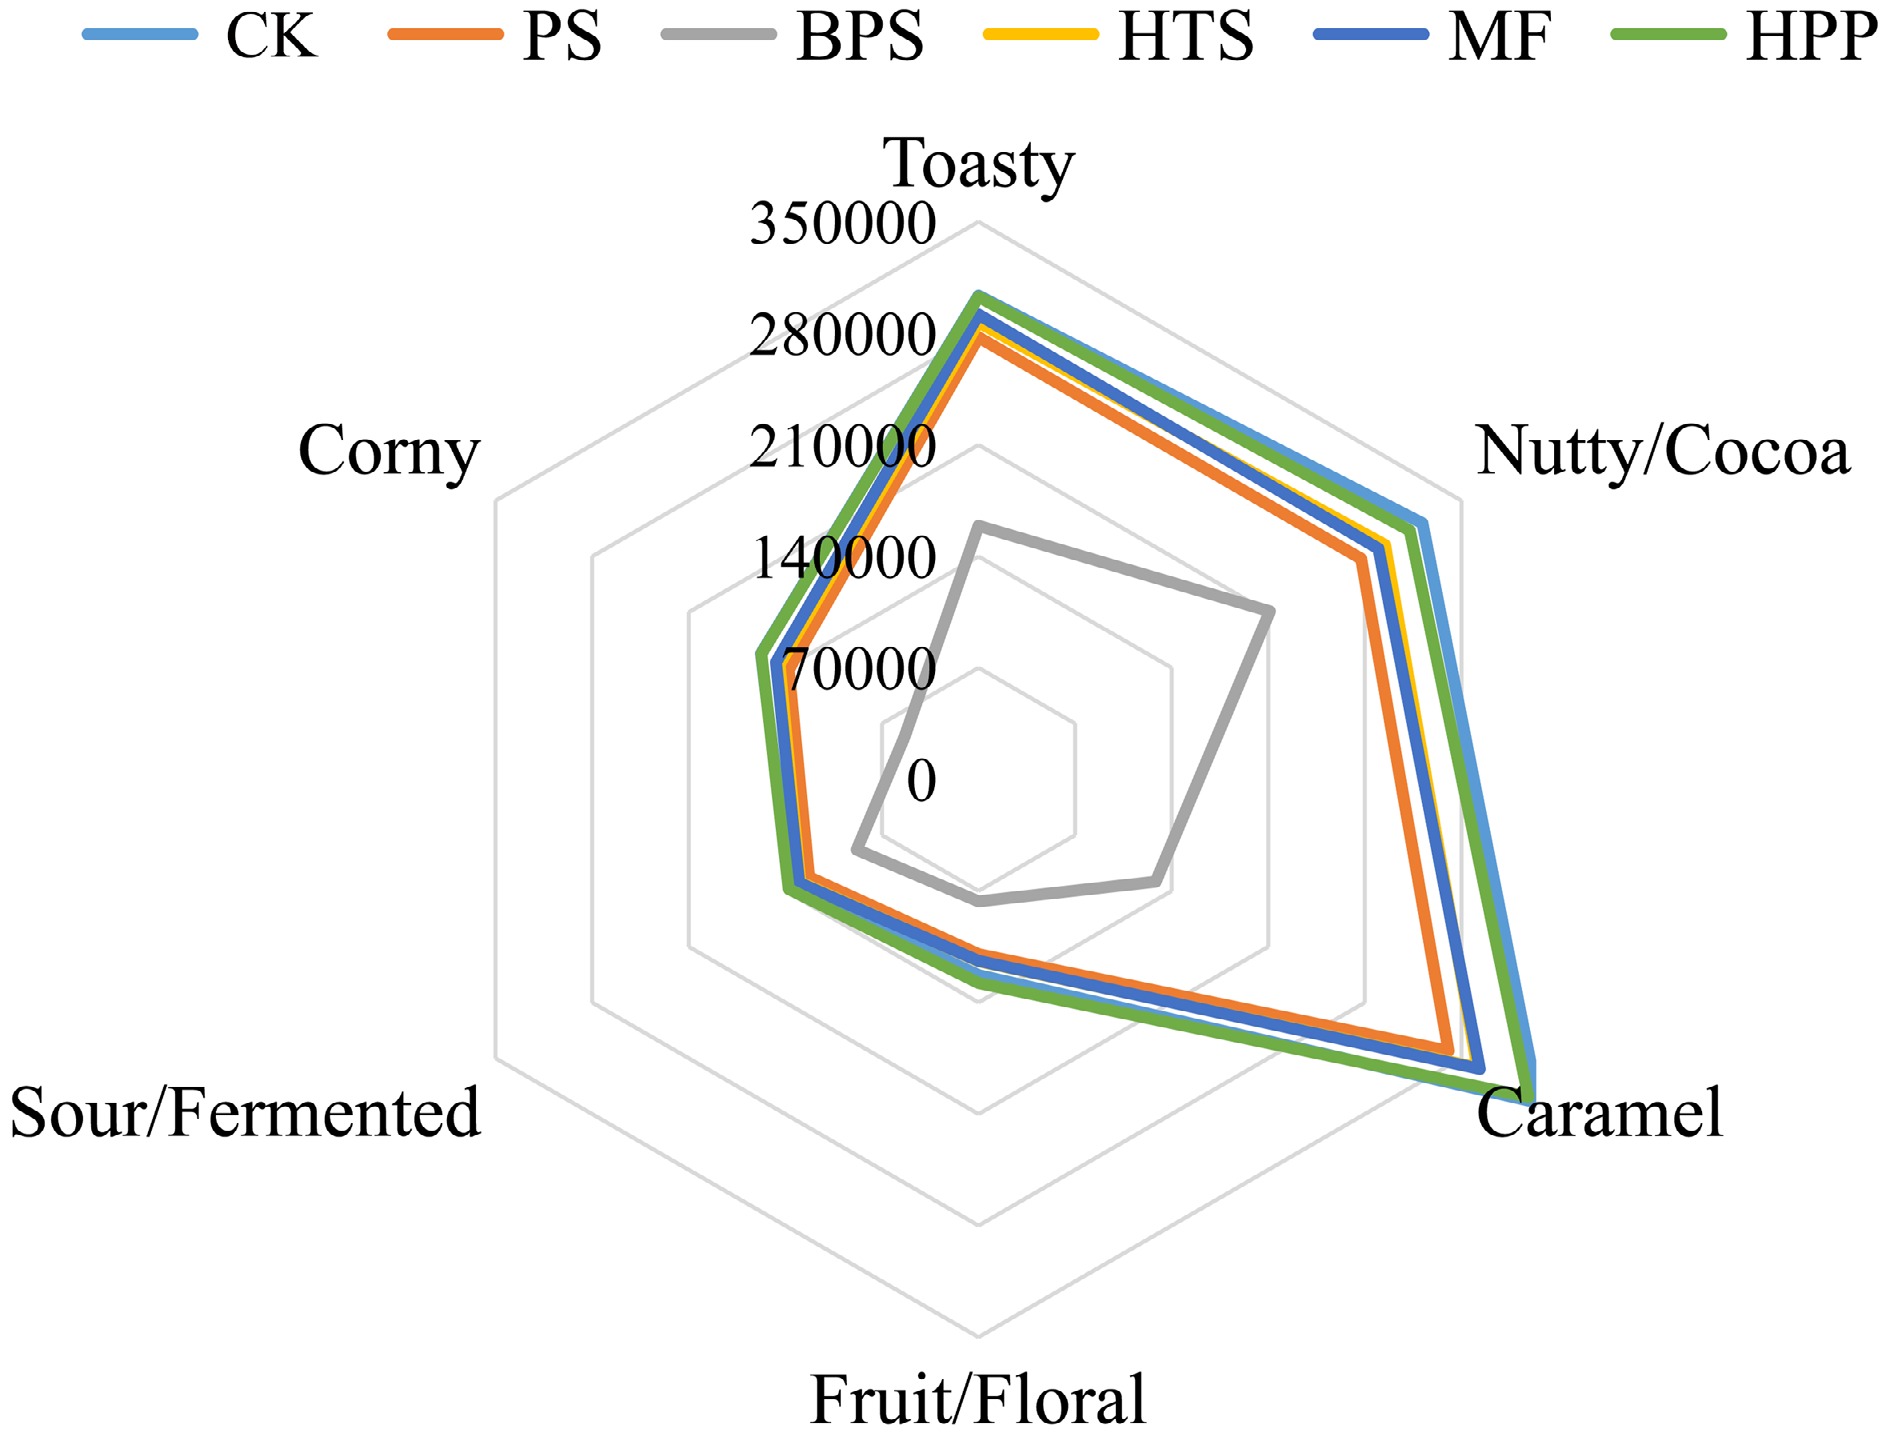
Figure 4. Radar chart of coffee aroma.
Effect of sterilization on taste of cold brew coffee
-
E-tongue simulates the taste perception mechanism of living organisms. Sourness, sweetness, bitterness, saltiness, umami, astringency and aftertaste of cold brew coffee were evaluated by detecting the change of membrane potential caused by electrostatic interaction or hydrophobic interaction between various flavor substances and artificial lipid film[22]. The data of CK was set as the reference (zero point), then other samples were compared with it, and shown in Fig. 5.
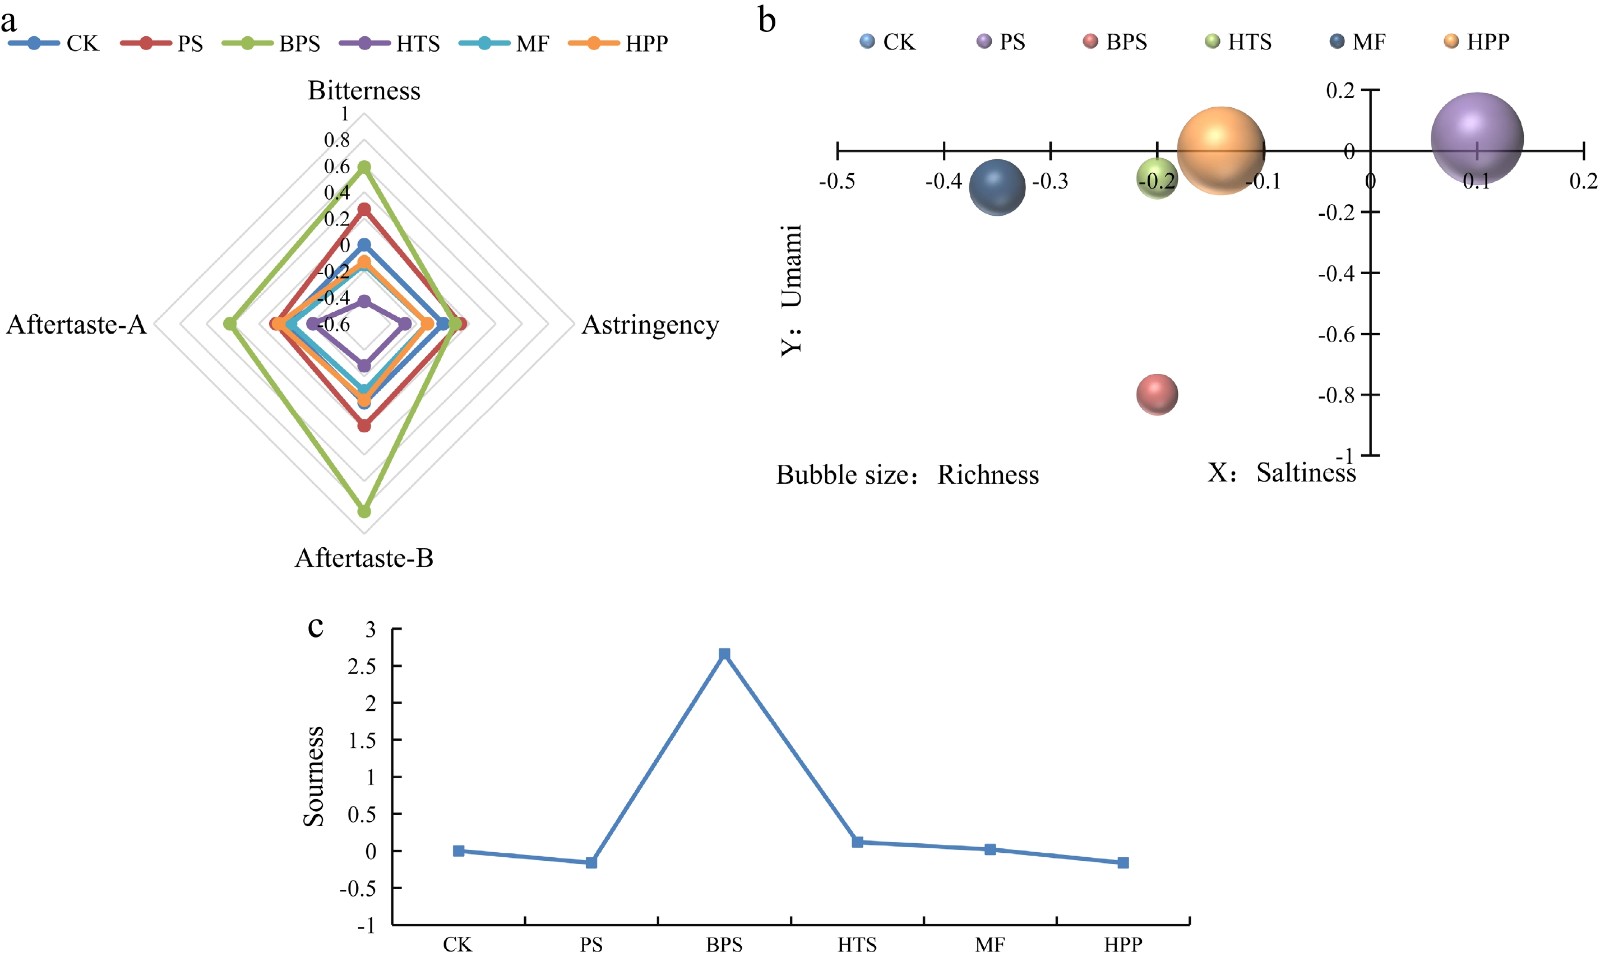
Figure 5. Comparison of coffee taste. (a) bitterness, astringency and the aftertaste of the two; (b) saltiness, umami and richness; (c) sourness.
Bitterness and astringency are important taste indicators of coffee. From Fig. 5a, different sterilization methods had different degrees of influence on the bitterness of coffee. BPS and PS had higher bitterness and astringency values than other samples. HTS, MF and HPP had lower bitterness, astringency and aftertaste values, among which HTS had the lowest.
Coffee samples also performed a significant response to saltiness, umami and richness (also known as umami aftertaste), and these three taste indicators were compared as shown in Fig. 5b. Back pressure processing had obvious negative influence on performance of the umami, saltiness and richness, while other methods had little influence on umami. Pasteurization and high pressure processing led to an increase in the richness value of coffee. For saltiness value, pasteurization increased it, while high temperature sterilization, membrane filtration and high pressure processing decreased it, and high temperature short-term sterilization decreased it the most.
Sourness is a basic flavor of coffee. Compared to CK, BPS had higher sourness value, indicating that back pressure processing could lead to the increase in sourness, which corresponds to the results in pH value and organic acid concentration. Pasteurization and high pressure processing could decrease the sourness value of coffee while membrane filtration increased it.
Effect of sterilization on the sensory attributes of cold brew coffee
-
Coffee cup-testing is an important method to evaluate the sensory attributes of coffee. Recently, coffee cup-testing has been gradually applied in scientific research[23]. In order to obtain accurate results, professional testers were invited to participate in the evaluation, the results are shown in Figs. 6 and 7. The scores of each sensory attribute of samples ranged from 6.75 to 8.15. There was no significant difference in the score of flavor, aftertaste, acidity and body among the samples. Slight differences were shown in aroma, balance and overall scores, and the scores of BPS were significantly lower than that of CK.
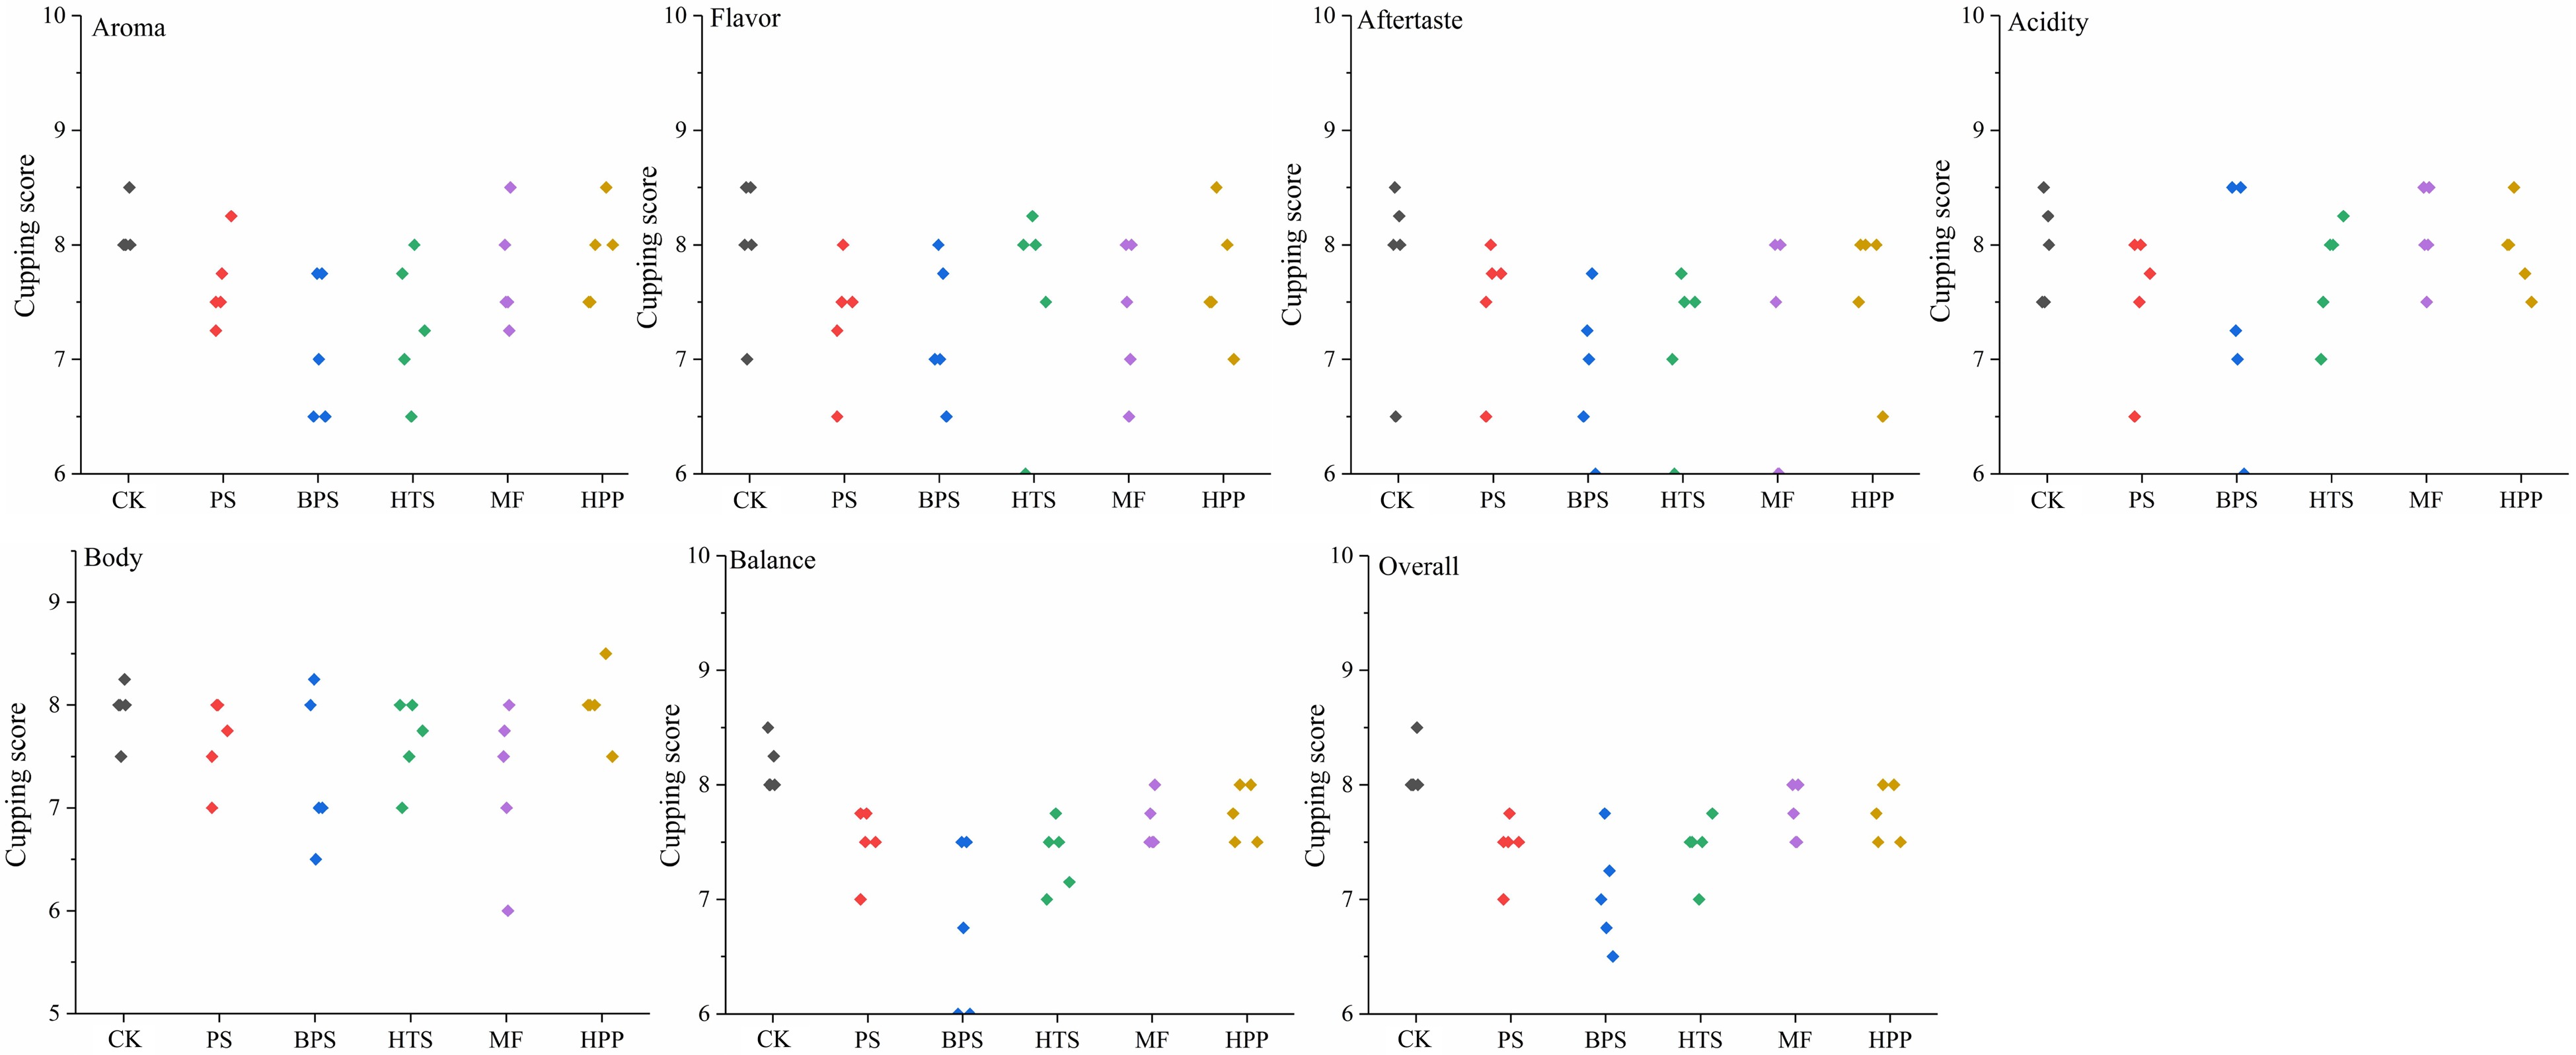
Figure 6. Analysis of coffee cup-testing.
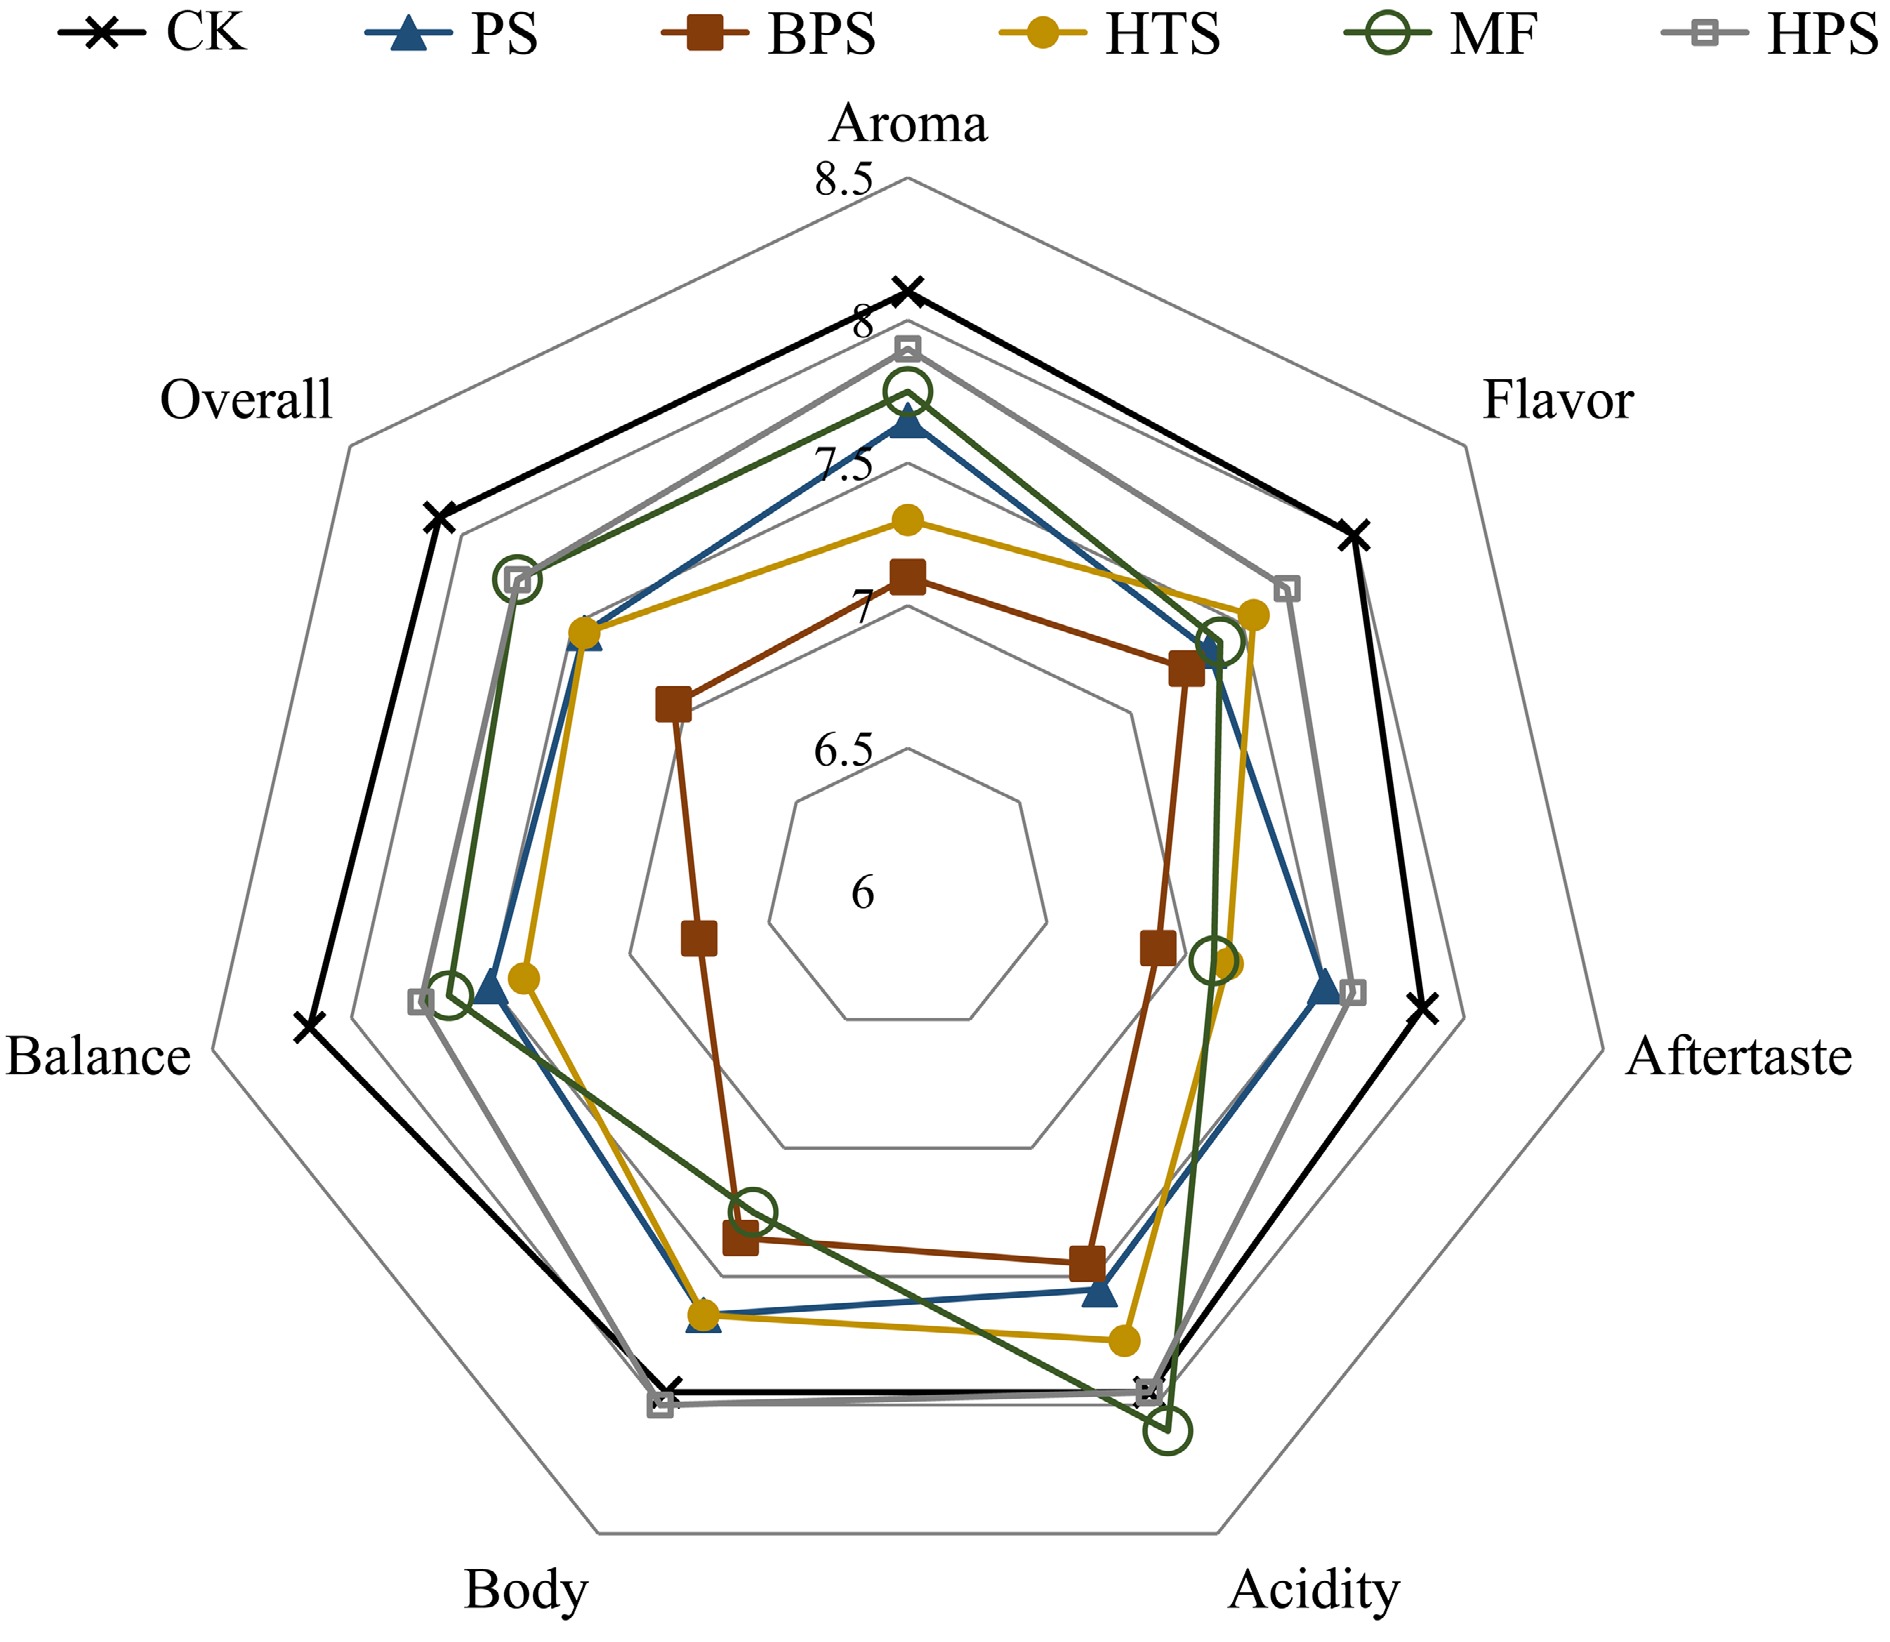
Figure 7. Radar chart of coffee sensory results.
-
In this research, five sterilization methods were used to sterilize cold brew coffee, then E-nose, E-tongue and coffee cup-testing were used to analyze the difference of coffee sensory quality before, and after sterilization. The results indicated that, compared to heat sterilization, non-heat sterilization was more favorable to the sensory attributes of coffee, as they had less negative influence on the aroma and taste of coffee. Among heat sterilization, back pressure sterilization showed significant negative effect on coffee sensory quality, as total aroma decreased, and sourness, bitterness and astringency increased. While the coffee treated with high temperature short-term sterlization was relatively good overall, as the decrease of total aroma was not significant, and the bitterness of coffee decreased comparatively.
According to this research, non-heat sterilization can better retain the aroma and taste of cold brew coffee, but due to its high cost and limited application, it is not as widely used as heat sterilization in coffee and other beverage products. Among heat sterilization, high temperature short-time sterilization is more suitable for the processing and production of cold brew coffee, as its cost is reasonable, and the sensory quality and nutrients of coffee can be better maintained. This research conclusion provides theoretical support for the selection of sterilization methods for cold brew coffee processing, but the optimization of sterilization procedures and the influence of processing conditions on the sensory quality of cold brew coffee requires further investigation.
- The authors declare that they have no conflict of interest.
- Copyright: © 2022 by the author(s). Exclusive Licensee Maximum Academic Press, Fayetteville, GA. This article is an open access article distributed under Creative Commons Attribution License (CC BY 4.0), visit https://creativecommons.org/licenses/by/4.0/.
-
About this article
Cite this article
Liu X, Wang W, Fei Y, Zhou Y, Jin L, et al. 2022. Effect of sterilization methods on the flavor of cold brew coffee. Beverage Plant Research 2: 6 doi: 10.48130/BPR-2022-0006

Effect of sterilization methods on the flavor of cold brew coffee
- Received Date: 21 November 2021
- Accepted Date: 15 February 2022
- Published Online: 14 March 2022
Abstract: This research used ultra-fast E-nose, E-tongue and SCA analysis to explore the effects of different sterilization methods (pasteurization, back pressure sterilization, high temperature short-term sterilization, membrane filtration treatment and high pressure processing) on cold brew coffee. The results showed that non-heat sterilization can better maintain the sensory quality of coffee liquid. Back pressure sterilization could reduce the pH value of coffee liquid to 4.65, and decrease the aroma content significantly by 50.5% (p < 0.05), while the sourness and bitterness of coffee samples increased, which lowered the sensory quality of coffee. Among the heat sterilization treatments, high temperature short-term sterilization had relatively little effect on the sensory quality of the coffee beverage, and decreased the bitterness of the coffee. Taking sensory quality, nutrients and cost into consideration, it is suggested that high temperature short time sterilization is a prefered method. Thus, the results of this research provided a theoretical basis for the selection of sterilization method for cold brew coffee.
-
Key words:
- Coffee /
- Sensory quality /
- Sterilization /
- Electronic nose /
- Electronic tongue