Empirical Validation of a Learning Progression in Initial Chemistry Education ()
1. Introduction
Many students have difficulty understanding basic chemistry concepts that are relevant to school curricula. In Germany, for example, only about half of the pupils achieve the regular standards published for the intermediate school-leaving certificate (Stanat et al., 2019) . Research on the topics in chemistry education that address the misconceptions of students shows that basic chemistry skills are often absent. A literature review by Teo et al. (2014) shows that learning and teaching concepts are among the most important topics in chemistry. Talanquer (2006) argued that the alternative concepts of students are mainly caused by a “crude, incomplete, limited, and superficial explanatory framework regarding chemical substances and phenomena.” Thus, research on knowledge acquisition in chemistry is still highly required. Learning progressions (LPs) can provide an approach to systematizing the desired and actual learning paths of students. In the past years, a large number of different LPs have been published and evaluated with different methods. The aim of the research project presented here is therefore to map a LP as comprehensive as possible, which (depending on the school system) represents the essential aspects of chemistry teaching in secondary school. In particular, the research question will be addressed to what extent the particular dependencies of core ideas within the LP can be individually empirically confirmed. The advantage of a comprehensive LP is that it can also be used to map relationships between core ideas that exist between different pathways within the LP.
1.1. Use of Learning Progressions
In this paper, we follow the definition of a learning progression provided by Stevens et al. (2010) : “Learning progressions (LPs) provide a promising means of organizing and aligning the science content, instruction and assessment strategies to provide students with the opportunity to develop deep and integrated understanding of a relatively small set of big ideas of science over an extended period of time” (Stevens et al., 2010) . Educational researchers have developed LPs, such as on the structure of matter (Hadenfeldt et al., 2016; Smith et al., 2006) , transformation of matter (Emden et al., 2018) , energy (Lee & Liu, 2010; Neumann et al., 2013) , or scientific modeling (Schwarz et al., 2009) . An overview of this has been provided by Duschl et al. (2011) , Krajcik and Shin (2023) and Shi and Bi (2023) . However, not all LPs have been empirically tested, and interconnectedness between content areas is also frequently lacking.
Depending on their intended use, a distinction is made between large- and fine-grained LPs, which present the possible learning paths in a differentiated manner. Large-grained LPs contain a broad content range and, therefore, describe how central concepts can develop over an extended period. Owing to their breadth and size, they are less differentiated than fine-grained LPs and, therefore, contain less detail. Thus, they are suitable for the development of standards, e.g., Gotwals (2012) . A large-grained LP was developed by Neumann et al. (2013) on the concept of energy; it considers the understanding of energy across multiple grade levels. Contrarily, fine-grained LPs describe detailed learning goals and can be used for specific lesson planning. Jin et al. (2013) described such a fine-grained LP on the carbon cycle. This LP provides detailed descriptions of skill development for a sample of lessons. An overview how LPs are used for teaching can be found in Wickman (2014) .
In addition, LPs can be employed to develop instruments for individual diagnostics (Ketterlin-Geller et al., 2019; Zhou & Traynor, 2022) by establishing progression levels and developing corresponding test items that identify the progression levels of learners. Thus, supportive learning materials can be developed and used in the classroom (Gunckel et al., 2012) .
1.2. Development of Learning Progressions
As previously mentioned, LPs essentially differ in three characteristics: grain size, content breadth, and developmental span. Comparatively, many LPs consider a limited content area, such as “energy.” The developmental span considered can vary from a few lessons to entire school years. The grain size of the concepts varies with the content broadness and developmental span. Extremely broad LPs tend to be more large-grained, whereas small LPs tend to be more fine-grained (Johnson & Tymms, 2011) . Teachers do not agree on which grain size of LP is ideal for teaching purposes (Harris et al., 2022) . Regardless, the development processes for LPs are always similar. First, relevant concepts must be identified and defined in a separable way. This can be performed, for example, via document analysis or expert interviews. Second, these concepts must be hierarchized and linked. Up to this point, a LP has a solely hypothetical character. To empirically validate the LP, test items must be created in the third step, with which the knowledge of the test participants can be examined. In the fourth step, the items are used to obtain data in an appropriate cohort and statistically analyze them to modify or consider the LP, as confirmed in the final step. Corcoran et al. (2009) provide a good overview regarding elements which should be included in any LP including the assessment. These elements are 1) target performances or learning goals which are the end points of a learning progression; 2) progress variables (core concepts) which are being developed and tracked over time; 3) intermediate steps in the developmental pathways; 4) learning performances as specifications for the development of assessments and 5) assessments. The assessment typically involves multiple-choice items (Emden et al., 2018; Neumann et al., 2013) or ordered multiple-choice items (Briggs et al., 2006; Todd et al., 2017) . Chen et al. (2016) and Goecke et al. (2022) have discussed the influence of item formats. Goecke et al. (2022) state that the method of inquiry does not affect what is measured with different response formats, while Chen et al. (2016) opt for mixed formats. A review by Harris et al. (2022) shows that the majority of studies utilizes short-answer or fixed response tasks. Independent of this, Jin et al. (2023) note that a systematic evaluation of LP is still rare. They therefore propose a framework model for the scientific evaluation of LP that begins with a literature analysis, then includes an evaluation by experts and with students, and in the next step provides quantitative data from IRT analyses and relates these to theory. In a final step, the usefulness for teachers is assessed.
2. Methods
2.1. Development of the Learning Progression
The approach corresponds to the criteria proposed by Corcoran et al. (2009) . The point in time in the German school system corresponding to the end of compulsory schooling was chosen as the target performance. For the subject of chemistry, core ideas to be acquired by this time were formulated and arranged in terms of learning paths and intermediate steps. By describing expectations for each core idea, the basis was laid for an assessment, which in turn served to validate the LP. This LP was developed over several years. Teachers, a teacher trainer, a representative of the Ministry of Schools and Education and researchers in chemistry education were involved in the development process. When developing the LP, we decided to remain comparatively fine-grained despite the large time span covered in order to be able to cover learning processes and learning obstacles as precisely as possible. This can only succeed if core ideas are described in such a small way that they can be diagnosed individually. In joint project meetings, core ideas were first formulated on the basis of various school and academic textbooks, curricula and the experience of the project group, then hierarchized and, in a final step, provided with hypothetical dependencies, which were empirically tested in the following. In order to structure the LP, so-called basic concepts were used, which are commonly used in Germany to structure chemical concepts. Basic concepts are understood to be the structured network of interrelated concepts, theories and models that have emerged as relevant from the systematics of a subject to describe phenomena and contexts, as opposed to merely a list of learning material. These basic concepts are intended to provide a structure for school chemistry in which students can integrate new knowledge and recognize similarities between chemical principles in different content areas and examples. The basic concepts used here were “structure of matter (SM)”, “chemical reaction (CR)” and “energy (E)”. We have mapped all three basic concepts in a single LP in order to be able to investigate relationships between the basic concepts. These are to be assumed because, for example, redox reactions cannot be interpreted as electron transfer reactions (basic concept of chemical reaction) if at least one differentiated atomic model with electrons in an atomic shell (basic concept of the structure of matter) is not mastered.
In addition, the LP was hierarchized in such a way that core ideas relating to the substance level or a simple particle or atomic model were marked with the number I, while core ideas relating to a differentiated atomic model were given the number II. This distinction serves to facilitate orientation in the map. Since the natural sciences are based on observable phenomena, we have chosen these as the starting point (lower anchor) for our LP. This applies to all three basic concepts, the concept “structure of matter” (SM-I-1: Substances have characteristic properties), the basic concept of chemical reactions (CR-I-I: Chemical reactions produce new substances with properties different from those of the reactants) and energy (E-1-I: Different forms of energy exist). In this way, a map was developed that contains a total of 57 core ideas with 103 hypothetical dependencies.
The LP is supplemented by test tasks for each core idea. In a first step, requirements and limitations were formulated for each core idea. For example, three requirements were formulated for the idea “The formation of ions results in ionic bonding”: Students should know that a) oppositely charged ions attract each other, resulting in a bond; b) the rule of electroneutrality applies; c) the attracting forces act in all directions, resulting in the formation of a three-dimensional ionic lattice. At the same time, limits were formulated that describe what students do not (yet) need to know. Two limits are formulated here, namely that students do not need to know that a) there are different lattice structures and b) the coordination number exists. In particular, the requirements were used to construct test items. For each core idea, an effort was made to construct at least 5 test items that cover as all requirements to the greatest extent possible. The items were constructed by the same group that formulated the core ideas. The procedure was that the items were first designed in small groups of 2 - 4 experts before being discussed and optimized in plenary sessions. Before being included in the subsequent evaluation study, all test items were reviewed by external experts and piloted on small numbers of students in order to identify any errors or comprehension difficulties.
2.2. Evaluation of the Learning Progression
Different methods are employed to validate LPs. Among these, the item response theory (IRT) model is widely used (Yuan et al., 2022) . The use of IRT models assumes that a student's pattern of thinking regarding a particular concept can be mapped as a continuous latent knowledge structure and that a task difficulty provides information regarding progress in the LP. Most LP studies employ the Rasch model (Rasch, 1960) as the underlying IRT model. During this process, the Rasch model matches the ability parameters of the students to the difficulty parameters of the items and places them on a joint Wright Map. The LP is examined under the assumption that higher progression levels result in more difficult items (Neumann et al., 2013) . This logic may be true. However, there may be other reasons that render an item easier or more difficult (e.g., item design features, such as complexity or the cognitive processes required to solve it). Here, the Rasch model was employed primarily to examine the quality of the subject knowledge test used. Additional McNemar tests were employed to examine the LP sequence (Adedokun & Burgess, 2012; Pembury Smith & Ruxton, 2020) .
2.3. McNemar Test
The McNemar test is a statistical test for connected samples in which a dichotomous characteristic is considered, such as that which may occur in a four-field table. In the present case, the mastering of one core idea of the LP is always compared with mastering a subsequent core idea. Therefore, neither core idea can be mastered, one of the ideas (A or B) can be mastered, or both ideas can be mastered, resulting in a four-field table.
Table 1. Four-field table for the McNemar test.
core idea A
not mastered
mastered
core idea B
not mastered
a
b
mastered
c
d
If the calculated test variable is equal to or greater than the comparison value of the Χ² distribution (for 1 degree of freedom and 95% quantile), a statistically significant difference exists between the masteries of the two core ideas and that a purely random difference can be ruled out with a high degree of confidence (at the 95% confidence level). The direction of the difference can be inferred from the data, depending on whether high frequencies occur in fields b or c (Table 1). For example, if we assume that core idea A must be acquired first to acquire core idea B, then, essentially, only cells a, b, and d are likely to be occupied but not cell c.
2.4. Rasch Modeling
Owing to the high number of items and the resulting test design, incomplete datasets were available because the students did not complete all the test items. In addition, there was a different number of answers for each test item because the students were asked not to guess during the test, i.e., they should only work on the test items whose solutions they knew. Thus, it was advisable to use the probabilistic test theory, particularly the Rasch model, for the evaluation. Here, person and item parameters were estimated for incomplete datasets. The estimates of person parameters enabled a comparison of persons regardless of the processed test items (Prenzel et al., 2007) . A probabilistic relationship was assumed between the observed response behavior (item solution probability) and latent trait expression (person ability) that causes the manifest behavior (Bond & Fox, 2007; Boone & Scantlebury, 2006; Boone, 2016) . The solution probabilities (previously restricted to the 0–1 interval) were transformed into logit values. Thereafter, the betting quotient was logarithmized from the solution probability (probability of solving an item) and counter probability (probability of not solving an item). In this logit scale, the value range is from minus infinity to plus infinity (Boone, 2013; Boone, 2020) . However, it is typically between +3 and −3. Although zero represents a 50% probability of solving an item, easy items and individuals with lower person abilities were labeled with negative values. Hard items and individuals with higher person abilities were labeled with positive values (Boone, 2013; Linacre, 2023) . Considering that they had the same logit unit, they were mapped on a scale (Bond & Fox, 2007; Boone, 2013; Linacre, 2023) . Various measures can be employed to assess the test quality. Two reliability measures can be obtained from the Rasch analysis-person and item reliabilities. Person reliability is used to classify the sample. A person reliability below 0.8 for an adequate sample implies that the instrument is not sufficiently sensitive to distinguish between high and low person abilities. The person reliability is comparable to test reliability (Cronbach’s α) in the classical test theory. Item reliability is used to classify the test. An item reliability below 0.8 with an adequate test length indicates that the sample size or constitution is unsuitable for a stable arrangement of items by difficulty (Linacre, 2023) . In addition, item discrimination can be used to assess the test quality. The Rasch model assumes that items have the exact assumed model-specific item discrimination, whereas item discriminations empirically vary. Although items that exactly fit the Rasch model receive a fit (mean-square, MNSQ) value of 1.0, the amount of empirical deviation from 1.0 can be interpreted as the degree to which that item misfits the Rasch model. Consequently, this value is expected to be close to 1.0. Values between 0.5 and 1.5 are considered productive for measurement, whereas values above 1.5 are unproductive for measurement. Values above 2.0 are considered to even distort the measurement. Values below 0.5 indicate that items are less productive for measurement but not distorting. These values are only to be interpreted with the t-standardized probabilities, which indicate the statistical significance of the MNSQ values. Values above 1.96 indicate statistical significance matching p = 0.05 (Linacre, 2023) .
2.5. Sample and Data Collection
To ensure that an LP can be used to describe the development of knowledge as precisely as possible in order to identify and close possible gaps in knowledge, we decided to choose the initial chemistry instruction as the basis for the LP so that the development of knowledge can be described from as early a point in time as possible. Here, 57 core ideas were included in the strand map (32 “structure of matter,” 13 “chemical reaction,” and 12 “energy”). Thus, a strand map that spans approximately 2 school years was created. It had the characteristics of a large-grained LP; simultaneously, it broke down the content into many core ideas and, thus, exhibited the rich detail of a fine-grained LP. Among the core ideas, 103 possible dependencies were assumed. An excerpt of the strand map can be found in Figure 1 to illustrate the structure. For reasons of readability, the entire strand map is not shown in the article, but all core ideas are reported (Table 2), as well as all assumed and empirically tested dependencies (Table 4).
To examine these, five items were used per core idea, four of which had to be correctly solved for an idea to be assumed to have been “mastered.” For certain core ideas, additional items were available. These were also used; however, in this case, more items had to be correctly solved, using p = 0.05 as a criterion. Since it is unreasonable to expect any student to complete all 348 test items, we used a multi-matrix design. The core ideas were divided into 31 test booklets in such a way that the dependencies between a group of neighboring core ideas can always be mapped within a test booklet. As the core ideas are interconnected to varying degrees, they appear in different numbers of test booklets. The tasks for one core idea were completed by a minimum of 89 students and a maximum of 660 students. At least 50 data sets are always available for the investigation of a relationship between two core ideas. A list of the core ideas is presented in Table 2. The study collected data in three different grades using a quasi-longitudinal approach as the LP reflects core concepts typically acquired across various school years. Furthermore, a real longitudinal analysis was conducted to evaluate the LP’s efficacy in measuring learning progress through associated test items. At the first measurement point, 1232 students participated, and at the second measurement point, 1215 students participated. Out of these two groups, 1070 students were the same. The students were selected to form as heterogeneous a group as possible in order to evaluate the usability of the LP as broadly as possible. Furthermore, the sample was selected in such a way that it can be assumed that the core ideas described in the LP were already part of the instruction. The students therefore came from different types of schools (comprehensive schools and grammar schools) and different year groups (1st - 3rd year chemistry education).
The students received tailored booklets specific to their grade level that contained test tasks for related core ideas. This allowed for the checking of dependencies between these ideas using the McNemar test, assuming that the identical students completed tasks for two core ideas.
![]()
Figure 1. Excerpt from the learning progression.
Table 2. List of core ideas.
Code
Core idea
SM-I-1
Substances have characteristic properties.
SM-I-2
Substances consist of particles.
SM-I-3
Substances can be distinguished and identified based on measurable properties.
SM-I-4
Substances of the same volume can have different masses.
SM-I-5
Certain substances dissolve in other substances.
SM-I-6
According to Dalton, substances are made up of atoms.
SM-I-7
Depending on the mobility of particles, substances can have different aggregate states between which transitions are possible.
SM-I-8
Substances can be classified into pure substances and mixtures.
SM-I-9
During dissolution processes, particles of the substances involved mix and rearrange themselves.
SM-I-10
Substances can be mixed, and mixtures of substances can be separated back into pure substances.
SM-I-11
Pure substances can be differentiated according to compounds and elements based on chemical reactions.
SM-I-12
Compounds and elements differ in their atomic structure.
SM-I-13
Atoms cannot be destroyed or created by chemical processes.
SM-II-1
Atoms consist of elementary particles that are charged differently.
SM-II-2
Each element is defined by the number of its protons and electrons.
SM-II-3
Protons and neutrons are located in the nucleus and account for almost the entire mass of the atom, whereas electrons are located in the atomic shell consisting of empty space, and they determine the atom size.
SM-II-4
The distribution of electrons in the atomic shell can be described by the shell model.
SM-II-5
The distribution of electrons in the atomic shell can be described by a simplified electron pair repulsion model (balloon model).
SM-II-6
The repulsion of electron pairs can explain the spatial structure of molecules.
SM-II-7
In the periodic table of the elements, all the elements are arranged in a fixed order.
SM-II-8
Atoms interact with each other via the outer shell.
SM-II-9
Atoms can form bonds with the participation of outer electrons.
SM-II-10
Atoms can form ions.
SM.-II-11
The formation of ions results in ionic bonding.
SM-II-12
The formation of shared electron pairs results in the electron pair (covalent) bond.
SM-II-13
The formation of positively charged atoms and freely moving outer electrons results in the metallic bond.
SM-II-14
Salts are made up of ions.
SM-II-15
The dissolving characteristics of substances are determined by their intermolecular interactions.
SM-II-16
Electron pair (covalent) bonds can be polar or nonpolar.
SM-II-17
The ability of an atom to attract bonding electrons is called electronegativity.
SM-II-18
Molecules consist of atoms held together by electron pair (covalent) bonds.
SM-II-19
Certain molecules have a dipole character.
CR-I-1
Chemical reactions produce new substances with properties different from those of the reactants.
CR-I-2
In chemical reactions, atoms are regrouped.
CR-I-3
In chemical reactions, the total mass of reactants is equal to the total mass of products.
CR-I-4
In chemical reactions, the number of atoms remains the same.
CR-I-5
Chemical reactions can be described with word equations.
CR-I-6
Chemical reactions are associated with energetic changes.
CR-II-1
Certain conditions must be met for substances to react with each other.
CR-II-2
Atoms react in such a way that they achieve noble gas configuration.
CR-II-3
Chemical reactions can be described by reaction equations.
CR-II-4
When substances react with each other and electrons are transferred, ionic compounds are formed.
CR-II-5
When substances react with each other and the outer shells of the atoms overlap, new compounds with electron pair bonds are formed.
CR-II-6
In redox reactions, electrons are simultaneously donated and accepted between the reaction partners.
CR-II-7
Chemical reactions can be described by the donor-acceptor principle.
E-I-1
Different forms of energy exist.
E-I-2
Energy can be neither created nor destroyed.
E-I-3
Chemical reactions release (give out) or absorb (use) energy.
E-I-4
(Chemical) energy is bound in substances.
E-I-5
Energy (heat) can influence aggregation states.
E-I-6
The progress of chemical reactions can be described in terms of energy.
E-I-7
Activation energy is necessary for chemical reactions.
E-II-1
The noble gas configuration is the most energetically favorable state of the atom.
E-II-2
The state of electrons in an atom can be changed by energy.
E-II-3
Electrical energy is provided through energy conversion.
E-II-4
Chemical reactions can be forced by electrical energy.
E-II-5
The acceptance and release of electrons are associated with energy transfers.
Data collection was performed at two measurement points (the beginning and end of a school half year). Students from various comprehensive and high schools in Germany participated in the data collection. At the first measurement point, the sample comprised N = 1232 students (49.9% female). Overall, 42.2%, 26.3%, and 31.5% came from the first, second, and third years of learning in chemistry, respectively.
At the second measurement point, N = 1215 students participated (50.5% female). The percentage of students was 43.8%, 26.7%, and 29.5% from the first, second, and third years of learning, respectively. Here, 1070 students participated in the study at both measurement time points.
3. Results and Discussion
3.1. Test Quality
The test items were developed and cross-checked for validity and correctness by two science educators and 6 - 8 chemistry teachers. Afterwards, the items were peer-reviewed by science educators not involved in the project. The analysis of the model fit for both measurement points was conducted using ConQuest® and was case-centered. A unidimensional model was estimated for both measurement time points, and the item characteristics (e.g., infit MNSQ values and associated t-values) were used to assess the items. The results of the unidimensional Rasch model for both time points are summarized in Table 3.
The item-related values were good at both measurement points. For all items, the Infit MNSQ values were in the valid range < 1.5. However, for 12 items (1st measurement) resp. 8 items (2nd measurement), the Outfit MNSQ values exceeded the cut-off range of productive items. 4 items (1st measurement only) exceeded the range of 2.0 for the outfit, making them distorting for measurement. Considering that only 4 of the 338 items were affected and a reanalysis without these items showed no difference in the model fit, the items were retained in the dataset for validity reasons.
The item separation reliability was remarkable at both measurement time points, implying that the item difficulties were reliably estimated. The person separation reliability (EAP/PV) was also good at both measurement time points. Thus, the person abilities were reliably estimated.
The mean item difficulty at the first measurement time point exceeded that at the second measurement time point. Conversely, the mean person ability at the first time point was lower than that at the second time point.
Table 3. Rasch parameters.
1st measurement
2nd measurement
Nsample
1232
1215
Nitems
338
338
Deviance
47749.99
52777.56
Item Separation Reliability
0.92
0.94
Person Separation Reliability (EAP/PV)
0.83
0.82
Infit Mean Square (weighted MNSQ)
0.8 to 1.34
0.75 to 1.3
t-Values
−3.2 to 3.2
−3.6 to 3.1
Outfit Mean Square (unweighted MNSQ)
0.6 to 2.32
0.62 to 1.83
To investigate the differences further, we first checked the data for normal distribution. A visual inspection of the histograms for both measurement points revealed no abnormalities. Despite the large sample size, the Shapiro-Wilk test is also not significant for either measurement point. A comparison of the mean item difficulties at the first (M = 1.35, SD = 0.88, Appendix 1) and second (M = 0.81, SD = 0.91; Appendix 2) measurement time points using a paired t-test (including only the 1070 students who participated in both measurements) revealed a significant difference. Accordingly, the items at the second measurement time point were easier than those at the first measurement time point (t(337) = −24.899, p < 0.001, d = 1.354). Considering that the students continued to be taught between both time points, this was expected. Thus, it can be concluded that the employed test could track the development of the students. Overall, the test was slightly difficult at both time points, indicating that the core ideas were not sufficiently mastered. The test was deliberately not modified because it was not designed to be a psychometrically optimized test for student diagnostics but rather to represent the core ideas of the LP in a content-appropriate manner. Summarily, the test matched the typical quality criteria and can be used to evaluate the LP.
3.2. Results
To investigate the dependencies between the core ideas, it was necessary to assess the knowledge of each idea. A new test instrument was developed for this purpose. The Rasch analysis conducted produced good results in terms of the model fit of the tasks, resulting in good estimates of the EAP/PV and item separation reliabilities. However, at both measurement time points, the task difficulties were high compared with the person abilities.
A distinction was made between two levels and three basic concepts in item construction. Core ideas that require a differentiated understanding of the submicroscopic level were assigned to Level II within each basic concept. This should also be evident in the examination of item difficulty, while no differences are to be expected for the basic concepts. When examining the average item difficulty in relation to the levels and the basic concepts, differences between the levels are apparent, while the basic concepts do not differ in difficulty from one another. In relation to the second measurement time point, the mean item difficulty of the first level (M = 0.51, SD = 0.86) is significantly lower than the mean item difficulty of the second level (M = 1.06, SD = 0.86) (t(336) = −5.86, p < 0.001). The calculation of an ANOVA to examine the mean item difficulty between the basic concepts of chemical reaction (M = 0.95, SD = 0.90), structure of matter (M = 0.81, SD = 0.86) and energy (M = 0.69, SD = 1.02) shows that the mean item difficulty of the three basic concepts cannot be significantly differentiated from one another (F(2, 335) = 1.424, p = 0.242) (Figure 2). The results also apply in the same form to the first measurement point.
The test results were subsequently used to analyze the dependencies between the core ideas. A total of 103 possible relationships between the ideas were assumed in the strand map based on an expert rating. These were examined using the McNemar test (Table 4). For this purpose, the datasets from both time points were combined to achieve the largest possible database. This yielded the students who participated at both time points in the two datasets for analysis. The students were taught between the two measurement time points; thus, it was assumed that they had increased their knowledge in the interim. Therefore, it was legitimate to have them entered into the analysis with two person abilities. The items for one core idea were completed by at least 89 (low-connected idea) to 660 (high-connected idea) students. Except for one relationship, all the relationships between two core ideas had more than 50 responses, indicating that the items related to both ideas were answered by the same students. Of the 103 relationships, 61 were confirmed significant, and 42 could not be confirmed significant. However, it must be considered that, in many cases, this was because neither of the two ideas had been sufficiently mastered. Figures 3-5 show the percentage of students who mastered a core idea. It should be noted that these diagrams only provide an overview of whether an unproven dependency could also be due to a lack of at all correct answers to this core idea. The diagrams should therefore be interpreted in such a way that only the proportion of mastered core ideas shown here can be used to empirically check the dependencies leading to this idea. For example, if we look at core idea CR-I-5 in Figure 4, 44% of our test persons mastered this core idea. If one wants to examine whether the dependencies leading to this core idea are actually given, one can therefore only examine for these 44% whether they also master the underlying connected core ideas. However, the diagrams do not provide any information about the absolute difficulty of the core ideas, as the core ideas were preferably presented to students in whose grade level it was expected that these core ideas would be addressed. Although the assessment was administered in grades that require the corresponding core ideas as mandatory standards, in most cases, only 10% - 44% correctly answered four out of five test items on a core idea, which inevitably resulted in relatively few analyzable cases for testing the dependencies between two ideas. Thus, many dependencies could not be considered disproven, only unproven.
![]()
Figure 2. Item difficulty (2nd measurement).
Table 4. McNemar test on relations between core ideas.
Assumed interdependency
McNemar test (p value)
Relation
SM-I-1 → SM-I-3
0.710
Not confirmed
SM-I-1 → SM-I-10
<0.001
Confirmed
SM-I-1 → SM-I-8
1.000
Not confirmed
SM-I-1 → CR-I-1
<0.001
Confirmed
SM-I-3 → SM-I-4
0.004
Confirmed
SM-I-3 → SM-I-10
<0.001
Confirmed
SM-I-4 → SM-I-10
0.243
Not confirmed
SM-I-8 → SM-I-10
0.004
Confirmed
SM-I-8 → SM-I-11
<0.001
Confirmed
SM-I-8 → SM-I-5
<0.001
Confirmed
SM-I-2 → SM-I-8
0.080
Not confirmed
SM-I-2 → SM-I-7
0.038
Confirmed
SM-I-7 → SM-I-9
<0.001
Confirmed
SM-I-5 → SM-I-9
0.424
Not confirmed
SM-I-11 → SM-I-6
0.791
Not confirmed
SM-I-11 → SM-I-12
0.791
Not confirmed
SM-I-6 → SM-I-12
1.000
Not confirmed
SM-I-6 → SM-I-13
0.424
Not confirmed
SM-I-6 → CR-I-4
0.001
Confirmed
SM-I-6 → CR-I-2
0.003
Confirmed
SM-I-12 → SM-II-1
<0.001
Confirmed
SM-II-1 → SM-II-2
<0.001
Confirmed
SM-II-2 → SM-II-3
0.019
Confirmed
SM-II-3 → SM-II-4
1.000
Not confirmed
SM-II-3 → SM-II-7
0.728
Not confirmed
SM-II-4 → SM-II-7
0.710
Not confirmed
SM-II-4 → SM-II-5
<0.001
Confirmed
SM-II-4 → SM-II-9
<0.001
Confirmed
SM-II-4 → SM-II-8
0.010
Confirmed
SM-II-4 → CR-II-2
0.014
Confirmed
SM-II-4 → E-II-2
<0.001
Confirmed
SM-II-8 → SM-II-9
0.005
Confirmed
SM-II-8 → SM-II-10
0.064
Not confirmed
SM-II-8 → CR-II-6
<0.001
Confirmed
SM-II-8 → E-II-1
0.824
Not confirmed
SM-II-9 → SM-II-13
0.007
Confirmed
SM-II-9 → SM-II-12
0.072
Not confirmed
SM-II-9 → SM-II-11
0.078
Not confirmed
SM-II-10 → SM-II-11
0.503
Not confirmed
SM-II-10 → SM-II-14
0.359
Not confirmed
SM-II-10 → SM-II-17
0.008
Confirmed
SM-II-11 → SM-II-14
0.093
Not confirmed
SM-II-11 → E-II-5
0.167
Not confirmed
SM-II-9 → SM-II-13
0.007
Confirmed
SM-II-9 →SM-II-12
0.072
Not confirmed
SM-II-9 → SM-II-11
0.078
Not confirmed
SM-II-10 → SM-II-11
0.503
Not confirmed
SM-II-10 →SM-II-14
0.359
Not confirmed
SM-II-10 → SM-II-17
0.008
Confirmed
SM-II-11 → SM-II-14
0.093
Not confirmed
SM-II-11 → E-II-5
0.167
Not confirmed
SM-II-12 → SM-II-17
0.503
Not confirmed
SM-II-12 → SM-II-18
0.004
Confirmed
SM-II-5 → SM-II-6
1.000
Not confirmed
SM-II-17 → SM-II-16
0.013
Confirmed
SM-II-16 → SM-II-15
0.039
Confirmed
SM-II-16 → SM-II-19
1.000
Not confirmed
SM-II-18 → SM-II-6
<0.001
Confirmed
SM-II-6 → SM-II-19
0.625
Not confirmed
SM-II-19 → SM-II-15
0.065
Not confirmed
CR-I-1 → CR-I-3
<0.001
Confirmed
CR-I-1 → CR-I-2
0.114
Not confirmed
CR-I-1 → CR-I-5
<0.001
Confirmed
CR-I-1 → CR-I-6
0.361
Not confirmed
CR-I-3 → CR-I-4
0.014
Confirmed
CR-I-3 → CR-I-2
0.012
Confirmed
CR-I-3 → SM-I-13
0.607
Not confirmed
CR-I-2 → CR-I-4
0.532
Not confirmed
CR-I-2 → CR-II-5
0.832
Not confirmed
CR-I-2 → CR-II-4
0.454
Not confirmed
CR-I-5 → CR-I-2
<0.001
Confirmed
CR-I-5 → CR-I-3
<0.001
Confirmed
CR-I-6 → CR-I-5
<0.001
Confirmed
CR-I-6 → CR-I-7
<0.001
Confirmed
CR-II-1 → CR-II-2
0.227
Not confirmed
CR-II-2 → CR-II-4
0.003
Confirmed
CR-II-2 → CR-II-6
<0.001
Confirmed
CR-II-2 → CR-II-5
0.012
Confirmed
CR-II-5 → CR-II-3
<0.001
Confirmed
CR-II-4 → CR-II-6
<0.001
Confirmed
CR-II-4 → CR-II-7
<0.001
Confirmed
CR-II-4 → CR-II-3
<0.001
Confirmed
CR-II-4 → SM-II-11
0.012
Confirmed
CR-II-3 → CR-II-7
0.774
Not confirmed
CR-II-6 → CR-II-7
0.070
Not confirmed
CR-II-6 → CR-II-3
0.219
Not confirmed
CR-II-6 → E-II-4
1.000
Not confirmed
CR-II-6 → E-II-3
<0.001
Confirmed
CR-II-6 → E-II-5
0.002
Confirmed
E-I-1 → E-I-5
<0.001
Confirmed
E-I-1 → E-I-3
<0.001
Confirmed
E-I-1 → E-I-2
<0.001
Confirmed
E-I-5 → SM-I-7
0.470
Not confirmed
E-I-2 → E-I-3
0.007
Confirmed
E-I-2 → E-I-4
0.590
Not confirmed
E-I-2 → E-II-5
<0.001
Confirmed
E-I-2 → E-II-3
0.043
Confirmed
E-I-3 → E-I-4
0.136
Not confirmed
E-I-3 → E-I-7
<0.001
Confirmed
E-I-3 → E-II-2
0.021
Confirmed
E-I-3 → E-II-5
<0.001
Confirmed
E-I-3 → CR-I-6
0.018
Confirmed
E-I-7 → E-I-6
<0.001
Confirmed
E-I-7 → CR-II-1
0.001
Confirmed
E-II-1 → CR-II-2
0.453
Not confirmed
E-II-1 → SM-II-8
0.824
Not confirmed
E-II-1 → E-II-2
0.001
Confirmed
E-II-1 → E-II-5
0.004
Confirmed
E-II-5 → E-II-4
0.070
Not confirmed
E-II-5 → E-II-3
0.043
Confirmed
![]()
Figure 3. Percentage of mastered core ideas (structure of matter).
![]()
Figure 4. Percentage of mastered core ideas (chemical reaction).
![]()
Figure 5. Percentage of mastered core ideas (energy).
3.3. Discussion
To improve the development level of the lower-performing students, it was necessary to structure the subject knowledge systematically and in a networked manner, such that the knowledge acquisition in chemistry lessons runs along a thread. LPs provide a suitable framework for this.
In the present context, core ideas were first theoretically derived for the three basic concepts (structure of matter, chemical reaction, and energy). These core ideas represent the fundamental knowledge elements that contribute to the understanding of the specific topic area. Through these ideas, the basic concepts were broken down into smaller knowledge elements and linked to each other in a strand map, such that hierarchically structured learning paths for the first 2 years of learning were presented. This strand map was empirically tested for dependencies. Most of the assumed dependencies were statistically proven, confirming the initial hypothesis that chemical expertise is acquired in a networked and cumulative manner. This finding also showed that deficits in subject knowledge, once developed, impede further knowledge acquisition. With the low competencies of the present participants, an imminent need for action is apparent. Although the sample chosen to examine the map was supposed to have mastered the core ideas based on educational standards, the majority did not. This also led to the conclusion that it is uncertain whether the unproven dependencies do not exist. This also led to the fact that, for the unproven dependencies, it is uncertain if they indeed do not exist. It appears more likely that they could not be detected because of inadequate correct solutions to the test items. Contrarily, the proven dependencies can be assumed to be valid and, thus, they can be used for lesson planning and diagnosis.
The strength of the LP lies in its ability to examine individual dependencies between core ideas. This analysis showed that 61 of these dependencies were statistically significant, making them verified findings that can be utilized in lesson planning and evaluation. However, it should not be assumed that the 42 unconfirmed dependencies indicate no connection between the core ideas. Further research is necessary because in many cases there was not enough mastery of the core ideas to make reliable statements. In addition to assessing individual dependencies, we analyzed the LP in its entirety using Rasch analyses. We demonstrated that the LP-based tests effectively capture learning progress between two measurement points and that core concepts classified at a higher level are significantly linked with increasing difficulty.
The LP has various potential applications beyond research, including its use in school contexts for diagnostic purposes. Its scope in Germany is 2-3 school years, and it is likely to be similar in other countries. The LP’s development drew from diverse sources; thus, its thematic breadth makes it non-specific to a particular curriculum. Teachers can mark the LP to identify the core ideas that their students must master. They can then use appropriate test items for diagnosis. Our LP not only arranges core ideas by difficulty but also assesses which core ideas others depend on, which means that this knowledge can be used for diagnosis-based interventions. When examining the concept presented in SM-I-10, which states that substances can be mixed and separated into pure substances (as shown in Figure 1), it becomes clear that this core idea depends on three other core ideas (SM-I-1, SM-I-3, and SM-I-8). Therefore, if a student has not grasped SM-I-10, the LP can be utilized to determine if the student has mastered the underlying core ideas at all. If so, support at the level of idea 10 will be useful; if not, knowledge of ideas 1, 3 or 8 must be built up first, depending on the deficit.
Conversely, the LP can also be used so that students can monitor their learning success. After free work phases or project phases, students can check their knowledge of assigned core ideas and, if necessary, be assigned further learning materials if the core ideas have not yet been mastered. Further development could be, for example, linking online tests with digital feedback or digital learning materials that can be adapted to the students’ strengths and weaknesses.
A third potential application is in lesson planning. Often, lessons are planned based on topics or contexts where the specific subject structure of knowledge is not explicitly present. The use of an LP can help teachers to systematically check which subject-specific core ideas are required for a series of lessons or which subject-specific core ideas are acquired in the series of lessons. This can be useful in evaluating the success of the lesson through assessments. The core ideas can also be used to make the learning objectives of a series of lessons transparent to the students in the sense of an advance organizer (Shihusa & Keraro, 2009) .
For all the purposes mentioned, the LP presented here has the advantage that it covers a comparatively long period and can map relationships between different basic concepts.
4. Conclusion
The strand map can be used at different levels. It can provide teachers with new impulses for lesson development by offering a planning, orientation, and structuring aid regarding content knowledge. Considering the performance expected from students, the strand map can be used to plan lesson series. In addition, it can be used for diagnostic purposes. If certain core ideas are not understood, the map can be used to purposefully check if these ideas, which form the prerequisite for the addressed idea, are mastered at all. This can be used to provide individual feedback and learning aids. Thus, further studies on instructional measures for teaching with LPs need to be conducted and evaluated. It is yet to be determined whether instruction that is oriented toward the strand map is more successful. However, not all assumed dependencies between the core ideas were proven to be statistically significant. This was due to the overall low knowledge of the students. Further studies are required to examine if the presumed interdependencies between the ideas do not exist or whether the interdependencies become detectable when the underlying ideas are better mastered. In addition, the map would still be required to be expanded and evaluated for higher knowledge levels.
5. Limitations
Our study has limitations. The dependence of core ideas can be reliably described based on the data. However, as mentioned previously, unproven dependencies may also be due to insufficient numbers of students who have mastered the core ideas, and therefore, they should be interpreted with caution. We see an advantage in using the McNemar test to test the dependencies compared to studies that solely look at the Rasch parameters. Nevertheless, it should be mentioned that due to the number of tests to be conducted, a few significances may occur by chance. We only have quantitative data from students on standardized items. We do not possess qualitative data from interviews or open tasks. Even if it is not to be expected that the results are significantly influenced by this, it should be mentioned that the data was collected exclusively from a German sample.
Author Contributions
Maik Walpuski: Conceptualization, Funding acquisition, Project administration, Writing—original draft. Kübra Nur Celik: Data curation, Formal analysis, Writing—review and editing.
Acknowledgements
We would like to thank the Qualitäts- und Unterstützungsagentur - Landesinstitut für Schule des Landes Nordrhein-Westfalen (Quality and Support Agency - State Institute for Schools of the State of North Rhine-Westphalia, Germany) for their support in developing the strand map. We also thank the students, teachers, and school administrators for their participation in the study. We acknowledge support by the Open Access Publication Fund of the University of Duisburg-Essen.
Appendix
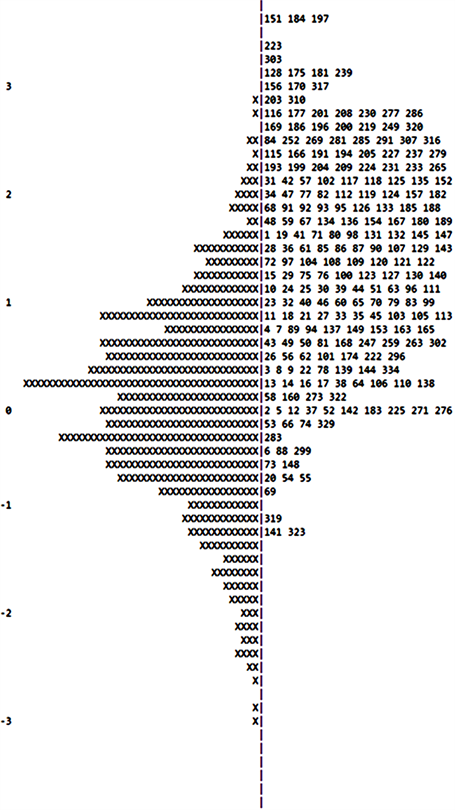
Appendix 1. First measurement of Wright map, x represents 2.2 cases, ConQuest® does not show all items due to space limitations.
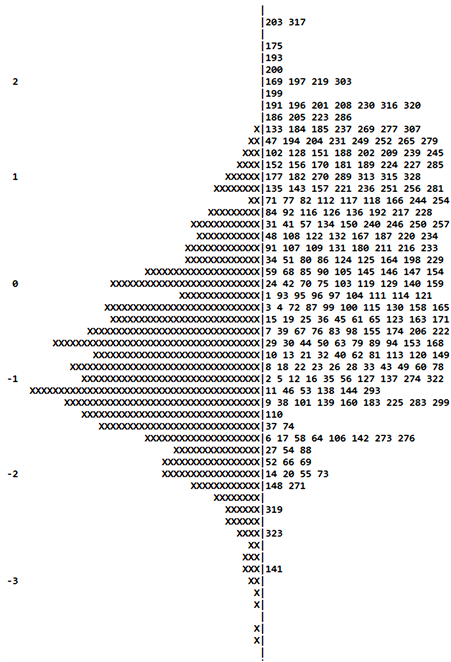
Appendix 2. Second measurement of Wright map, x represents 1.9 cases, ConQuest® does not show all items due to space limitations.
Appendix 3: Test item for “Substances have characteristic properties”.
A piece of iron has the following properties:
· round shape,
· Density of 7.86 g/cm3,
· Temperature of 21˚C,
· Mass of 450 g.
Which of the following properties can be used to identify the substance iron?
q
Shape
ý
Density
q
Temperature
q
Mass
Appendix 4: Test item for “Substances have characteristic properties”.
You have three white powders that are indistinguishable to the eye. What would you have to examine to find out if they are the same substance?
q
It is sufficient to examine the color of the powder more closely.
q
The white powders are the same substance because they occur in a solid state.
ý
Despite having the same appearance, the powders must be tested for other material properties such as solubility in water and electrical conductivity.
q
The examination of a single substance property such as solubility is always sufficient to determine whether the white powders are the same substance.
Appendix 5: Test item for “Chemical reactions produce new substances with properties different from those of the reactants”.
Which statement describes a chemical reaction?
ý
When heated, solid ice turns into liquid water.
q
When salt is dissolved in water, both substances become salt water.
q
When oxygen nitrogen and other gases are mixed, the substances become air.
q
When coal is burned in oxygen, both substances become carbon dioxide.
Appendix 6: Test item for “Chemical reactions produce new substances with properties different from those of the reactants”.
A chemical reaction usually occurs when...
ý
The properties of the starting materials differ from those of the end materials.
q
The properties of the starting materials and end materials have remained the same.
q
The aggregate state of the starting materials changes.
q
Starting materials can be mixed and mixtures of substances are created.