INTRODUCTION
In essential hypertension (HT) in adults, a significant association has been demonstrated between changes in left ventricular geometry and P-wave dispersion (Pd), the difference between maximum and minimum P-wave duration measured on simultaneously recorded 12-lead EKG.[1]
The P-wave represents atrial depolarization, and its maximum duration represents atrial activation time. The clinical significance of P-wave duration has been demonstrated in many conditions, especially paroxysmal atrial fibrillation (PAF) in adults. Maximum P-wave duration of up to 103 ms and Pd of up to 27 ms have been reported as normal for children.[2–4]
In adults, higher Pd is related to greater PAF risk. with still greater risk among patients with longer maximum P-wave duration (134±11 ms vs. 128±13 ms); a Pd cutoff of 46 ms was found to predict PAF in patients with hypertrophic cardiomyopathy, with 76% sensitivity and 82% specificity.[5] A study in dogs found higher Pd values predictive of PAF recurrence after cardioversion.[6] High Pd values have also been found in patients with metabolic syndrome and HT risk.[7]
Atrial dilation and atrial interstitial fibrosis have been recognized in atrial remodeling; these changes involve the renin-angiotensin system, which is already known to be part of the pathophysiology of hypertension, through the profibrotic effect of angiotensin II. Reversion of atrial remodeling has been achieved with angiotensin-converting enzyme inhibitors and with angiotensin II receptor blockers.[8–11] In adults, there is an important relation among HT, Pd associated with PAF, and left ventricular hypertrophy.[12] High Pd has also been observed in obese women.[13]
In light of current knowledge, we posited the following hypothesis for children: hypertension or pre-hypertension is related to clinically overweight or obese status, and Pd values in these children should be greater than those of normotensive peers.[14] Given the association described in adults between Pd and blood pressure (BP) and obesity, the objective of this study was to determine Pd’s association with BP and nutritional status in a pediatric population.
METHODS
This study is part of the Development Center Community Outreach project for diagnosis and management of hypertension in children (PROCDEC II) in Spain and Cuba, which began in 2000; the Cuban segment includes 5025 children aged 8–11 years from 43 urban primary schools in the municipality of Santa Clara in Villa Clara Province and involves a multidisciplinary research group of pediatricians, cardiologists, pediatric cardiologists, endocrinologists, clinical laboratory specialists, psychologists, statisticians and computer scientists.[15]
A detailed clinical history was taken of all children and pertinent testing performed (two-dimensional abdominal and renal ultrasound, renal artery Doppler ultrasound, thyroid hormones, echocardiogram to rule out coarctation of the aorta, vanilmandelic acid, fundoscopic exam, creatinine, proteinuria, albuminuria and microalbuminuria) to diagnose essential and secondary hypertension. Participants were also assessed for other comorbidities (diabetes; hematologic, renal and adrenal diseases; hypertrophic cardiomyopathy) and for pubertal development (Tanner stage).[16]
Type of study and sample A cross-sectional study was conducted from September 2009 through June 2011, using cluster sampling and randomly selecting the schools involved, with a potential sample of 720 children for the selected ages. Of these, 656 were studied, or 13% of the PROCDEC population; the children were in third, fourth and fifth grades at three urban primary schools during the 2009–2010 and 2010–2011 school years.
Inclusion criteria Children aged 8–11 years at Tanner stage 1 of sexual development (prepuberty, when there is still no influence of sexual hormones).[16]
Exclusion criteria Pronounced fear or stress in presence of medical personnel (per psychological examination); history of congenital heart disease or discovered during the study; secondary hypertension;[17,18] other comorbidities (diabetes; hematologic, renal and adrenal diseases); idiopathic hypertrophic cardiomyopathy (ruled out by echocardiography);[19] prescription medications.
Study variables The main variables were mean arterial pressure (MAP) and Pd; secondary variables were sex, height and weight, the latter two necessary for adjustment to avoid confounding, since they affect BP. Body mass index (BMI) was also calculated as an indicator of nutritional status.[20,21] Diastolic and systolic BP were used to calculate MAP and to classify children’s blood pressure status.
BP Measurement and MAP calculation Standard methods were used, with a calibrated sphygmomanometer (model SW-AS02, Rusian Sunnyworld International Trade Company, China) approved by Cuba’s National Standards Office; all measurements were done by the same personnel and under similar conditions. Sphygmomanometer cuff size was matched to arm circumference (7.5 cm cuff for children with arm circumference ≤18.5 cm, and a 9 cm cuff for children with arm circumference 18.6–22.5 cm) and a pediatric stethoscope was used.[17] BP was taken on the right arm (resting on a table) and with the child seated, after a resting period of ten minutes.
Four BP measurements were taken on different days; MAP was calculated each time, and mean MAP calculated at the end, applying the equation used by physiologists in previous studies: MAP = diastolic BP + [(systolic BP − diastolic BP)/3]. Systolic BP − diastolic BP is known as pulse pressure.[22]
The children selected for the study had little experience with BP measurement, so beforehand, they were shown an animated video to familiarize them with the procedure and explain hypertension. Children were only inducted into the study when psychologists judged that the medical team’s presence would not be stressful for them.
Children were classified as:
- Normotensive: BP <90th percentile for age, sex and height
- Prehypertensive: BP 90th–95th percentile for age, sex and height
- Hypertensive: BP >95th percentile for age, sex and height[17]
EKG and Pd measurement Simultaneously recorded 12-lead surface EKG was performed with an electrocardiograph (Nihon Kohden, Japan) standardized for a velocity of 50 mm/s using millimeter paper. P-waves were measured for each lead. Maximum P-wave duration was the highest P-wave value measured; minimum P-wave duration was the lowest; Pd was the difference calculated between maximum and minimum.
P-wave was measured manually using a ruler (BIOTRONIK, Germany), according to the method described by Chávez and Carmona, employed in other published studies.[23–25] For this study, EKGs with 10 or more leads with measureable P-waves were used, following guidelines for P-wave measurement and Pd calculation.[1,26] None of the EKG measurements was excluded.
Height and weight measurements Children were weighed in kilograms and measured in meters while barefoot, using a height and weight scale (model ZT-120, China) employed in pediatric cardiology exams.
BMI calculation and classification of nutritional status BMI was calculated as weight for height in kg/m2. Cuba’s national BMI tables use the following classification (age- and sex-specific):[20]
- Underweight, <3rd percentile
- Normal weight, 3rd–89th percentile
- Overweight, 90th–97th percentile
- Obese, >97th percentile
Degree of obesity was calculated as actual weight/ideal weight × 100 (%),[21] taking the 50th percentile for height and weight on the national tables as the ideal weight.[20] Obesity was classified as follows:
- Mild, 120–129%
- Moderate, 130–139%
- Severe, 140–199%
- Morbid, ≥200%
Ethics The study was approved by the ethics committees of the Central University of Las Villas (UCLV, the Spanish acronym) and José Luis Miranda Pediatric University Hospital, following approval by the ministries of public health and education in March 2007. Written informed consent was obtained from parents or guardians; children were free to withdraw from the study at any time.
Statistical analysis Data were managed and analyzed using SPSS 17.0. Means and standard deviations were calculated, using p ≤0.05 as criterion for statistical significance in comparisons. Tests for sample homogeneity (one-way analysis of variance) and normality were performed, calculating significance values (<0.001), followed by parametric tests for analysis.
Analysis of variance was used to compare means of diagnostic groups (normotensive, prehypertensive and hypertensive), using one dependent variable (Pd and MAP, as applicable) and one independent variable (diagnosis). If p was <0.001, multiple post-hoc comparisons were then done using Scheffé’s test.[27] A linear correlation test was done for the two main study variables.
Multivariate analysis was performed on study variables (age, height, body weight, systolic BP, diastolic BP and MAP), to identify the independent variable with the greatest influence on Pd. Correlations were calculated using the linear correlation coefficient.
RESULTS
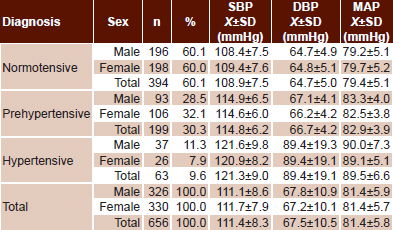
Most children in the sample (60.1%, 394/656) were normotensive, 30.3%(199/656) were prehypertensive and 9.6% hypertensive (63/656). A somewhat higher percentage of boys (11.3%, 37/326) than girls (7.9%, 26/330) were hypertensive. Mean systolic BP was 108.9±7.5 mmHg in normotensive children; 114.8±6.2 mmHg in prehypertensive children; and 121.3±9.0 mmHg in hypertensive participants. Mean diastolic BP was 64.7±5.0 mmHg in normotensive, 66.7±4.2 and 89.4±19.1 mmHg in prehypertensive and hypertensive children, respectively. Results were similar for MAP: normotensive, 79.4±5.1 mmHg; prehypertensive, 82.9±3.9 mmHg; and hypertensive, 89.5±6.6 (Table 1).
Mean Pd and MAP clearly increased across diagnostic categories from normotensive to hypertensive; differences were significant for both in intergroup comparisons of means (Table 2).
Table 3 shows nutritional status per BMI by age and sex. Most children were of normal weight (415/656, 66.3%), followed by the overweight group (123/656, 18.7%); overweight was more frequent in children aged 8 and 10 years; the former age group had the highest proportion of severely obese children. Severe obesity was also more common at those ages. A single boy had morbid obesity (0.2%), and only 1.2% (8/656) were underweight. Girls were more likely than boys to have mild (3.9% vs. 0.9%%) and moderate obesity (6.1% vs. 4.3%), but boys were more likely than girls to be severely obese (11.9% vs. 6.1%).
Table 1: Study sample blood pressure diagnosis by sex (n = 656)
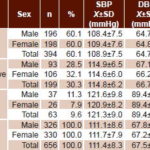
SBP: systolic blood pressure DBP: diastolic blood pressure
MAP: mean arterial pressure Х±SD: mean ± standard deviation
Table 2: P-wave dispersion and mean arterial pressure by blood pressure category (n = 656)*
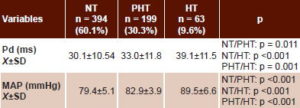
* Analysis of variance with multiple post-hoc comparisons[27]
NT: normotensive (<90th percentile)
PHT: prehypertensive (90th–95th percentile)
HT: hypertensive (>95th percentile for age, sex and height)
Pd: P-wave dispersion
MAP: mean arterial pressure
Х±SD: mean ± standard deviation
Table 3: Study sample nutritional status* by age and sex (n = 656)
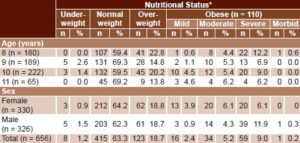
* Per body mass index
Underweight: <3rd percentile
Normal weight: 3rd–89th percentile
Overweight: 90th–97th percentile
Mild obesity: 120–129% of ideal weight
Moderate obesity: 130–139%
Severe obesity: 140–199%
Morbid obesity: ≥200%
When overweight and obese children with Pd >30.1 ms (mean Pd for normotensive children) were classified by BP, a small minority were normotensive, 15% of overweight and 5.8% of obese children (Table 4).
Table 4: Blood pressure in overweight and obese children with high P-wave dispersion*
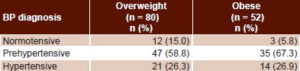
*>30.1 ms
BP: blood pressure
Pd: P-wave dispersion
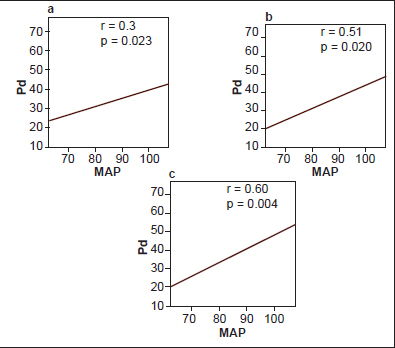
An age-, weight- and height-adjusted partial correlation between Pd and MAP was statistically significant for all BP diagnostic groups, and r values were greater in prehypertensive and hypertensive than in normotensive children.
The sequence in Figure 1 presents results of linear correlations between Pd and MAP for the different diagnostic groups: Figure 1a for normotensive (r = 0.33, p = 0.023), 1b for prehypertensive (r = 0.51, p = 0.020) and 1c for hypertensive children (r = 0.6, p = 0.004).
DISCUSSION
The near 40% prevalence of elevated BP (prehypertensive + hypertensive children) in this population is alarming. HT beginning in childhood or adolescence is an early risk marker for future cardiovascular disease, and this is particularly important in regions where cardiovascular disease is common.[28,29] Children with BP in the 90th to 95th percentile are at risk for frank HT, barring appropriate intervention.[29]
Figure 1: Linear correlations between Pd and MAP, adjusted for age, height and weight (n = 656)
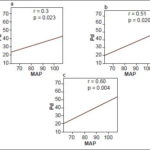
a: normotensive b: prehypertensive c: hypertensive
MAP: mean arterial pressure (mmHg) Pd: P-wave dispersion (ms)
HT prevalence in our study was lower than seen by Ferrer, whose study of 986 Cuban children found 6% hypertensive and 6.8% prehypertensive.[21] Other studies in Cuba report 4%–5.1% hypertension prevalence in adolescents, also lower than our findings, as well as much lower prevalence of prehypertension (16.8%–17%).[30,31]
A total of 28.4% of boys in Ferrer’s sample were overweight or obese, as were 30.7% of girls. In our study, overweight and obesity were practically identical in girls and boys (50.4% vs. 49.6% were overweight and 8.2% vs. 8.7% obese, respectively), and higher than Ferrer found.[21]
In our view, the influence of children’s poor dietary habits (i.e. junk food) and physical inactivity due to passive games has been on the rise in recent years in Cuba, and this may explain the greater number of prehypertensive children in our study. Hernández-Triana commented on this with respect to sedentary habits and the 13.5% prevalence of obesity in preschoolers.[32] The number of overweight or obese prehypertensive and hypertensive children in our study supports his observation. Chávez found a correlation between body weight and Pd in hypertensive children, although significance was borderline (p = 0.05) and the r value only 0.18; the same study also found higher mean body weight in hypertensive children.[33]
In adults, a relationship has been demonstrated between higher Pd on EKG and development of PAF due to electrophysiological abnormalities of the atrial wall. Higher Pd reflects greater intra- and interatrial conduction times, which suggests electrical heterogeneity at this anatomical level, as has been demonstrated in different clinical conditions that increase proinflammatory states.[34–37] Electrophysiological changes in the atrial wall have been observed in cases of platelet abnormalities with increased thrombogenesis, in inflammatory diseases such as psoriasis and mitral valve stenosis, and recently in children with type 1 diabetes.[38–41]
Carmona found higher Pd in recently diagnosed hypertensive adults,[42] as we found in recently diagnosed hypertensive children. This leads us to conclude that hypertension affects atrial conduction early on, leading to increased Pd, as postulated in an earlier study.[33] It has already been shown that in adults, Pd returns to normal with antihypertensive treatment,[36,37] so it stands to reason that early diagnosis of hypertension with timely initiation of treatment in children could reduce associated cardiovascular risk. In other words, HT management starting in childhood could prevent or delay target organ damage.
Beevers’ description of HT pathophysiology is relevant to the association we observed between MAP and Pd in normotensive, prehypertensive and hypertensive children; he explains that increases in systemic pressure increase left ventricle pressure and retrogradely increase left atrial pressure.[43] Retrograde increases in left atrial pressure have been related to stress on the wall and this in turn to development of electrophysiological conditions for atrial arrhythmias.[44] The role of the renin-angiotensin system in HT pathophysiology and in atrial remodeling has also been described; the latter increases atrial vulnerability to development of atrial arrhythmias.[45,46]
In our study, the highest values for the slope of r were obtained for hypertensive children, which supports a direct association between Pd and BP. Several studies in adults have pointed to this relationship and have also found decreased risk of arrhythmia with BP normalization. They have also shown that Pd values return to normal with decreased conduction heterogeneity of interatrial impulses.[1–5,46,47] An earlier Cuban study demonstrated greater atrial size and higher Pd in hypertensive children than in normotensive ones.[25] Another study, also in Cuba, found increased left ventricular mass index in hypertensive children, with higher Pd than in normotensive children.[24] Neither of the two earlier studies[24,25] evaluated the association between BP and Pd as this study did.
If the relationship between BP and Pd described in adults holds for pediatric patients, as suggested by our observations of significant associations between MAP and Pd in hypertensive children, this creates a potential means for early diagnosis and treatment of at-risk children and adolescents, which would have clear benefits for their future health. There are fewer risk scores for children[48] than adults (e.g., the Framingham Risk Score)[49] and one of the main problems in assessing cardiovascular risk in children is lack of hard endpoints or events. Hence, it is worth searching for EKG patterns predicting vulnerability in prehypertensive or hypertensive children, as has been done for adults. Pd screening of children who are prehypertensive, hypertensive, overweight or obese could identify patients more susceptible to future complications and hence provide opportunity for more effective treatment and followup.
In the literature reviewed, we did see higher correlation coefficients for the association between Pd and BP, but in adults with diseases such as hypertension and heart failure, with secondary inflammatory changes due to renin-angiotensin system activity.[45,46,50–52]
Accuracy of the method for measuring Pd is an important limitation of this study, especially when it comes to reproducing it in a setting where the Biotronik ruler is unavailable. In addition, we were unable to demonstrate anatomical and histological abnormalities found in atrial and ventricular myocytes of hypertensive patients, secondary to profibrotic damage caused by angiotensin II.[46,51] This is also a cross-sectional study, with a limited age range, in a sample of urban school children that might not be representative of all children in the same age group in other urban, suburban and rural regions of Cuba. Due to these limitations, we recommend the design of prospective studies in children to assess all variables related to Pd and hypertension together, as has been done in adults.[34–37]
However, despite the study’s limitations, we consider our results an important contribution to theoretical and practical knowledge that can facilitate design of prospective studies to assess electrocardiographic variables such as Pd—enabling development of pediatric risk scores—and of computerized studies to support or replace the manual work described here.
CONCLUSIONS
Measurement of the EKG P-wave and calculation of its dispersion appears to be a simple, economical and noninvasive method to detect incipient hypertensive cardiopathy in children (i.e., preclinical damage to the target organ). Despite being limited to the study group, these results signal the need for early BP management to ensure better future quality of life in these children. There is a need to identify electrocardiographic patterns showing vulnerability in children, as has been done for adults, in studies with larger sample size.