

Optimal Sizing of a Battery-Supported Electric Vehicle Charging Hub with a Limited-Capacity Grid Connection

Faculty of Technology, Amsterdam University of Applied Sciences, 1091 GC Amsterdam, The Netherlands
*
Author to whom correspondence should be addressed.
World Electr. Veh. J. 2024, 15(4), 133; https://doi.org/10.3390/wevj15040133
Submission received: 16 January 2024
/
Revised: 15 March 2024
/
Accepted: 17 March 2024
/
Published: 27 March 2024
(This article belongs to the Special Issue EVS36—International Electric Vehicle Symposium and Exhibition (California, USA))
Abstract
:The ever-increasing electrification of society has been a cause of utility grid issues in many regions around the world. With the increased adoption of electric vehicles (EVs) in the Netherlands, many new charge points (CPs) are required. A common installation practice of CPs is to group multiple CPs together on a single grid connection, the so-called charging hub. To further ensure EVs are adequately charged, various control strategies can be employed, or a stationary battery can be connected to this network. A pilot project in Amsterdam was used as a case study to validate the Python model developed in this study using the measured data. This paper presents an optimisation of the battery energy storage capacity and the grid connection capacity for such a P&R-based charging hub with various load profiles and various battery system costs. A variety of battery control strategies were simulated using both the optimal system sizing and the case study sizing. A recommendation for a control strategy is proposed.
1. Introduction
With the increased uptake of electric vehicles (EVs), the need for charging infrastructure is surging [1]. EVs are a part of a wider transition to electricity as an energy transmitter. Globally different economic sectors such as transportation, industry, and the heating of buildings are quickly being electrified [2]. Countries and cities that have historically relied on fossil fuels as the primary energy supply are facing issues as the electricity grid becomes congested, thus hampering the energy transition. For charging infrastructure, this implies that new grid connections or expansions are not available or a significant waiting list exists until grid expansion has been realised [3]. Charge point operators (CPOs) are looking for innovative ways to continue operations. These include battery-supported charging hubs.
Recently, a large number of sites have been installed with a battery energy storage system (BESS) at DC charging stations. Projects and studies with a BESS at large AC charging hubs have been missing. These projects are, however, more complex in terms of determining the optimal sizing of the system, as well as operating the system in the most efficient manner. These systems often require a lower, but more continuous, power than high-power DC systems. A temporary reduced power does not always have to be problematic. Inverter dimensioning and smart operation play a large role in the efficiency of the system. These unique features make dimensioning and the optimisation of these systems a different problem.
This paper is an expansion of the work presented at the EVS 36 conference [4].
1.1. Literature Review
There have been many studies that look into the use of batteries in combination with EV charging stations. Ref. [5] investigated the potential of a solar photovoltaic (PV) and BESS combination in a grid-tied, urban EV charging system. They optimised BESS and PV array sizing, but failed to consider the space requirements for such a large PV array and the shading effects from surrounding buildings. They used hourly time resolution, which is not fine enough for such a volatile source as PV, nor for an EV charging station. Ref. [6] included a diesel generator as a back-up power source for peak times. Whilst this can work as a viable solution for grid-limited locations, it failed to consider the idea that many urban environments are aggressively cutting back on diesel engines to improve air quality and citizen health. The more suitable 15 min data resolution was used in this study, but failed to consider conversion losses for any source or the BESS and did not specify the power per charge point. Ref. [7] looked at the use of a PV + BESS combination to support a grid-connected EV fast-charging station under a few scenarios. Again, the size of a PV system, especially if it is to have any impact on a fast charger, would need to be very large; they stated in the paper that this would have to be between 0.5 MWp–24 MWp for different scenarios. A 0.5 MWp PV array would require 1000 PV modules, and an array that is any larger would not be suitable for most urban environments.
The research on a BESS in combination with EV chargers has focused on fast chargers [8,9,10], and with good reason, given the grid volatility associated with the short duration and high power peaks from fast chargers. Again, refs. [8,9] did not use measured data and, instead, simulated EV loads; ref. [8] focused on plug-in hybrid EVs (PHEVs), a shortcoming given the prevalence of battery EVs (BEVs) nowadays, whilst [9] used four representational BEVs. Ref. [10] presented the optimal sizing of a BESS on a DC network with multiple fast chargers, a PV array, and industrial load. They used measured EV data; however, it is a general EV travel database and not specific to the case study. They do, however, investigate the charge scheduling of EVs and bi-directional charging to support the industrial load.
Access to reliable EV charging data is problematic. Refs. [5,8,9] simulated data using a mathematical formula. Ref. [6] derives data from another study. Ref. [7] uses data from a Dutch distribution network operator but included data from only two fast chargers and is, therefore, highly location specific.
Many other studies look into battery sizing optimisation in other applications, such as for prosumers in renewable energy communities [11], as neighbourhood-level storage at a low-voltage distribution level [12,13], and as storage in a microgrid setting [14,15,16].
Popular optimisation methods are the particle swarm optimisation algorithm, used in [5,7], and genetic algorithms (or variants thereof) such as in [11,12,13,17]. The objective function often seeks to minimise the annual investment cost, although other objective functions may include maximising self-consumption from PV production or minimising grid interaction.
1.2. Case Study
In a bid to further incentivise and provide for EVs whilst minimising the grid impact, Amsterdam, in partnership with local energy service provider Vattenfall and maintenance provider Heijmans, has installed a charging solution at a Park and Ride (P&R) facility. Thus, in order to be considered a small consumer, and therefore benefit from a faster connection time and reduced connection costs [18], a maximum grid connection capacity of 3 × 80 A was imposed. This pilot project serves as a learning opportunity for BESS-supported AC charging hubs. To further limit grid interaction, there was to be no energy flowing back to the grid from the BESS. This clause prevents profiting from energy arbitrage and limits the business case of this system.
Smart-charging strategies are often thought of as a first potential solution to grid-limited CPs, such as load shifting by suspending charge sessions or scaling current delivery with total CP power demand. In a P&R charging hub, smart charging can offer an improved charging efficacy both for the users and for the network operator. However, to ensure the user experience is not negatively impacted in the coming years due to increased EV penetration, this pilot project sought to investigate the use of a BESS.
1.3. Contribution
To the authors’ knowledge, there have been no studies or projects besides the case study that supplied a charging hub using only a grid connection and BESS with the intention that the BESS limits grid loading during peak grid-load hours. This work uses measured data from the case study to address the oversized BESS and optimise the BESS and grid connection capacity using a variety of load profiles and 5 min time resolution. The model developed is a generalisable model of a BESS-supported type-2, level-2 charging hub, and is easily scalable for any number of CPs, grid connection capacity, BESS capacity, and load profile. The optimal system size was compared against the case study system for a number of BESS control strategies to form recommendations on sizing and control.
1.4. Structure
The paper is structured as follows: Section 2 introduces the optimisation problem, Section 3 describes the case study and details the model development, and Section 4 describes the chosen control strategies. Section 5 presents the optimal BESS and grid connection sizing for the case study and compares this against the currently installed case study sizing for a variety of control scenarios. For three different monthly loads, the change in the loss of load is plotted against the BESS capacity. Section 6 discusses the results in a broad and generalised frame, offering recommendations to future system developers and proposals for future work. Finally, Section 7 concludes the study.
2. Optimisation Problem
The sizing of a BESS in a grid-limited AC charging hub should be large enough to aid in supplying demand but not oversized such that there is an excess of capacity. A BESS remains an expensive investment so the intention is to keep the storage capacity minimal.
The Pymoo Python library [19] was used to form and solve the optimisation problem using a (µ + λ) genetic algorithm. The optimisation problem considered mixed variables: integers over a range and the set of four discrete grid connection values. The Pymoo library only offers a genetic algorithm to solve such a mixed variable problem. Furthermore, future work will consider a multi-objective optimisation problem for which the NSGA-II algorithm can be used. The developers of the NSGA-II algorithm developed the Pymoo library, hence its choice. It is important to note that a genetic algorithm will find near-optimal solutions, and other algorithms may arrive at a more optimal solution.
The BESS control will have an effect on the optimisation process. In this optimisation problem, the standard ‘base-case’ control was used, which was derived from the case study. It is assumed that, in a newly installed and optimal system, the BESS would have individual phase power delivery, and, thus, phase imbalance and grid feedback would not be an issue. This means that the grid delivers up to the full connection capacity, and, if the BESS delivers power, it delivers only the remaining load above the maximum grid capacity.
The objective function is presented in Equation (1):
where is the cost of the BESS installation, currently approximately 650 €/kWh [20,21]. is the cost of installation per grid connection capacity as presented in Equation (2) [18]. is the profit from the electricity sale, assumed to be 0.1 €/kWh. The battery investment is annualised by dividing by the expected system lifetime , 10 years as per the battery supplier capacity warranty. Similarly, the monthly loss of load, LL, is annualised by multiplying by 12. is the mean battery round-trip efficiency. Operational and maintenance costs of the BESS are not included in this objective function since it is assumed that they would remain similar for a BESS regardless of its capacity.
The case study system had a BESS power–energy ratio of 0.71. The constraint represented by Equation (3) was implemented to maintain a similar power–energy ratio. This allowed for some tolerance around the target value. To ensure a high quality of service, the constraint represented by Equation (4) was implemented, limiting the lost potential load, LL, to 100 kWh. This is equivalent to approximately 1.5% of the 7 MWh load profile used in the optimisation.
where is the total EV power demand at time , is the base load at time , is the power supplied by or delivered to the battery at time , and is the power supplied by the grid at time . The battery current convention employed is a negative battery power for discharging. The sum of power over the entire time-series is then multiplied by 1/12 to convert from the 5 min time step to hours. T is the total time period of 1 month. All other constraints, Equations (5)–(8), were internal to the system model and were handled during simulation runtime. These included the power balancing, the battery state-of-charge (SOC) limits, and the battery charge/discharge power limits.
Due to the stochastic nature of the model, a single month-long load profile was formed and repeatedly used for the simulations in the optimisation process:
- A parent population of potential solutions was generated containing the decision variables , , and ;
- A simulation was performed for a single potential solution, and the outputs LL and were retrieved;
- Using these five decision variables, the objective function was evaluated and the results saved;
- This process was repeated for all possible solutions in the population of the current generation;
- A new parent population was created for the next generation, as the GA describes, allowing for crossover and mutation.
This study optimised the BESS capacity and grid connection capacity for a monthly load of 7 MWh (28 kWh/CP/day). Various BESS costs have been considered that span costs of up to the expected 2030 cost per kWh. The problem considered the base-case control strategy, defined in Section 4, and the discrete grid connection capacities of 3 × 25 A, 3 × 35 A, 3 × 50 A, and 3 × 80 A. The algorithm used a population size of 50 for 10 generations.
Additionally, the capacities were optimised for both a 5 MWh monthly load and a 6 MWh monthly load. All feasible solutions were plotted as the loss of potential load against the BESS capacity. These figures clearly illustrate the relationship between the BESS capacity and the loss of load.
3. Case Study
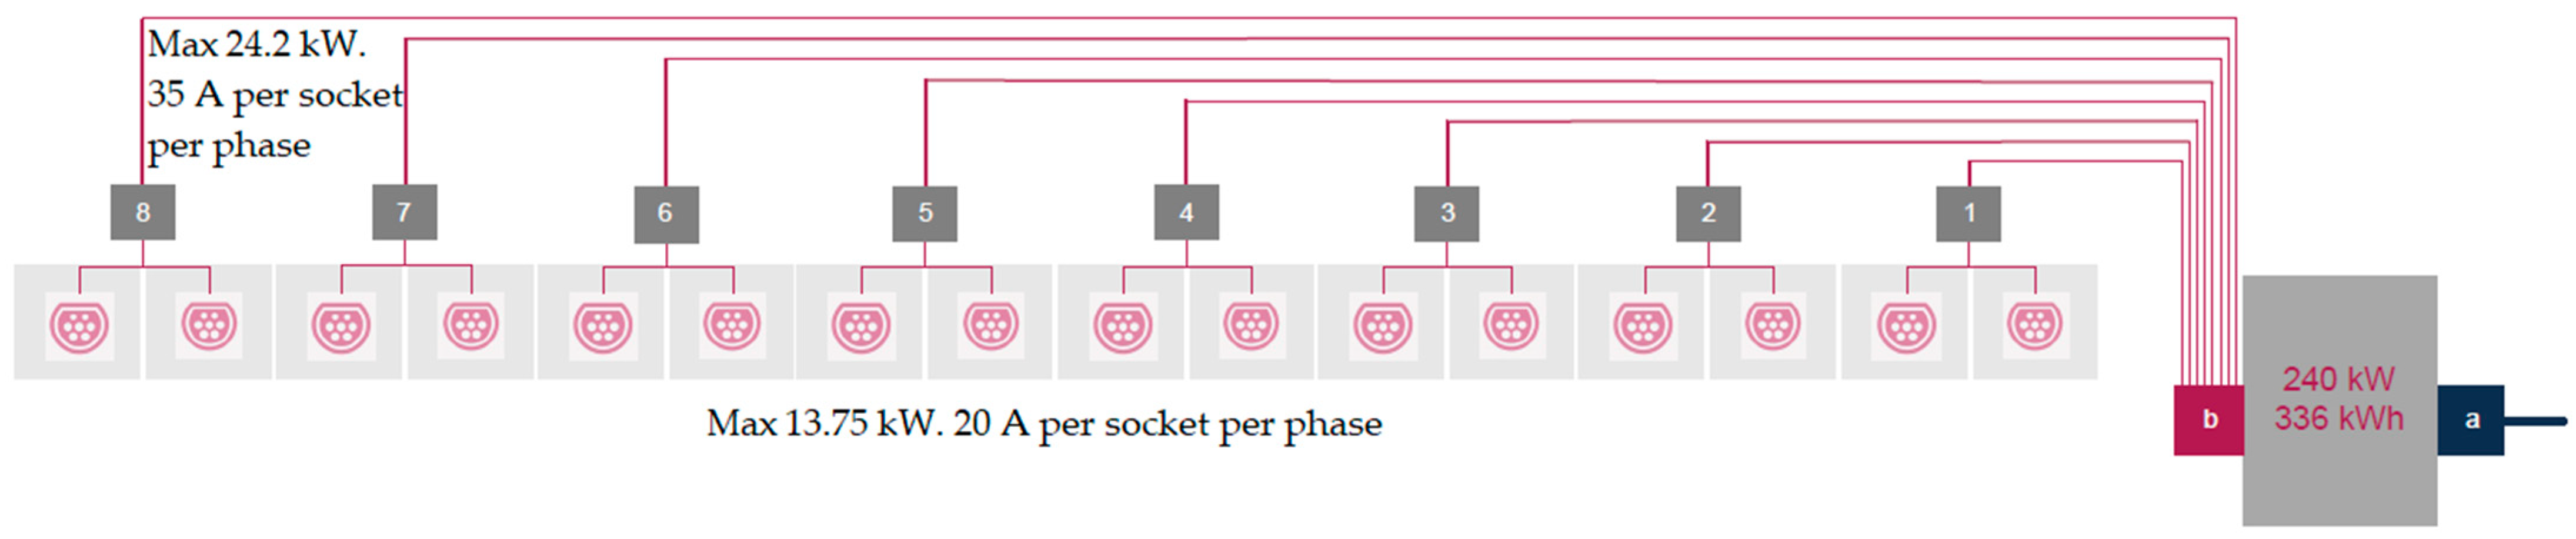
The main characteristics that define the BESS and CPs are presented in Figure 1 and Table 1. A 3 × 80 A grid connection is fed into the container housing the BESS, point a in Figure 1. The BESS is compiled from four battery stacks connected in parallel via four separate inverters, each fitted with a 100 A breaker. There is an air-conditioning unit within the BESS container to ensure a safe operating temperature is maintained. Leaving the container is the AC feeder line, point b in Figure 1, to which each of the eight dual-connector CPs are connected in parallel. Each dual-connection CP has had the phase connections rotated, as is standard [22]. In Case 2, single-phase EVs connect to the same CP, and phase rotation ensures they do not load the same phase. Each CP is fitted with a 35 A fuse per phase and each socket within the CP is fitted with a 20 A fuse per phase. This setup allows for the CPs to draw power from the grid, from the BESS, or a combination of the two. Similarly, the grid connection can feed power to both the CPs and the BESS given the available capacity. Conventional load sharing is applied when necessary [22]. The BESS is a commercially available system supplied by BECK [23]. The BESS uses lithium-ion technology, the common choice given its high cycle-life, high round-trip efficiency, and fast response time [24].
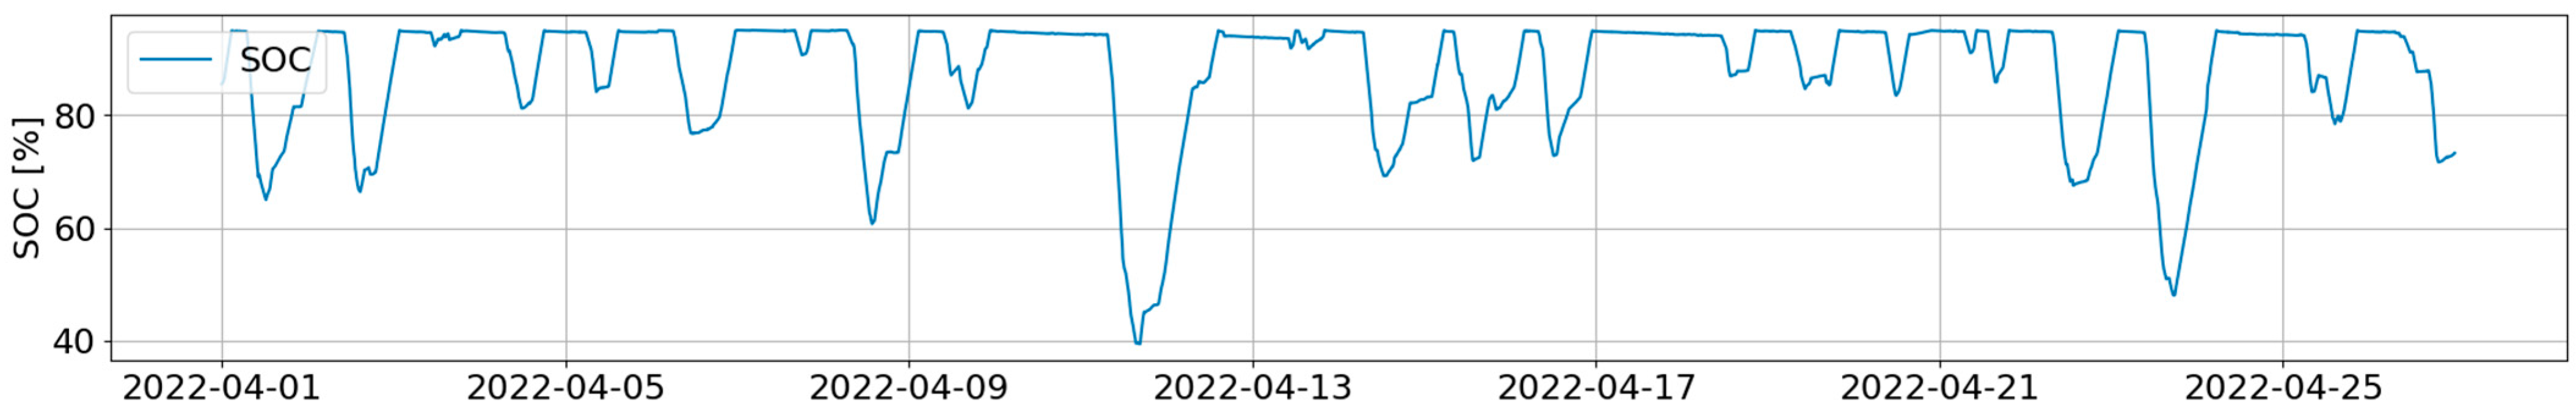
The battery is considered to be oversized for the current operation. In the 6 months of data used to build the model, the BESS dropped below 50% SOC 15 times and the battery is cycled too frequently for low energies, as depicted in Figure 2. Frequent and small discharge/charge cycles are detrimental to battery lifetime [25,26]. Additionally, the battery is being charged and discharged at very low powers, resulting in low conversion efficiencies and high energy losses. Considering that the grid connection capacity could still be increased further from the programmed 3 × 25 A up to the physical connection of 3 × 80 A, which remains a cheaper option than the annualised battery system costs, the battery energy storage capacity could be reduced.
3.1. Model Development
The months of January–June 2022 were used to develop the model, with the month of July 2022 used to validate it. Individual charging sessions were identified and various session parameters determined, namely, the day of week, entry time, exit time, end of charging time, power delivery per time step, number of phases it is connected to, and the current per phase. The maximum charging power, total energy delivered, and connection and charging duration per charging event were deduced. The charging sessions were then filtered for charging duration and energy transfer, with limits of [0.5 h, 25 h) and [1 kWh, 80 kWh), respectively.
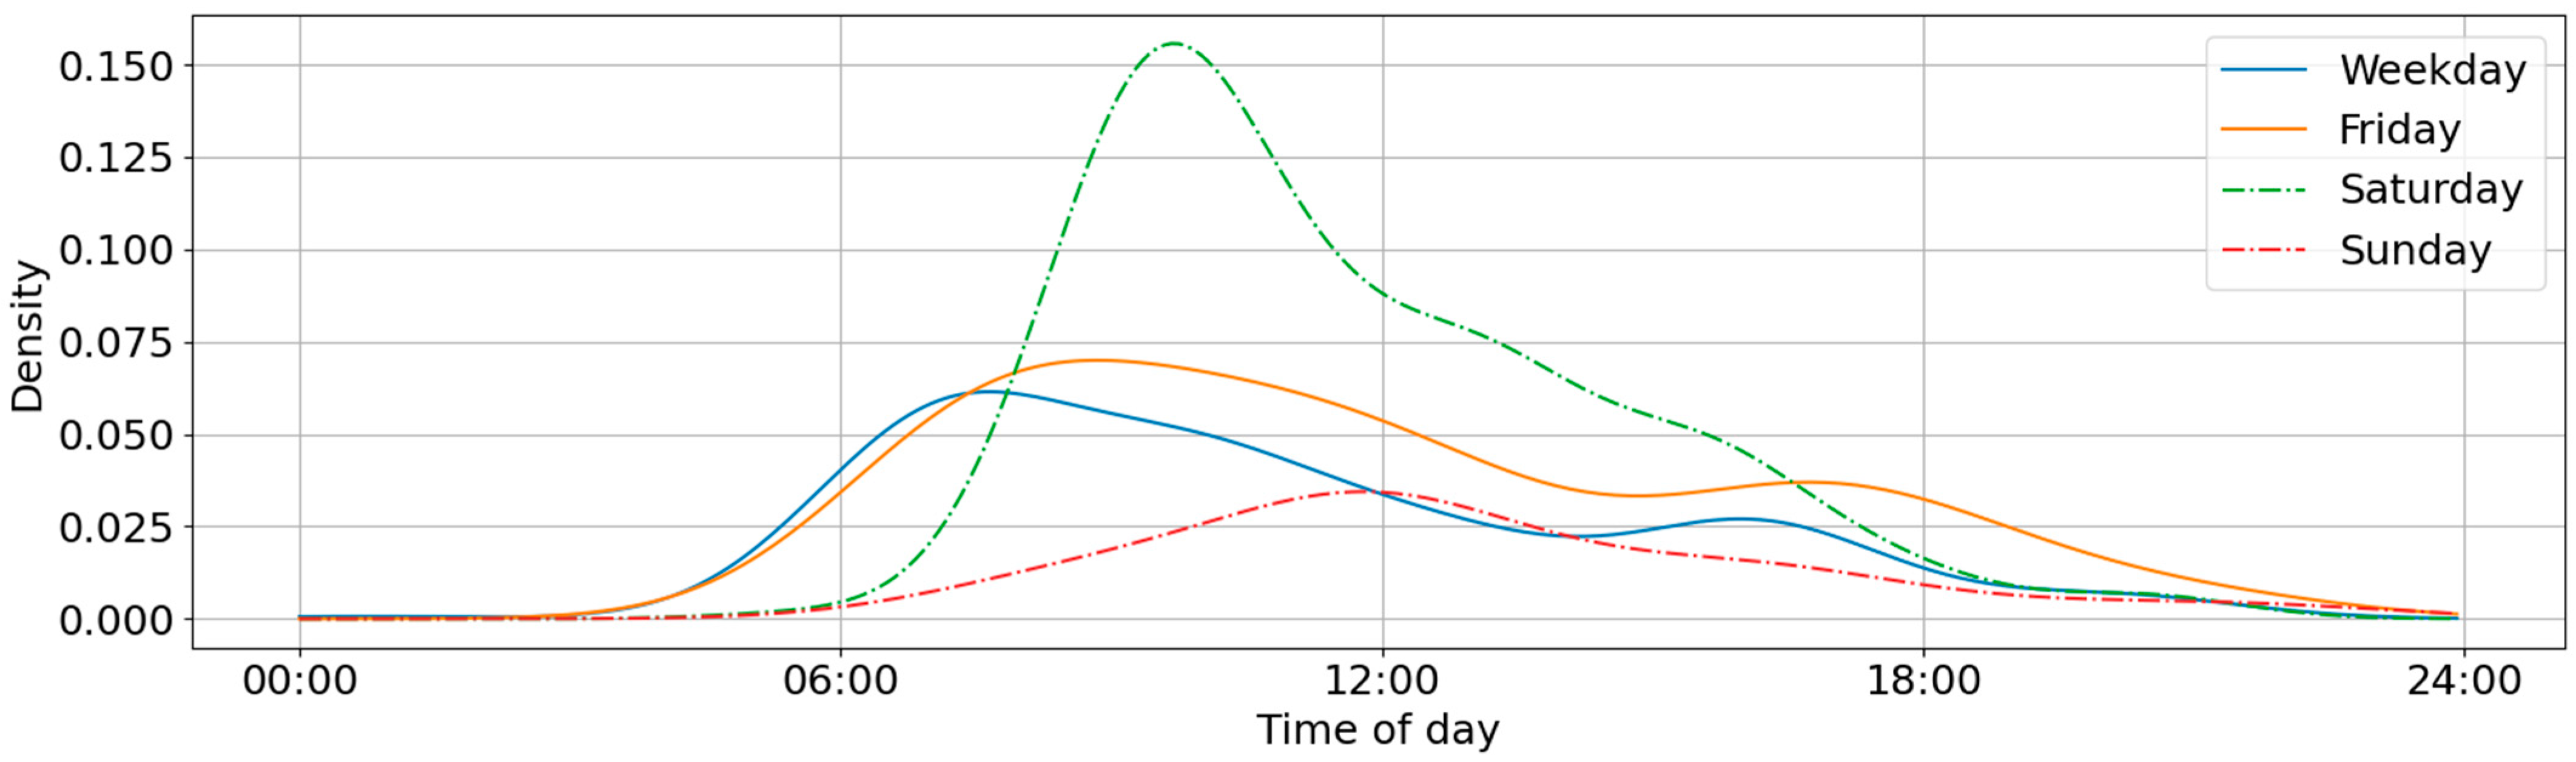
The entry events were separated by day since Friday, Saturday, and Sunday experienced different usage patterns than the working weekdays Monday–Thursday, as presented in Figure 3. This was to be expected, since, on Monday–Thursday, people generally follow similar work–life patterns. The peak connection time on weekdays is around 07:00–09:00, in line with commuter usage. There is also a second, smaller peak in the late afternoon from residents and evening visitors. It appears that a higher proportion of people arrive late on a Friday, to then park for the night or weekend. Saturday is a day in which people travel to the city for social/leisure purposes, whilst Sunday may still be regarded as a day of rest and, therefore, reduced P&R activity.
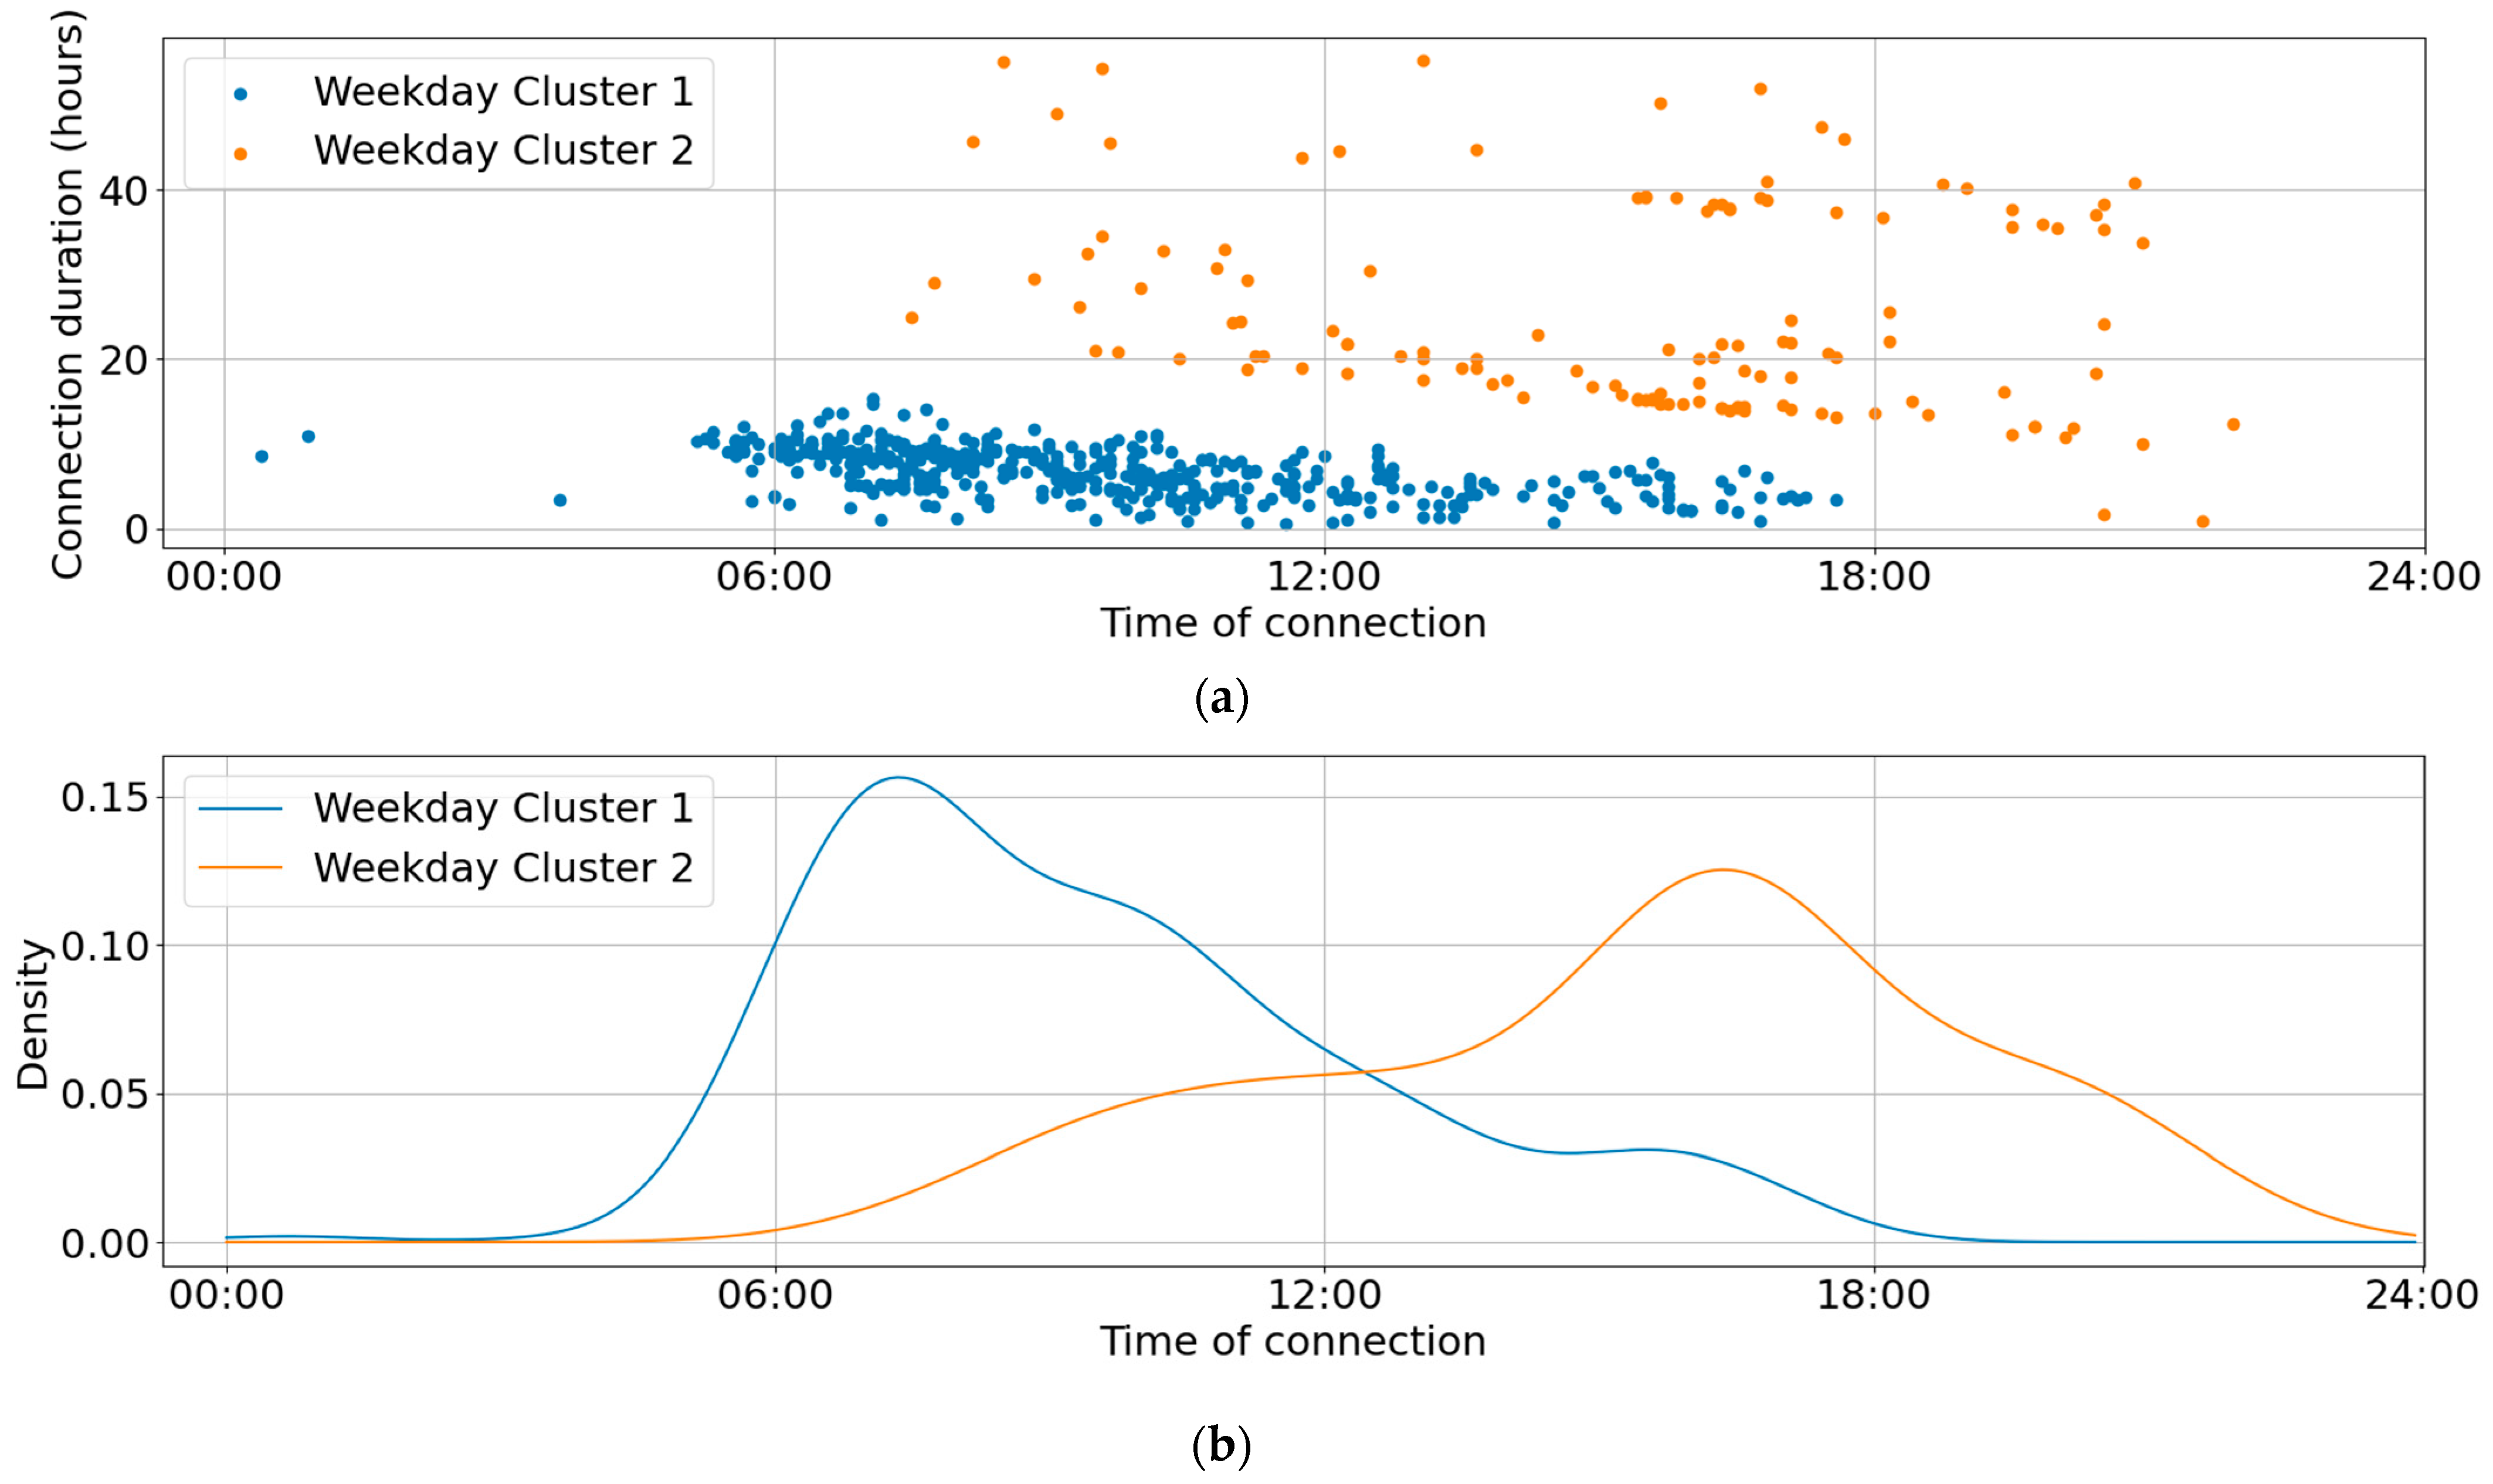
The charge sessions were then clustered into user groups using the Bayesian Gaussian Mixture Model (BGMM) from the Python scikit-learn library. When handling data with a distribution as visualised in Figure 4a, which plots the connection duration against the time of connection, a Gaussian Mixture Model (GMM) was found to be most suitable. BGMM performed better than a standard GMM due to the function’s ability to minimise the number of clusters, resulting in two clusters per day type. The time of connection and connection duration were determined to be the best indicators of conscious user behaviour and are more strongly correlated than other variables. Including more than these two variables did not yield improved clustering performance.
Figure 4a displays the clustered charge sessions on weekdays (Monday–Thursday). Cluster 1, in blue, shows the group of users dominated by commuters who typically arrive and depart on the same day. Cluster 2, in orange, represents a higher proportion of visitors who arrive in the late afternoon to evening, and park for longer durations. It is clear that the duration of connection has the largest influence on the clustering process.
The time of entry for the two clusters was plotted as a Kernel Density Estimation (KDE) curve with an independently normalised axis, as presented in Figure 4b for weekdays. A KDE plot introduces a normal Gaussian distribution per data point, and sums the curves to produce the density curve presented.
The model had a 5 min resolution. At each time step, the associated probability that a car would connect, as shown in Figure 3, was compared against a randomly generated number between 0–1. Upon connection, the charge session was assigned to a cluster by choosing between the normalised weighted probability of entry at that time step per cluster, as shown in Figure 4b. With the cluster determined, the nominal charging power was sampled, as was the energy demanded and connection duration. The number of phases it connected to was estimated from the nominal charging power. In this model, the line voltage was assumed to be constant at 230 V. Some noise was added to the charging power at each time step by sampling a normal distribution (σ = 0.025) to use as a multiplicative factor. A base load (system electronics and CP electronics), inverter self-consumption, and auxiliary battery load (air conditioning) were added. These were all sampled from distributions formed from the measured data. If the energy delivered in a charge session reached 75 kWh, then the charge session came to an end and the charge duration was updated. The maximum observed energy delivery in the measured data was 68.9 kWh.
The power was delivered by either the grid, the battery, or a combination of the two. In the case that the load was less than the maximum grid capacity, any residual grid capacity would charge the battery. If the load was greater than the maximum grid capacity and the battery was empty, conventional load sharing of the available grid capacity was employed, ensuring base loads were also provided for. Thus, assuming the base load was split evenly across the three phases, the power delivered to each EV at time t was calculated using Equation (9).
where is available power from the grid at time t and is the total base power at time t. The numerator consists of the current draw per phase for EV x at time t, and the denominator consists of the total current demand per phase at time t.
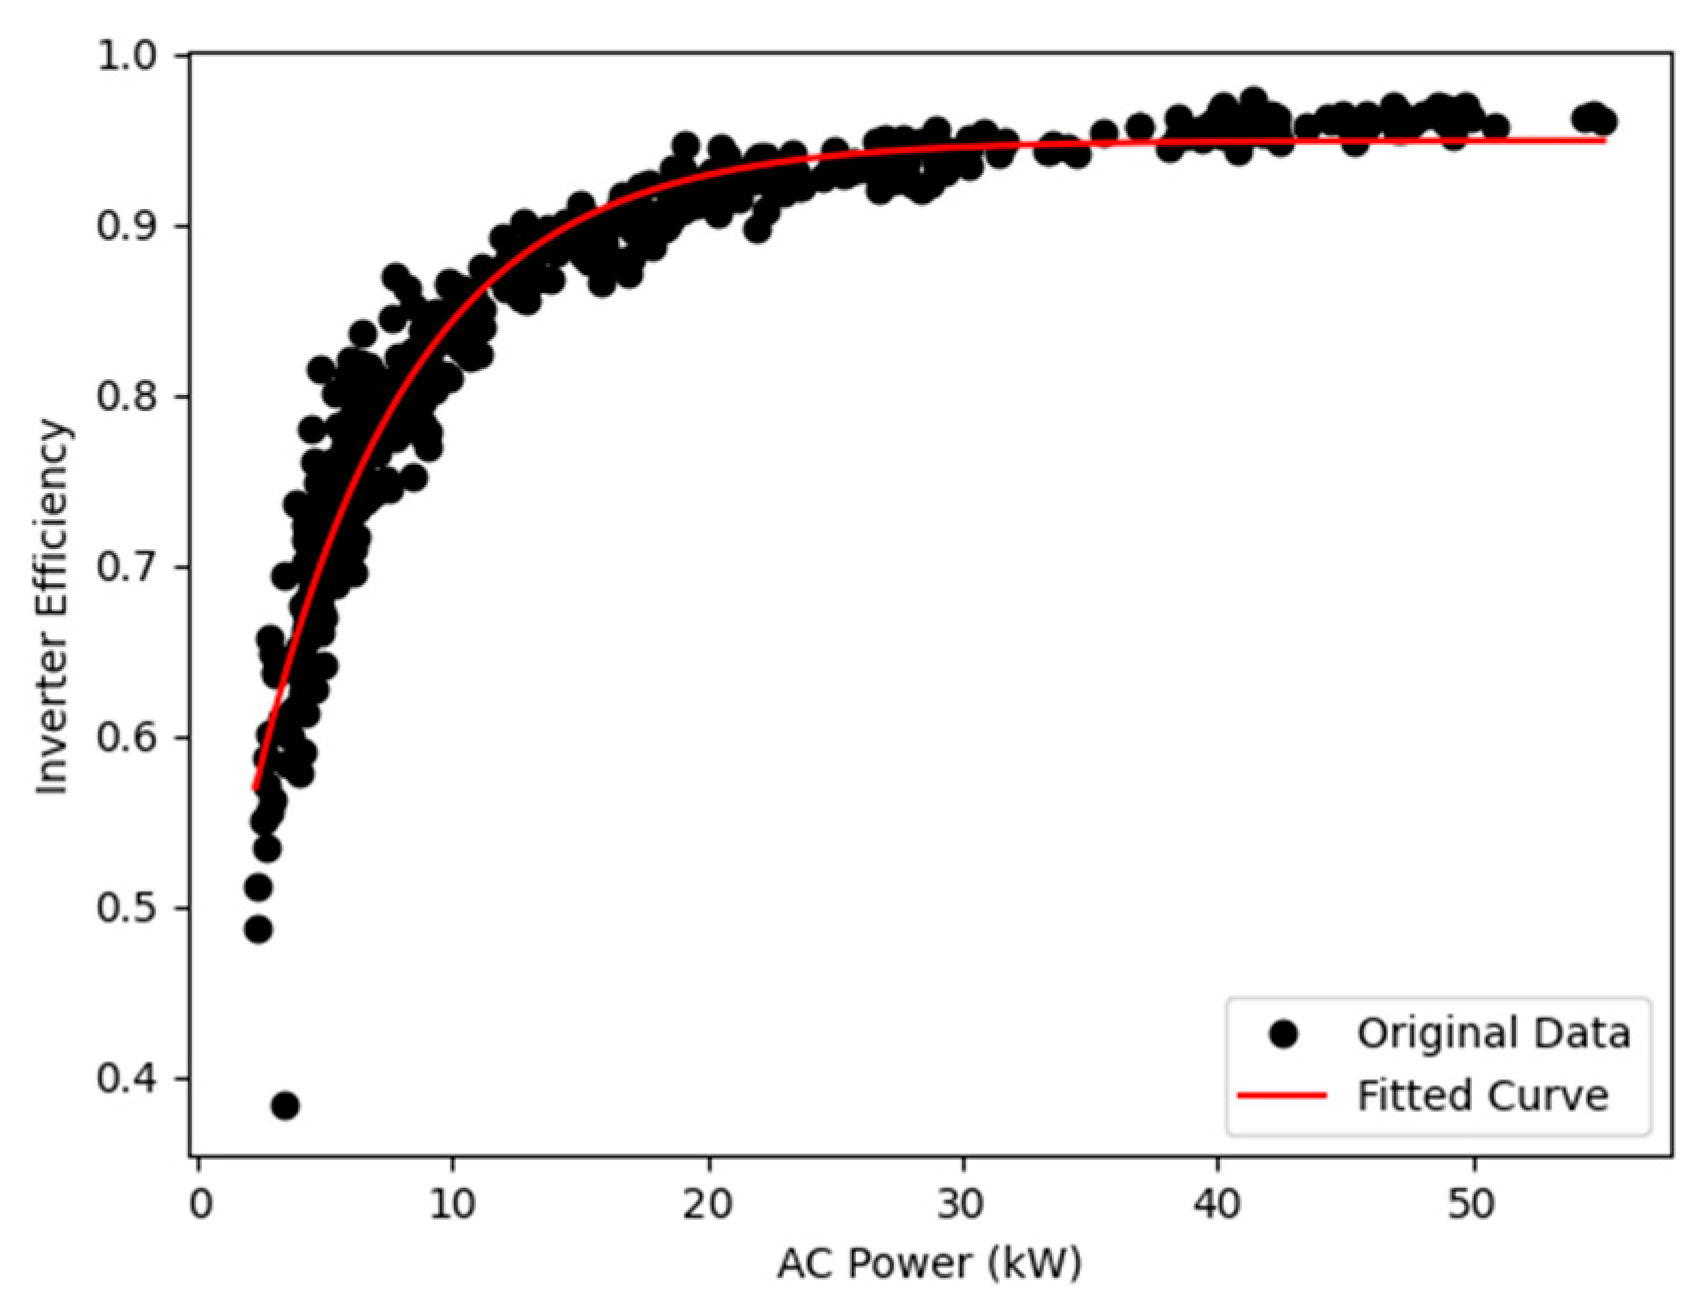
For battery charging and discharging, the inverter efficiency was sampled from the efficiency curve depicted in Figure 5. The curve was fitted to the filtered data using Equation (10), and initial values a = 0.95, b = −0.9, and c = 0.25.
3.2. Model Validation
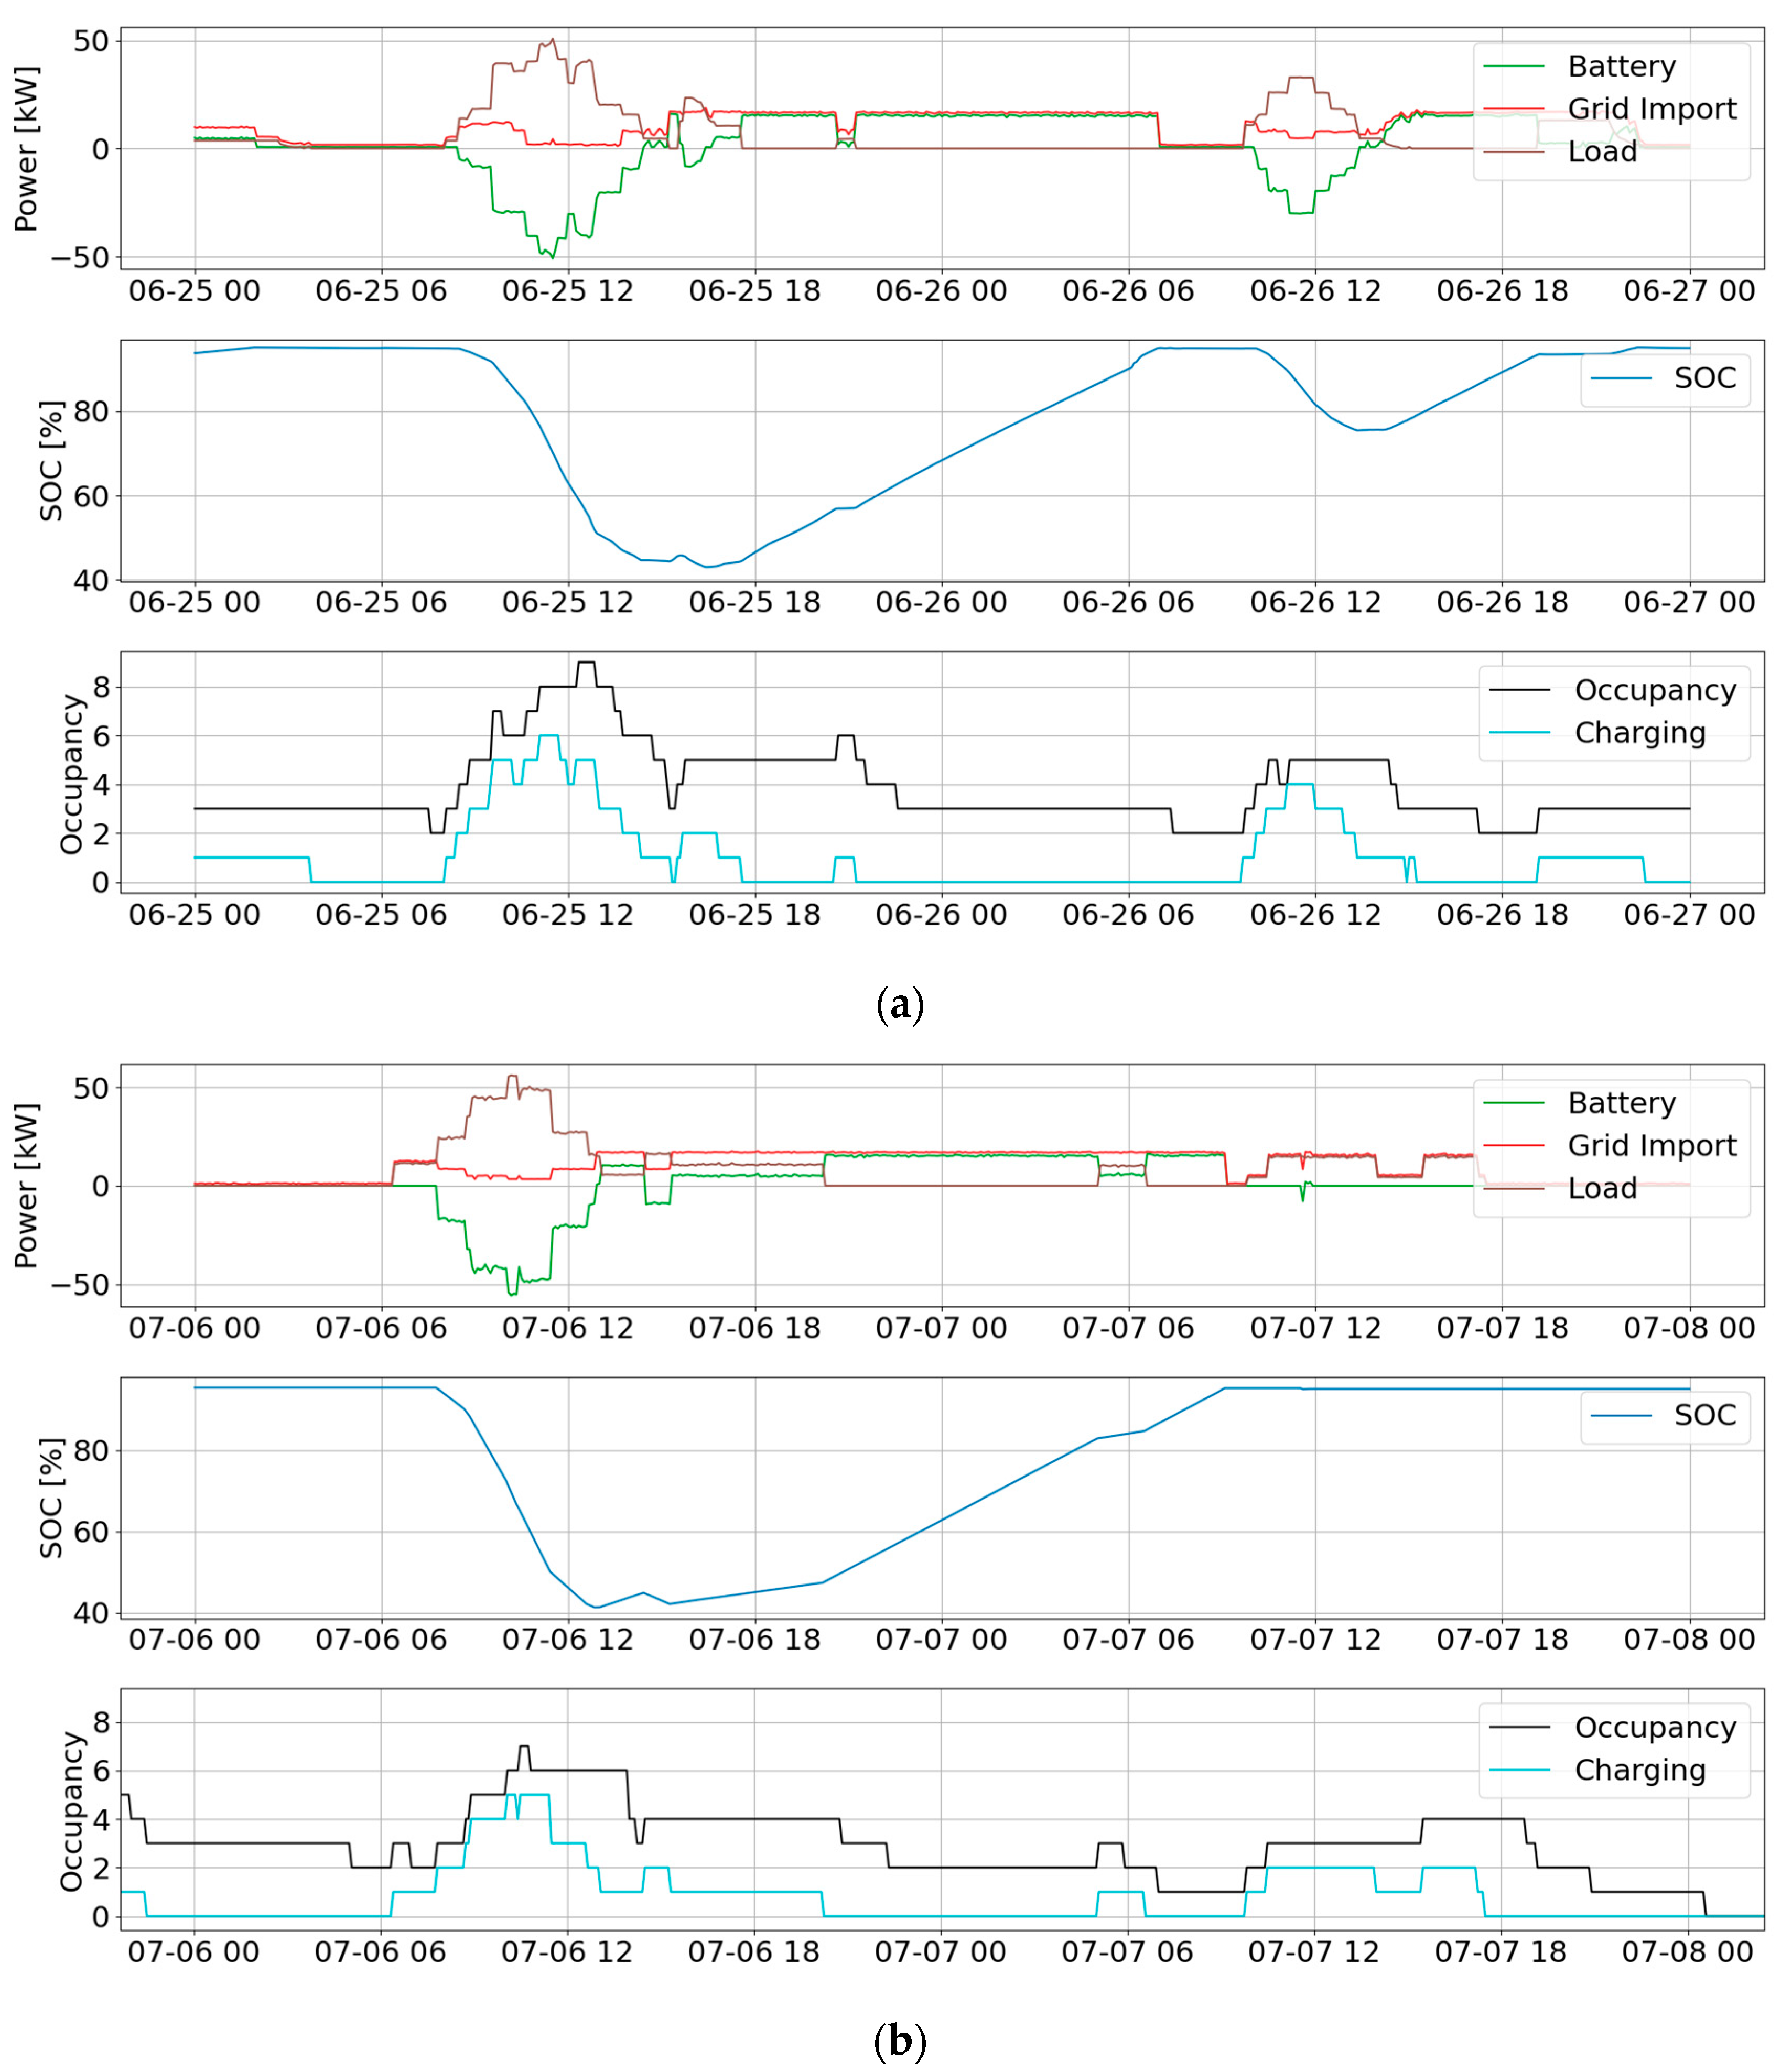
By comparing a ‘base-case’ simulation to the July 2022 data, the model was validated. The system usage in both the case study and simulation are presented in Figure 6a,b, respectively. A direct comparison of the system metrics is presented in Table 2, which shows that the fit of the model was in line with the measured data.
The measured battery system round-trip efficiency was found to be 71.7%, and was influenced by the battery energy storage efficiency of 95.6% and the inverter efficiency for charging and discharging, as depicted in Figure 5.
4. Control Scenarios
The installed battery system round-trip efficiency was low due to the conversion losses across the inverter at low charging and discharging powers. Additionally, the battery made frequent and small discharge/charge cycles. Finally, there was no consideration for the power imported from the grid during peak grid-load hours. Given the current state of the power grid, it is logical to limit the power drawn from the grid during the peak grid-load hours of approximately 17:00 to 20:00. The following control scenarios were therefore decided upon:
- The base case in which the grid supplies all load up to the maximum capacity. The battery supplies the remaining load above the maximum grid capacity.
- During the peak grid-load hours of 17:00–20:00, all load is supplied by the battery. If there is no EV load, the grid will supply the base load. If the battery is drained, the grid will supply the load.
- Charging/discharging the battery deadband of 10 kW and 15 kW. If the EV load is above this deadband, the battery supplies the entire load.
- The combination of limited peak hour power draw and battery charge/discharge power deadband of both 10 kW and 15 kW.
Each scenario was simulated using the optimal sizing described in Section 2 and compared against the case study sizing. Due to the randomness in the stochastic model, each scenario was simulated five times and averaged. The chosen performance metrics were as follows:
- Potential load not delivered (lost load);
- BESS round-trip efficiency;
- Energy drawn from the grid during peak hours;
- Percentage of total load supplied by the BESS;
- Percentage of users still charging at the end of their session.
5. Results
5.1. Optimal System Sizing
Table 3 presents the optimal system sizing for three different BESS costs using the monthly load profile of 6899 kWh, which approximated the intended 7 MWh. The three costs span the current approximate cost of €750/kWh up to the expected cost of €250/kWh in 2030 [27]. Alongside this is the case study system sizing for which a simulation using the same load profile was performed, resulting in the higher monthly lost load and higher annual cost.
Clearly, a larger grid connection is preferable. Higher BESS costs result in an optimal sizing that favours a higher loss of load and smaller BESS capacity. However, the effect is minimal since the grid connection capacity cannot be increased further. If the LL constraint, Equation (4), were removed such that any LL was acceptable, then the BESS may not be included and LL may be much higher. However, such a system would be unsuitable as a charging hub. The optimal BESS sizing for a 7 MWh monthly load with at least one high-energy-demand day tends to become very small given that the average battery capacity of a newly available BEV is around 60 kWh [5].
The optimal system sizing, regardless of the BESS cost, delivers a much better quality of service to system users when compared to the case study system, for a reduced annual investment. For the highest BESS cost of €750/kWh, the loss of load was reduced from 6.5% of the total load to 1.5%, and the annual investment remained comparable. The predicted 2030 BESS cost of €250/kWh resulted in a loss of potential load of less than 1% of the total load, and the annual investment fell by 36%.
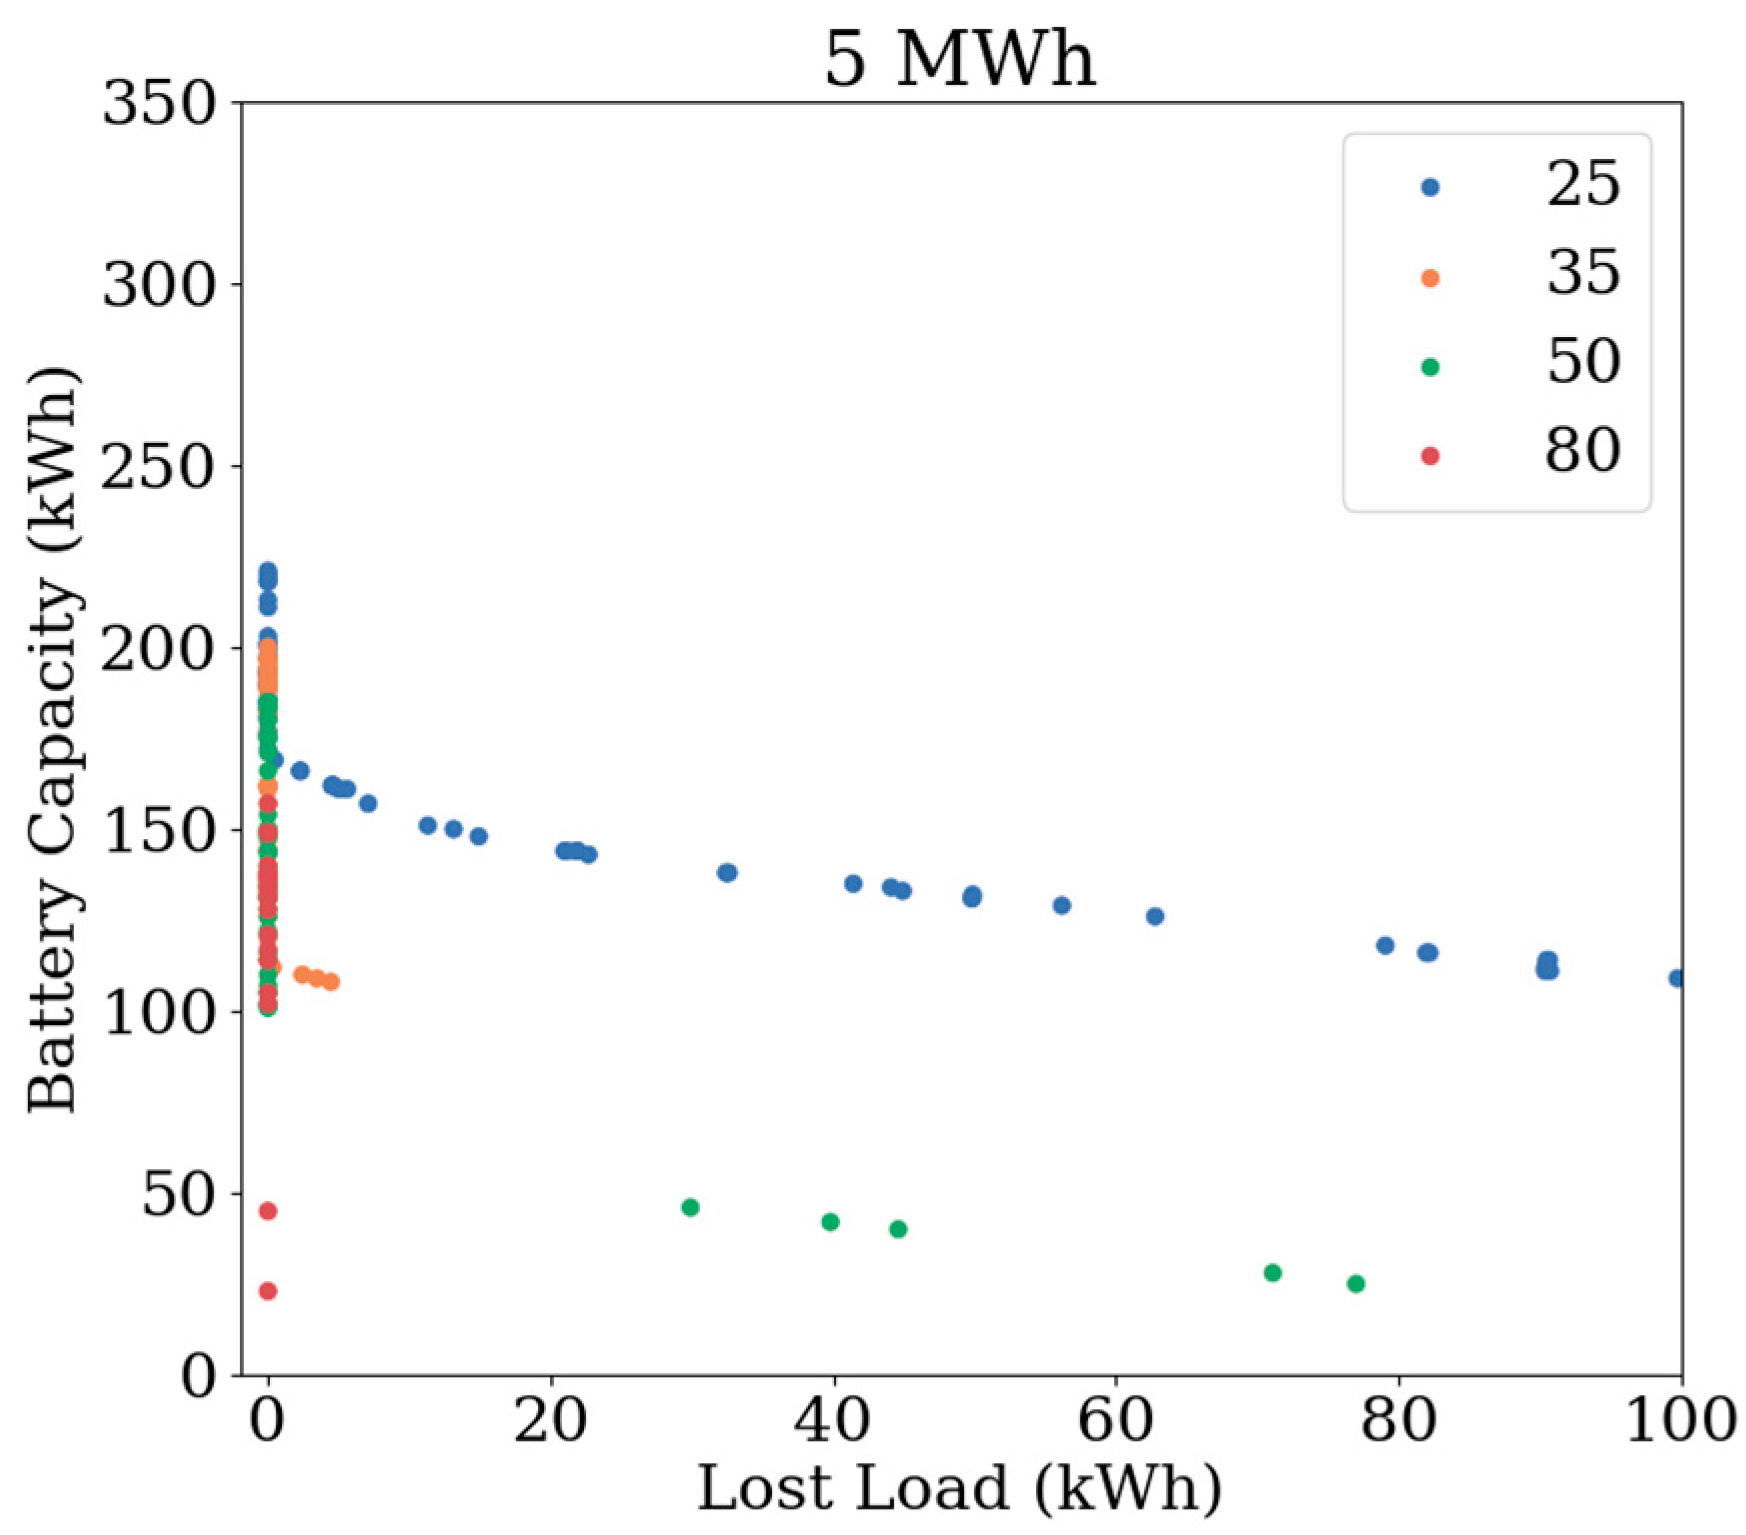
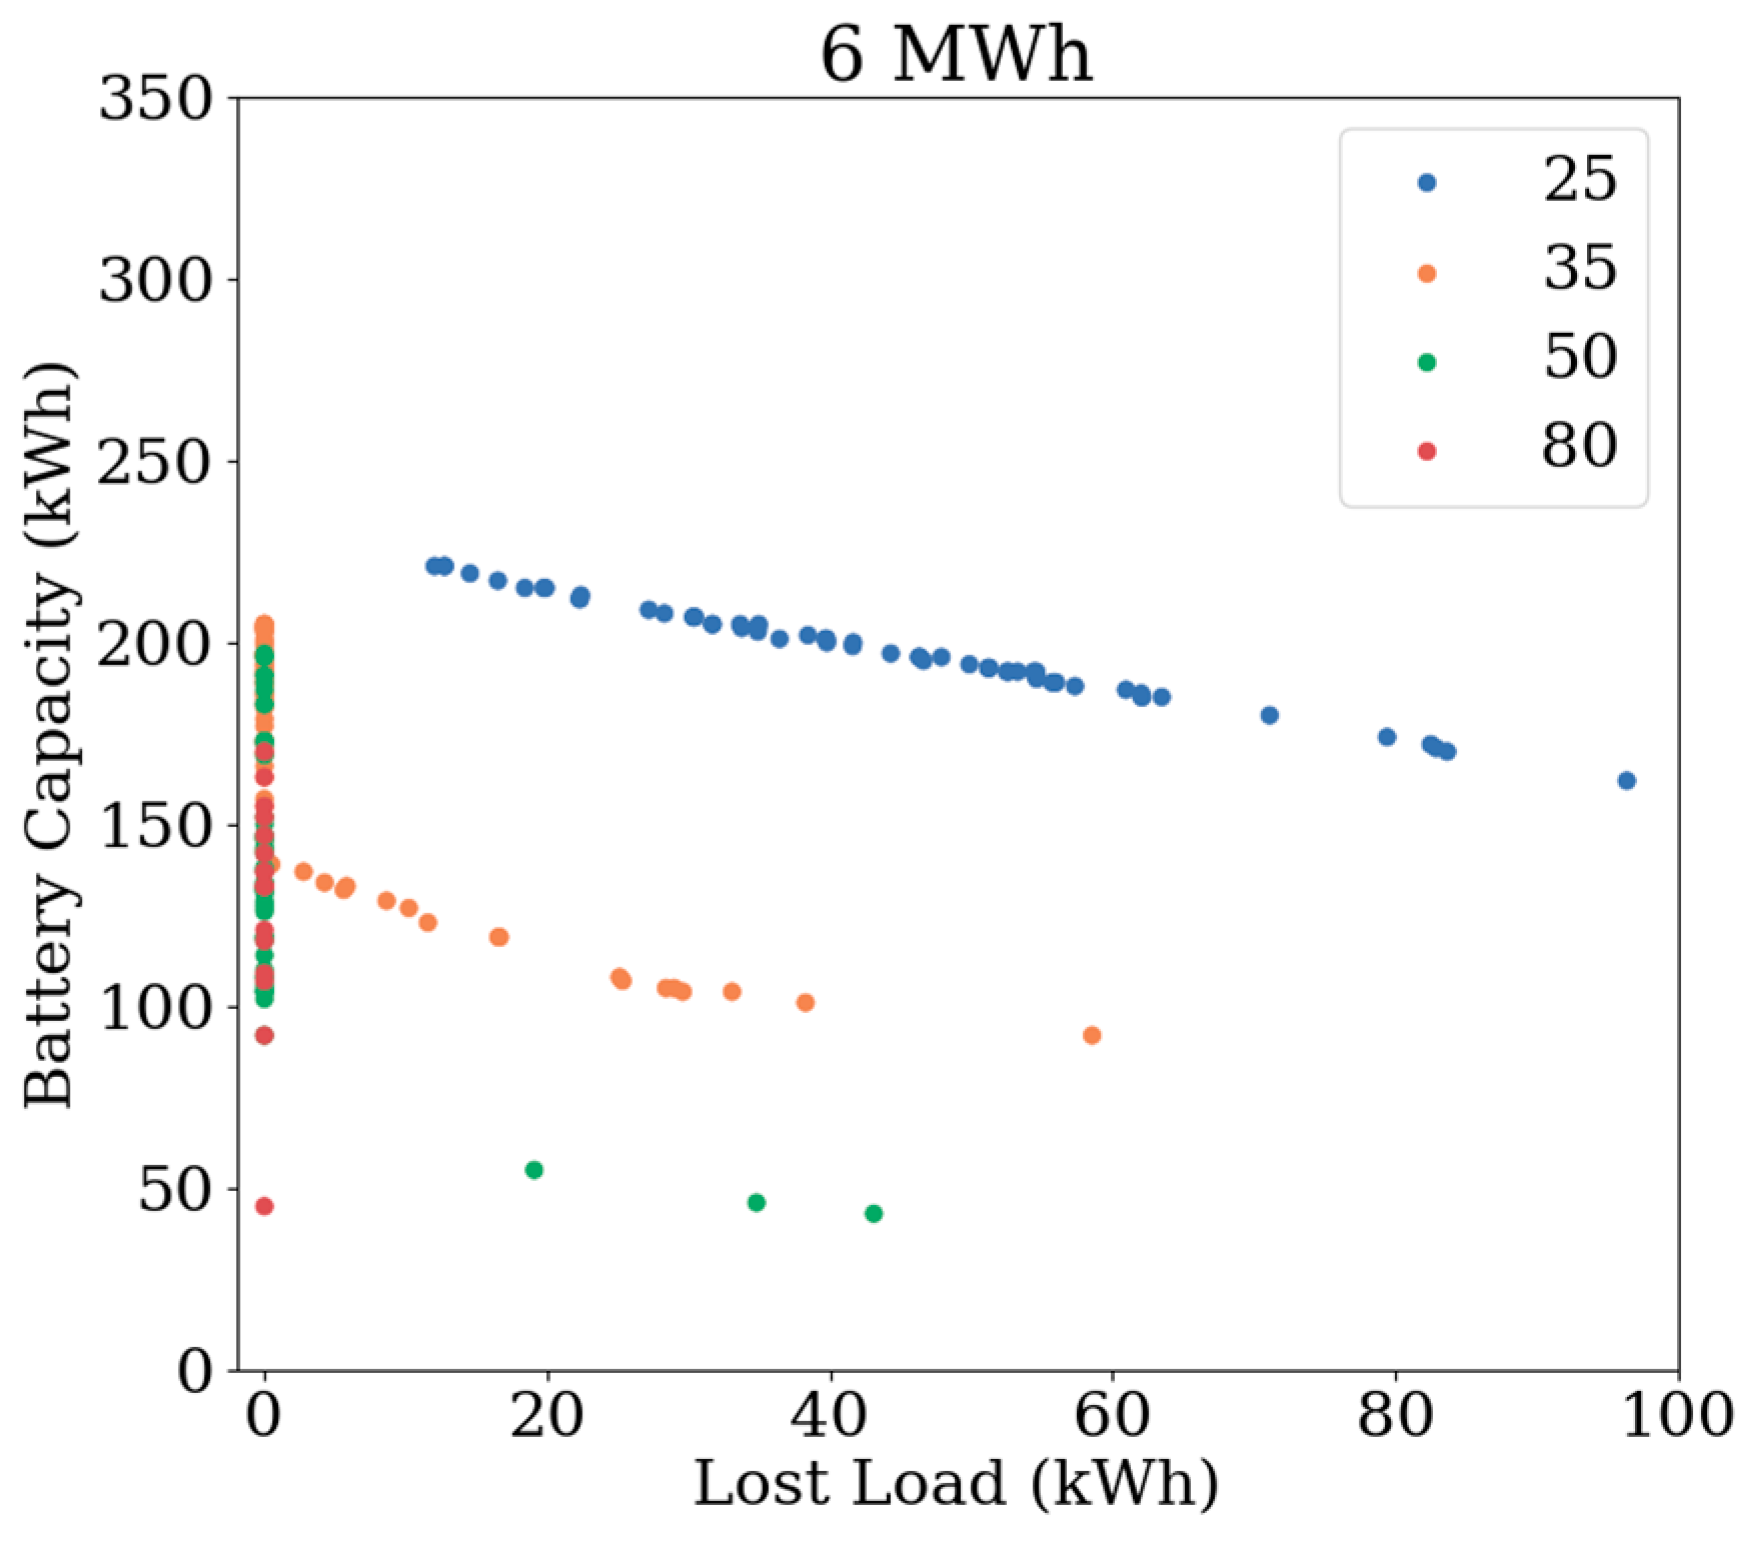
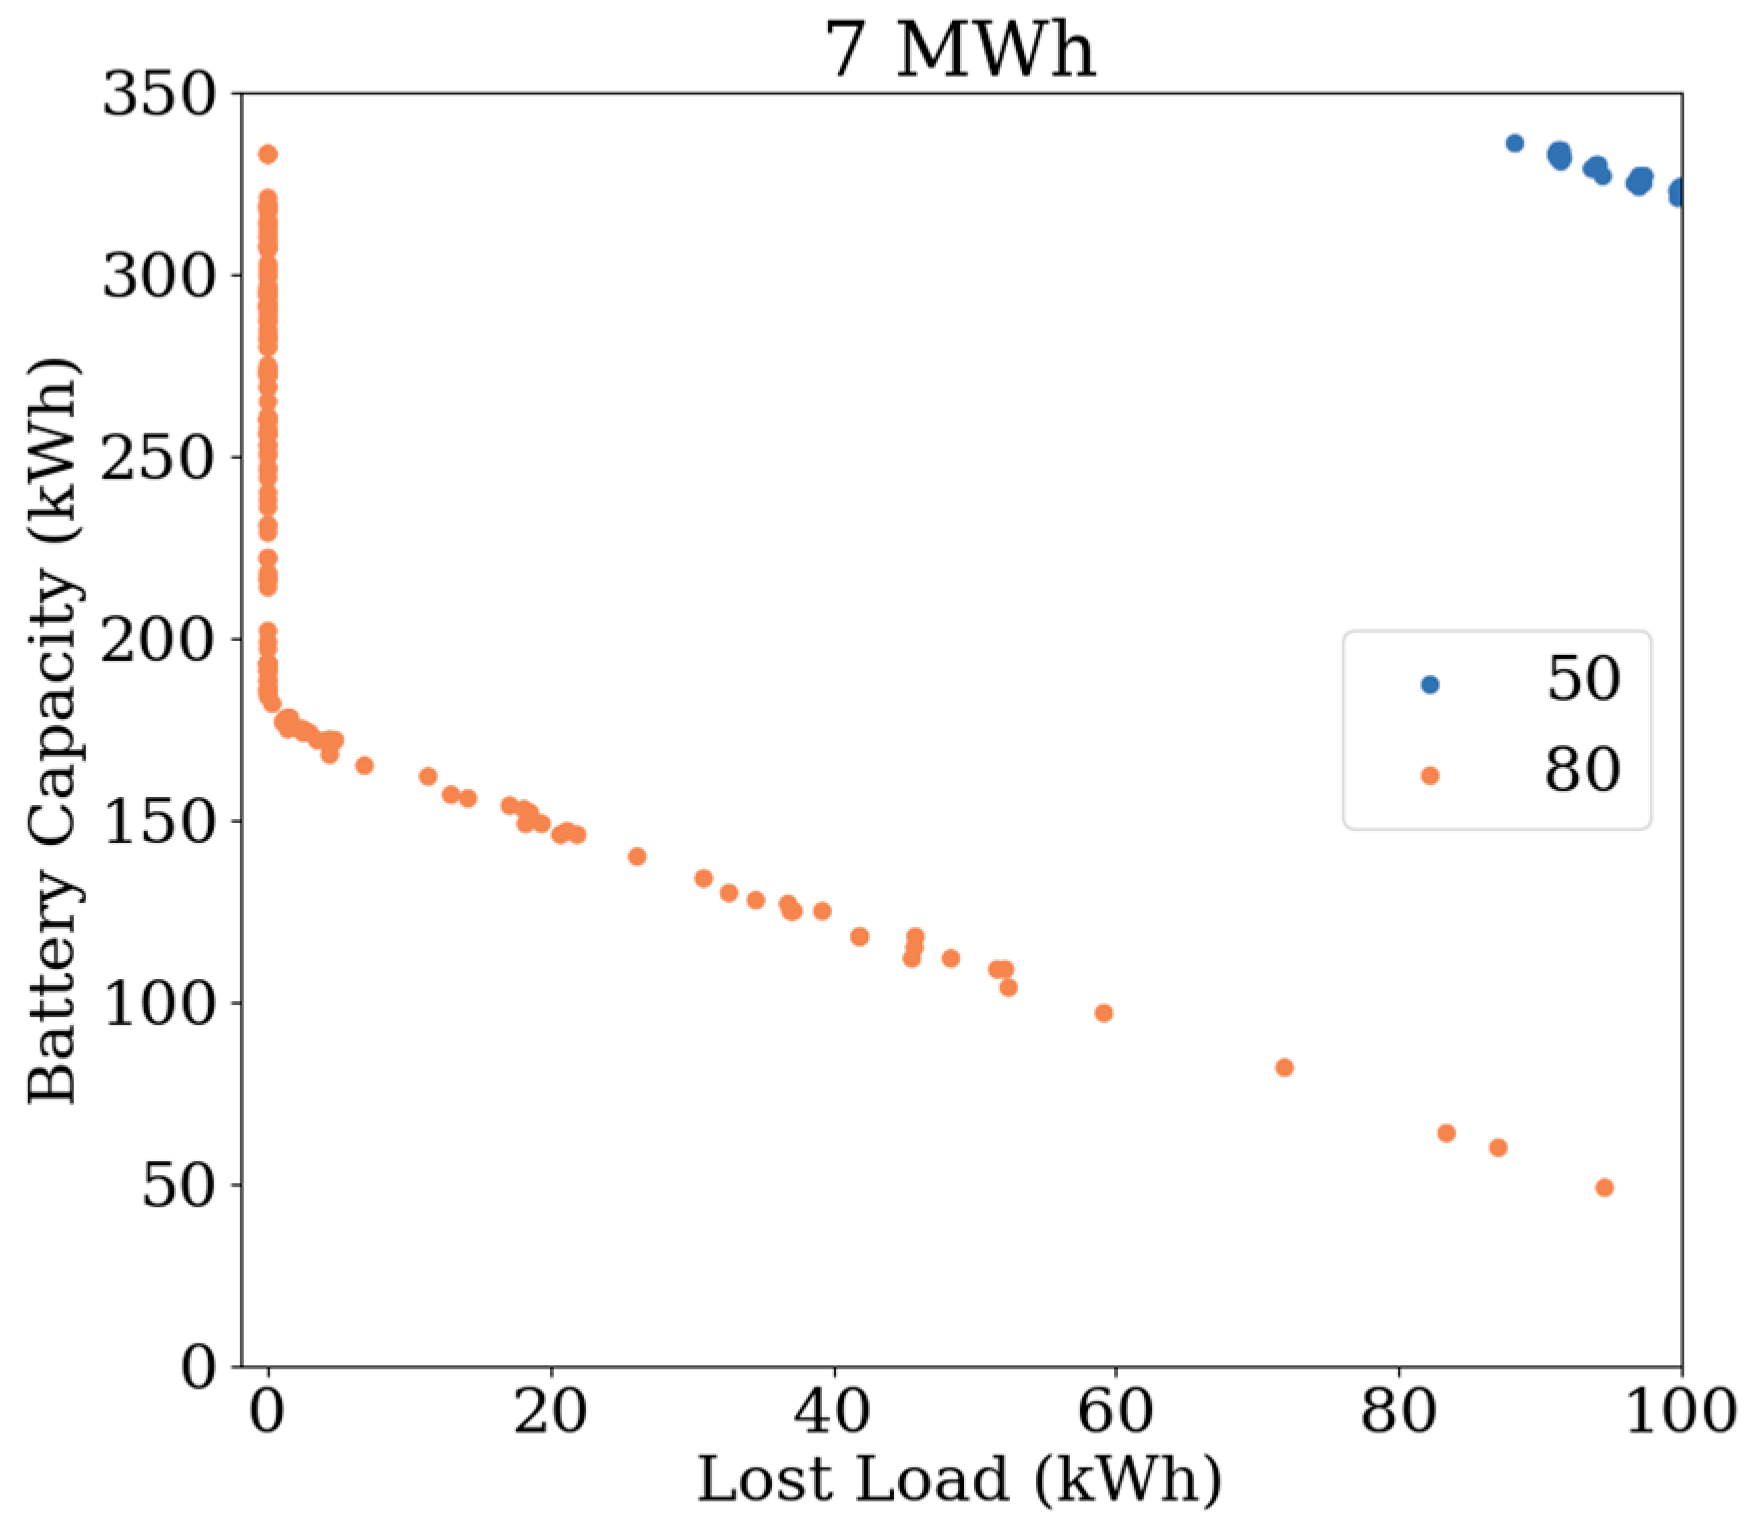
Figure 7, Figure 8 and Figure 9 plot the BESS capacities against the loss of load for the three load profiles of 5 MWh, 6 MWh, and 7 MWh. They were each compiled from four optimisation calculations amounting to 200 feasible solutions. There are many more feasible solutions not shown.
The relationship between LL and annual investment is linear for all load profiles and grid connection capacities. The gradient differs for load profiles but appears to be consistent across grid connection capacities. These figures show the BESS capacity that is required for each grid connection capacity to ensure no loss of load.
For a 5 MWh monthly load and a 3 × 50 A grid connection, a BESS capacity of approximately 60 kWh is required to ensure no loss of load. For a 6 MWh monthly load and a 3 × 50 A grid connection, a BESS capacity of approximately 70 kWh is required to ensure no loss of load. For a 7 MWh monthly load and a 3 × 80 A grid connection, a BESS capacity of approximately 180 kWh is required to ensure no loss of load.
5.2. Comparative Analysis of Optimal Sizing and Case Study Sizing
The optimal system sizing calculated in Section 5.1 for a BESS cost of €500/kWh was used with a variety of control strategies, described in Section 4, for a monthly load profile of 5 MWh. These were then compared against the case study system sizing for the same scenarios. The abbreviations BDB and PHBDB refer to the control strategies Battery Deadband and Peak Hour Battery Deadband, respectively.
Figure 10 shows the loss of potential load. In every control strategy except the base case, the optimal sizing performed better than the case study sizing. All battery control strategies that imposed a battery charge/discharge deadband experienced a higher loss of potential load than the respective base case. This is because the battery, after supplying the full load for an extended period, will be drained, and, in some cases, the grid capacity is not enough to supply the full load.
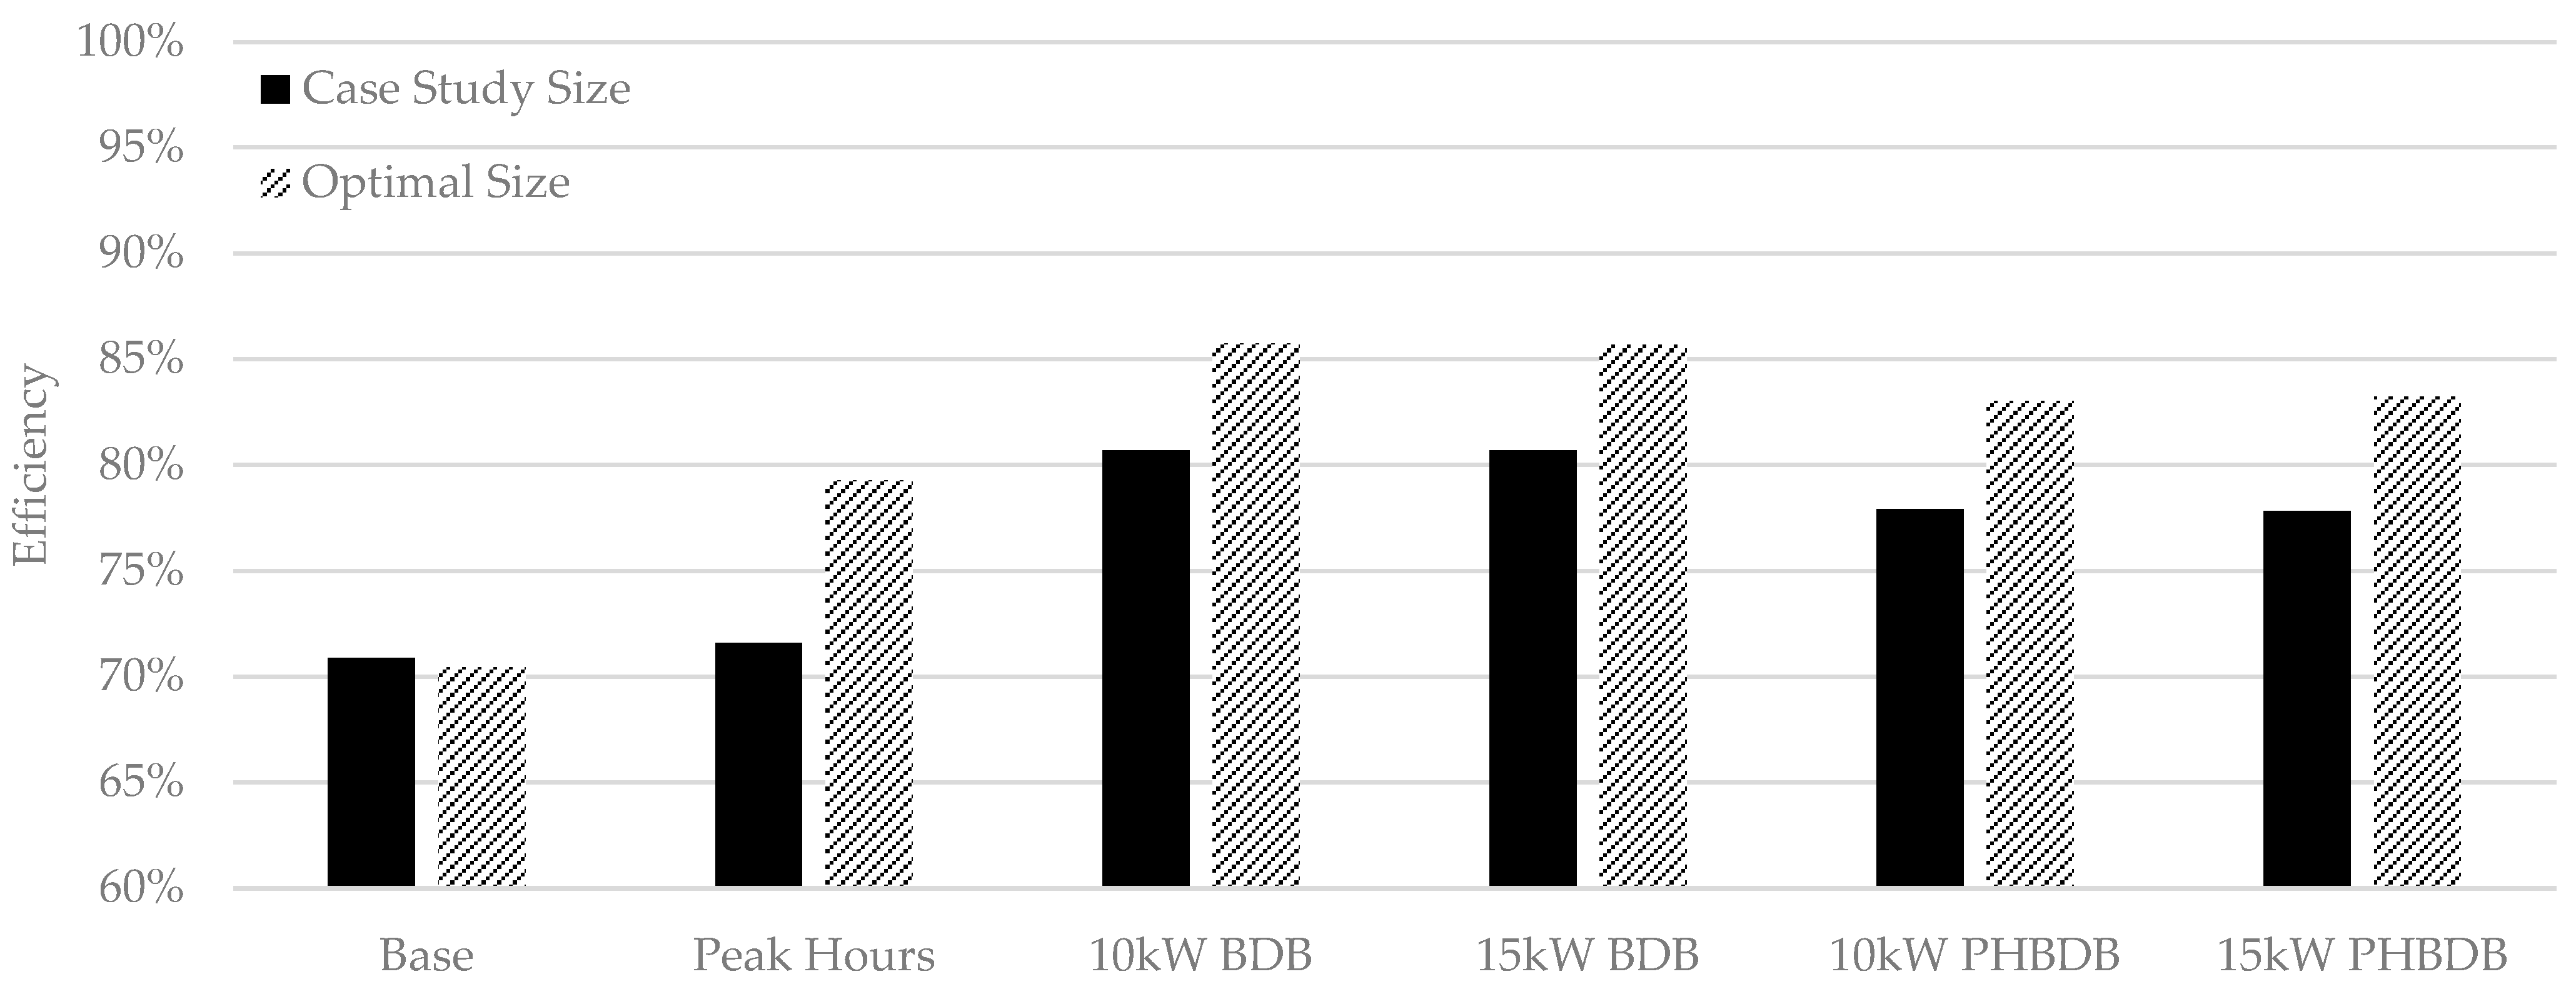
When using the optimal sizing, the battery system round-trip efficiency was increased for all control strategies with the exception of the base case, as depicted in Figure 11. The base case round-trip efficiency is lower with the optimal sizing because the battery would discharge at low powers; the maximum EV load was not much higher than the 55 kW grid connection. In fact, in some simulations, the battery would not be used at all.
A larger capacity grid connection can charge the BESS at relatively higher powers, resulting in a higher charging efficiency. The battery discharge deadband ensured the battery discharged at powers above the requirement, leading to an increased discharging efficiency. A higher charging/discharging battery power has a higher inverter conversion efficiency, as observed in Figure 5.
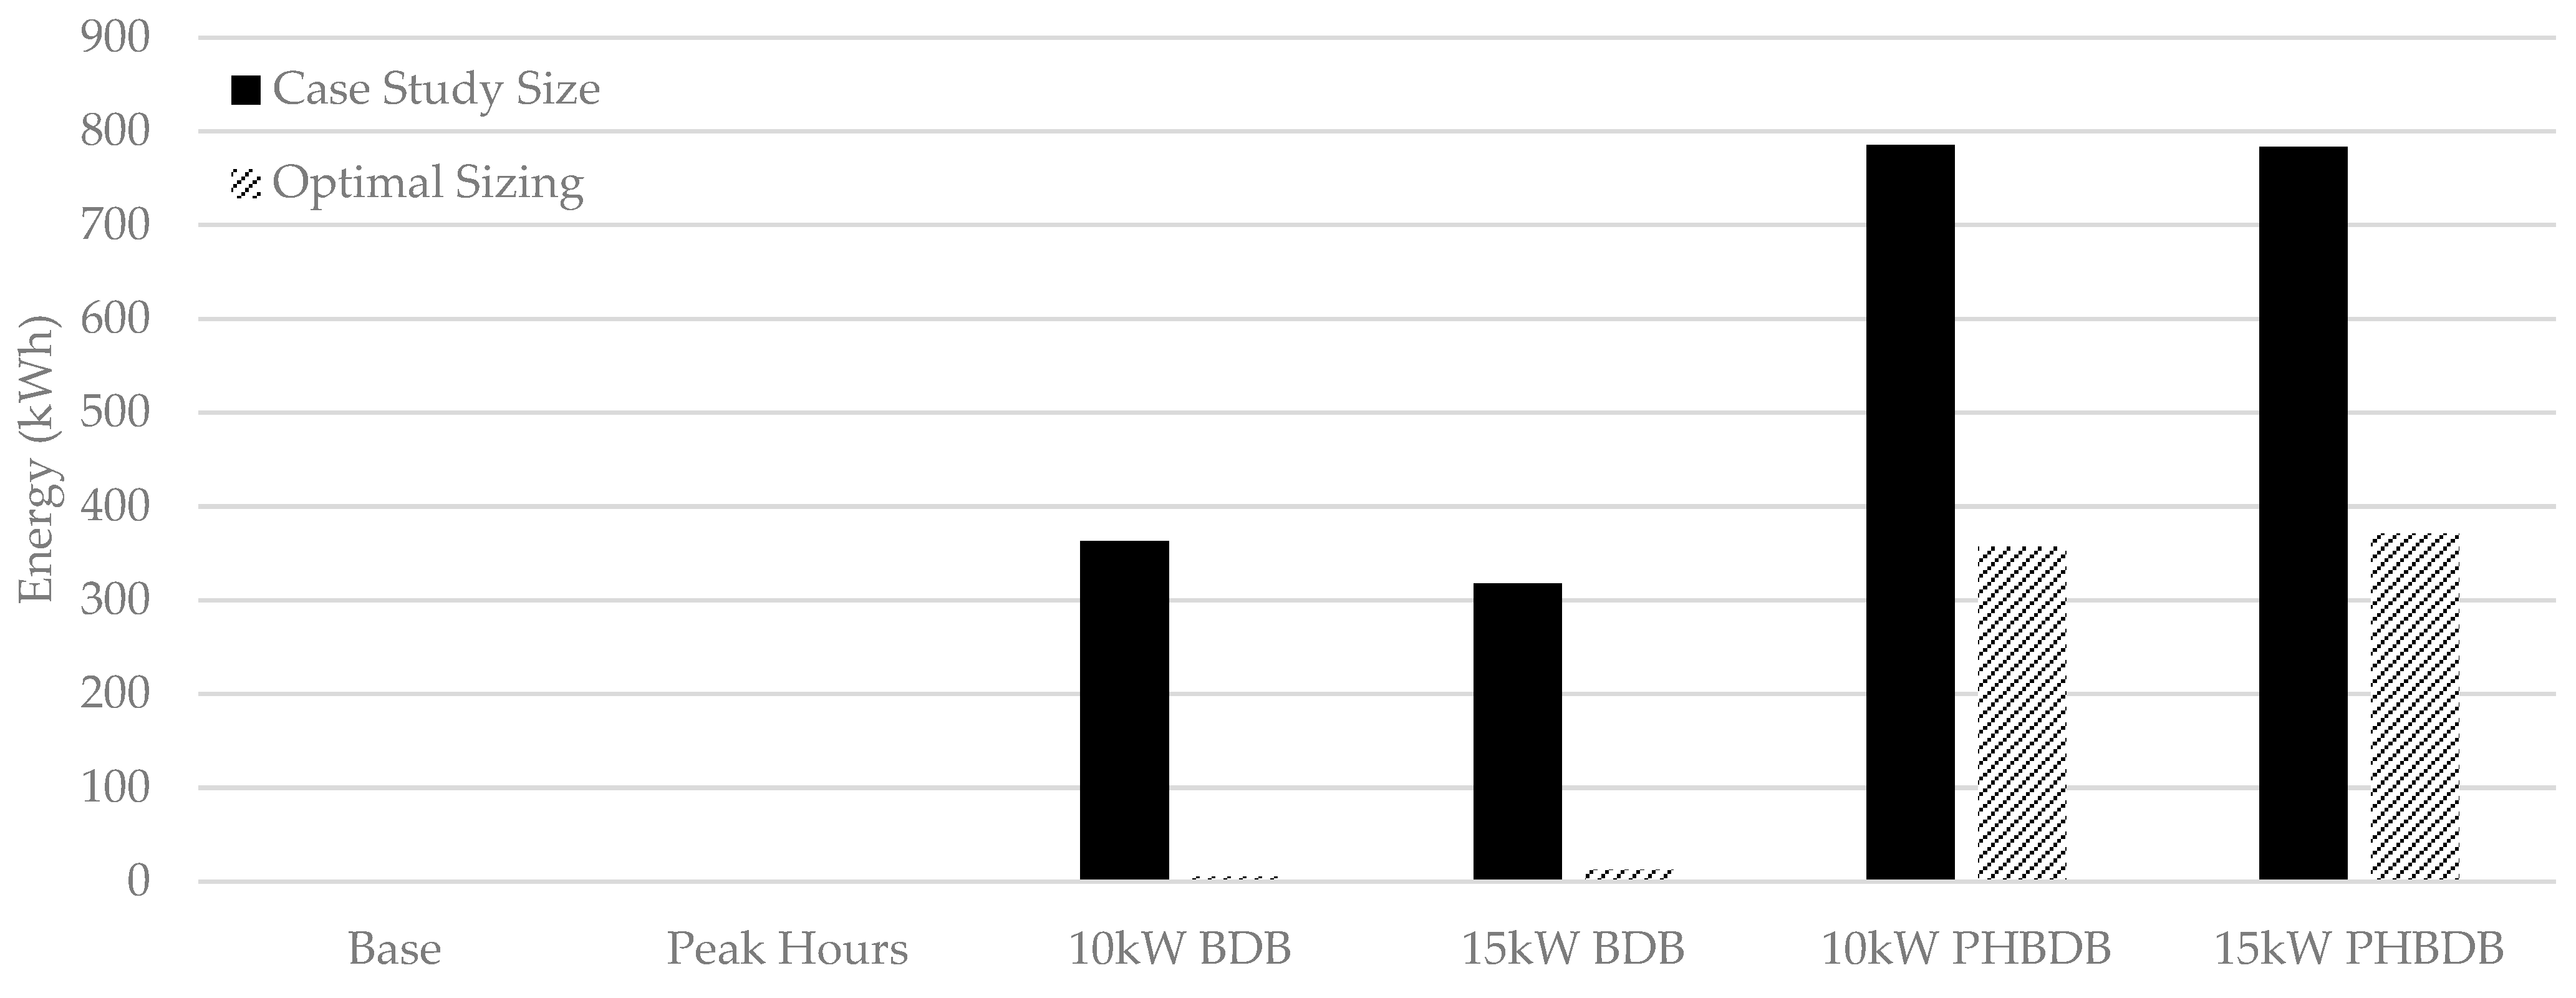
Figure 12 shows the volume of energy drawn from the grid during hours of peak grid load. Scenarios in which the grid exchange was limited still drew some power to cover base loads. This prevented the battery from discharging at low powers, thus maintaining a higher round-trip efficiency. By allowing the grid to supply the load during peak hours if the BESS was drained, the Peak Hours scenario had a negligible increase in energy drawn from the grid with respect to the 10 kWh PHBDB and 15 kWh PHBDB scenarios, from approximately 85 kWh to 110 kWh.
With the optimal sizing, an imposed battery deadband resulted in an increased grid import during peak hours, with respect to both the optimal base case and case study sizing. Above the deadband, the battery delivered the full load; therefore, at the end of the day, the battery was more depleted with respect to the base case. This is consistent with the P&R usage pattern which tends towards a high EV load in the morning and early afternoon due to commuters. With the optimal grid connection capacity, the high battery-charging power could fully recharge the battery in the three-hour window. Furthermore, the low battery utilisation in the optimal base case means the battery is not often recharged during these peak hours, hence the decrease with respect to the case study sizing.
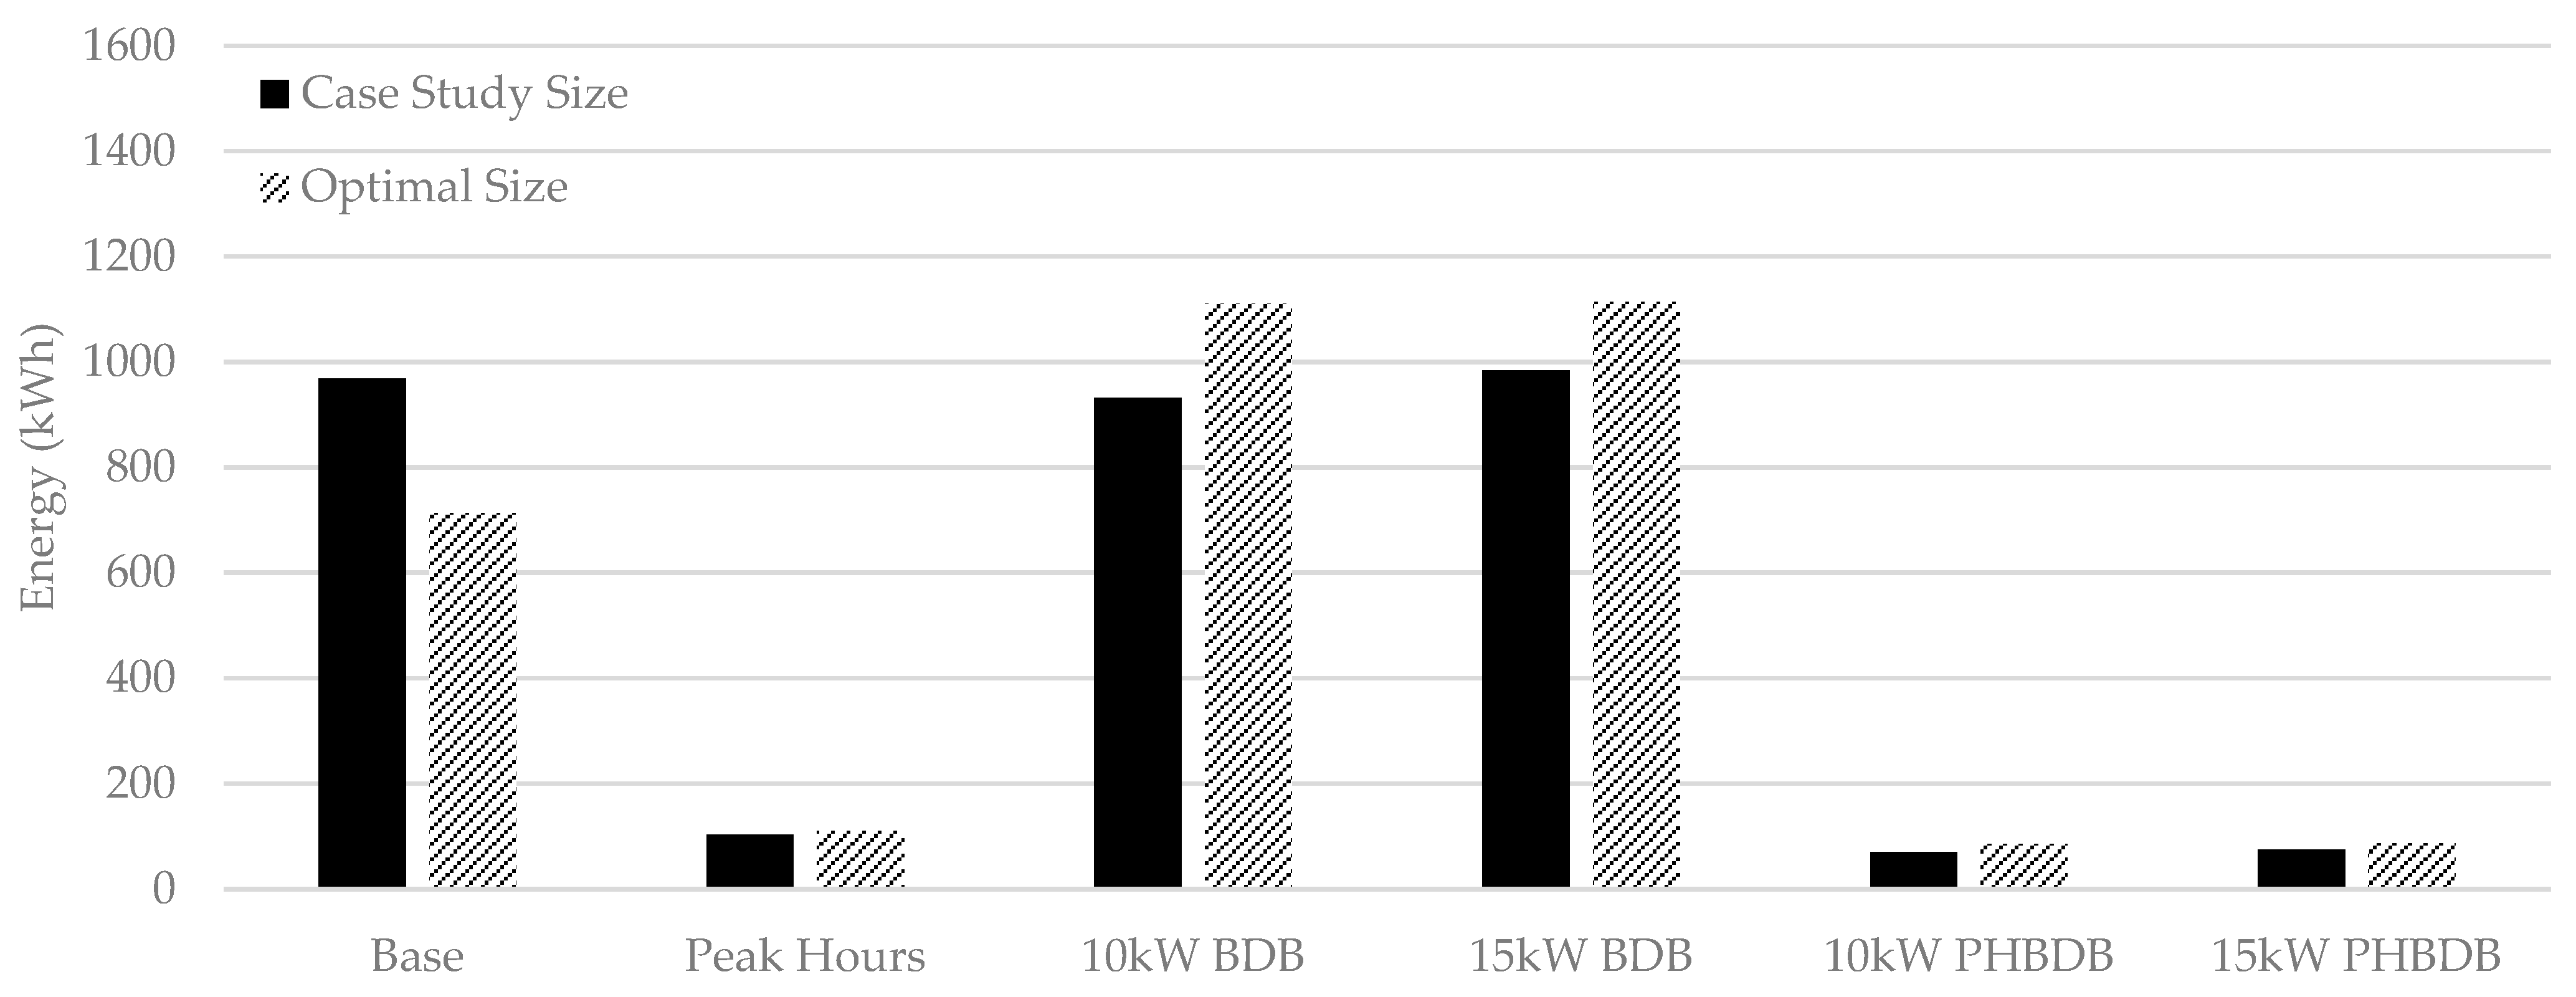
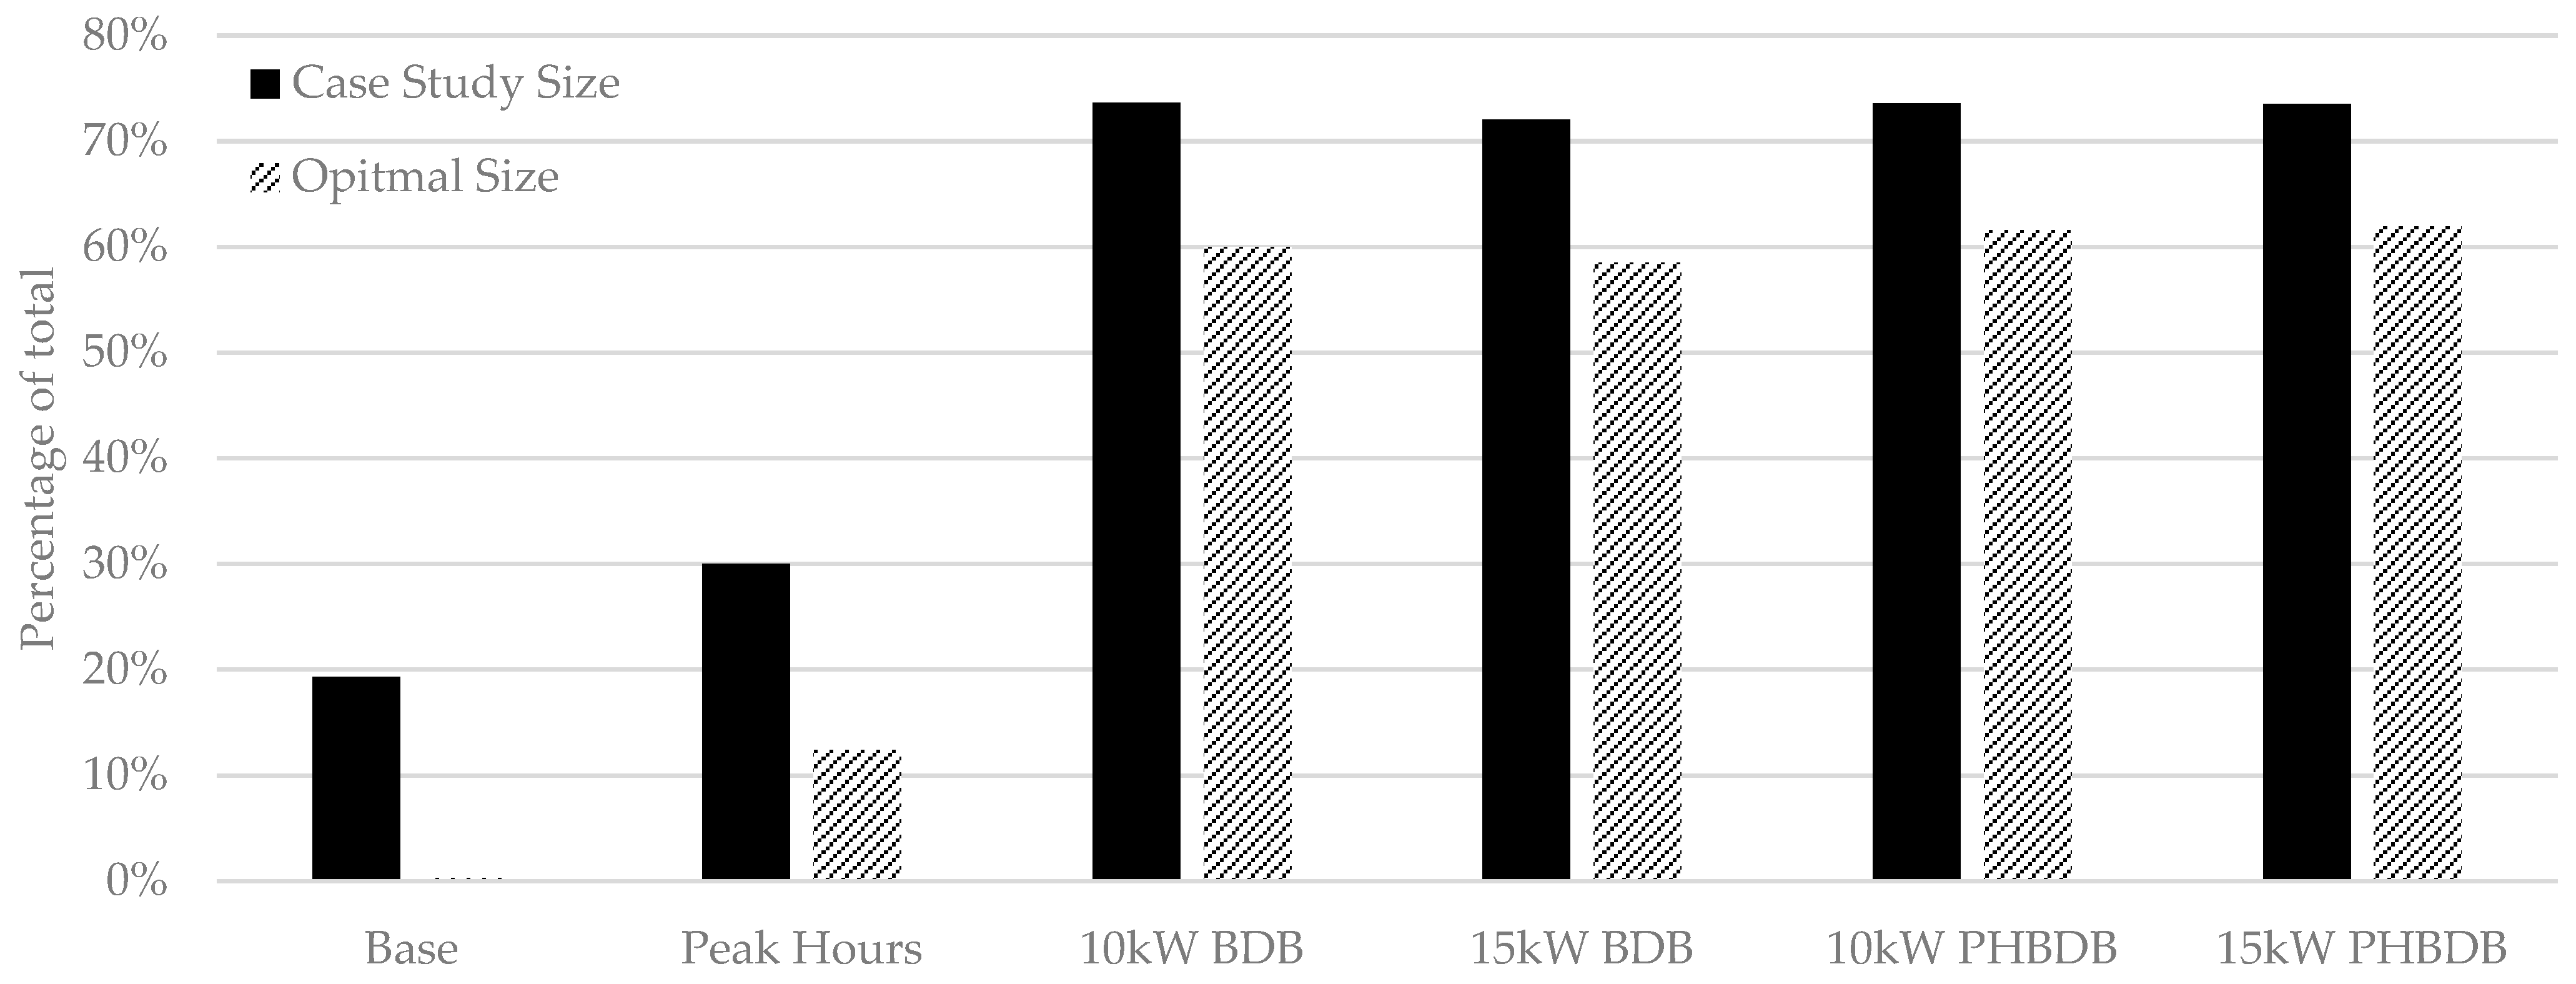
The total load supplied by the BESS, displayed in Figure 13, is as expected. By enabling the battery to supply the full load during battery discharge periods, the battery will, of course, deliver more energy than the base case. Limiting the power draw during peak hours forces the battery to supply the load when otherwise it would not, namely, when the EV load is less than the grid capacity. In all cases, the optimal sizing resulted in a reduced battery utilisation with respect to the case study sizing.
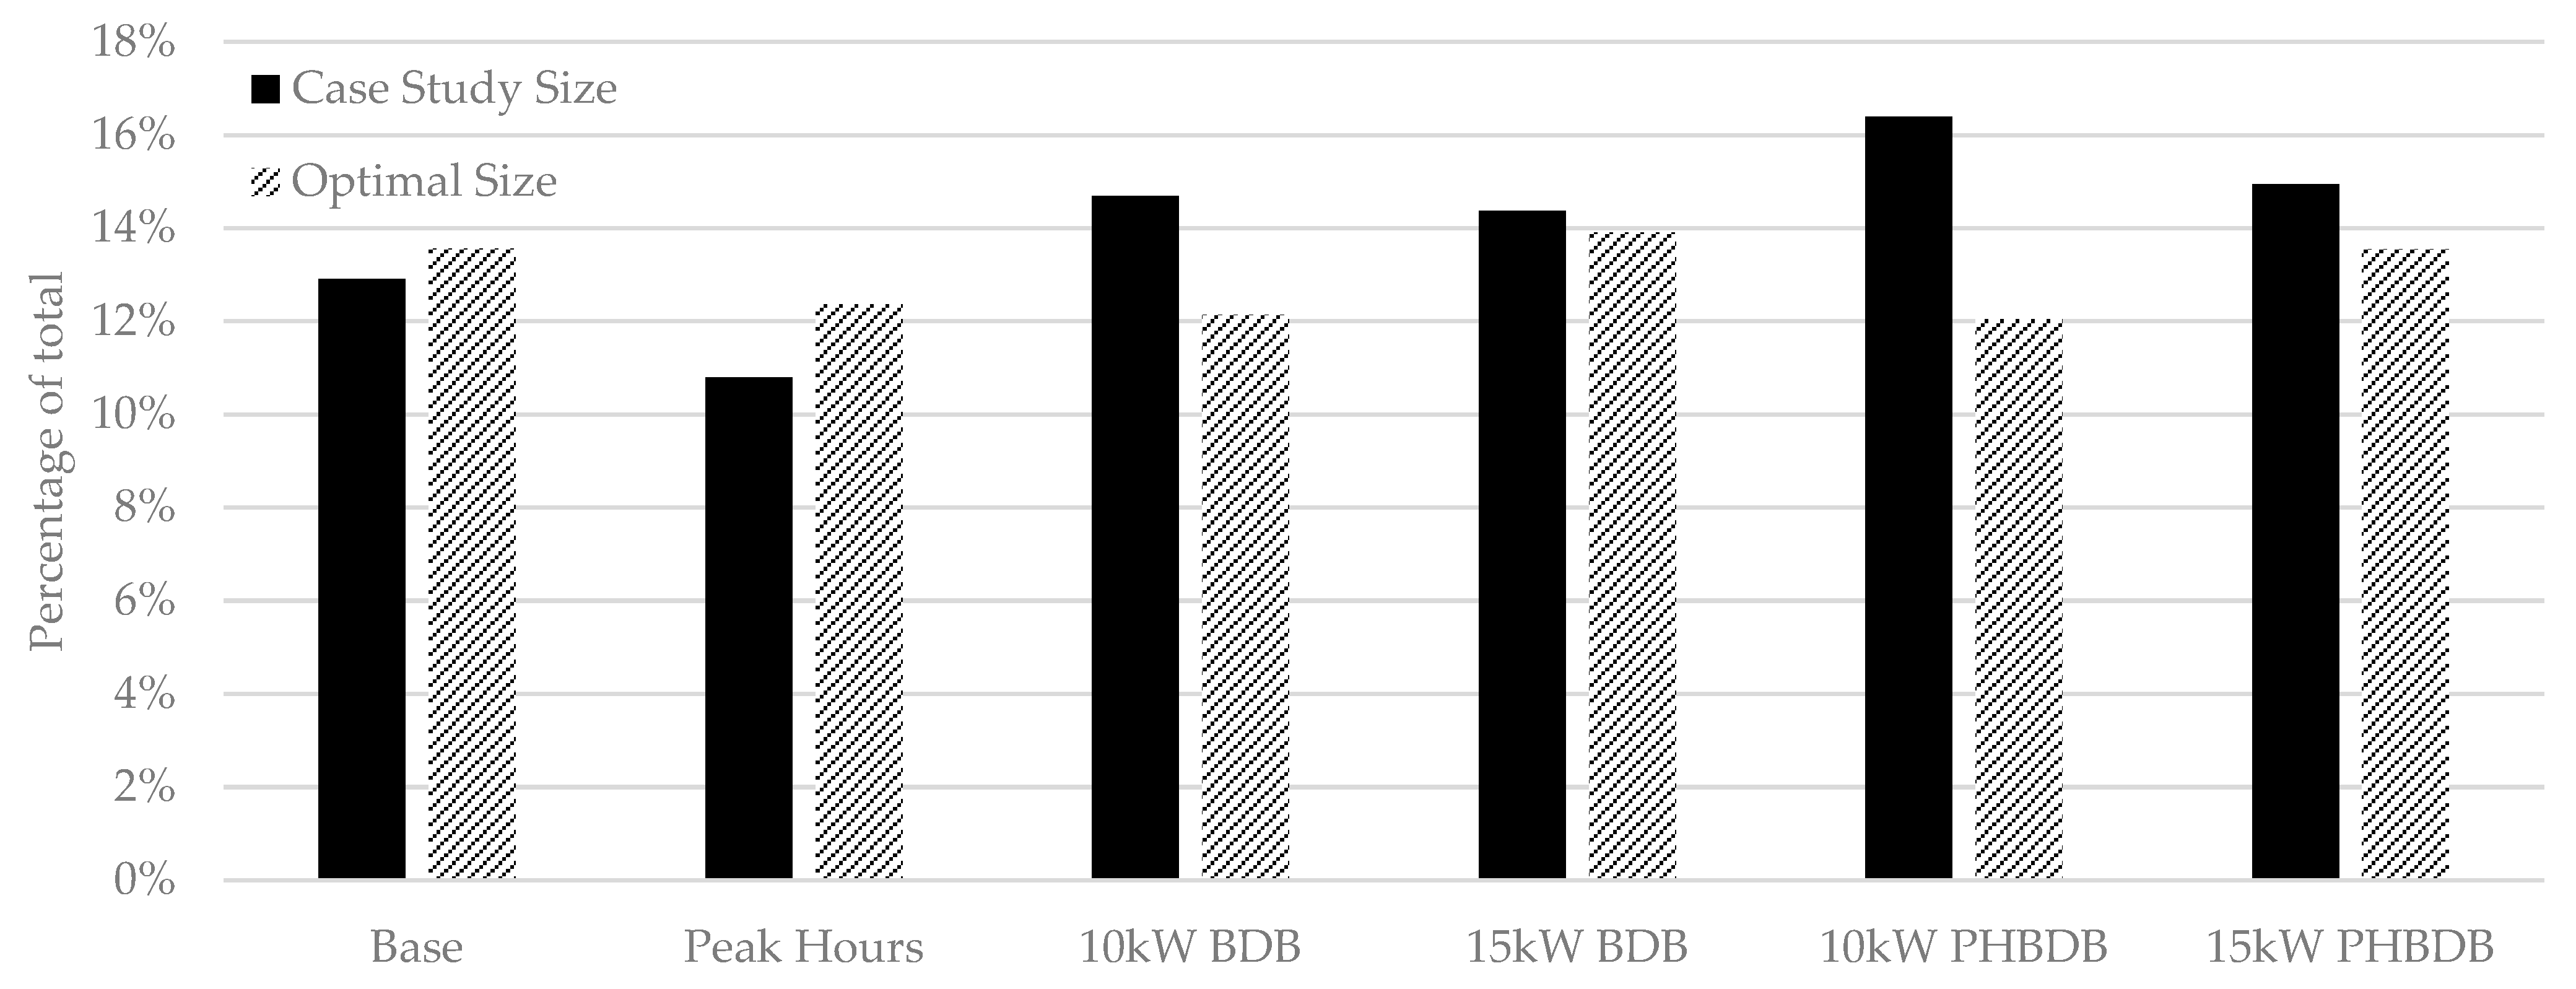
The percentage of users that ended the charging session while the vehicle was still charging was fairly consistent across all scenarios and for both systems, as can be seen in Figure 14. Regardless of the system sizing, some users are simply not parked long enough to fully charge their cars. However, as shown in Figure 10, the optimal system sizing experienced less loss of load, meaning fewer times of insufficient capacity. Therefore, having a higher capacity grid connection and lower BESS capacity tends to result in the ability to deliver more energy and, therefore, generate higher revenue.
6. Discussion
The model presented in this study is for the charging of EVs in a charging hub with a stationary BESS and grid connection. The model is easily scalable for any number of CPs, BESS capacity, grid connection capacity, and load profile. The charge session data used in these simulations were measured at a P&R charging hub. Given the appropriate data, for example, from a workplace charging hub or shopping centre charging hub, the model is easily transferable.
The power grid difficulties faced across the Netherlands have the same basis—there is too little capacity to transmit and distribute power. The supply of power from distributed renewable energy resources to the grid during times of peak generation (high irradiance/high wind) is a problem in rural areas where such renewable energy farms are located. The installation of new wind and PV farms has been suspended due to a lack of capacity at peak power generation. Nationwide, in both rural and urban settings, the electrification and digitalisation of society has resulted in a rapid increase in the electric power demand. Stedin and Enexis, two other distribution network operators in the Netherlands, confirm this issue is present in other regions. For example, in the Province of Utrecht, 651 consumers are waiting to be connected to the grid with a total purchase capacity of 155 MW [28]. In Eindhoven Oost, there are 78 open connection requests with a total purchase capacity of 52.3 MW [29].
Therefore, one must consider what the goals of such a solution like a BESS are. A limited loss of load, limited grid interaction, and high BESS round-trip efficiency are all considered in this study.
The choice of load profile used in solving the optimisation problem had a large effect on the outcome. The simulated load profile used in the optimisation was chosen over other ~7 MWh profiles because it included a high demand day—a peak power demand of 81 kW which lasted over 3 h. This high demand day served to stress-test the sizing and ensures the optimal sizing is capable of serving future loads.
The control method used in solving the optimisation problem also had a large effect. For instance, if the system was optimised using the 15 kW PHBDB control strategy, the BESS would inevitably require a larger energy storage capacity to satisfy the constraint represented by Equation (4), the volume of potential load lost. Furthermore, these are only a selection of specific, yet limited, control strategies that were intended to address specific performance metrics. The optimal power dispatch and charge session scheduling which would result in an improved system performance were outside the scope of this study.
The control strategies investigated generally perform better with the optimal sizing rather than the case study sizing for the frequently observed 5 MWh monthly load. When the monthly load increases, the disparity between the performance of the optimal sizing and the case study sizing will increase. This is made clear in Table 3, where the loss of potential load was less than 1.5% for the optimal sizing and over 6.5% for the case study sizing.
The control strategy that limited grid interaction during peak grid-load hours yielded the most desirable results with the optimal sizing. The BESS round-trip efficiency was increased with respect to both the optimal sizing base case and the case study sizing, to 79%. Energy losses were kept low since the load was mostly supplied via the grid connection; the battery supplied only 12% of the load. The grid interaction during peak evening load hours was reduced to 110 kWh, compared to 713 kWh for the optimal sizing base case. Finally, there was no loss of potential load.
If the battery were to be used for grid ancillary services, such as frequency response and voltage control, then an additional revenue would be available for the battery, and the optimisation problem would be reformed. The optimal sizing would likely tend towards a larger battery to benefit from the ancillary service revenue whilst still maintaining the security of supply for the P&R users.
Dynamic charging tariffs are thought to be a good method for incentivising users to charge their EVs at low grid-load times and reduce the disruption to the power grid. This would have little effect in a P&R since the intended user groups associated with a P&R charging hub, namely, commuters and visitors, are not as flexible in their arrival and connection time as resident CP users.
Vehicle-to-Grid (V2G) is another rapidly progressing technology. During times of high electricity price, the EV can act as a battery and deliver power to a household when connected and laying idle on the driveway. In an urban neighbourhood that relies on public CPs, a fleet of EVs could be used to reduce evening peak residential loads behind the substation. V2G may be feasible in a P&R charging hub but only for specific users who meet certain criteria, such as commuters who park for the full working day. However, transferring energy from one commuter to another commuter may result in unsatisfied users. How V2G would be implemented in a P&R charging hub is yet unknown.
Whilst DC fast chargers are becoming more prevalent, their installation at a P&R is not necessary. They are suited for rapid turnover charge sessions, such as along motorways or in taxi ranks, or for high-battery-capacity vehicles, such as at bus depots or for heavy goods vehicles. Typical user connection durations are multiple hours at P&Rs. The measured data indicated the average connection duration to be 13 h. Therefore, level-2 charging will remain applicable for coming years.
Larger EV batteries are, of course, to be expected in the coming years; battery capacities greater than 100 kWh are already on the market. This study assumed a maximum charging demand of 75 kWh since the largest measured charge session was 68.9 kWh. It is hard to predict how larger EV battery capacities will affect charging behaviour since it is so highly dependent on social demographics, the availability of charging infrastructure, social and cultural norms, and personal preference. Considering the price of BEVs with large capacities and the rate at which EVs are penetrating the car fleet, it will be many years before such large-capacity BEVs are the norm.
Finally, it is clear that a multi-objective optimisation is required, in which grid interaction during peak hours is minimised, as well as the annual system cost. The intention of this system is to reduce grid loading for large charging hubs, especially during peak grid hours. Thus, the BESS should be adequately sized and appropriately controlled to service all EV users whilst maintaining a high round-trip efficiency and keeping grid interaction to a minimum. This could best be integrated using electricity pricing, such that the BESS is prioritised during times of high electricity price and the grid is prioritised during times of low electricity price.
Perhaps the most practical recommendation is that the battery be installed with individual phase control or to ensure an energy contract with the distribution network operator to allow power flow back to the grid. These design considerations will allow for power to be delivered individually and unevenly on separate phases.
7. Conclusions
This study used measured data from an installed EV charging hub with an on-site stationary battery (336 kWh/250 kW) and limited capacity grid connection (17.4 kW) to develop and validate a computer model in Python. A genetic algorithm was used to minimise the annual costs of the system by optimising the battery energy storage capacity and the grid connection capacity for a monthly load of 7 MWh. Three different battery costs were evaluated; the approximate current cost of €750/kWh, the expected 2030 cost of €250/kWh, and the middle €500/kWh. The optimal sizing, with the €500/kWh cost, a 55.4 kW grid connection, and a 69 kWh/45 kW battery, was then assessed using a variety of simple control strategies; namely, limiting grid power draw during peak evening grid-load hours, and implementing a battery charge/discharge deadband, and comparing this against the case study sizing. The limited peak hour grid interaction control strategy was determined to perform best with the optimal sizing.
The feasible solutions to the optimisation problem for three load profiles, 5 MWh, 6 MWh, and 7 MWh, were plotted as the battery capacity against the loss of potential load. These figures illustrated what battery capacity was required at each grid connection capacity to ensure no loss of potential load.
Finally, the limitations of this study were addressed and ideas for future work were presented.
Author Contributions
Conceptualisation, E.H. and R.W.; methodology, E.H. and R.W.; software, E.H.; validation, E.H.; formal analysis, E.H.; investigation, E.H.; resources, E.H. and R.W.; data curation, E.H.; writing—original draft preparation, E.H.; writing—review and editing, R.W. and R.H.; visualisation, E.H.; supervision, R.W. and R.H.; project administration, R.W. and E.H.; funding acquisition, R.W. and R.H. All authors have read and agreed to the published version of the manuscript.
Funding
This research is a part of the Future Charging project funded by SIA RAAK (NWO), project number: RAAK.PRO03.128.
Data Availability Statement
The data used in this project are not available for sharing and were shared with project members confidentially.
Conflicts of Interest
The authors declare no conflicts of interest.
References
- Oude Groote Beverborg, B.; de Jager, A.; Heemskerk, J.; Fabius, B. Laad Me: Strategisch Plan Laadinfrastructuur 2020–2030; Techincal Report; Gemeente Amsterdam: Amsterdam, The Netherlands, 2020. [Google Scholar]
- Nationale Agenda Laadinfrastructure. The National Charging Infrastructure Agenda; Technical Report; Ministry of Infrastructure and Water Management: The Hague, The Netherlands, 2021. [Google Scholar]
- Liander. Available online: https://www.liander.nl/grootzakelijk/aansluiting/nieuw (accessed on 13 March 2023).
- Heath, E.; Wolbertus, R.; Heller, R. Battery Supported Electric Vehicle Charging Plaza Using a Limited Capacity Grid Connection. In Proceedings of the Electric Vehicle Symposium 36, Sacramento, CA, USA, 11–14 June 2023. [Google Scholar]
- Dai, Q.; Liu, J.; Wei, Q. Optimal photovoltaic/battery energy storage/electric vehicle charging station design based on multi-agent particle swarm optimisation algorithm. Sustainability 2019, 11, 1973. [Google Scholar] [CrossRef]
- Mehrjerdi, H.; Hemmati, R. Electric vehicle charging station with multilevel charging infrastructure and hybrid solar-battery-diesel generation incorporating comfort of drivers. J. Energy Storage 2019, 26, 100924. [Google Scholar] [CrossRef]
- Stecca, M.; Vermeer, W.; Soeiro, T.B.; Elizondo, L.R.; Bauer, P.; Palensky, P. Battery Storage Integration in EV Fast Charging Station for Increasing its Revenues and Reducing the Grid Impact. In Proceedings of the 2022 IEEE Transportation Electrification Conference & Expo (ITEC), Anaheim, CA, USA, 15–17 June 2022; pp. 109–113. [Google Scholar]
- Negarestani, S.; Fotuhi-Firuzabad, M.; Rastegar, M.; Rajabi-Ghahnavieh, A. Optimal sizing of storage system in a fast charging station for plug-in hybrid electric vehicles. IEEE Trans. Transp. Electrif. 2016, 2, 443–453. [Google Scholar] [CrossRef]
- Salapić, V.; Gržanić, M.; Capuder, T. Optimal sizing of battery storage units integrated into fast charging EV stations. In Proceedings of the 2018 IEEE International Energy Conference (ENERGYCON), Limassol, Cyprus, 3–7 June 2018; pp. 1–6. [Google Scholar]
- Haupt, L.; Schöpf, M.; Wederhake, L.; Weibelzahl, M. The influence of electric vehicle charging strategies on the sizing of electrical energy storage systems in charging hub microgrids. Appl. Energy 2020, 273, 115231. [Google Scholar] [CrossRef]
- Secchi, M.; Barchi, G.; Macii, D.; Moser, D.; Petri, D. Multi-objective battery sizing optimisation for renewable energy communities with distribution-level constraints: A prosumer-driven perspective. Appl. Energy 2021, 297, 117171. [Google Scholar] [CrossRef]
- Mazza, A.; Mirtaheri, H.; Chicco, G.; Russo, A.; Fantino, M. Location and sizing of battery energy storage units in low voltage distribution networks. Energies 2019, 13, 52. [Google Scholar] [CrossRef]
- Gu, T.; Wang, P.; Liang, F.; Xie, G.; Guo, L.; Zhang, X.P.; Shi, F. Placement and capacity selection of battery energy storage system in the distributed generation integrated distribution network based on improved NSGA-II optimisation. J. Energy Storage 2022, 52, 104716. [Google Scholar] [CrossRef]
- Moghimi, M.; Garmabdari, R.; Stegen, S.; Lu, J. Battery energy storage cost and capacity optimisation for university research center. In Proceedings of the 2018 IEEE/IAS 54th Industrial and Commercial Power Systems Technical Conference (I&CPS), Niagara Falls, ON, Canada, 7–10 May 2018; pp. 1–8. [Google Scholar]
- Khan, H.; Nizami, I.F.; Qaisar, S.M.; Waqar, A.; Krichen, M.; Almaktoom, A.T. Analyzing optimal battery sizing in microgrids based on the feature selection and machine learning approaches. Energies 2022, 15, 7865. [Google Scholar] [CrossRef]
- Alawode, B.O.; Salman, U.T.; Khalid, M. A flexible operation and sizing of battery energy storage system based on butterfly optimisation algorithm. Electronics 2021, 11, 109. [Google Scholar] [CrossRef]
- Koolman, G.; Stecca, M.; Bauer, P. Optimal battery energy storage system sizing for demand charge management in ev fast charging stations. In Proceedings of the 2021 IEEE Transportation Electrification Conference & Expo (ITEC), Chicago, IL, USA, 21–25 June 2021; pp. 588–594. [Google Scholar]
- Liander. Tarieven voor Aansluiting en Transport Elektriciteit: Voor Huishoudens en Zakelijke Klanten met een Kleinverbruikaansluiting per 1 Januari; Technical Report; Liander: Arnhem, The Netherlands, 2023. [Google Scholar]
- Blank, J.; Deb, K. Pymoo: Multi-objective optimisation in python. IEEE Access 2020, 8, 89497–89509. [Google Scholar] [CrossRef]
- Ramasamy, V.; Zuboy, J.; O’Shaughnessy, E.; Feldman, D.; Desai, J.; Woodhouse, M.; Basore, P.; Margolis, R. US Solar Photovoltaic System and Energy Storage Cost Benchmarks, with Minimum Sustainable Price Analysis: Q1 2022; National Renewable Energy Lab (NREL): Golden, CO, USA, 2022. [Google Scholar]
- Cole, W.; Frazier, A.W.; Augustine, C. Cost Projections for Utility-Scale Battery Storage: 2021 Update; National Renewable Energy Lab (NREL): Golden, CO, USA, 2021. [Google Scholar]
- Alfen Charging Equipment. Smart Charging Implementation Guide; Technical Report; Alfen: Almere, The Netherlands, 2020. [Google Scholar]
- BECK. Available online: https://www.team-elektro-beck.de/en/beck-automation/range-of-services/stationaeres-batteriespeichersystem.html (accessed on 5 February 2024).
- Kim, D.K.; Susumu, Y.; Ali, Z.T.; Kim, Y.T. Handbook on Battery Energy Storage System; Asian Development Bank: Manila, Philippines, 2018; pp. 1–6. [Google Scholar]
- Stecca, M.; Soeiro, T.B.; Elizondo, L.R.; Bauer, P.; Palensky, P. Lifetime estimation of grid-connected battery storage and power electronics inverter providing primary frequency regulation. IEEE Open J. Ind. Electron. Soc. 2021, 2, 240–251. [Google Scholar] [CrossRef]
- Andrenacci, N.; Chiodo, E.; Lauria, D.; Mottola, F. Life cycle estimation of battery energy storage systems for primary frequency regulation. Energies 2018, 11, 3320. [Google Scholar] [CrossRef]
- Ralon, P.; Taylor, M.; Ilas, A.; Diaz-Bone, H.; Kairies, K. Electricity storage and renewables: Costs and markets to 2030; International Renewable Energy Agency: Abu Dhabi, United Arab Emirates, 2017; p. 67. [Google Scholar]
- Stedin. Available online: https://www.stedin.net/zakelijk/energietransitie/beschikbare-netcapaciteit/congestie-en-congestiemanagement/provincie-utrecht (accessed on 5 February 2024).
- Enexis. Available online: https://indd.adobe.com/view/459b03c4-40b1-4cd8-bf9a-36b5aa4aad1b (accessed on 5 February 2024).
Figure 1.
Schematic depicting the BESS and CPs. Point a is the grid connection rated at 3 × 80 A at 400 V, 55.4 kW. Point b is the output of the AC feeder line to the CPs from the BESS container.
Figure 1.
Schematic depicting the BESS and CPs. Point a is the grid connection rated at 3 × 80 A at 400 V, 55.4 kW. Point b is the output of the AC feeder line to the CPs from the BESS container.

Figure 2.
BESS state of charge over 4 weeks.

Figure 3.
Probability density function of car arrival at a given time per day of week.

Figure 4.
(a) Charge sessions clustered by time of connection and connection duration on weekdays. (b) Probability density function of time of connection per cluster on weekdays.
Figure 4.
(a) Charge sessions clustered by time of connection and connection duration on weekdays. (b) Probability density function of time of connection per cluster on weekdays.

Figure 5.
Inverter efficiency vs AC side power.

Figure 6.
(a) Typical usage of the P&R system from measured data; (b) typical usage of the P&R system from the simulation.
Figure 6.
(a) Typical usage of the P&R system from measured data; (b) typical usage of the P&R system from the simulation.

Figure 7.
Feasible solutions to the optimisation problem considering a 5 MWh load profile.

Figure 8.
Feasible solutions to the optimisation problem considering a 6 MWh load profile.

Figure 9.
Feasible solutions to the optimisation problem considering a 7 MWh load profile.

Figure 10.
Potential load not supplied in different scenarios.

Figure 11.
Battery system round-trip efficiency in different scenarios.

Figure 12.
Energy imported from the grid during peak grid-load hours in different scenarios.

Figure 13.
Total load supplied by the BESS in different scenarios.

Figure 14.
Percentage of users charging at the time of disconnection in different scenarios.


Table 1.
System components.
| Component | Brand and Model | Specifications |
|---|---|---|
| Battery | BECK BESS Big Box | 240 kW, 336 kWh |
| Charge points | Alphen Twin Public | 3 × 35 A, 400 V, 24.2 kW per CP 3 × 20 A, 400 V, 13.75 kW per socket |
Table 2.
Performance metrics of the case study and the simulation.
| Measured Data | Model Validation | |
|---|---|---|
| Total load demand [kWh] | 4869 | 4958 |
| Number of charge events | 219 | 221 |
| Mean energy per charge event [kWh] | 22.2 | 22.5 |
| Mean charging power [kW] | 7.8 | 7.7 |
| Mean connection duration [hours] | 12.2 | 14.9 |
| Mean charging duration [hours] | 3.9 | 3.7 |
Table 3.
Performance of the optimal sizing compared to the case study sizing, for a 7 MWh load profile.
Table 3.
Performance of the optimal sizing compared to the case study sizing, for a 7 MWh load profile.
| Case Study | Optimal System (€250/kWh) | Optimal System (€500/kWh) | Optimal System (€750/kWh) | |
|---|---|---|---|---|
| Grid connection capacity, IG | 3 × 25 A | 3 × 80 A | 3 × 80 A | 3 × 80 A |
| Battery energy storage capacity, EB | 336 kWh | 100 kWh | 69 kWh | 49 kWh |
| Battery power capability, PB | 240 kW | 71 kW | 45 kW | 34 kW |
| Annualised investment | €9518/year | €6115/year | €7101/year | €9340/year |
| Loss of potential load, LL | 452 kWh | 56 kWh | 81 kWh | 99 kWh |
Disclaimer/Publisher’s Note: The statements, opinions and data contained in all publications are solely those of the individual author(s) and contributor(s) and not of MDPI and/or the editor(s). MDPI and/or the editor(s) disclaim responsibility for any injury to people or property resulting from any ideas, methods, instructions or products referred to in the content. |
© 2024 by the authors. Licensee MDPI, Basel, Switzerland. This article is an open access article distributed under the terms and conditions of the Creative Commons Attribution (CC BY) license (https://creativecommons.org/licenses/by/4.0/).
Share and Cite
MDPI and ACS Style
Heath, E.; Wolbertus, R.; Heller, R. Optimal Sizing of a Battery-Supported Electric Vehicle Charging Hub with a Limited-Capacity Grid Connection. World Electr. Veh. J. 2024, 15, 133. https://doi.org/10.3390/wevj15040133
AMA Style
Heath E, Wolbertus R, Heller R. Optimal Sizing of a Battery-Supported Electric Vehicle Charging Hub with a Limited-Capacity Grid Connection. World Electric Vehicle Journal. 2024; 15(4):133. https://doi.org/10.3390/wevj15040133
Chicago/Turabian StyleHeath, Edward, Rick Wolbertus, and Renée Heller. 2024. "Optimal Sizing of a Battery-Supported Electric Vehicle Charging Hub with a Limited-Capacity Grid Connection" World Electric Vehicle Journal 15, no. 4: 133. https://doi.org/10.3390/wevj15040133