1. Introduction
The advent of autonomous vehicles is fundamentally changing the paradigm of modern urban transportation. These vehicles are based on advanced sensor technology [
1,
2,
3], sophisticated artificial intelligence algorithms [
3,
4,
5,
6,
7,
8], and continuously evolving machine learning systems, enabling safe and efficient operation without driver intervention. These technologies offer a variety of benefits, including reducing traffic accidents, increasing the capacity of the road network, and improving overall traffic flow, which can improve the sustainable development of cities and quality of life [
9]. Realizing this potential requires a deep understanding and systematic improvement of existing transportation systems and infrastructure.
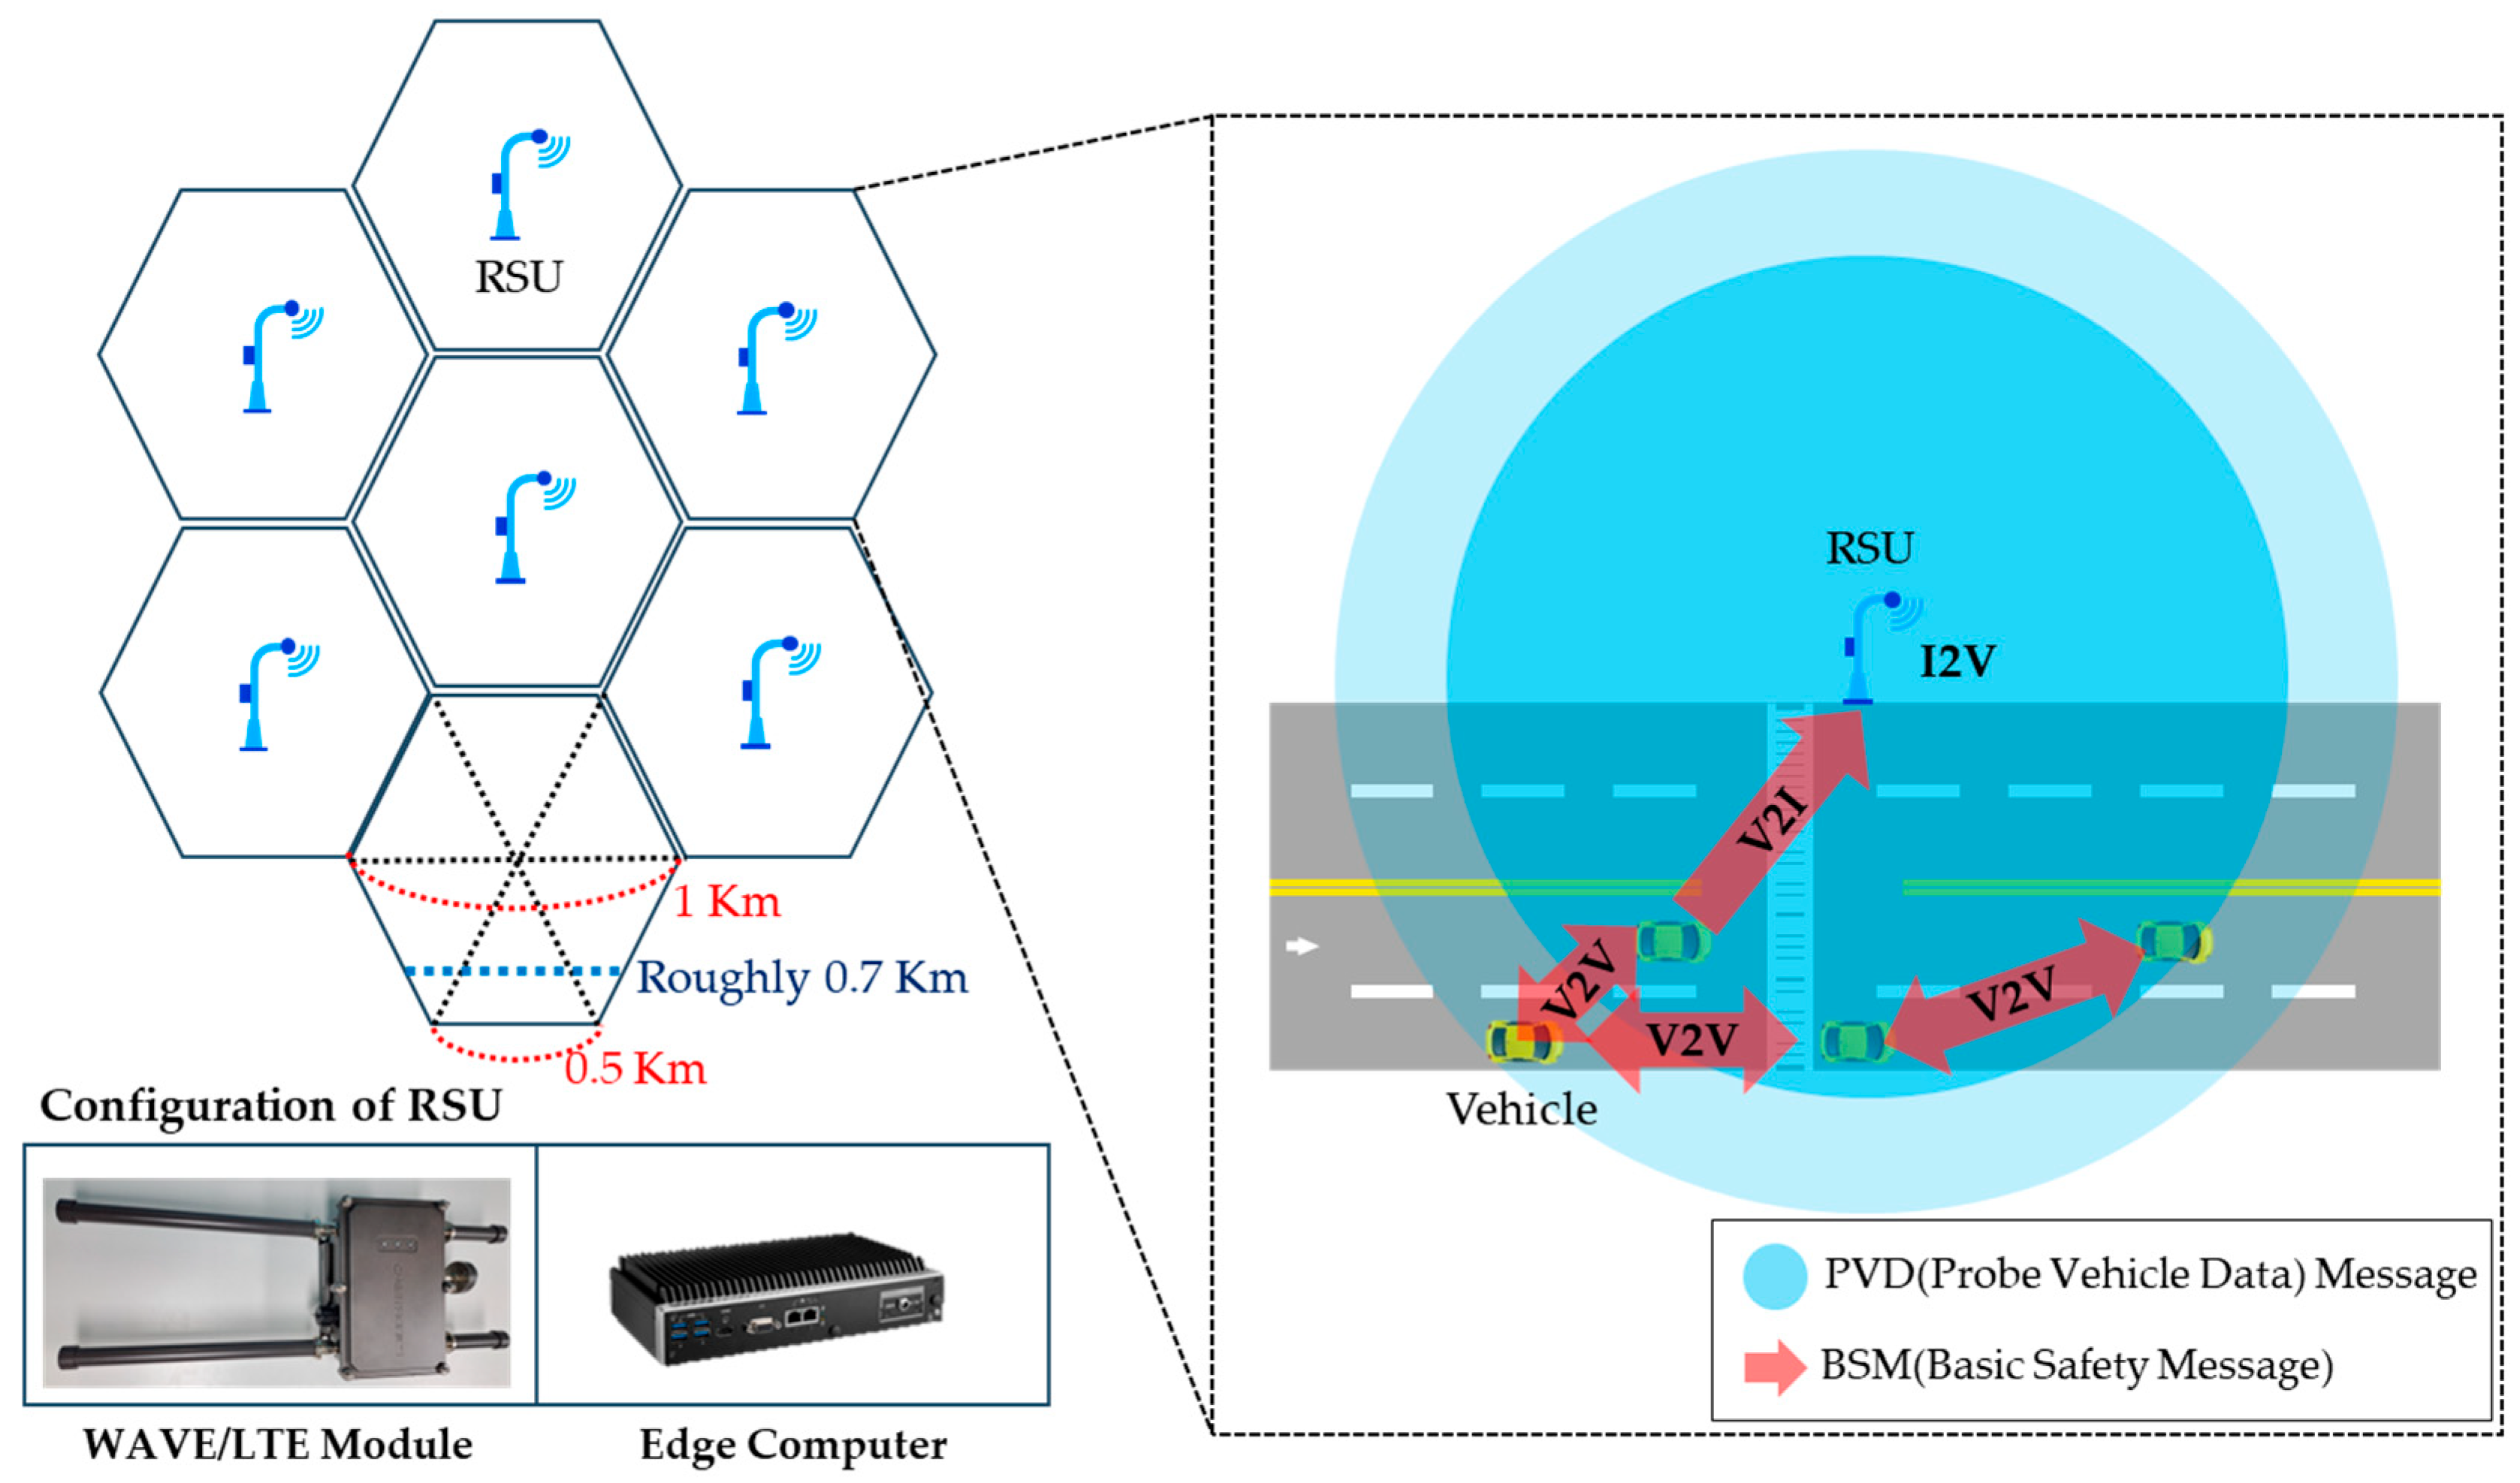
This paper discusses the role of the roadside units (RSUs) and how they interact with autonomous vehicles. The RSUs are important components of transportation infrastructure and exchange information with autonomous vehicles through vehicle-to-infrastructure (V2I) communications [
10,
11]. This communication provides vehicles with important information such as real-time traffic conditions, road conditions, and safety-related warnings, increasing vehicle operating efficiency and improving traffic safety. As shown in
Figure 1, we experimented with how to reduce traffic congestion and improve traffic flow by interacting with vehicles within a radius of roughly 700 m, considering the performance of the RSUs we own. The reason for calculating 700 m is that RSU is also used as a network model, and the network is generally divided into honeycomb-shaped boundaries [
12,
13]. Because it is located outside the road, there is a limit to the impact when there are many lanes.
The basic safety message (BSM) [
11,
14,
15] is generated by vehicles and facilitates both vehicle-to-vehicle (V2V) and vehicle-to-infrastructure (V2I) communications, as illustrated in
Figure 1. Conversely, probe vehicle data (PVD) [
14] originate from Roadside Units (RSUs), serving as infrastructure-to-vehicle (I2V) communication. These critical messages enable the exchange of vital vehicle information and assist in navigational negotiations among vehicles. Applicable to both connected and autonomous vehicles, BSMs and PVD play distinct roles. In connected vehicles, drivers receive these messages and make informed decisions, whereas, in autonomous vehicles, decision-making is managed by the central processing unit, incorporating sensor data from the vehicle. The significance of these messages lies in their direct impact on driving dynamics and safety.
Since BSMs among vehicles can be viewed in the RSU, the presence or absence of vehicles and driving negotiations can be known in areas affected by the RSU. Moreover, the RSU’s capability to dispatch messages to vehicles through robe vehicle data (PVD) empowers it to regulate vehicular traffic. Utilizing this understanding, we developed BSM and PVD models and conducted simulations in CANoePro [
16]. By configuring traffic information and road environments to mirror real-world conditions closely, our simulations aimed to replicate potential driving scenarios. This approach allows us to analyze situations prone to traffic congestion. The simulator employed in this research serves as a digital twin, facilitating preliminary studies before implementing these insights in actual traffic systems.
Figure 1.
RSU radius and V2I and V2V communication methods.
Figure 1.
RSU radius and V2I and V2V communication methods.
A digital twin plays an important role in modern transportation systems, especially the interaction among autonomous vehicles and RSUs. We plan to use the simulator CANoePro as a digital twin that can be compared to the real world. This technology creates precise digital replicas of the actual physical environment, allowing the behavior of complex systems to be simulated and predicted. In the context of urban transportation, digital twins contain a wide range of information, including real-time traffic data, road network conditions, and vehicle driving patterns. Experiments with these digital twins can help maximize road use efficiency, reduce traffic congestion, and improve safety. These technologies are also used to model complex traffic scenarios and predict the effectiveness of various traffic management strategies. For example, signal timing adjustments to improve traffic flow on specific road sections, lane change regulations, and response plans in emergency situations can be simulated. They also help city planners and transportation engineers proactively assess and optimize the impact of future road network expansions, infrastructure improvements, and transportation policy changes.
Efficient interaction among autonomous vehicles and RSUs can be designed and greatly improved through digital twins. The digital twin analyzes data collected by RSUs to identify traffic flow patterns and provides real-time feedback to vehicles. This prevents traffic congestion, improves road safety, and makes overall traffic smoother. The V2V plays an essential role in enabling autonomous vehicles to operate by exchanging information with surrounding vehicles. This technology prevents collisions and optimizes driving routes by sharing data such as distance, speed, and driving direction between vehicles. Despite its benefits, the V2V has several limitations. First, the communication range is dependent on the distance to surrounding vehicles, and information exchange with vehicles outside a certain range is impossible. Second, in vehicle-dense areas, connection problems may occur due to signal interference or data overload. Third, it is difficult to determine the traffic flow of the entire road using the V2V alone.
To overcome these limitations, we suggest traffic control using the proposed PVD: road balance. The proposed PVD provides extensive traffic data and road condition information through an RSU, which complements the range and reliability limitations of the V2V. Additionally, by using simulation to integrate and analyze data collected from the V2V and the V2I, more accurate and comprehensive traffic situation recognition is possible. This leads to reduced traffic congestion, improved safety, and increased efficiency of the overall transportation system. Accordingly, we propose methods to solve the traffic congestion problem by combining the simulation environment and RSUs. To this end, we consider the following major factors:
▪ How vehicles can reduce traffic congestion on the road network.
▪ Advantages in terms of traffic management of RSUs using the simulator.
▪ Limitations of the V2V.
To satisfy these factors, we analyze the technical characteristics of autonomous vehicles, the applicability of digital twins, and the role of RSUs. We also consider how these technologies can solve traffic congestion problems. In this paper, we evaluate the practical applicability and limitations of these technologies and propose practical strategies and measures to mitigate traffic congestion.
This paper is organized as follows:
Section 2 summarizes the related work.
Section 3 discusses the BSM and proposed PVD.
Section 4 experiments with two environments, the straight road and traffic circle road.
Section 5 discusses future works.
Section 6 concludes this paper.
2. Related Works
2.1. Digital Twins
There are several research efforts that utilize digital twins in industry, medical, cyber security, etc. X. Sun et al. [
17] proposed assembly-commissioning using a digital twin to improve manufacturing efficiency and quality of high-precision products. They virtually modeled the manufacturing process using a digital twin and proved its efficiency by comparing the existing manual assembly method with the proposed method. C.-K. Wen et al. [
18] proposed a method for predicting the fatigue life of mechanical structures using a digital twin. They digitally reproduced the physical characteristics and operating environment of an off-road vehicle as a test case, compared the actual stress values of the physical system with the predicted stress values of the digital model, and proved the accuracy and reliability of the digital twin-based prediction model. Y. Liu et al. [
19] proposed the CloudDTH framework that can provide efficient medical services by combining a digital twin with the healthcare field. In addition, a simulation was performed to verify the feasibility of the proposed framework, proving that it is effective in optimizing medical scheduling and medical resource allocation. They discussed the diversity of uses of digital twins, which is focused on platform construction and data monitoring. Kandasamy et al. [
20] built a digital twin for a testbed for training and testing cyber-attacks to solve potential security problems in the smart grid of cyber-physical systems and presented a case study. They proposed cybersecurity testing using digital twins. Almeaibed et al. [
21] proposed a method to enhance safety and security by utilizing a digital twin in the field of autonomous vehicles. They simulated the operation of autonomous vehicles, computer systems, and networks and conducted an empirical case study. They also simulated the actions an autonomous vehicle might take in various road conditions and situations and identified and resolved potential safety issues.
2.2. Reducing Traffic Congestion Methods
Several research efforts have been made to utilize various methods for reducing traffic congestion on the road. Zhang et al. [
22] explored a predictive intelligent transportation system to alleviate traffic congestion in the Internet of vehicles environment, utilizing advanced sensor technology and AI algorithms for traffic prediction and management. Rocha Filho et al. [
23] investigated enhancing intelligence in traffic management systems to address vehicle traffic congestion problems in smart cities, focusing on improving traffic flow through intelligent algorithms and data analysis. Quessada et al. [
24] introduced ITSMEI, an intelligent transport system designed for monitoring traffic and event information, utilizing real-time data for effective traffic management and prediction. Brennand et al. [
25] proposed a fog-enabled intelligent transportation system aimed at reducing traffic jams by combining real-time data processing with traffic management to optimize traffic flow. Bauza et al. [
26] presented a method for traffic congestion detection in large-scale scenarios using vehicle-to-vehicle communications, collecting and analyzing extensive vehicle network data. Aleko et al. [
27] developed an efficient adaptive traffic light control system for urban road traffic congestion reduction in smart cities, adjusting traffic light timings based on road conditions. Manoj Kumar et al. [
28] explored traffic congestion control, synchronization, and rerouting using LoRa technology, enabling efficient communication across extensive traffic networks. Pan et al. [
29] developed proactive vehicular traffic rerouting methods for lower travel time, analyzing road conditions and traffic flow data to provide optimal routes. Meneguette et al. [
30] conducted experiments to increase intelligence in inter-vehicle communications to reduce traffic congestion in both urban and highway environments, improving traffic efficiency through information sharing among vehicles. Liu et al. [
31] investigated secure intelligent traffic light control using fog computing to enhance security and efficiency in traffic systems, improving the performance of traffic systems.
The dynamic field of traffic management, especially with the integration of autonomous vehicles, brings into focus foundational theories. Theories such as those explored by Roughgarden, T. [
32] delved into the price of anarchy and efficiency losses within traffic systems due to individualistic driving behaviors. Similarly, research by Correa, J.R. et al. [
33] provided an in-depth analysis of self-interested routing behaviors and their impact on systemic traffic flow inefficiencies. This research illuminates the inherent challenges in managing traffic systems where autonomous and human-driven vehicles coexist. While our research does not directly replicate the methodologies of Roughgarden, T., and/or Correa, J.R., their findings serve as a theoretical backdrop against which our investigation is framed. This research explores how these concepts apply in the context of roadside units (RSUs) and their potential to mitigate congestion, thereby extending these theoretical models into practical traffic management solutions.
Additionally, our paper is mindful of the environmental impacts associated with driving behaviors, specifically focusing on the implications of frequent braking. Research by Jereb, B. et al. [
34], ‘Traffic congestion and its effect on fuel consumption’, emphasizes the direct connection between erratic driving patterns and increased fuel consumption and emissions. This relationship between traffic management strategies and environmental sustainability underpins our investigation, demonstrating the need for efficient traffic systems that also consider ecological impacts.
3. Basic Safety Messages and Probe Vehicle Data
This section describes BSM and PVD messages for vehicles and infrastructures.
3.1. Basic Safety Messages (BSMs)
BSM is a message used for driving negotiations in connected and autonomous vehicles.
Table 1 shows the BSM specifications required by the J2735 standard [
14]. As shown in
Table 1, the messages are largely classified into BSM Part 1 and Part 2. BSM stands for basic safety message and refers to the basic message used for safety while driving. BSM Part 1 is the minimum data essential for safety, and BSM Part 2 is data that guarantee scalability. The explanation based on data elements in BSM PART 1 is as follows. MsgCount provides a sequence number within a message stream from the same sender. Latitude is the geographical latitude of the vehicle, expressed in 31 bits in units of 1/10 micro degrees. Elevation indicates the vehicle location based on geographic altitude and WGS-84 [
35]. SemiMajorAxisOrientation represents the direction of the object. Heading uses WGS-84 as the direction of the object and increases clockwise with north as 0. In addition, there are various messages in BSM Part 1. BSM Part 2 can be expanded and used with abnormal event flag data that may occur in objects.
3.2. Probe Vehicle Data (PVD)
PVD play a critical role in providing real-time traffic conditions and road environment information by utilizing data collected from vehicles.
Table 2 outlines the specifications for PVD messages, which bear similarities to BSMs. In our system, BSMs transmitted by vehicles are collected by RSUs, eliminating the need for vehicles to generate separate PVD. Consequently, PVD are utilized by RSUs as a basis for delivering messages to vehicles and facilitating I2V communications. Leveraging the newly proposed PVD specifications, we aim to enhance vehicle control mechanisms.
The proposed road balance message has five items. These three items, “deceleration”, “acceleration”, and “stopYield”, adjust the vehicle’s speed. “stopYield” can be useful for vehicles waiting when an emergency vehicle approaches and when cooperating. “approval” and “queue” are the information needed for negotiation. “approval” can give priority information when intervening. “queue” can also be numerically specified for vehicles trying to enter. The RSU only provides information, and the choice is made by an autonomous vehicle or person. Therefore, there is no need to specifically mention detailed speed.
The proposed road balance message field is an essential message for cooperative driving between vehicles, so it is defined as follows. PVD has a cyclic redundancy check (CRC) to check for errors [
36], but it can only confirm that data corruption has occurred. Therefore, we benchmarked the method used by the IR remote system [
37,
38] to reliably send this message. This message consists of a simple binary system (‘yes’ or ‘no’) encapsulated within 1 byte; however, to ensure accuracy, an additional byte for data verification (inverted data) is included, doubling its size to 2 bytes. For example, if the 1-byte data of road balance is “0010 0011”, it means to stop to give way and pass after a total of three cars have passed. Including the inverted data, the message “00100011 11011100 (Hexadecimal: 23DC)” is sent.
Since the scenarios discussed in
Section 4 cannot be fully replicated in the simulator, these messages will be implemented in real-world settings through edge computers and OBU/OBD systems. It is essential to understand that BSMs and PVD serve merely as messages; the actual vehicles and their operators must be equipped and prepared to interpret and act upon these communications effectively.
Moreover, it is crucial to acknowledge that the implementation of BSMs and PVD is not compulsory. The underlying philosophy is not to control vehicles and their occupants like marionettes but to offer them informed choices. The adoption and execution of BSMs and PVD should ideally be underpinned by a framework of human ethics. Nevertheless, there are special considerations for emergency vehicles or situations, which may necessitate a more prescriptive approach due to legal requirements and the imperative of public safety.
4. Vehicle Cutting in Experiment and Evaluation to Reduce Traffic Congestion
In this section, we use experiments with events that may occur on the Korean roads designed. We propose lane change restrictions based on density.
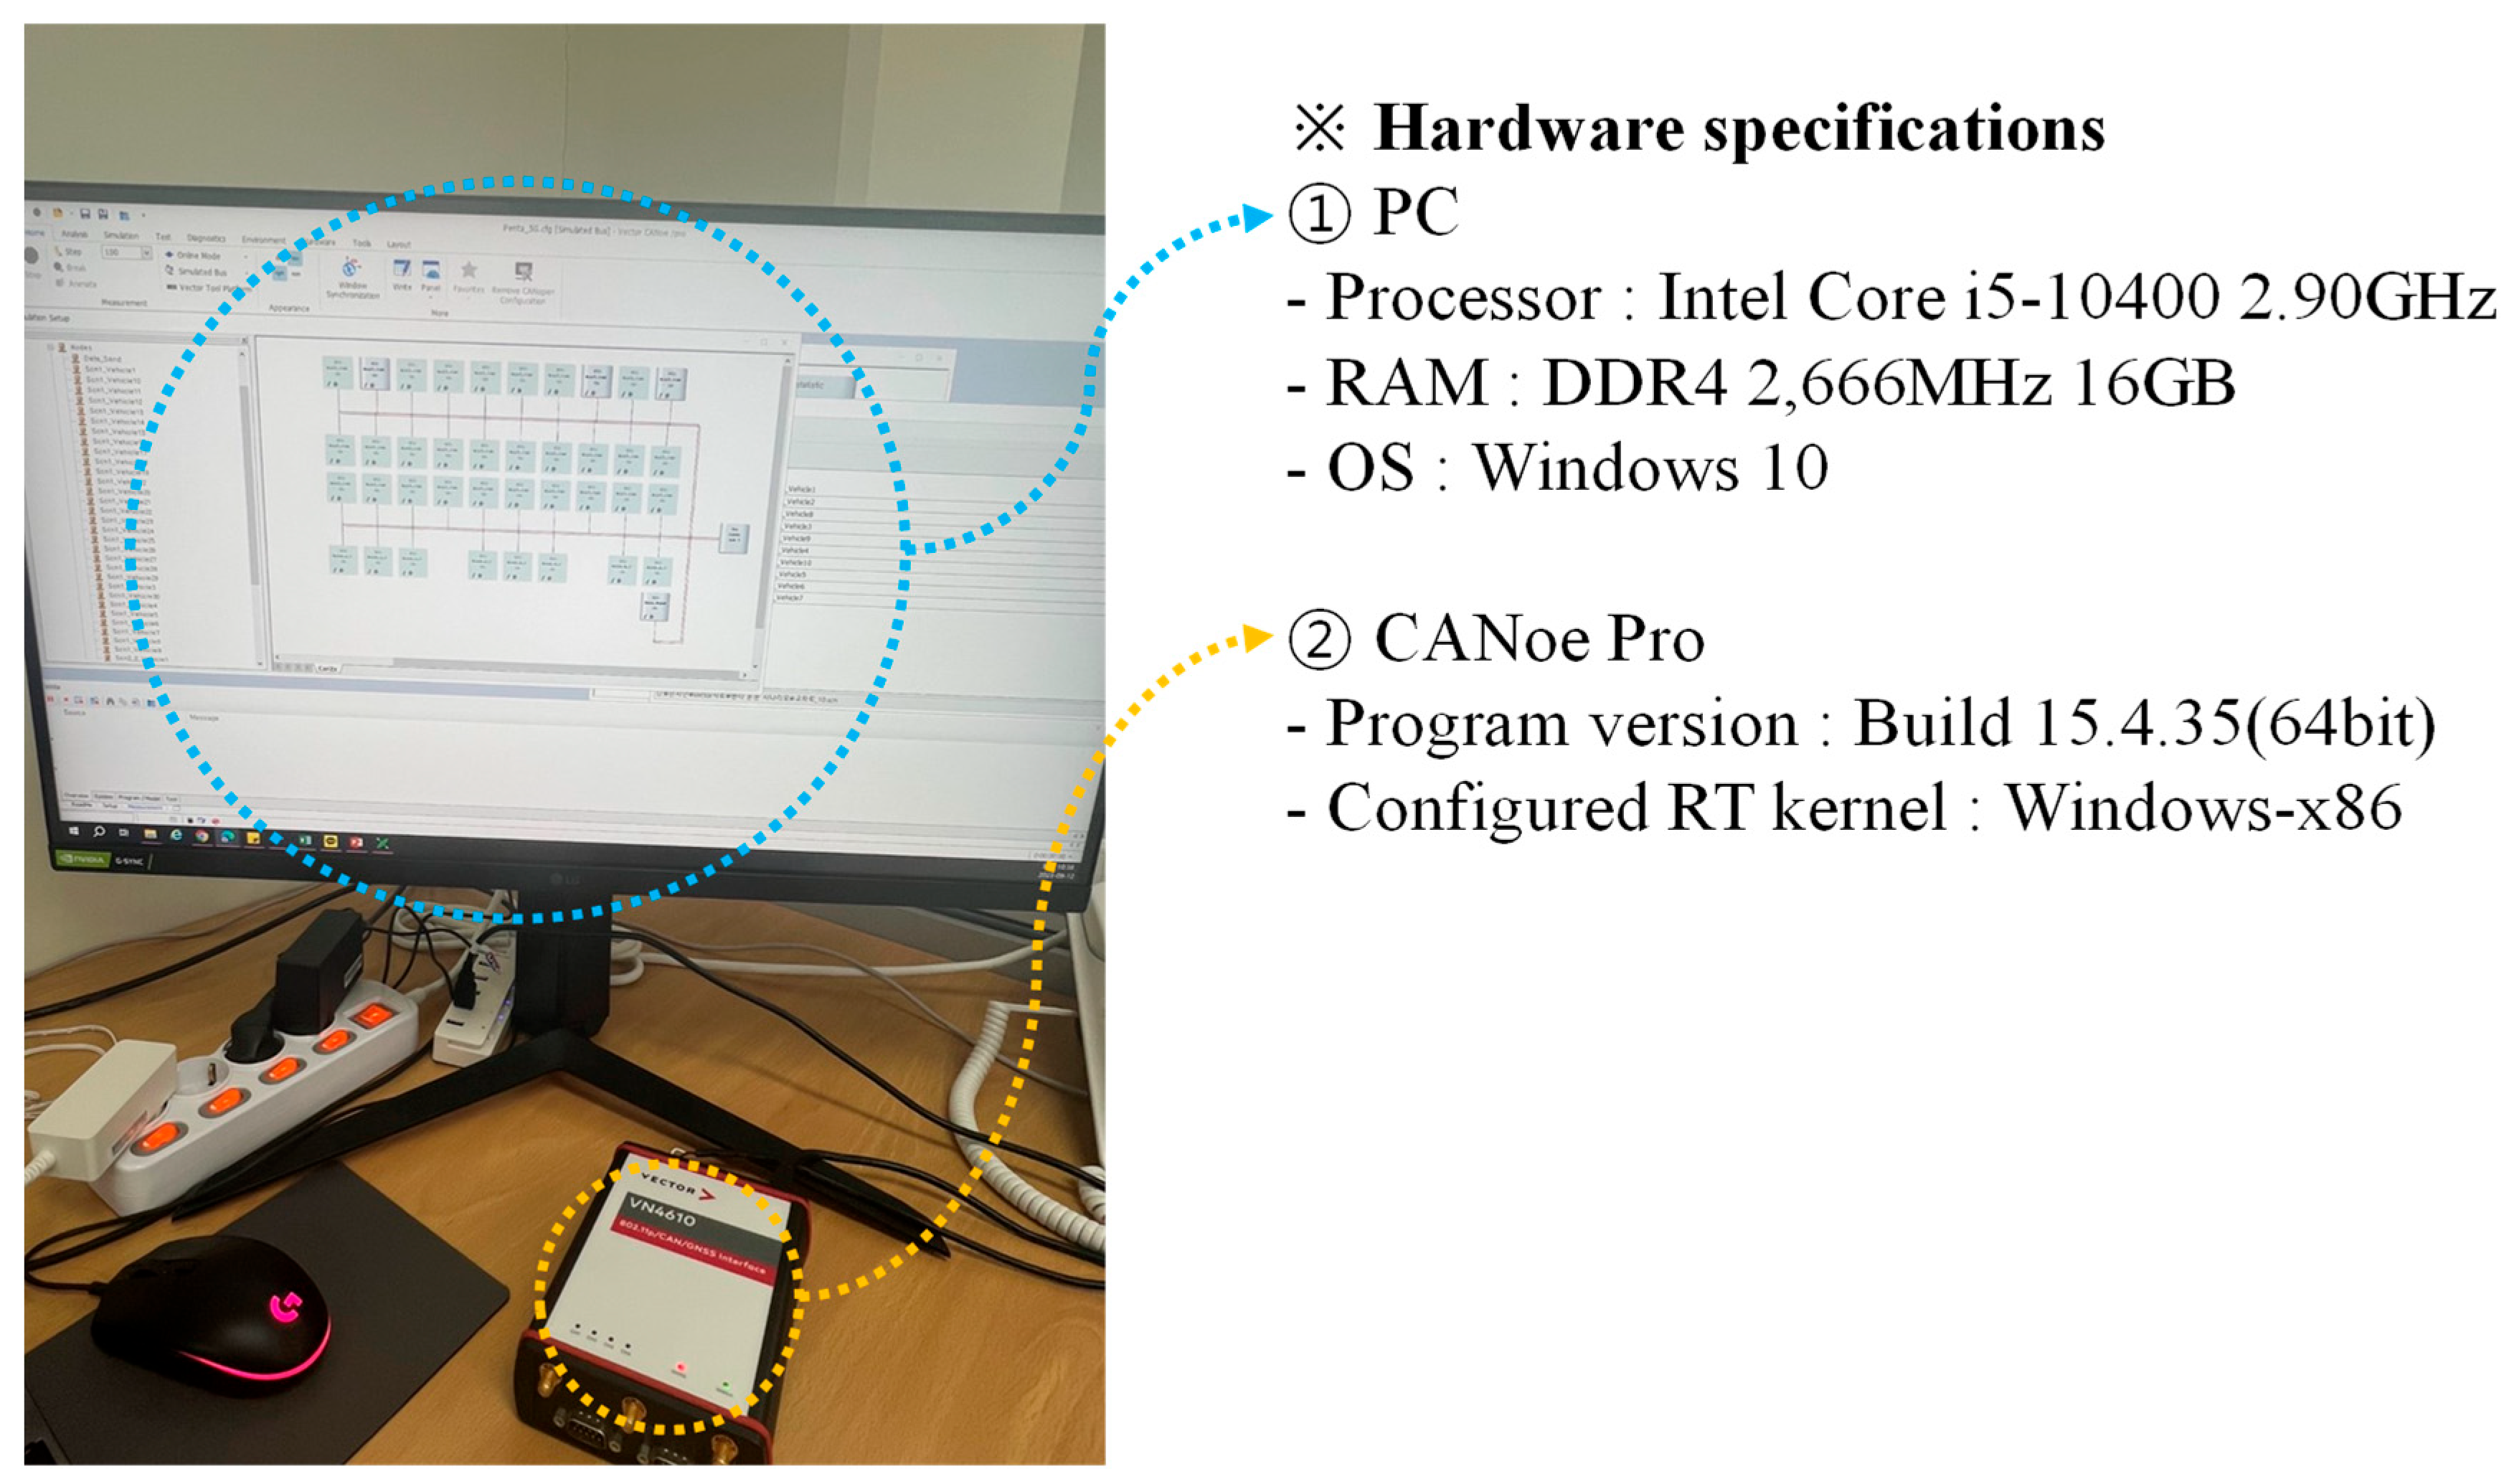
Figure 2 shows the experimental environment. In a PC environment, the CPU is i5-10400 and the RAM is 16GB. The operating system is Windows 10 environment. The version of CANoePro is Build 15.4.35 (64bit). The configured RT kernel is windows-x86.
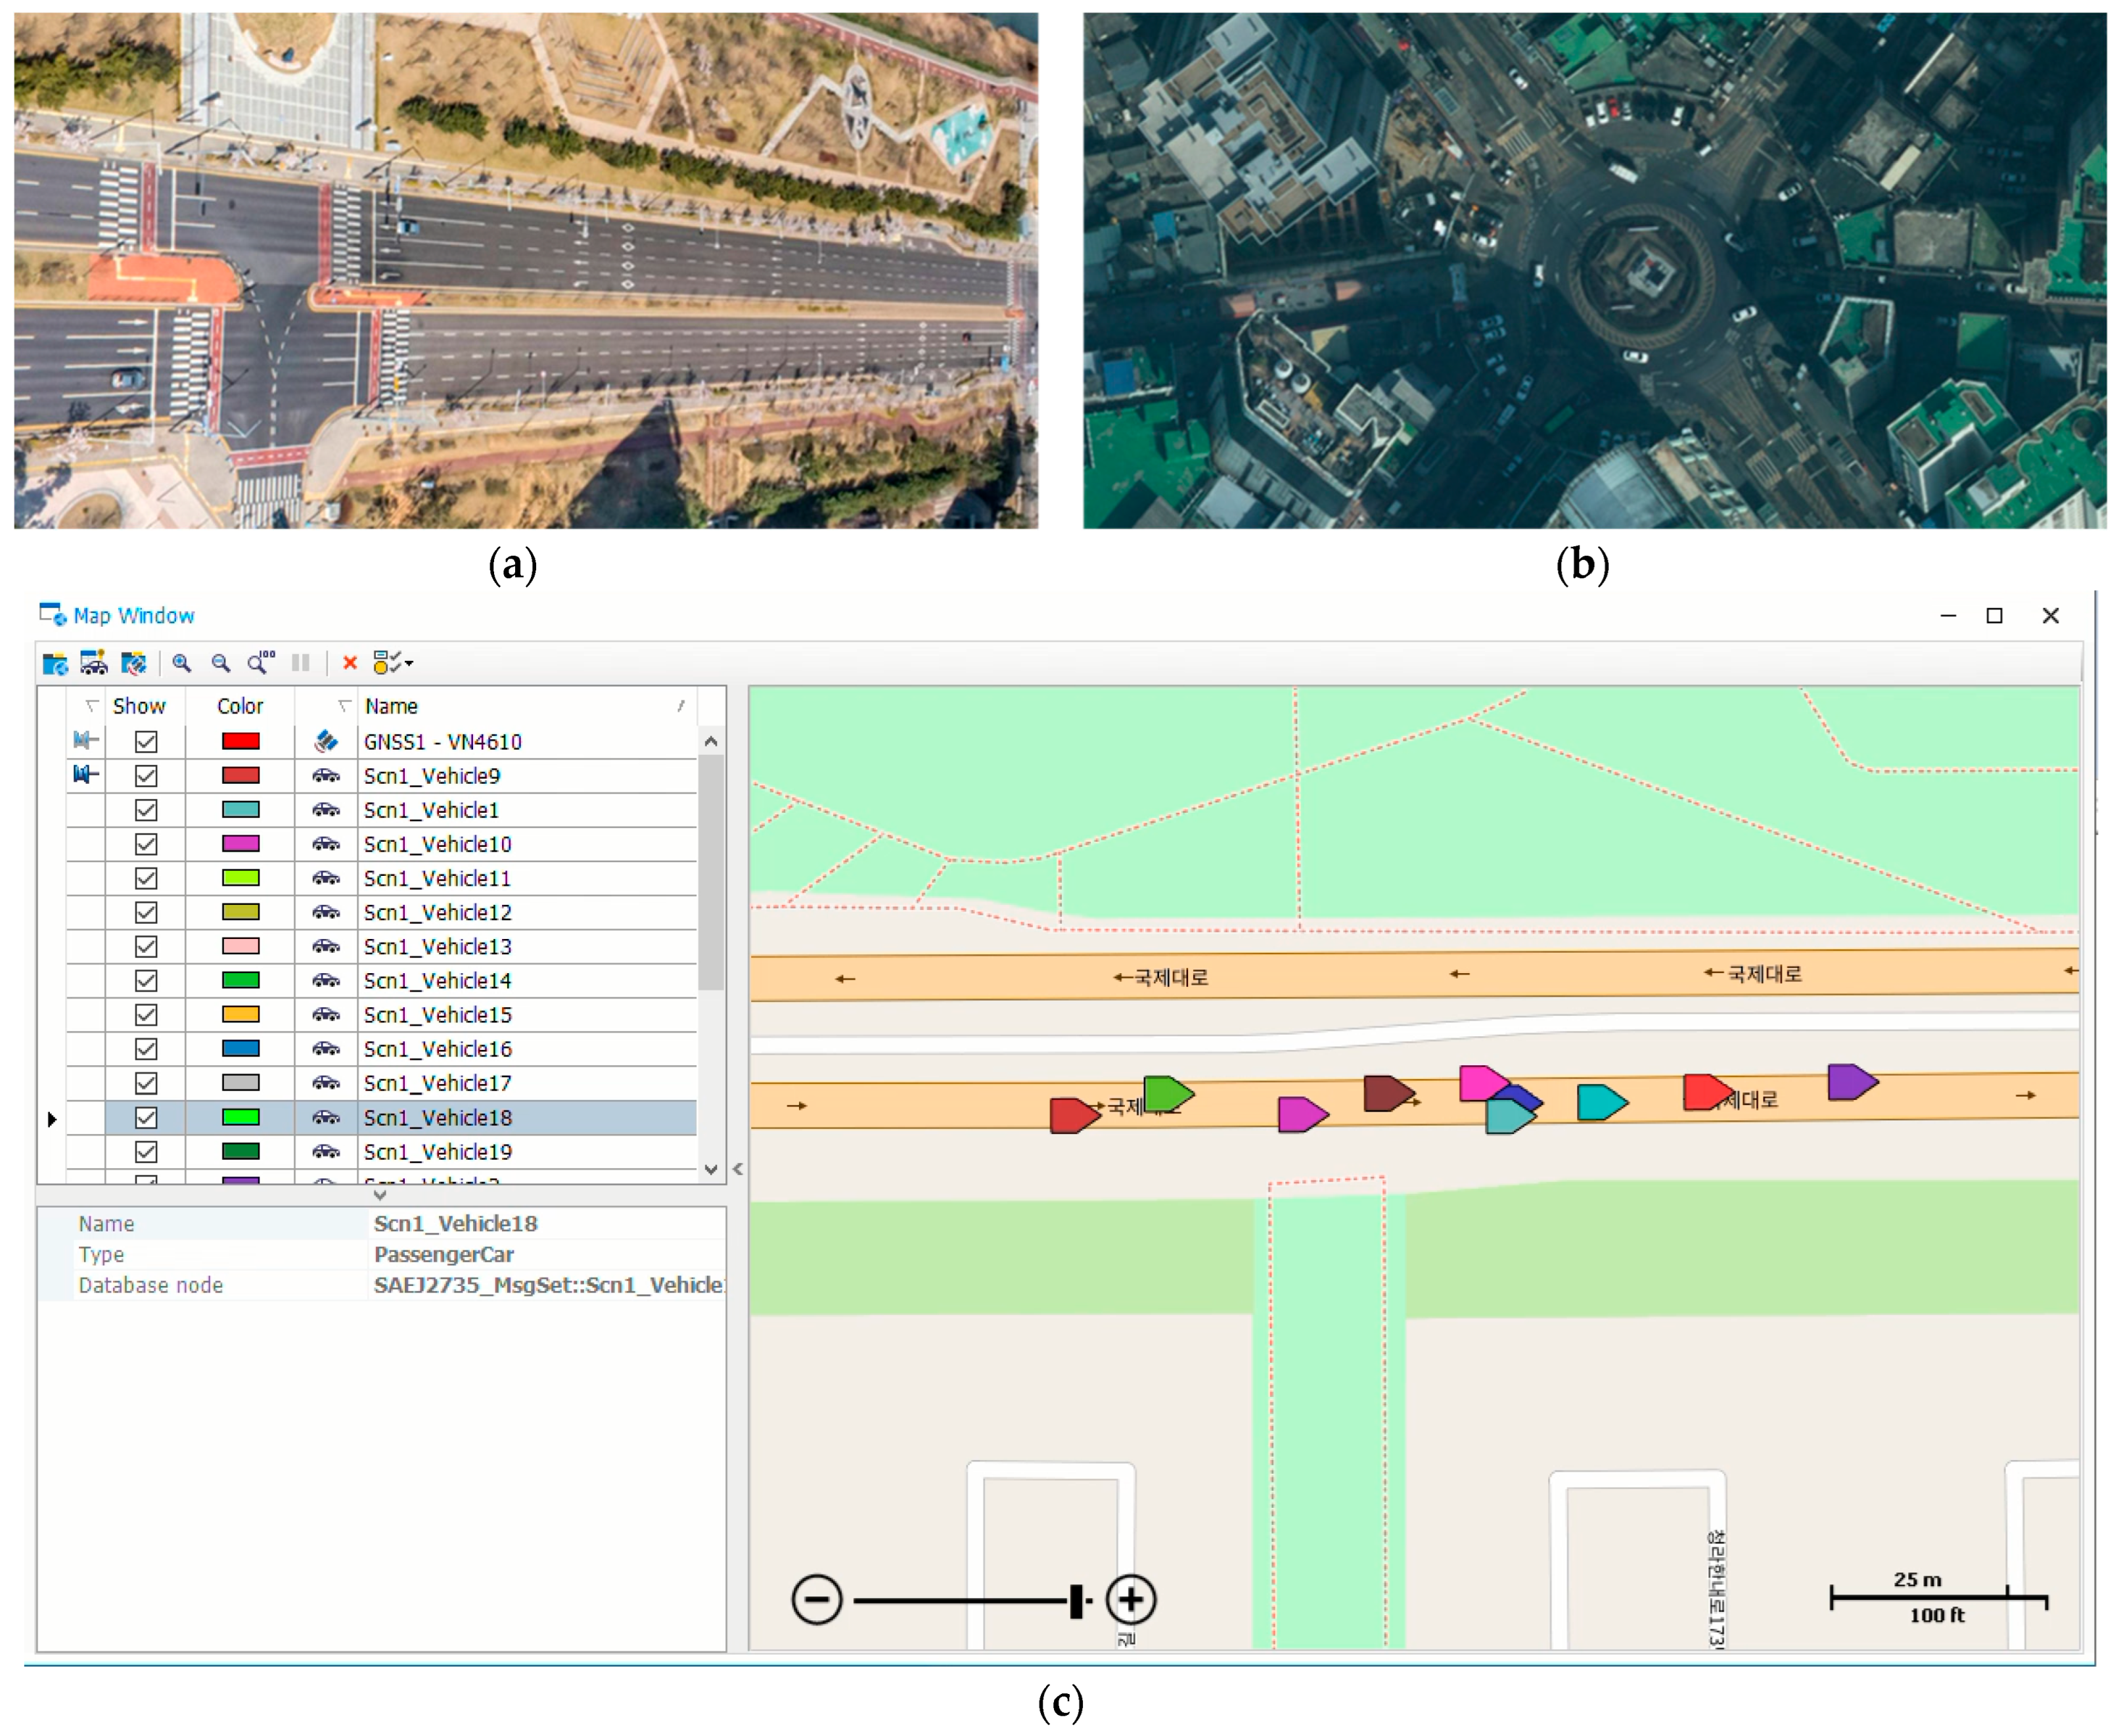
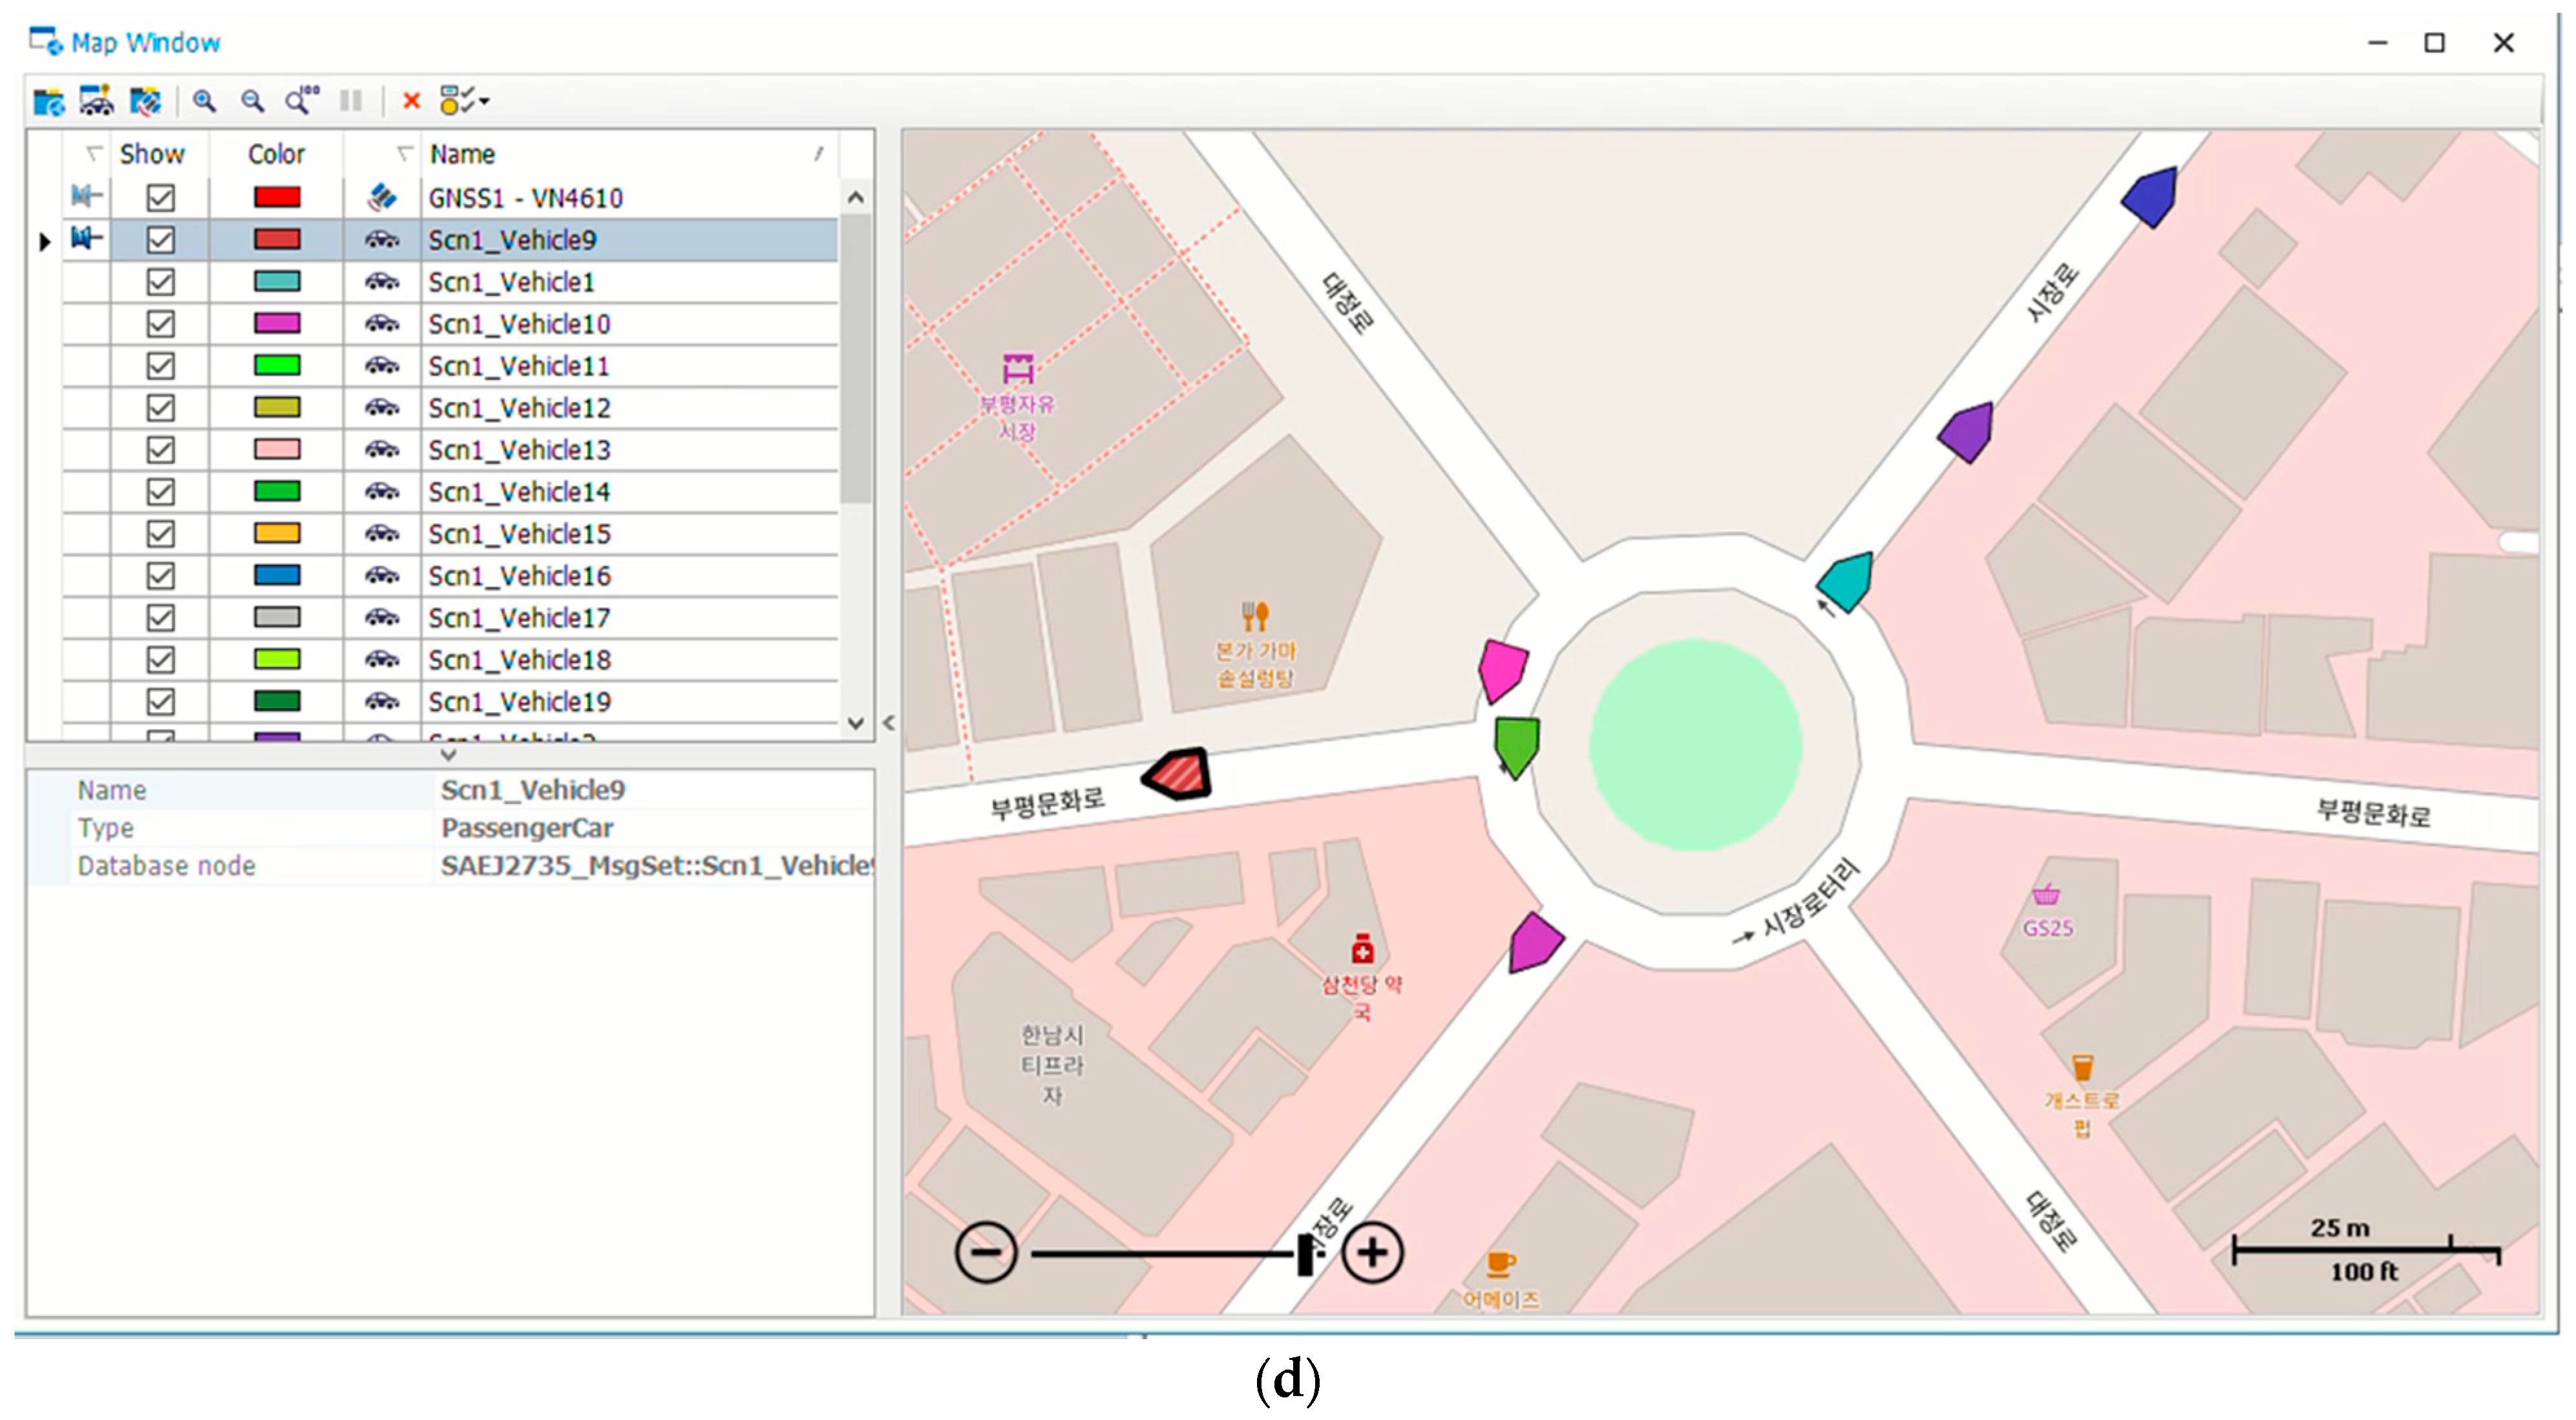
Korean roads have a speed limit of 110 km/h on expressways, and the average speed is 80 km/h. The legal limit for driving in the city is 50 km/h, and in child protection areas, drivers must drive at a speed of 30 km/h or less. We considered two roads, as shown in
Figure 3. The road in
Figure 3a is heavily congested during rush hour and was considered to facilitate the flow of vehicles. The road in
Figure 3b is a traffic circle road, a road in the city where traffic is paralyzed and concessions are prioritized. Thus, the roads in
Figure 3a,b are abstracted into the simulation represented in
Figure 3c,d.
Each experiment was conducted multiple times to ensure reliability and reproducibility. However, it is important to note that simulating a vehicle’s behavior randomly can seldom replicate real road conditions accurately due to inherent randomness. While introducing entropy into the simulation can create scenarios closer to reality, perfectly mirroring actual road environments remains challenging. Consequently, we focused on analyzing ten data sets where vehicle distribution was uniform, deeming this approach as the most representative of meaningful traffic conditions.
From these data, we were able to calculate vehicle densities and observe scenarios where the behavior of one vehicle significantly impacted two or more vehicles. It is crucial to mention that the operational parameters of RSUs, including density thresholds, can vary depending on specific road conditions. While our experiments primarily illustrate cases where one vehicle influences two others, the thresholds could be adjusted to reflect the influence on three or more vehicles, demonstrating the RSUs’ adaptability to different traffic scenarios.
In this paper, we emphasize the potential application of these findings rather than prescribing fixed thresholds for RSUs. This approach underscores the flexibility and adaptability required in real-world implementations, allowing for a more nuanced understanding and application of RSU-based traffic management systems.
Figure 3.
Real roads and their abstraction. (a) Straight road; (b) traffic circle road; (c) straight road in simulator; (d) traffic circle road in simulator.
Figure 3.
Real roads and their abstraction. (a) Straight road; (b) traffic circle road; (c) straight road in simulator; (d) traffic circle road in simulator.
4.1. Straight Road
The length of the road is 700 m, and it is set to have a total of four lanes. Each RSU operates within a coverage area that has a diameter of 700 m. This does not refer to the length of the road but to the diameter of the coverage area. The road, while having a length of 700 m, comprises four lanes, but this detail does not extend the road’s physical length, it merely specifies its width and capacity. The size of the vehicle is generally set to 5 m ∗ 2 m. In this paper, a total of 10, 15, and 20 vehicles were experimented to observe the variation in road density. Road density, defined as
Vdensity, is calculated by considering the total length of all vehicles on the road and comparing it to the total road area. Given that the length and lanes of the road are fixed at 700 m and four lanes, respectively, the total road area is 2800
. The calculation of the
Vdensity, as shown in Equation (1), considers the ratio of the combined length of all vehicles to the total road area.
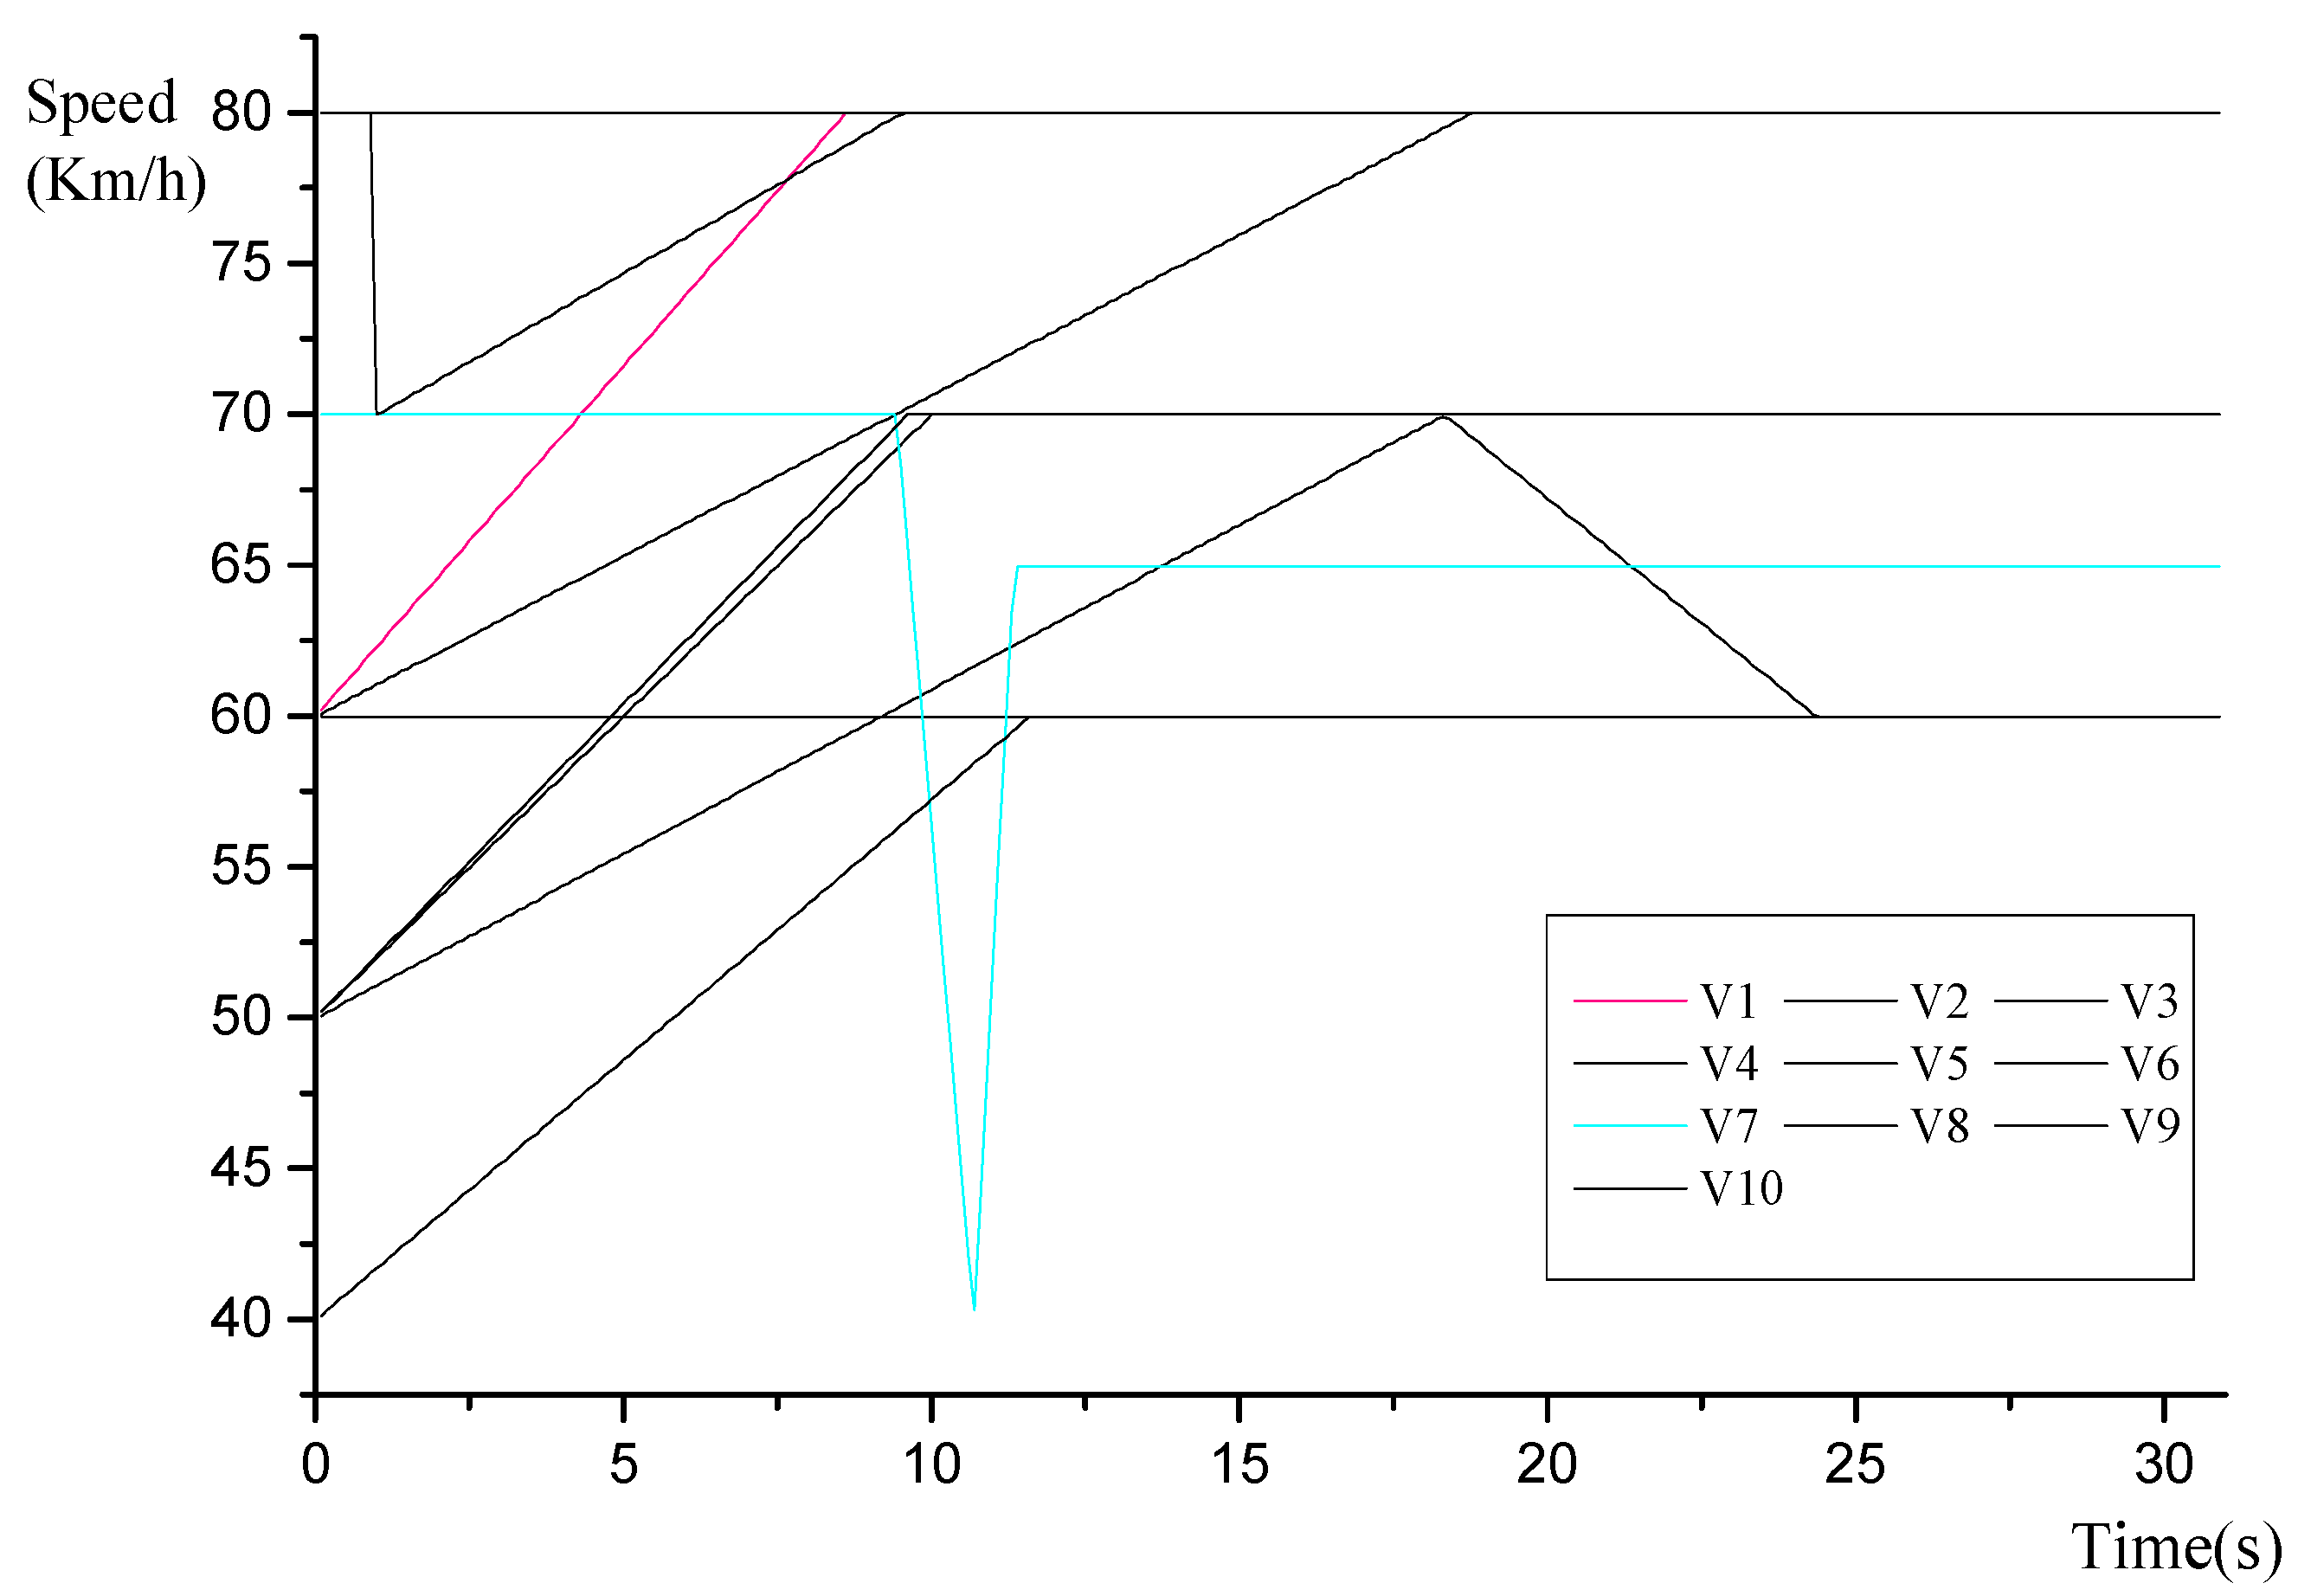
In this experiment, road density was measured with varying numbers of vehicles: 1.79% with 10 vehicles, 2.68% with 15 vehicles, and 3.57% with 20 vehicles. As depicted in
Figure 4, the graph demonstrates the speed and time values for a scenario where Vehicle 1 accelerates and changes lanes ahead of Vehicle 7. Notably, when Vehicle 7 decelerated, it did not significantly impact the speeds of other vehicles. In contrast, Vehicle 1’s actions led to a considerable decrease in Vehicle 7’s speed, specifically a 42.39% reduction. This dynamic is encapsulated in Equation (2), where
Dvehicle signifies the rate of deceleration relative to the initial speed. Additionally, the average rate of deceleration is calculated as per Equation (3), denoted as
DAvehicle. This experiment also observed that vehicles maintaining a constant speed experienced a 7.2% speed reduction when influenced by a leading vehicle’s actions, requiring approximately 3 s to adjust to the new average speed.
The first scenario, the demonstration of the straight road: 10 vehicles, is available at
https://youtu.be/x8Pa4uhaYG4 (
Video S1: accessed on 26 February 2024) with additional multimedia.
Figure 4.
Speed of 10 vehicles on the straight road.
Figure 4.
Speed of 10 vehicles on the straight road.
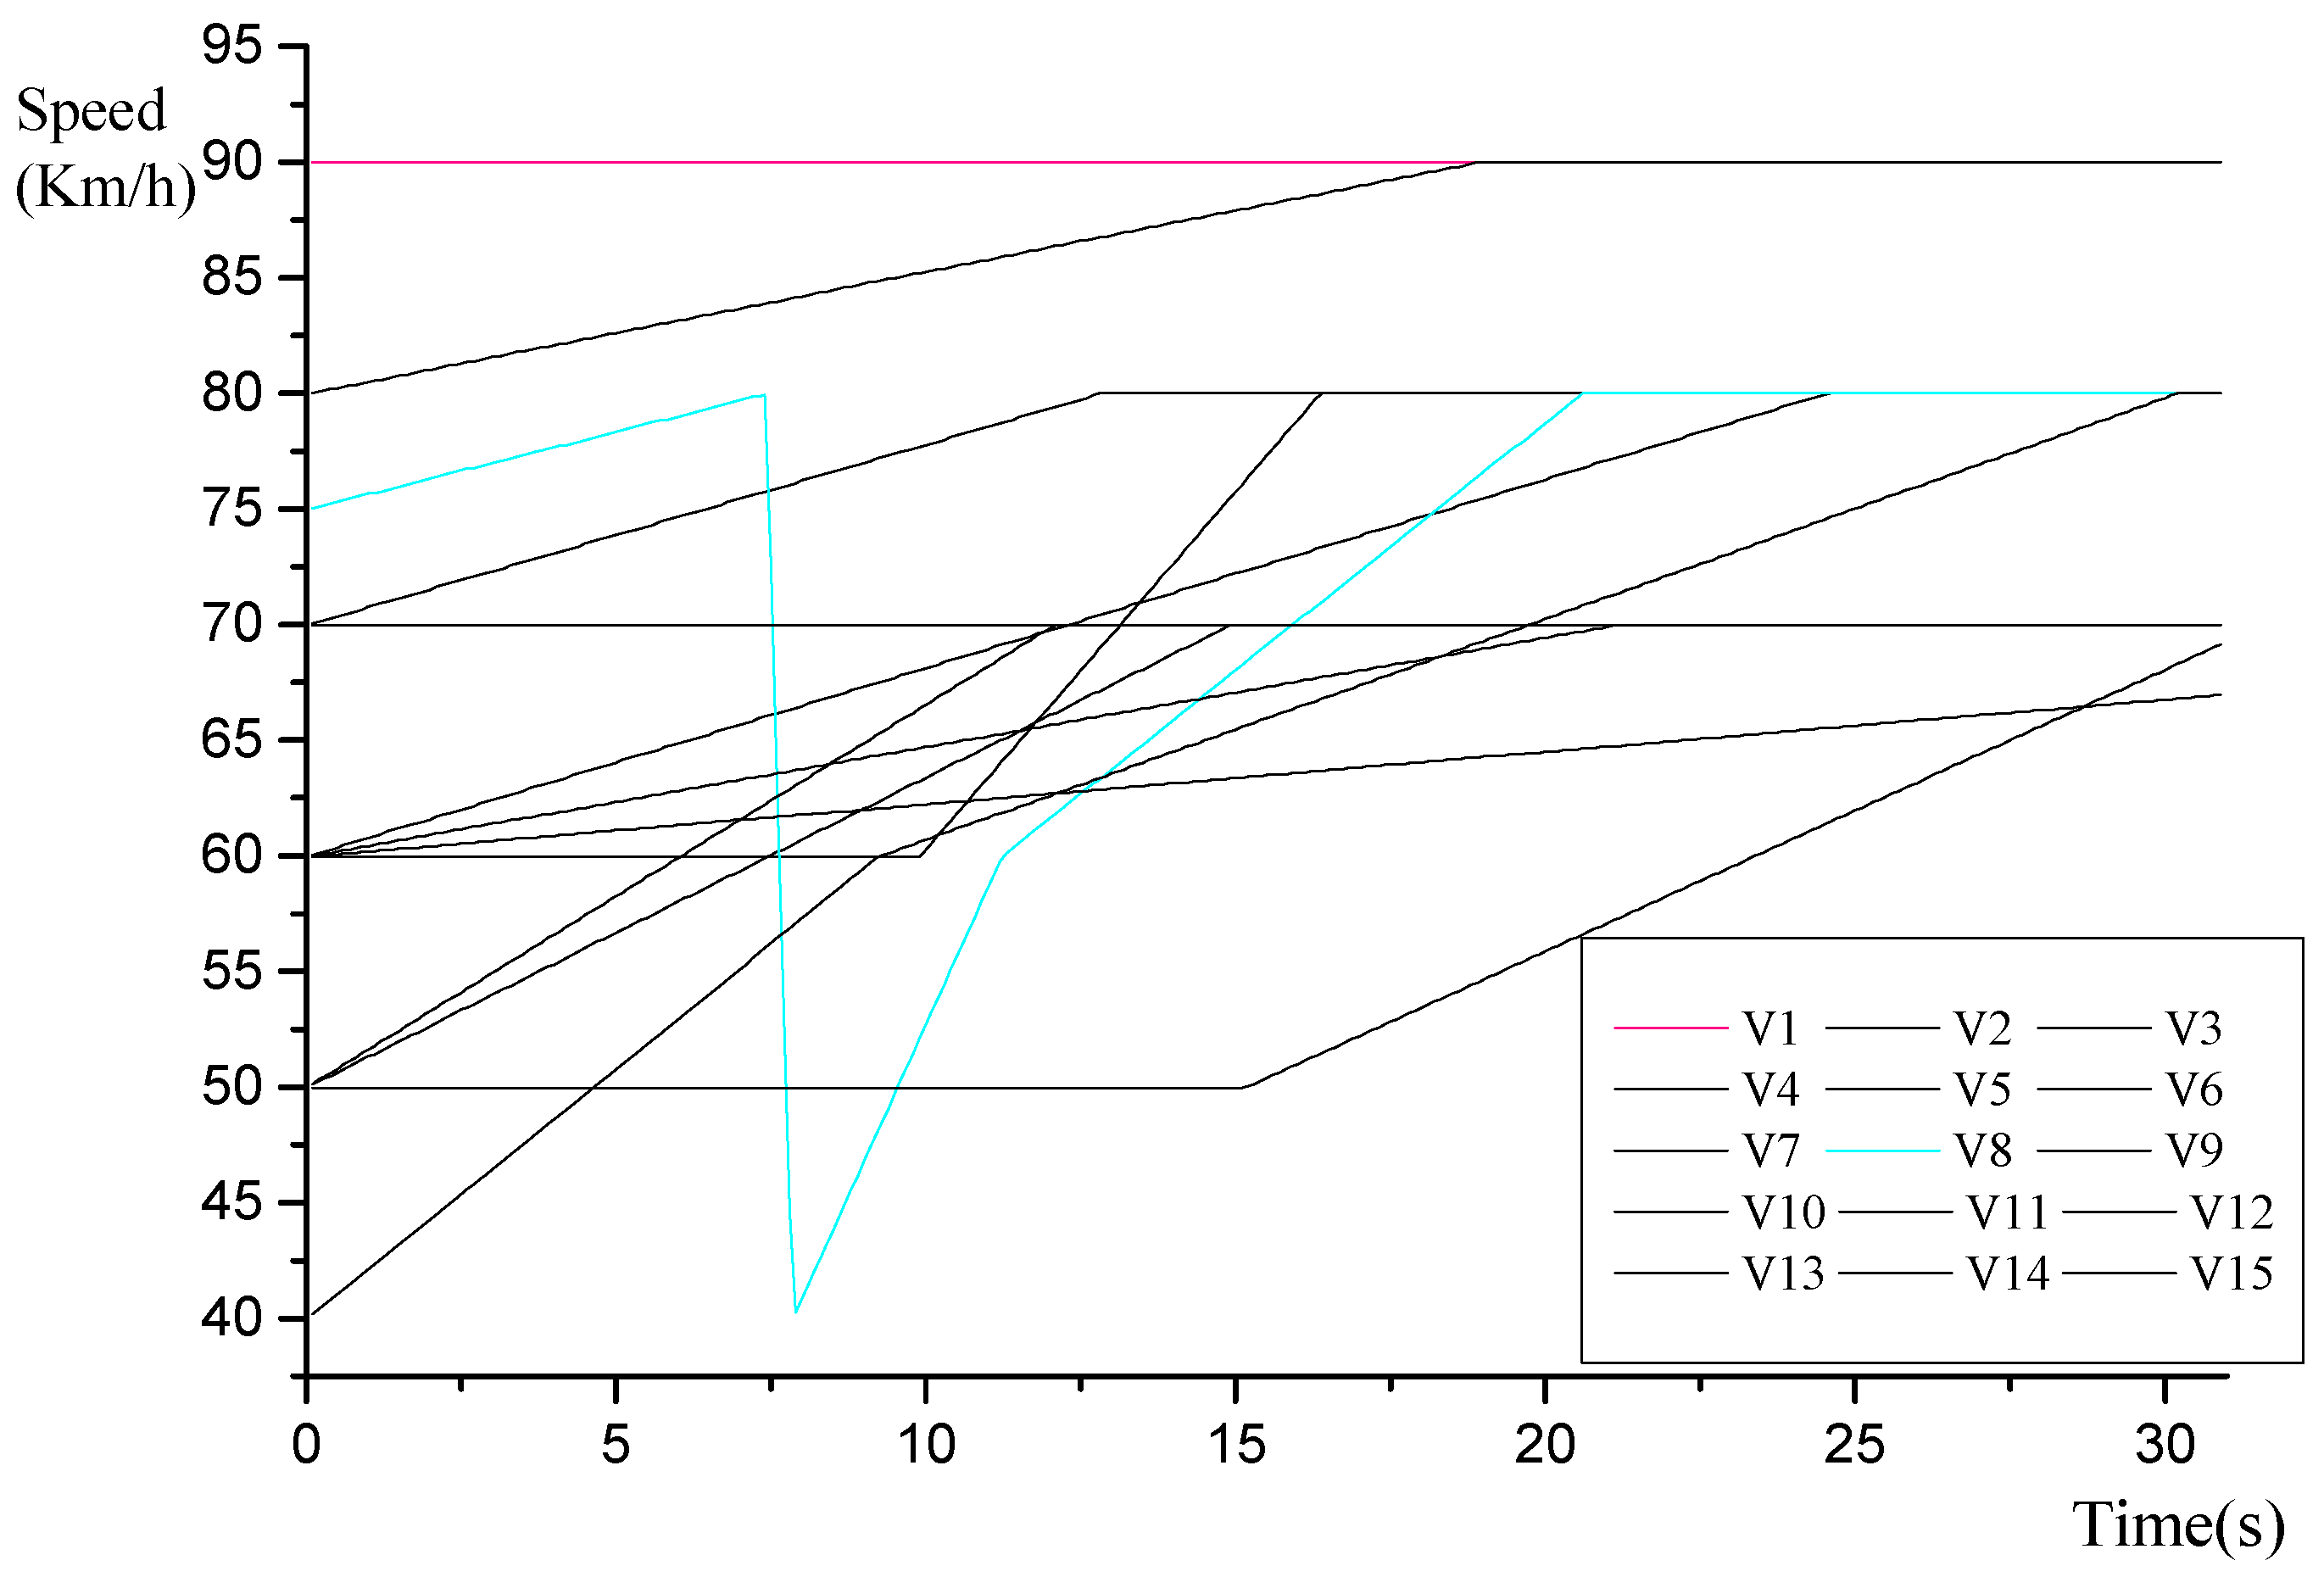
Figure 5 depicts a scenario where Vehicle 1 merges in front of Vehicle 8 at the same speed. According to Equations (2) and (3), the deceleration rate
Dvehicle for Vehicle 8 is calculated as 48.4%, while its average deceleration
DAvehicle is 0% (excluding any increase in speed). The
Vdensity in this scenario is 2.68%, and it is observed that this merging event does not significantly affect the speeds of vehicles other than Vehicle 8. However, in comparison to the situation with ten vehicles, it takes roughly 17 s for Vehicle 8 to return to its original speed after being overtaken.
The second scenario, the demonstration of the straight road: 15 vehicles, is available at
https://youtu.be/UEBA_tXFDn0 (
Video S2: accessed on 26 February 2024) with additional multimedia.
Figure 5.
Speed of 15 vehicles on the straight road.
Figure 5.
Speed of 15 vehicles on the straight road.
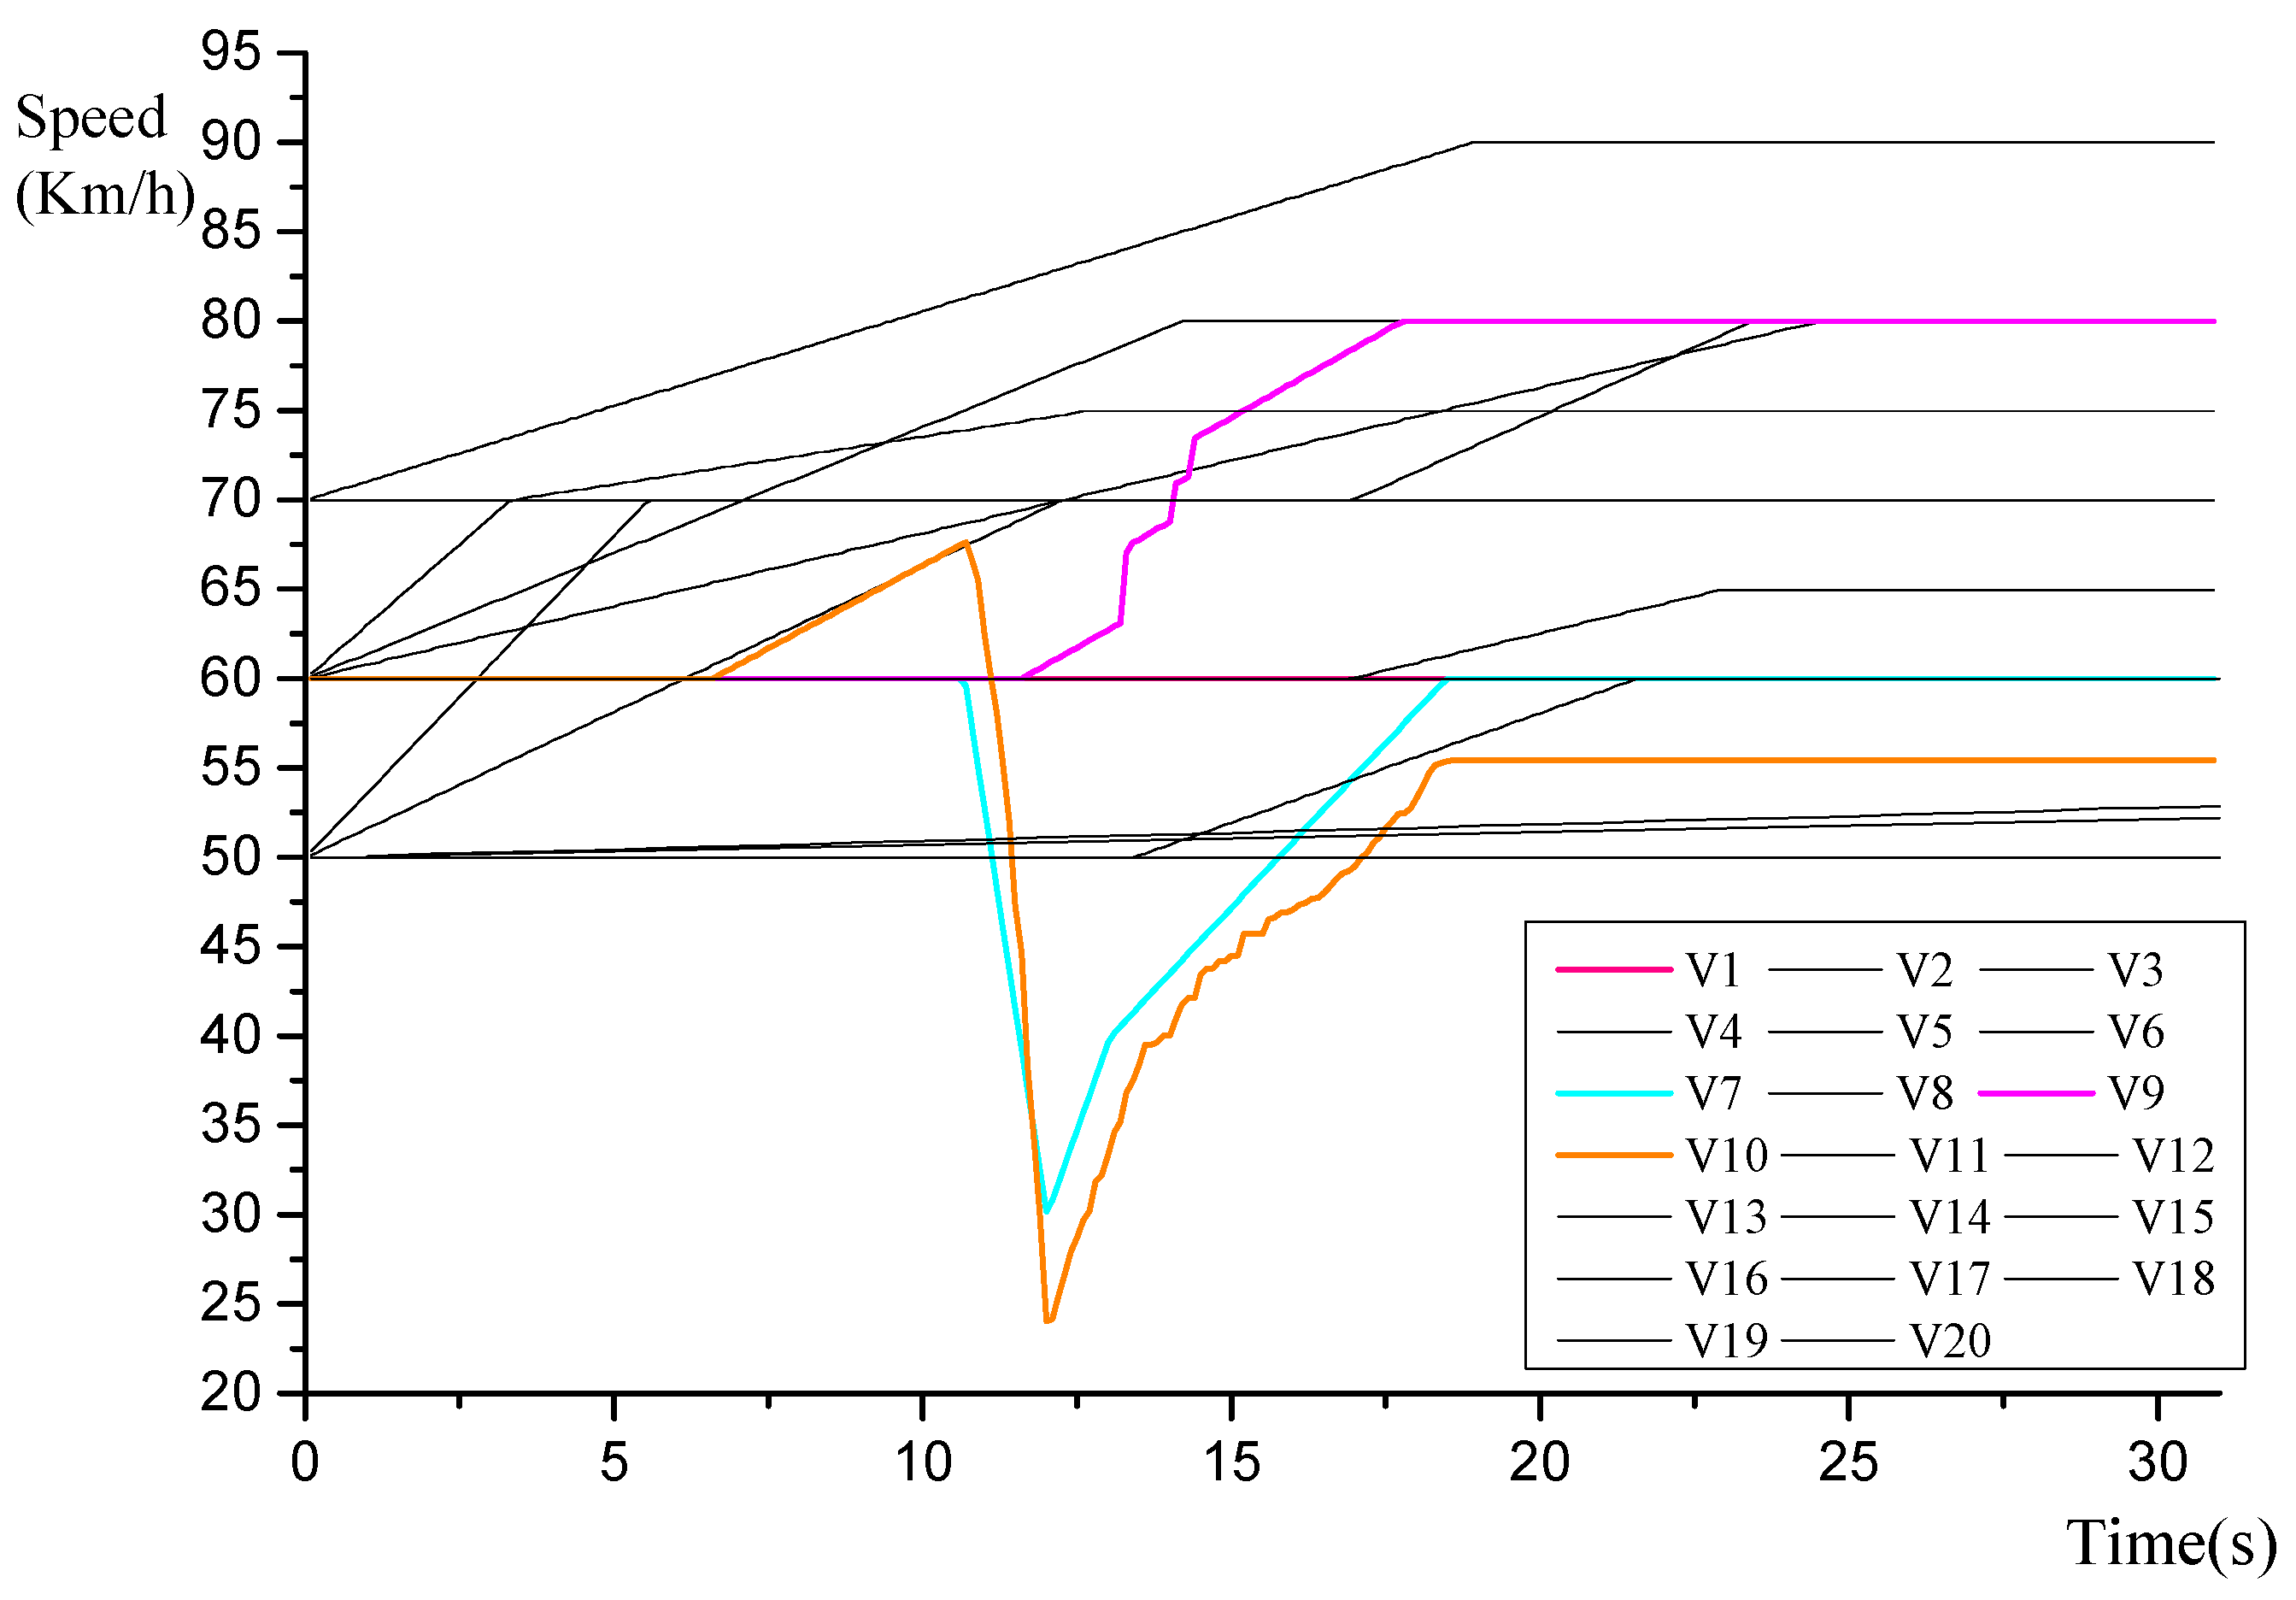
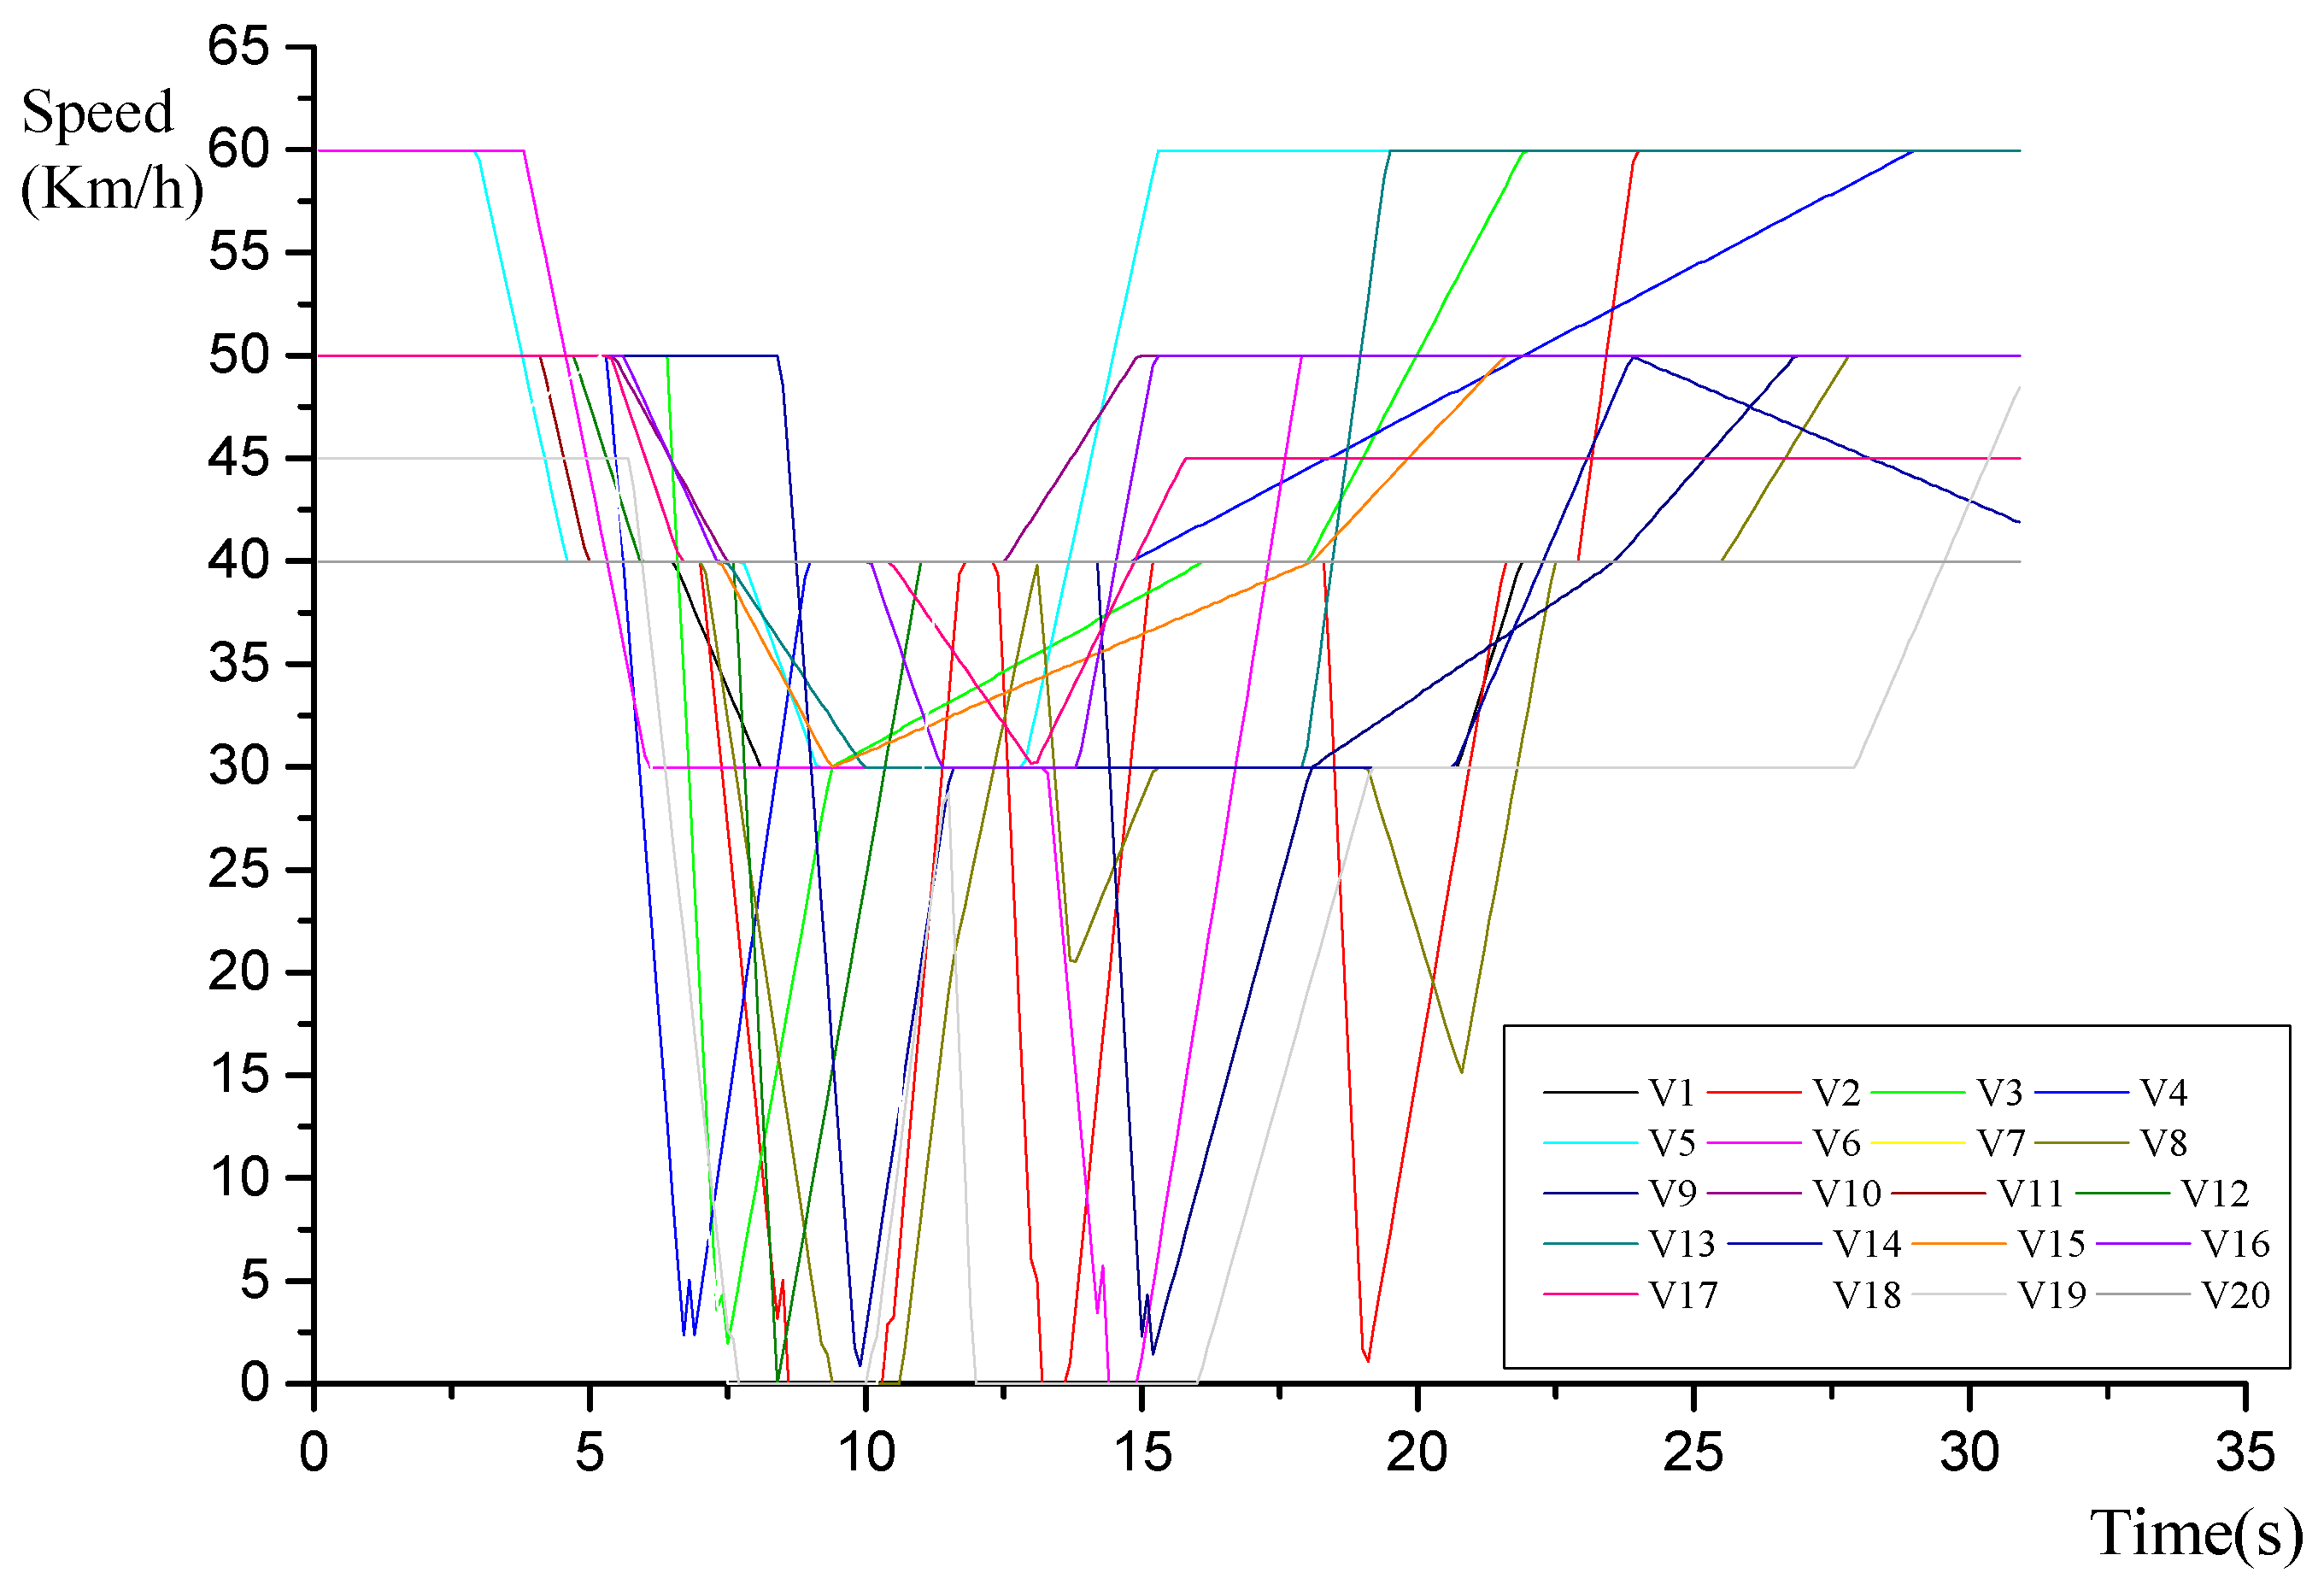
Figure 6 illustrates a scenario where Vehicle 1 merges in front of Vehicle 7. In the case of 20 vehicles, two vehicles stand out: Vehicle 9 and Vehicle 10. Vehicle 9 exhibits an unusual acceleration in the simulation, but this does not affect Vehicles 1 and 7. Vehicle 10, following behind Vehicle 7, is impacted by this maneuver. Both Vehicle 7 and Vehicle 10 demonstrate similar rates of deceleration. It is observed that when the
Vdensity reaches 3.57%, a vehicle influences not only the immediately following vehicle but also at least two subsequent vehicles in the traffic flow.
In this case, the RSU sends a PVD message to Vehicle 1. PVD messages use the message format proposed in
Section 3. Approval is being withheld, as it may cause traffic congestion for Vehicle 1 negotiating the drive. Road balance data of “0000 0000 1111 1111 (Hex: 00FF)” are created.
The third scenario, the demonstration of the straight road: 20 vehicles, is available at
https://youtu.be/2AasRGu54to (
Video S3: accessed on 26 February 2024) with additional multimedia.
Figure 6.
Speed of 20 vehicles on the straight road.
Figure 6.
Speed of 20 vehicles on the straight road.
4.2. Traffic Circle Road
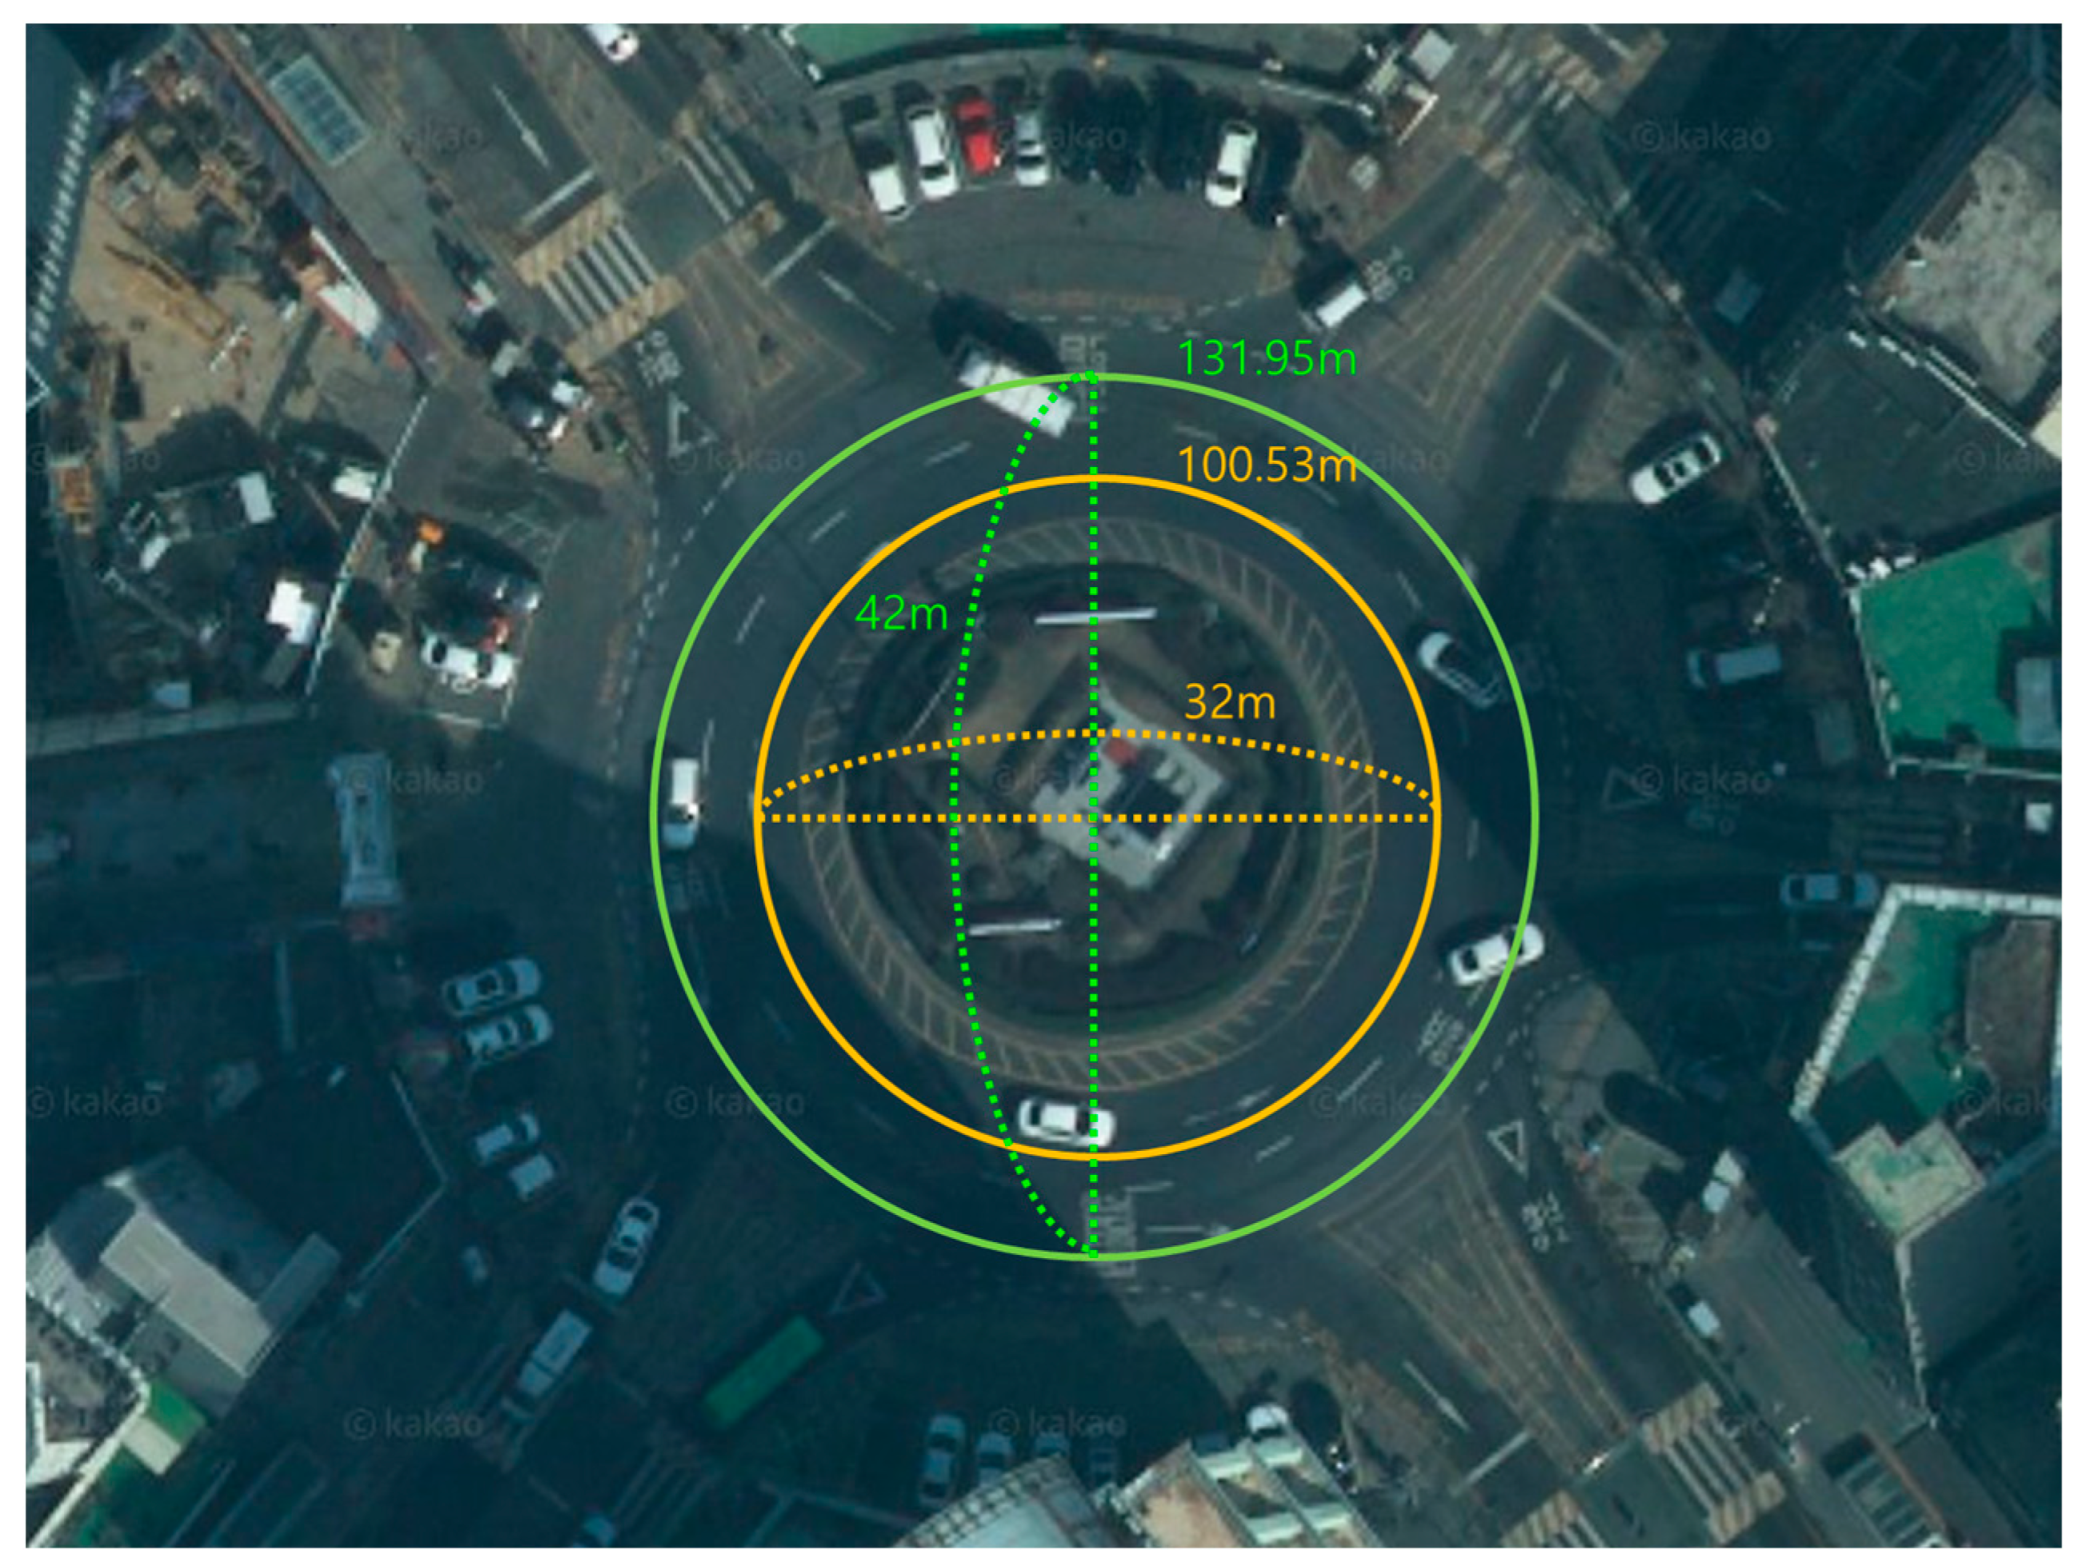
Figure 7 shows the traffic circle road. Since it is circular, the length of the road can be determined by the circumference of the circle, which is calculated as 2πr. This road has two lanes; the outer lane has a length of 131.95 m, and the inner lane is 100.53 m. The calculation of road density on this traffic circle road, as shown in
Figure 7, is distinct from that of a straight road, as discussed in
Section 4.1. Rather than considering the total number of vehicles in the experiment (10, 15, and 20 vehicles), it specifically focuses on the vehicles present within the circle.
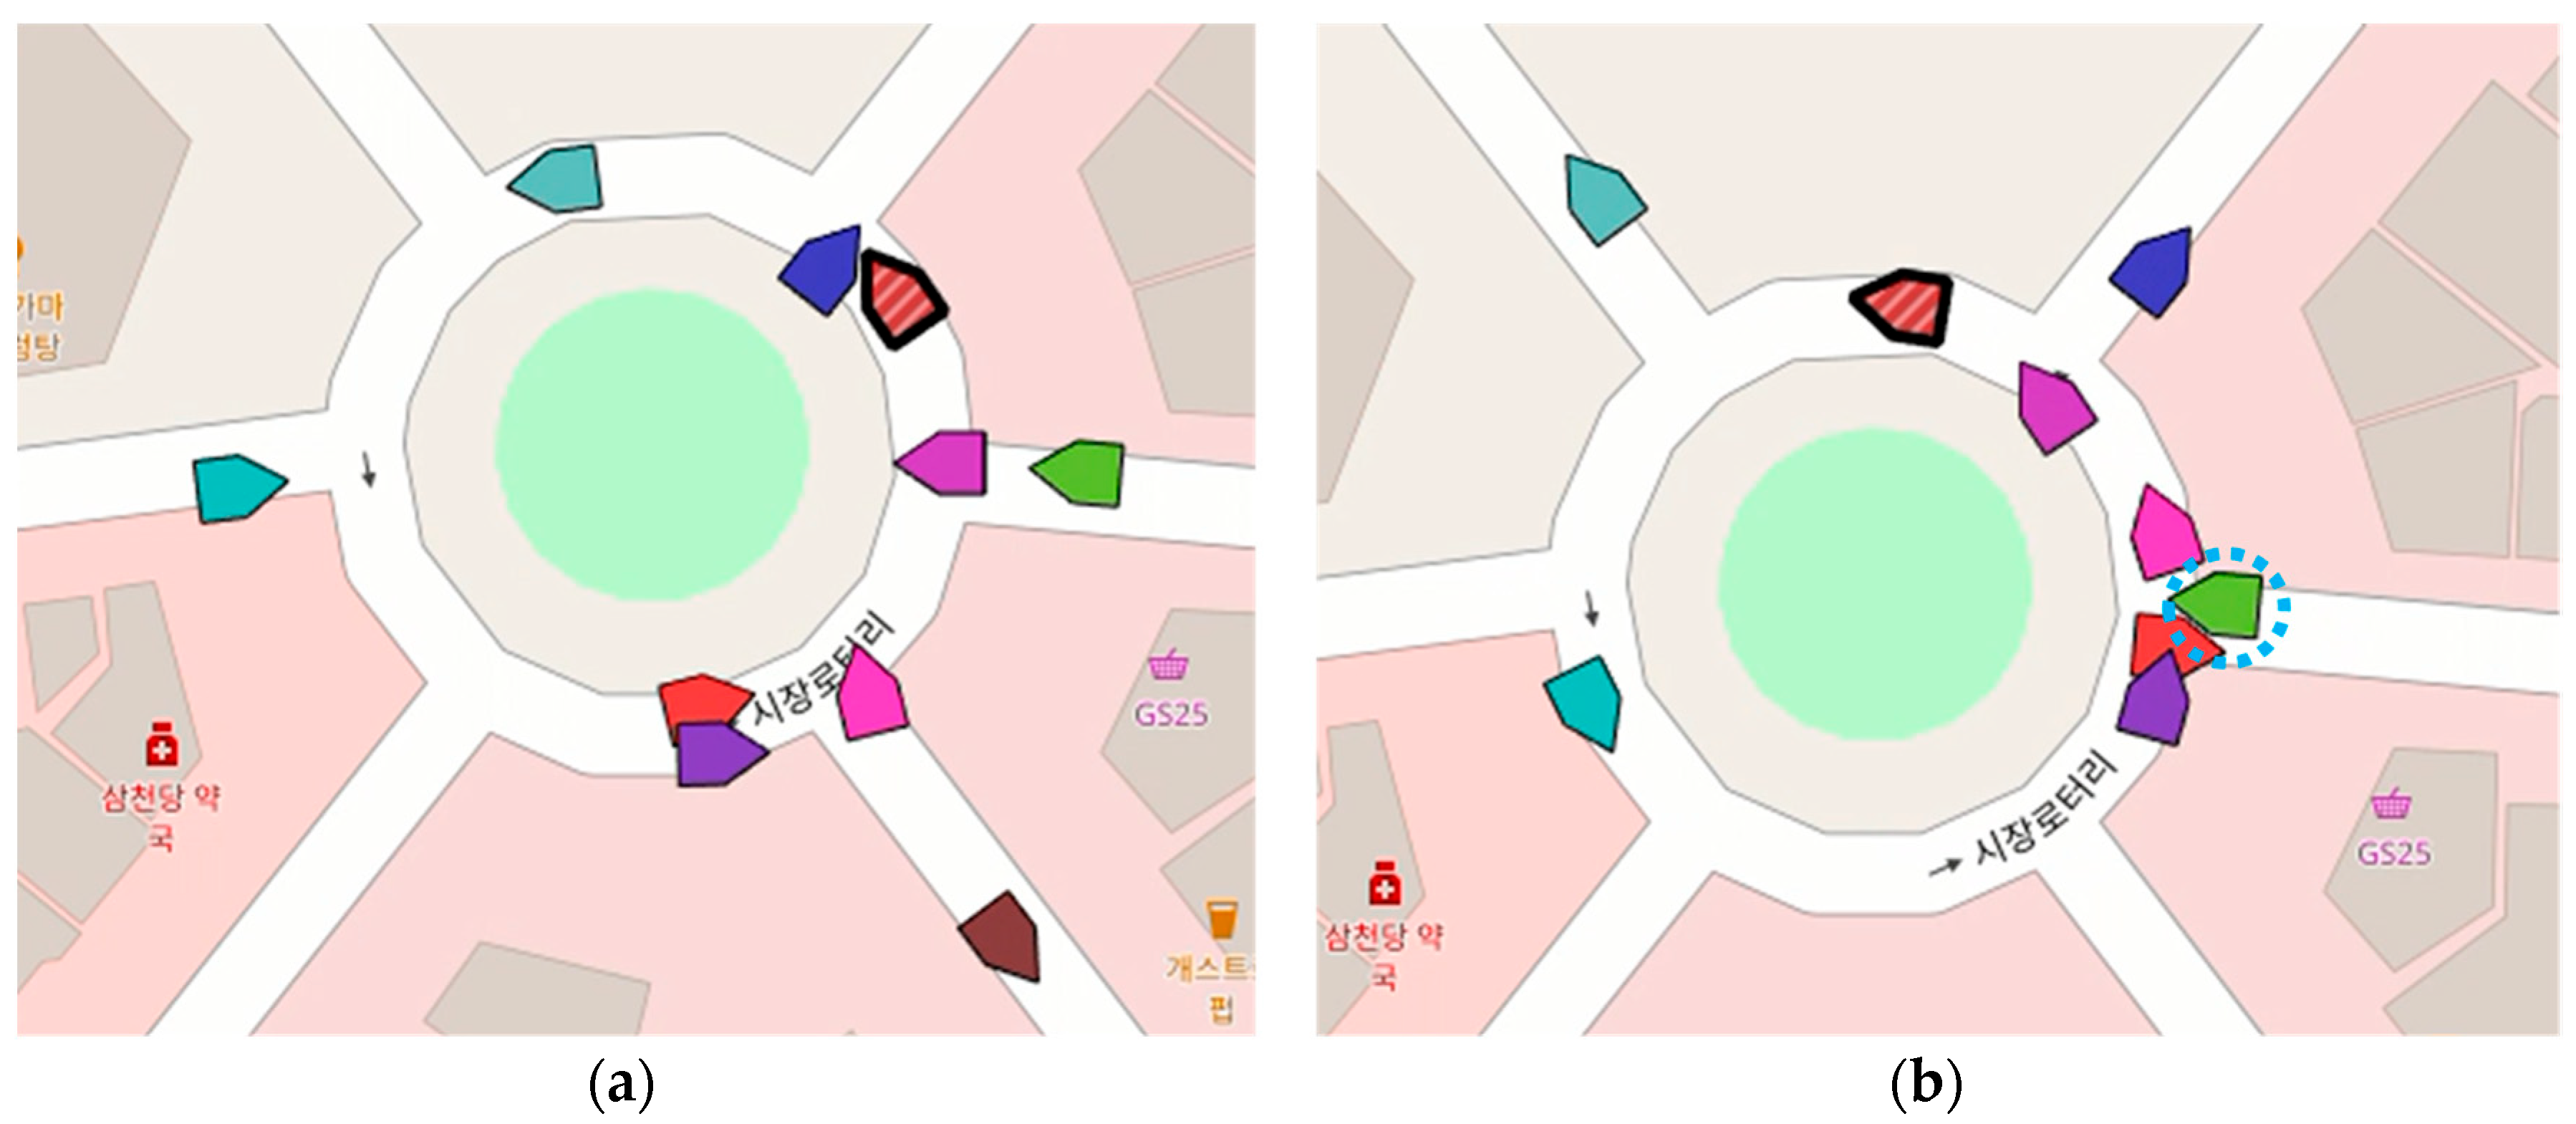
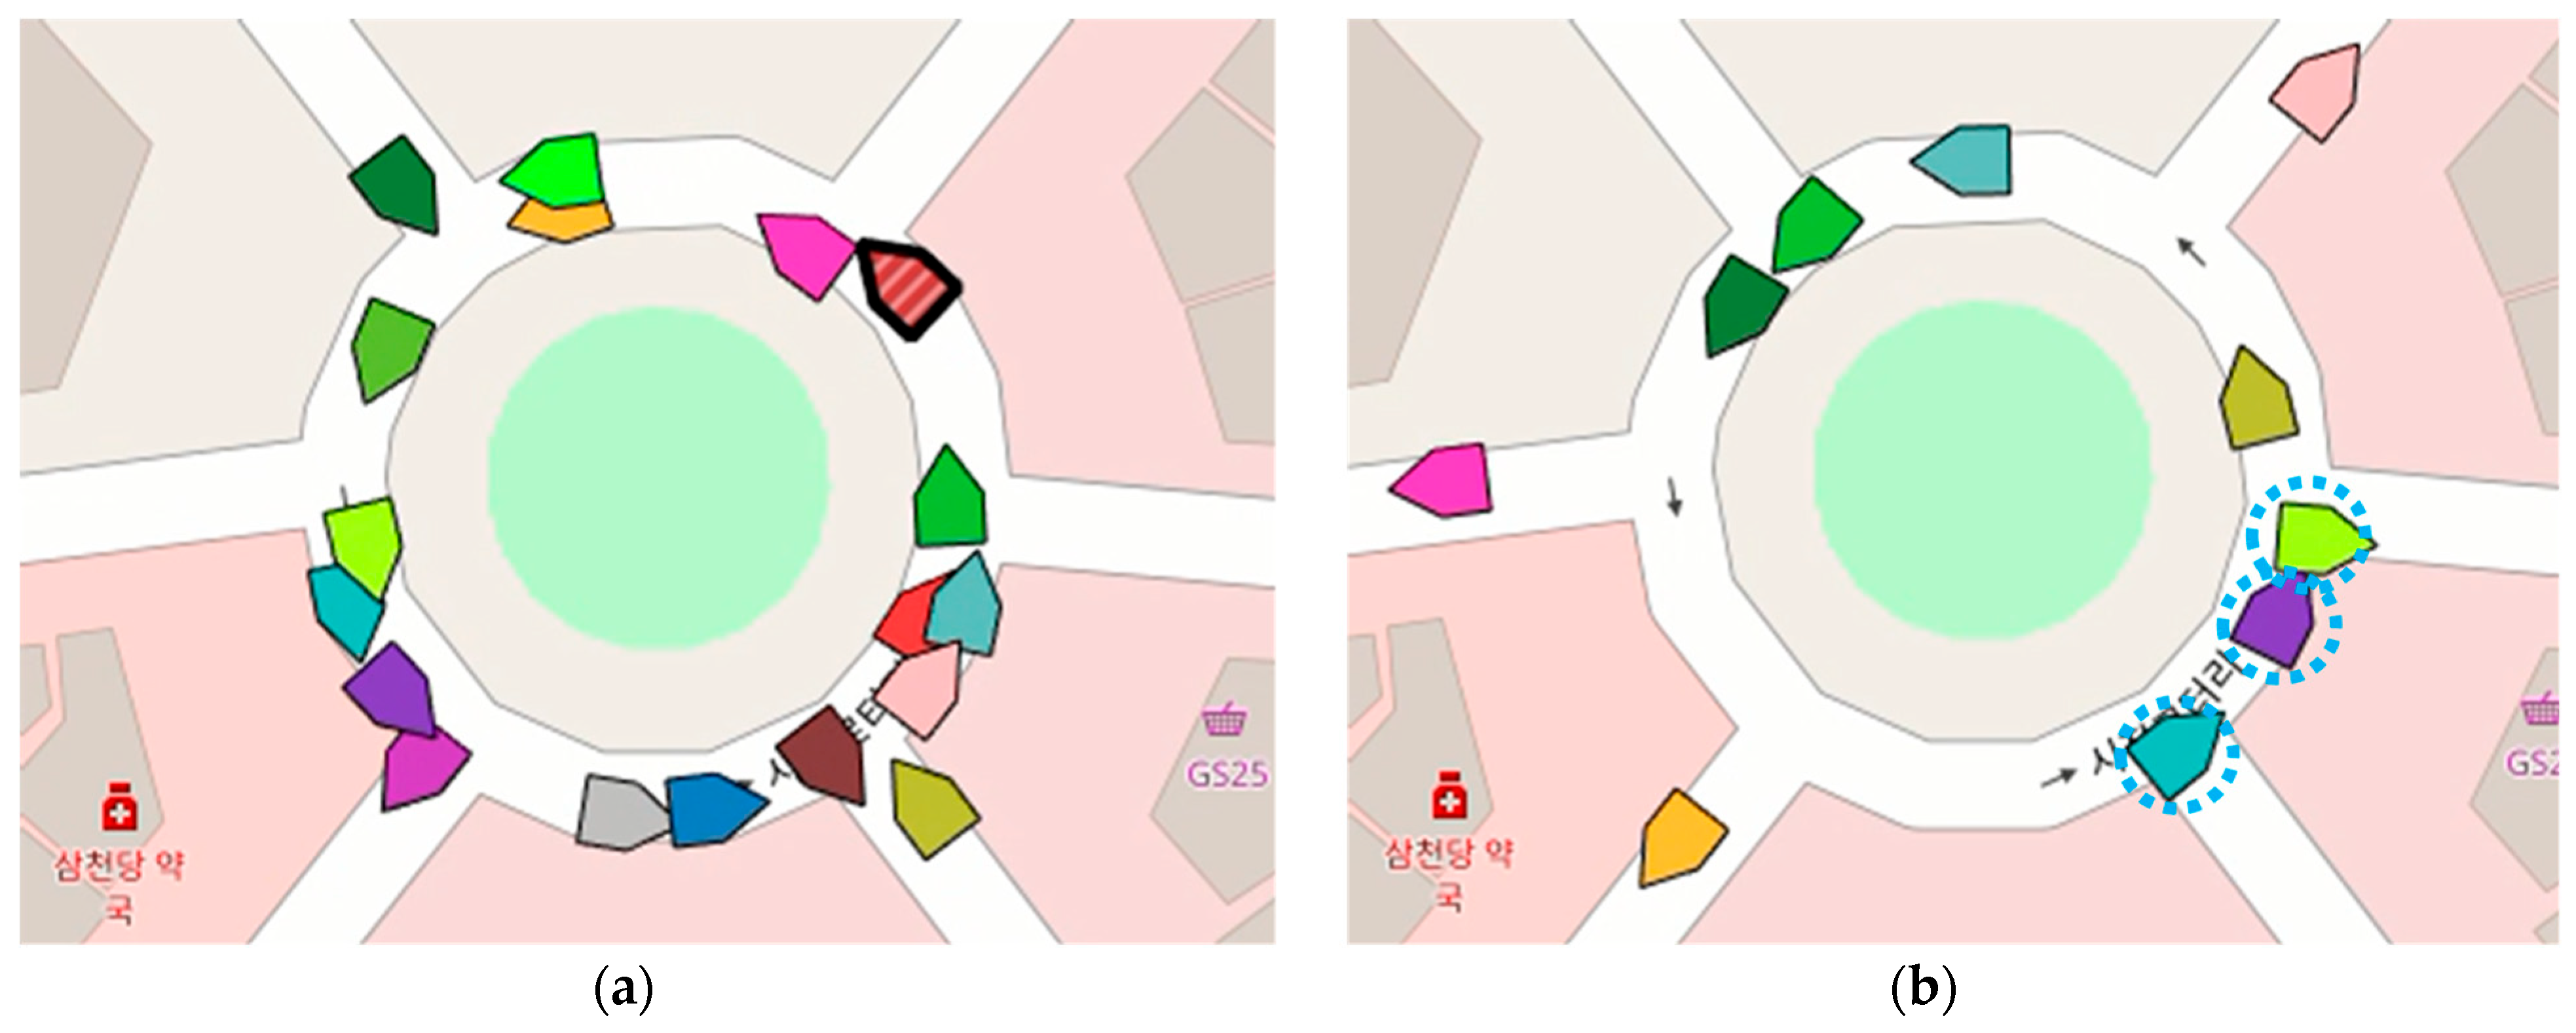
The maximum vehicle density on the traffic circle road, as shown in
Figure 9a, is seven vehicles. Like Equation (1), the denominator for the calculation is the sum of the lengths of the two circular roads. Therefore, the
Vdensity is calculated to be 15.06%.
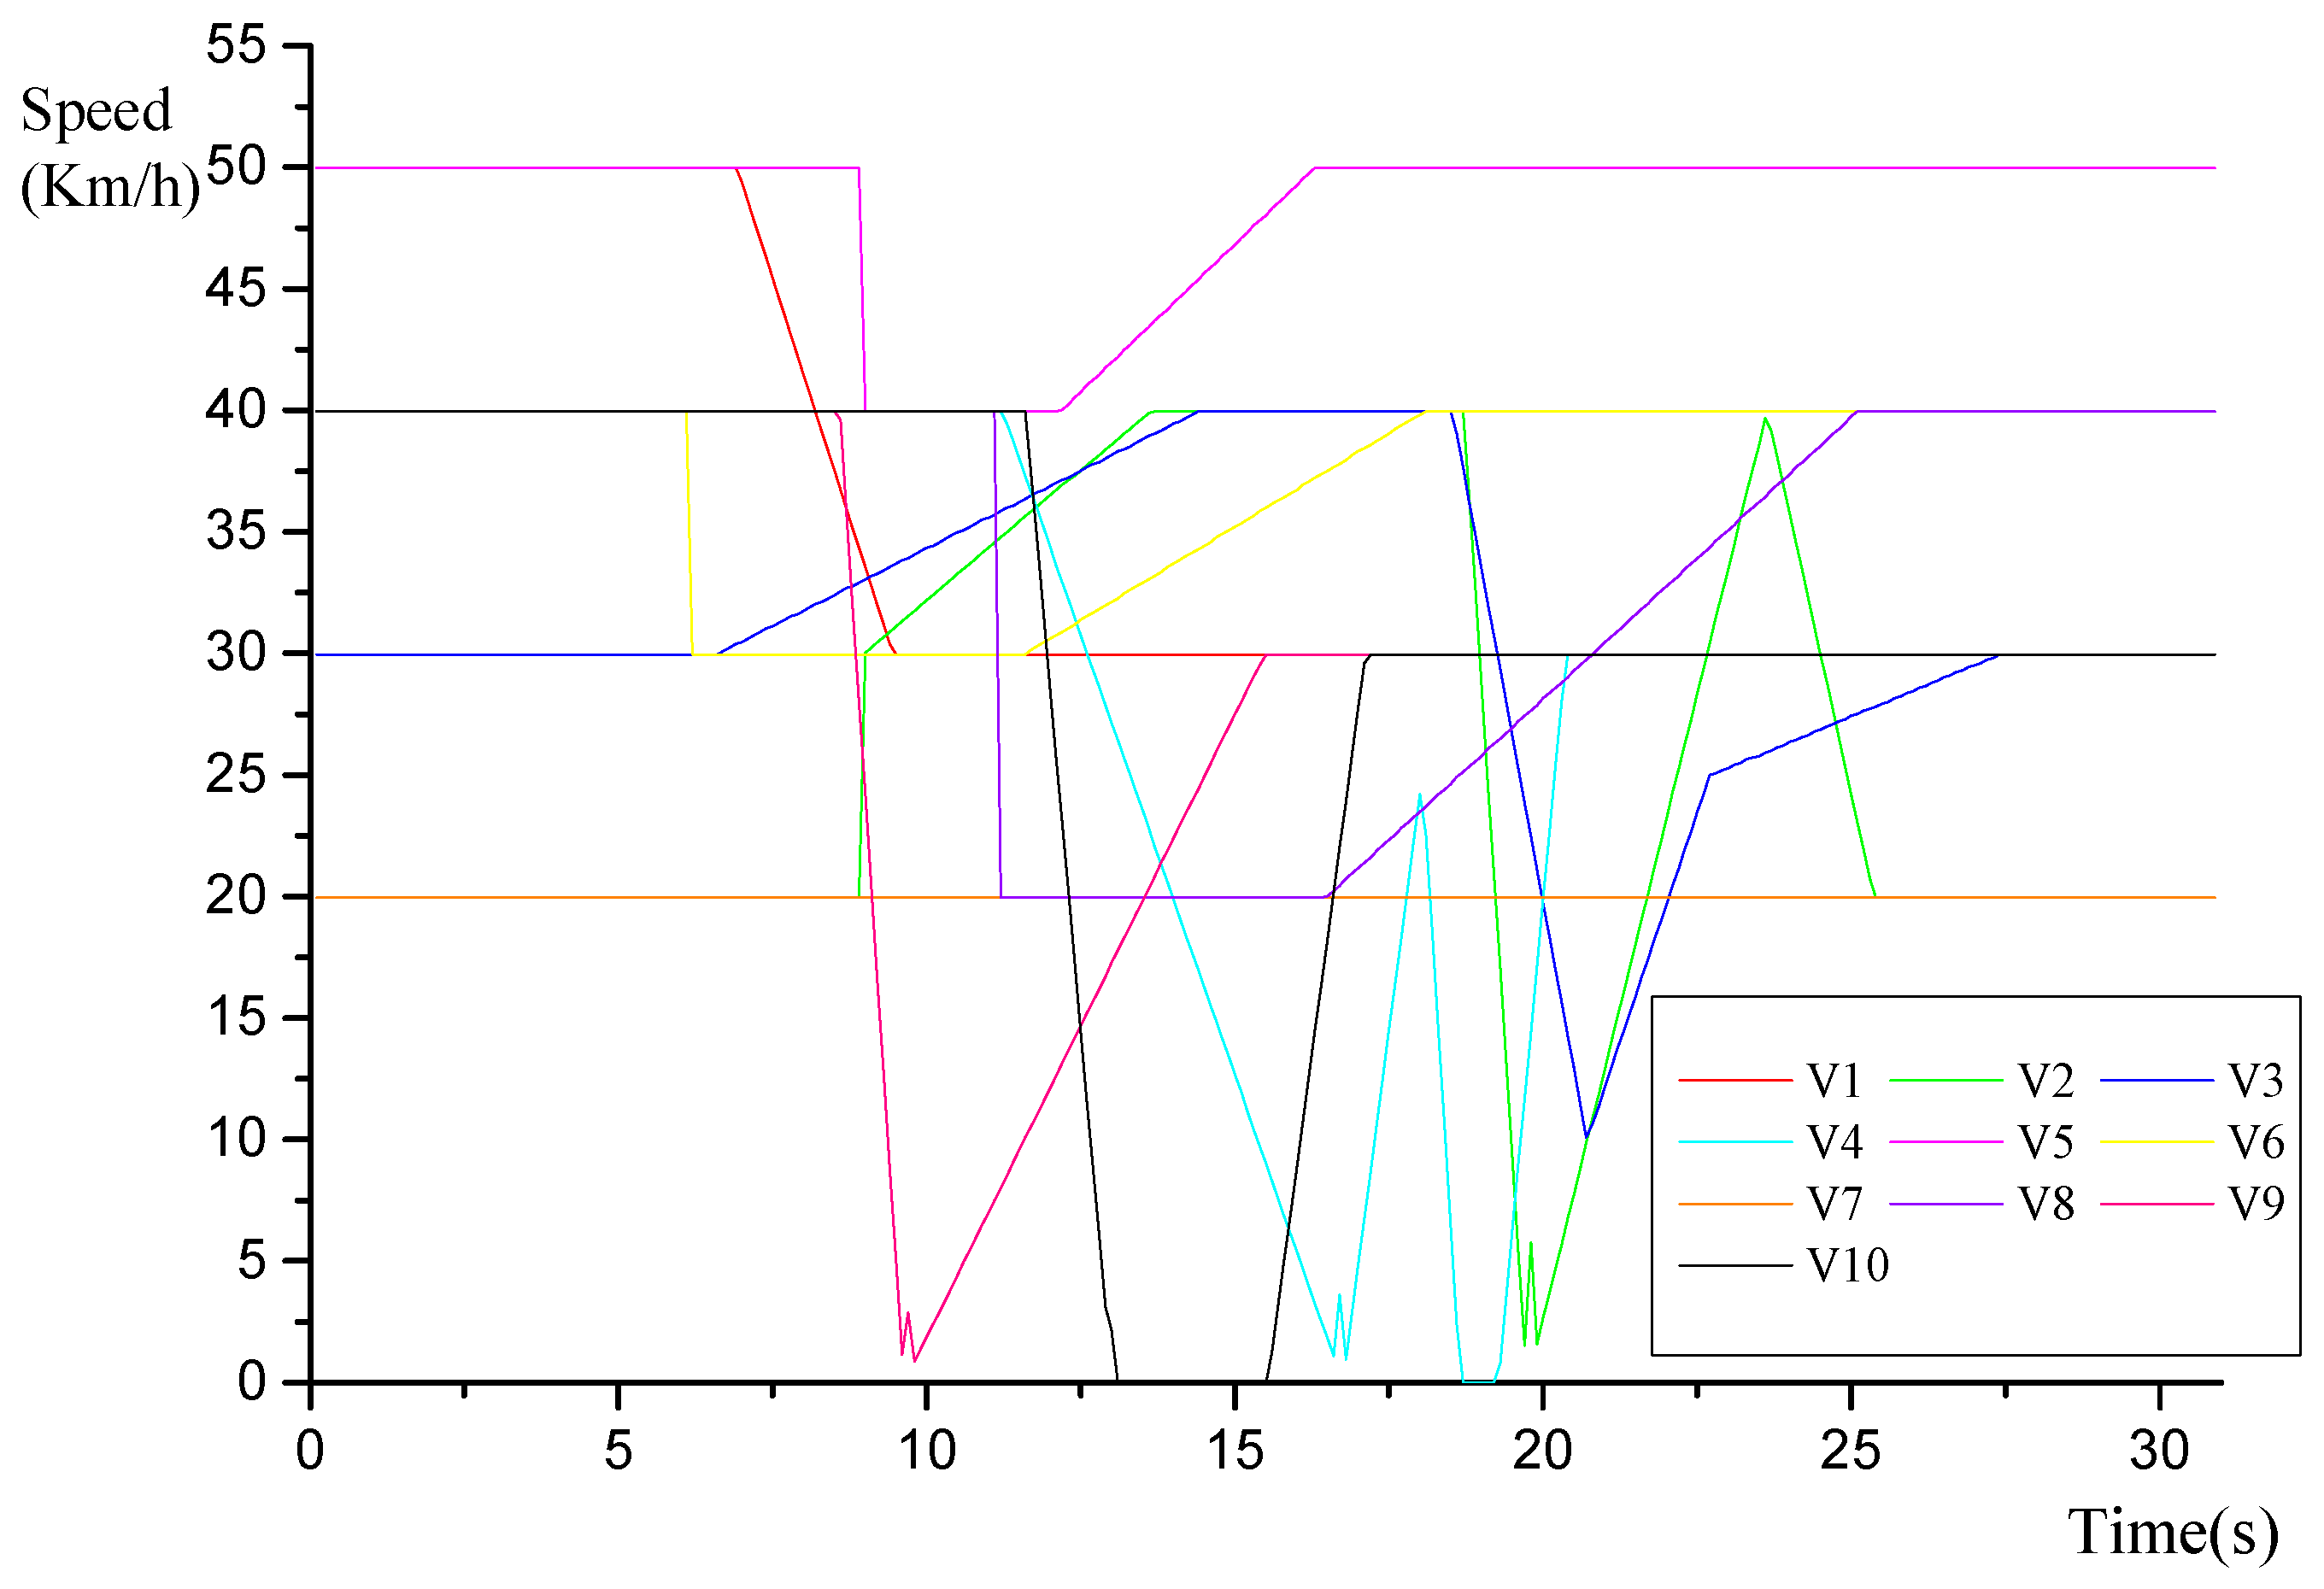
In a simulation environment, just like in the real world, vehicles tend to drive freely unless specific rules are defined. As seen in
Figure 8, among the vehicles driving on the traffic circle road, Vehicle 10 is observed to wait for an extended period. While the typical stop time when entering this road is less than two seconds, Vehicle 10 stops for about five seconds. Upon investigation, it is revealed that Vehicle 10, shown as the purple vehicle in
Figure 9b, is waiting because a green vehicle cuts in front of it. Although the purple vehicle is the last and thus does not cause a blockage, such behavior could lead to traffic congestion.
The fourth scenario, the demonstration of the traffic circle road: 10 vehicles, is available at
https://youtu.be/RWDm2W8q9Rw (
Video S4: accessed on 26 February 2024) with additional multimedia.
Figure 8.
Speed of 10 vehicles on the traffic circle road.
Figure 8.
Speed of 10 vehicles on the traffic circle road.
Figure 9.
Ten vehicles on the traffic circle road. (a) Maximum vehicles on the road; (b) non-yielding vehicles on the road.
Figure 9.
Ten vehicles on the traffic circle road. (a) Maximum vehicles on the road; (b) non-yielding vehicles on the road.
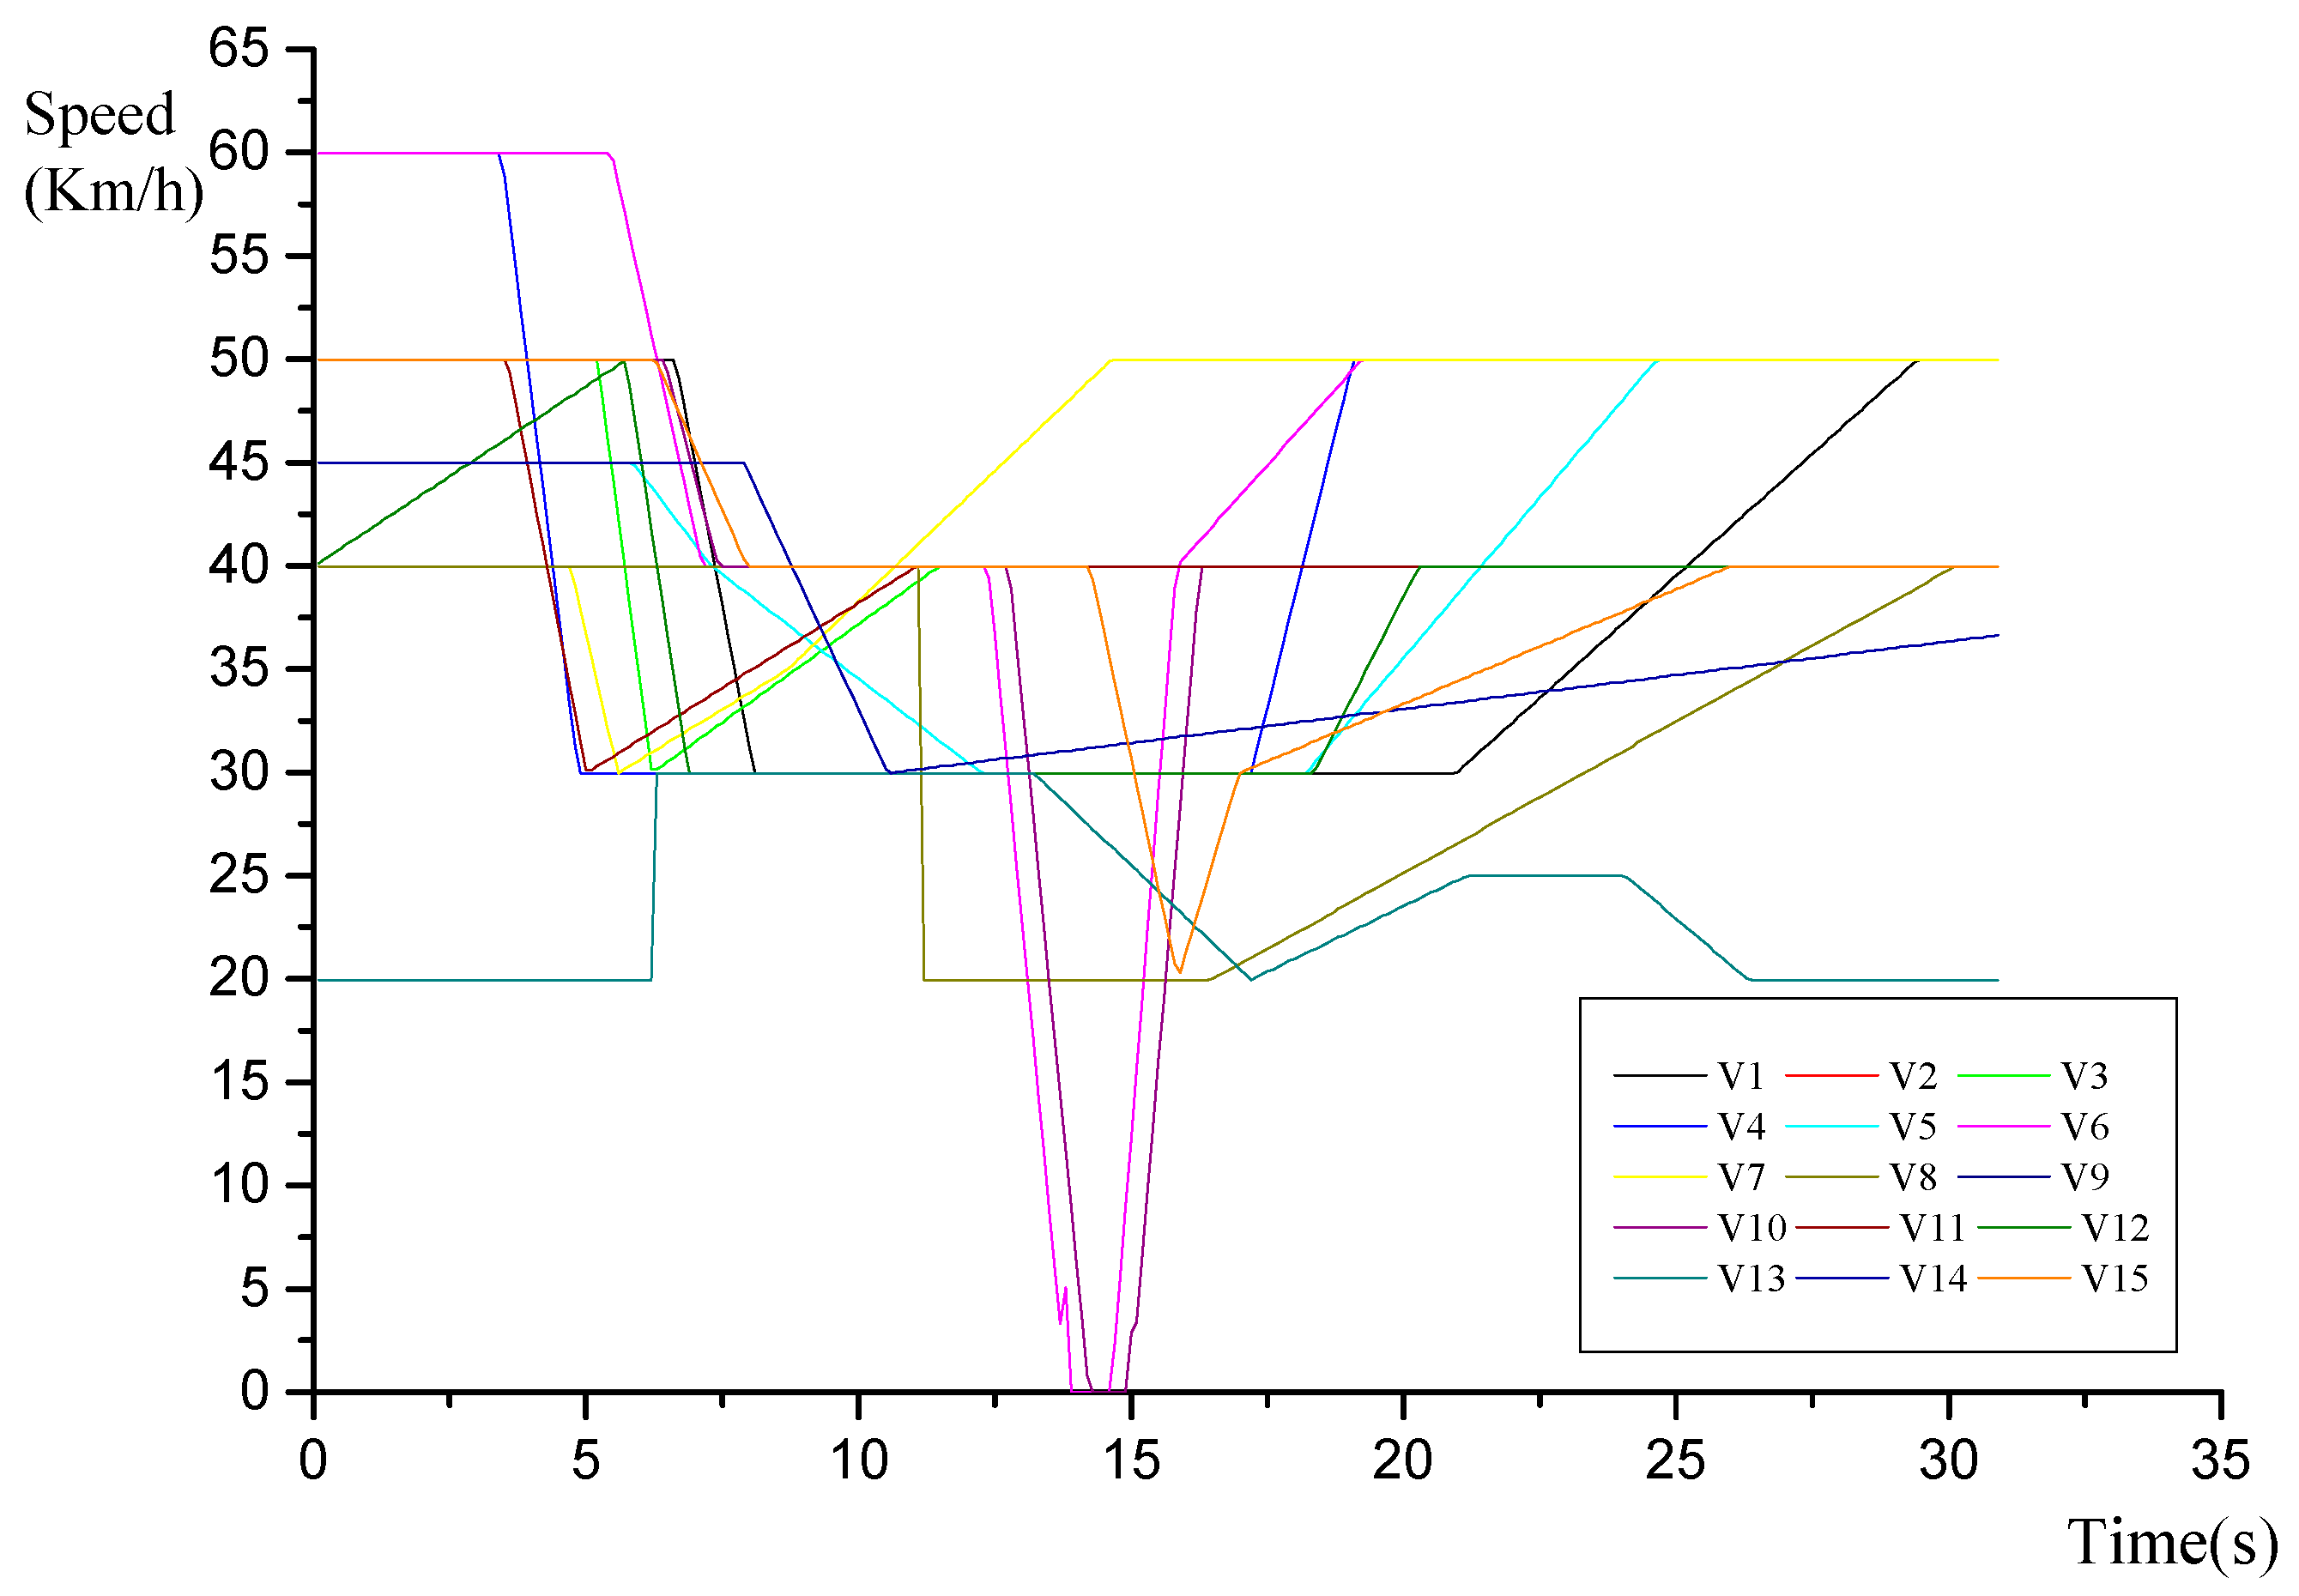
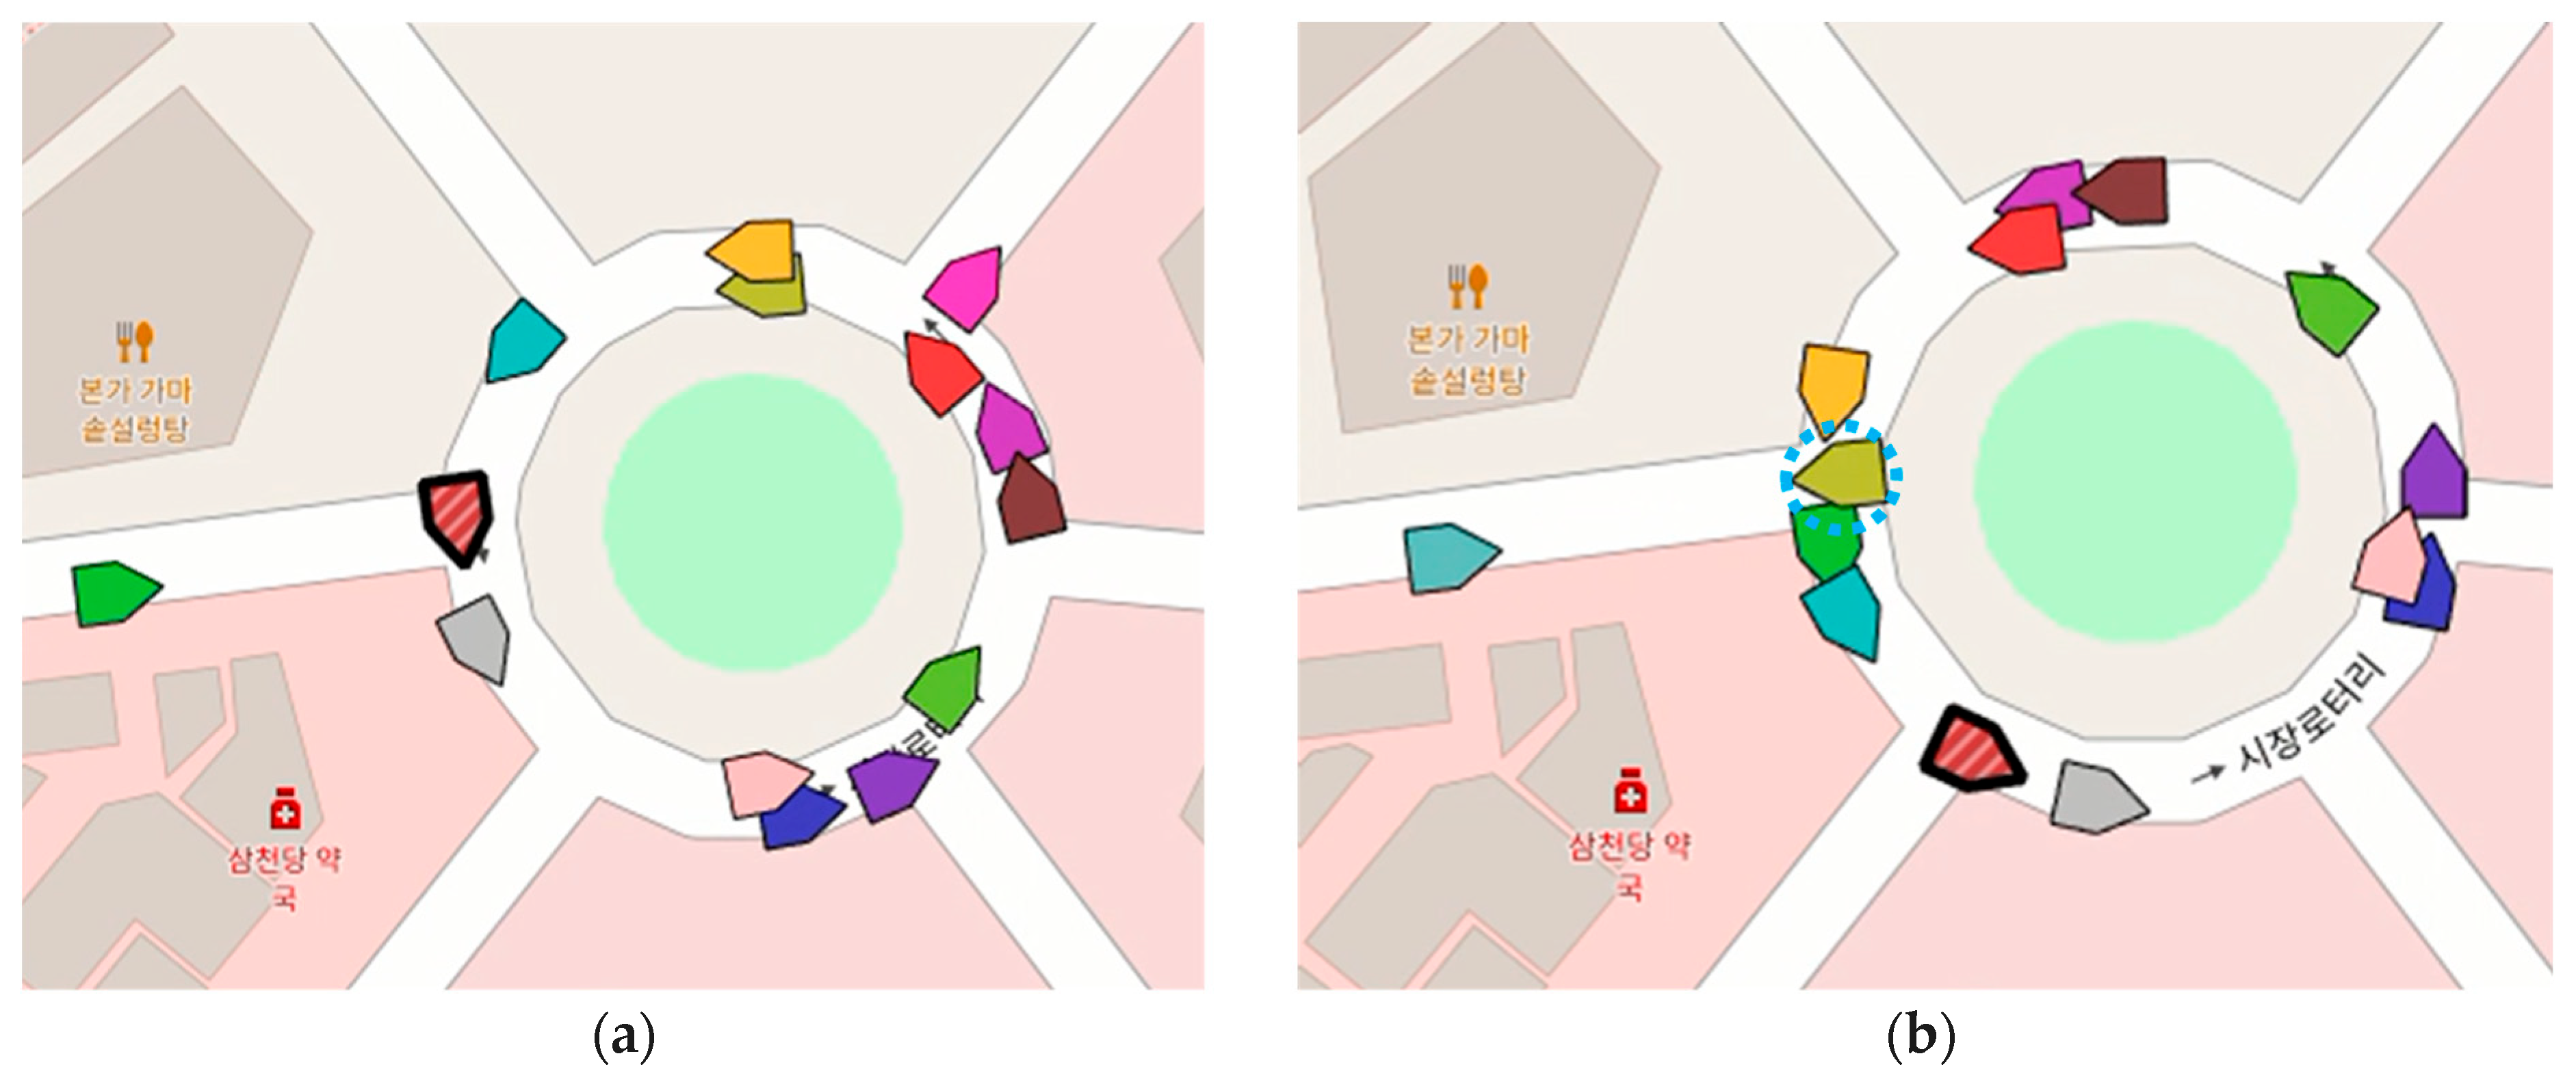
As shown in
Figure 11a, the
Vdensity is calculated to be 27.96%. In
Figure 10, it is observed that both Vehicles 10 and 11 stop for approximately three seconds. Upon closer examination, there are two cases to consider, but a different scenario from the first experiment emerges. In
Figure 11b, an olive-colored vehicle is seen changing lanes and exiting, during which a yellow vehicle comes to a stop.
The fifth scenario, the demonstration of the traffic circle road: 15 vehicles, is available at
https://youtu.be/U2ny-uFJDnw (
Video S5: accessed on 26 February 2024) with additional multimedia.
Figure 10.
Speed of 15 vehicles on the traffic circle road.
Figure 10.
Speed of 15 vehicles on the traffic circle road.
Figure 11.
Fifteen vehicles on the traffic circle road. (a) Maximum vehicles on the road; (b)lane-changing vehicle on the road.
Figure 11.
Fifteen vehicles on the traffic circle road. (a) Maximum vehicles on the road; (b)lane-changing vehicle on the road.
In
Figure 13a, the
Vdensity is calculated at 34.41%. As shown in
Figure 12, it is evident that during rush hour, a significant number of vehicles contribute to traffic congestion. Similar to the straight road experiment, as the number of vehicles increases, the
Vdensity exceeding 3.57% may lead to lane-changing maneuvers that potentially disrupt other vehicles.
The sixth scenario, the demonstration of the traffic circle road: 20 vehicles, is available at
https://youtu.be/pjdBUt2MUPk (
Video S6: accessed on 26 February 2024) with additional multimedia.
Traffic circle roads are not primarily designed for areas with heavy traffic. However, in situations where their use is unavoidable in high-traffic environments, it becomes necessary to manage access effectively. PVD message, as introduced in
Section 3, plays a crucial role in this context. It enables controlled vehicle entry into the traffic circle road by monitoring the volume of traffic within. PVD message facilitates this by providing queue information to the vehicles, indicating when it is appropriate to enter. Due to the rapid exchange of PVD messages, vehicles can promptly receive updates on queue changes and acknowledgments for entry. For instance, a high vehicle count on the traffic circle triggers the creation of a road balance message “0010 0011 1101 1100 (HEX: 23DC)”, signaling restricted entry. As traffic decreases, the queue shortens, eventually allowing new entries, denoted by a queue message of ‘0000’. Consequently, a road balance message “0101 0000 1010 1111 (HEX: 50AF)” indicates that a vehicle is cleared to accelerate and enter the traffic circle.
Figure 12.
Speed of 20 vehicles on the traffic circle road.
Figure 12.
Speed of 20 vehicles on the traffic circle road.
Figure 13.
Twenty vehicles on the traffic circle road. (a) Maximum vehicle on the road; (b) lane-changing vehicle on the road.
Figure 13.
Twenty vehicles on the traffic circle road. (a) Maximum vehicle on the road; (b) lane-changing vehicle on the road.
5. Future Works
We recognize that applying RSU-based traffic control to manage vehicle flow according to origin, destination, and entry and exit times presents challenges, especially in a landscape not dominated by autonomous vehicles. Therefore, while the integration of OBU or OBD devices in legacy vehicles would enhance safety, we acknowledge the legal and practical barriers to mandating such measures.
In response to these challenges, we are planning to develop a low-power notification system for legacy vehicles that utilizes RSU-integrated cameras. This future system aims to generate BSM-like information and deliver essential notifications, offering a potential alternative to direct PVD messages.
Looking ahead, our initiatives will focus on leveraging AI-driven techniques to identify and mitigate unusual driving behaviors, thereby enhancing road safety for all. By doing so, we aim to address the diverse needs of the current vehicular landscape, ensuring our solutions are both effective and inclusive.
In terms of security, we are exploring multiple avenues. Firstly, we are investigating cryptographic communication among the RSUs and vehicles based on IEEE 1609.2 standards, recognizing the necessity for encrypted exchanges. Secondly, we are addressing potential vulnerabilities, such as jamming, by researching enhancements to RSU firewalls and communication systems. Lastly, we are in the process of designing an advanced control system capable of monitoring integrated security measures and maintaining system integrity and availability.
6. Conclusions
By integrating roadside units (RSUs) with innovative communication protocols such as basic safety messages (BSMs) and probe vehicle data (PVD), we have laid the groundwork for a transformative approach to enhance traffic flow and safety. The cornerstone of our findings lies in the detailed experiments conducted on both straight and traffic circle roads, which not only validated the efficacy of RSUs in mitigating traffic density but also showcased their potential to alleviate congestion through strategic vehicular communication.
The introduction of the road balance message within the PVD framework marks a significant advancement in our quest to streamline traffic management. This novel message set, designed to negotiate vehicular movement and ensure cooperative driving, has demonstrated its utility in effectively managing vehicle entry and movement within traffic-heavy environments. Through our experiments, we observed that when vehicle density reaches critical thresholds—3.57% on straight roads and 34.41% on traffic circle roads—the proactive intervention of RSUs becomes imperative to prevent congestion and ensure smooth traffic flow.
This research underscores the imperative need for a symbiotic relationship between technology and traffic management strategies. The proposed road balance message, by facilitating precise and dynamic control over vehicle movement, exemplifies how technological innovation can lead to significant improvements in traffic efficiency and safety.
As we look to the future, it is clear that the journey towards optimizing traffic management in the autonomous driving era is far from over. The legal and practical considerations surrounding the implementation of OBU or OBD devices in legacy vehicles pose challenges that warrant further investigation. Moreover, the development of a low-power notification system for legacy vehicles represents a promising avenue for extending the benefits of our proposed solutions to a broader spectrum of the vehicular landscape.
Author Contributions
Conceptualization, S.L., J.O. and M.K.; methodology, J.O. and K.Y.; software, C.K. and J.L.; validation, J.O. and S.L.; formal analysis, K.Y. and H.Y.; investigation, J.O. and M.K.; resources, C.K.; data curation, J.O. and M.L.; writing—original draft preparation, S.L. and J.O.; writing—review and editing, M.K.; visualization, H.Y.; supervision, M.L.; project administration, M.L. All authors have read and agreed to the published version of the manuscript.
Funding
This work was partly supported by the Institute of Information & communications Technology Planning & Evaluation (IITP) grant funded by the Korea government (MSIT) (No. 2020-0-00304, Development of Total Security Platform To Protect Autonomous Car and Intelligent Traffic System Under 5G Environment, 100%).
Data Availability Statement
Conflicts of Interest
Authors Sangmin Lee, Jinhyeok Oh, Minchul Kim, Myongcheol Lim, Keon Yun, and Heesun Yun were employed by the company Pentasecurity. The remaining authors declare that the research was conducted in the absence of any commercial or financial relationships that could be construed as a potential conflict of interest.
References
- Yeong, D.J.; Velasco-Hernandez, G.; Barry, J.; Walsh, J. Sensor and sensor fusion technology in autonomous vehicles: A review. Sensors 2021, 21, 2140. [Google Scholar] [CrossRef]
- Ignatious, H.A.; Khan, M. An overview of sensors in Autonomous Vehicles. Procedia Comput. Sci. 2022, 198, 736–741. [Google Scholar] [CrossRef]
- Fayyad, J.; Jaradat, M.A.; Gruyer, D.; Najjaran, H. Deep learning sensor fusion for autonomous vehicle perception and localization: A review. Sensors 2020, 20, 4220. [Google Scholar] [CrossRef]
- Ma, Y.; Wang, Z.; Yang, H.; Yang, L. Artificial intelligence applications in the development of autonomous vehicles: A survey. IEEE/CAA J. Autom. Sin. 2020, 7, 315–329. [Google Scholar] [CrossRef]
- Khayyam, H.; Javadi, B.; Jalili, M.; Jazar, R.N. Artificial intelligence and internet of things for autonomous vehicles. In Nonlinear Approaches in Engineering Applications: Automotive Applications of Engineering Problems; Springer: Cham, Switzerland, 2020; pp. 39–68. [Google Scholar]
- Alqarqaz, M.; Bani Younes, M.; Qaddoura, R. An Object Classification Approach for Autonomous Vehicles Using Machine Learning Techniques. World Electr. Veh. J. 2023, 14, 41. [Google Scholar] [CrossRef]
- Grigorescu, S.; Trasnea, B.; Cocias, T.; Macesanu, G. A survey of deep learning techniques for autonomous driving. J. Field Robot. 2020, 37, 362–386. [Google Scholar] [CrossRef]
- Bachute, M.R.; Subhedar, J.M. Autonomous driving architectures: Insights of machine learning and deep learning algorithms. Mach. Learn. Appl. 2021, 6, 100164. [Google Scholar] [CrossRef]
- Kipp, M. Analysis of the influence of non-driving-related activities on seat parameters and sitting posters. In Proceedings of the 7th International Digital Human Modeling Symposium, Iowa City, IA, USA, 29–30 August 2022. [Google Scholar]
- Ahangar, M.N.; Ahmed, Q.Z.; Khan, F.A.; Hafeez, M. A survey of autonomous vehicles: Enabling communication technologies and challenges. Sensors 2021, 21, 706. [Google Scholar] [CrossRef]
- Yun, K.; Yun, H.; Lee, S.; Oh, J.; Kim, M.; Lim, M.; Lee, J.; Kim, C.; Seo, J.; Choi, J. A Study on Machine Learning-Enhanced Roadside Unit-Based Detection of Abnormal Driving in Autonomous Vehicles. Electronics 2024, 13, 288. [Google Scholar] [CrossRef]
- Saad, W.K.; Shayea, I.; Hamza, B.J.; Mohamad, H.; Daradkeh, Y.I.; Jabbar, W.A. Handover parameters optimisation techniques in 5G networks. Sensors 2021, 21, 5202. [Google Scholar] [CrossRef]
- Poirot, V.; Ericson, M.; Nordberg, M.; Andersson, K. Energy efficient multi-connectivity algorithms for ultra-dense 5G networks. Wirel. Netw. 2020, 26, 2207–2222. [Google Scholar] [CrossRef]
- SAE International. J2735_202309: V2X Communications Message Set Dictionary, SAE International. 2023. Available online: https://www.sae.org/standards/content/j2735_202309/ (accessed on 26 February 2024).
- Benaissa, K.; Bitam, S.; Mellouk, A. BSM-data reuse model based on in-vehicular computing. Appl. Sci. 2020, 10, 5452. [Google Scholar] [CrossRef]
- Vector. CANoe. Available online: https://www.vector.com/kr/ko/products/products-a-z/software/canoe (accessed on 26 February 2024).
- Sun, X.; Bao, J.; Li, J.; Zhang, Y.; Liu, S.; Zhou, B. A digital twin-driven approach for the assembly-commissioning of high precision products. Robot. Comput.-Integr. Manuf. 2020, 61, 101839. [Google Scholar] [CrossRef]
- Wen, C.-K.; Liu, Z.-Y.; Wu, G.-W.; Zhao, C.-J.; Chen, L.-P.; Yin, Y.-X.; Meng, Z.-J. Digital twin-driven fatigue life prediction framework of mechanical structures using a power density theory: Application to off-road vehicle front axle housing. Measurement 2023, 220, 113352. [Google Scholar] [CrossRef]
- Liu, Y.; Zhang, L.; Yang, Y.; Zhou, L.; Ren, L.; Wang, F.; Liu, R.; Pang, Z.; Deen, M.J. A novel cloud-based framework for the elderly healthcare services using digital twin. IEEE Access 2019, 7, 49088–49101. [Google Scholar] [CrossRef]
- Kandasamy, N.K.; Venugopalan, S.; Wong, T.K.; Leu, N.J. An electric power digital twin for cyber security testing, research and education. Comput. Electr. Eng. 2022, 101, 108061. [Google Scholar] [CrossRef]
- Almeaibed, S.; Al-Rubaye, S.; Tsourdos, A.; Avdelidis, N.P. Digital twin analysis to promote safety and security in autonomous vehicles. IEEE Commun. Stand. Mag. 2021, 5, 40–46. [Google Scholar] [CrossRef]
- Zhang, L.; Khalgui, M.; Li, Z. Predictive intelligent transportation: Alleviating traffic congestion in the internet of vehicles. Sensors 2021, 21, 7330. [Google Scholar] [CrossRef]
- Rocha Filho, G.P.; Meneguette, R.I.; Neto, J.R.T.; Valejo, A.; Weigang, L.; Ueyama, J.; Pessin, G.; Villas, L.A. Enhancing intelligence in traffic management systems to aid in vehicle traffic congestion problems in smart cities. Ad Hoc Netw. 2020, 107, 102265. [Google Scholar] [CrossRef]
- Quessada, M.S.; Pereira, R.S.; Revejes, W.; Sartori, B.; Gottsfritz, E.N.; Lieira, D.D.; da Silva, M.A.; Rocha Filho, G.P.; Meneguette, R.I. ITSMEI: An intelligent transport system for monitoring traffic and event information. Int. J. Distrib. Sens. Netw. 2020, 16, 1550147720963751. [Google Scholar] [CrossRef]
- Brennand, C.A.; Filho, G.P.R.; Maia, G.; Cunha, F.; Guidoni, D.L.; Villas, L.A. Towards a fog-enabled intelligent transportation system to reduce traffic jam. Sensors 2019, 19, 3916. [Google Scholar] [CrossRef]
- Bauza, R.; Gozálvez, J. Traffic congestion detection in large-scale scenarios using vehicle-to-vehicle communications. J. Netw. Comput. Appl. 2013, 36, 1295–1307. [Google Scholar] [CrossRef]
- Aleko, D.R.; Djahel, S. An efficient adaptive traffic light control system for urban road traffic congestion reduction in smart cities. Information 2020, 11, 119. [Google Scholar] [CrossRef]
- Kumar, D.M.; Arthi, R.; Aravindhan, C.; Roch, A.A.; Priyadarsini, K.; Deny, J. Traffic congestion control synchronizing and rerouting using LoRa. Microprocess. Microsyst. 2021, 104048. [Google Scholar] [CrossRef]
- Pan, J.; Popa, I.S.; Zeitouni, K.; Borcea, C. Proactive vehicular traffic rerouting for lower travel time. IEEE Trans. Veh. Technol. 2013, 62, 3551–3568. [Google Scholar] [CrossRef]
- Meneguette, R.I.; Filho, G.P.; Guidoni, D.L.; Pessin, G.; Villas, L.A.; Ueyama, J. Increasing intelligence in inter-vehicle communications to reduce traffic congestions: Experiments in urban and highway environments. PLoS ONE 2016, 11, e0159110. [Google Scholar] [CrossRef]
- Liu, J.; Li, J.; Zhang, L.; Dai, F.; Zhang, Y.; Meng, X.; Shen, J. Secure intelligent traffic light control using fog computing. Future Gener. Comput. Syst. 2018, 78, 817–824. [Google Scholar] [CrossRef]
- Roughgarden, T. On the severity of Braess’s Paradox: Designing networks for selfish users is hard. J. Comput. Syst. Sci. 2006, 72, 922–953. [Google Scholar] [CrossRef]
- Correa, J.R.; Stier-Moses, N.E. Wardrop equilibria. In Encyclopedia of Operations Research and Management Science; Wiley: Hoboken, NJ, USA, 2011. [Google Scholar]
- Jereb, B.; Kumperščak, S.; Bratina, T. The impact of traffic flow on fuel consumption increase in the urban environment. Fme Trans. 2018, 46, 278–284. [Google Scholar] [CrossRef]
- National Geospatial-Intelligence Agency (NGA). ‘Department of Defense, World Geodetic System 1984, Its Definition and Relationships with Local Geodetic Systems’, Version 1.0.0, NGA.STND.0036_1.0.0_WGS84. Available online: https://earth-info.nga.mil/?dir=wgs84&action=wgs84 (accessed on 26 February 2024).
- Lazar, R.-G.; Pauca, O.; Maxim, A.; Caruntu, C.-F. Control Architecture for Connected Vehicle Platoons: From Sensor Data to Controller Design Using Vehicle-to-Everything Communication. Sensors 2023, 23, 7576. [Google Scholar] [CrossRef]
- Kim, M.; Suh, T. Eavesdropping vulnerability and countermeasure in infrared communication for IoT devices. Sensors 2021, 21, 8207. [Google Scholar] [CrossRef] [PubMed]
- NEC Protocol; SB-Projects: New York, NY, USA, 2017; Available online: https://www.sbprojects.net/knowledge/ir/nec.php (accessed on 26 February 2024).
| Disclaimer/Publisher’s Note: The statements, opinions and data contained in all publications are solely those of the individual author(s) and contributor(s) and not of MDPI and/or the editor(s). MDPI and/or the editor(s) disclaim responsibility for any injury to people or property resulting from any ideas, methods, instructions or products referred to in the content. |
© 2024 by the authors. Licensee MDPI, Basel, Switzerland. This article is an open access article distributed under the terms and conditions of the Creative Commons Attribution (CC BY) license (https://creativecommons.org/licenses/by/4.0/).


 ,
, 


