
Design of a Human–Computer Interaction Method for Intelligent Electric Vehicles

1
School of Art & Design, Zhengzhou University of Light Industry, Zhengzhou 450002, China
2
College of Landscape Architecture and Art, Henan Agricultural University, Zhengzhou 450002, China
3
Technical Center, Yutong Bus Co., Ltd., Zhengzhou 450016, China
*
Author to whom correspondence should be addressed.
World Electr. Veh. J. 2022, 13(10), 179; https://doi.org/10.3390/wevj13100179
Submission received: 18 August 2022
/
Revised: 23 September 2022
/
Accepted: 27 September 2022
/
Published: 29 September 2022
Abstract
:In order to improve the satisfaction of users during the human–machine interaction with intelligent electric vehicles, this paper presents the human–machine interaction method of intelligent electric vehicles. Firstly, the principle of human–computer interaction of intelligent electric vehicles is analyzed, the application of interaction in big data visualization is expounded, and the cognitive mechanism of big data visualization interaction is designed. According to the above mechanism, the design the of information interface and the HUD interface is completed, and the interaction model is established. So far, the design of a human–computer interaction method of intelligent electric vehicles is completed. The experimental results show that the human–computer interaction response time of the design method is was only 5 ms, and the human-computer interaction satisfaction of the intelligent electric vehicle can reach 99%, which has certain application value.
1. Introduction
With the increasingly serious environmental pollution and energy shortage, IEVs (Intelligent Electric Vehicle) have become one of the solutions to energy conservation and emission reduction. At present, only electric vehicles can achieve zero emission pollution. By the end of 2017, the production and sales of electric vehicles in China reached 700,000, and more and more users could enjoy the smart travel experience brought by IEV [1]. China is expected to form an independent and controllable complete industrial chain in 2025 and achieve the goal of annual sales of 3 million vehicles, and IEV will gradually become one of the main travel tools of users. The main power source of IEV is a battery pack, which is driven by a motor in whole or in part, involving machinery, electronics, microcomputer control, and other disciplines [2]. Electric vehicles not only have the advantages of zero emissions and are quieter inside during driving, which helps to improve the user experience of drivers, but they also have the disadvantages of long charging times and a difficult selection of charging location. The combination of artificial intelligence technology and electric vehicles has lead to great changes in users’ vehicle driving behavior and human–vehicle interaction behavior, such as vehicle–assisted driving systems, on-board voice interaction systems, recommended charging places, etc. [3]. Therefore, IEVs can make the information interaction between people and vehicles, and vehicles and vehicles faster and more efficient [4,5]. Data sharing and linkage among IEVs, transportation facilities, and users need to be realized. When discussing the interaction in the visual interface, the interaction is usually conceptualized as the user’s instruction input and feedback output through the interface. Interaction is crucial for users to explore data information because it allows users to participate in the process of testing and judgment, hypothesis and verification. The ability of users to ask questions and obtain answers from data is realized through interaction. Through the interaction between user and interface, data analysis can be user-oriented. If you want to use visualization to take advantage of the potential of data, the interaction must allow users to access data sets and perform various tasks. Since the judgment of users is the core of successful data analysis, the more ways users interact with the visual interface, the higher their analysis efficiency will be.
At present, scholars have studied this. For example, Fu et al. [6] designed an intelligent human–computer interaction system to solve the communication inconvenience between hearing impaired people and non-disabled people. The system combined artificial intelligence with wearable devices, and used BP neural network to classify gestures, effectively solving the communication problem between hearing impaired people and non disabled people; Abosulimanand Almagrabi [7] designed a computer vision aided logistics management human–computer interaction method based on deep learning. Through the hybrid CNN-LSTM network, a single-stage or one-step convergence optimization decision support design model was realized. The model integrated convolutional neural networks and long-term and short-term memory networks to simulate the machine dynamics and relationships in various service needs. The uncertainty was determined through the optimization decision of dynamic delivery and distribution of logistics services, so as to complete the design of human–computer interaction methods. Chen et al. [8] took gesture recognition as the starting point to design a human–computer interaction method assisted by artificial intelligence. The model architecture was realized by introducing a strong semantic feedback and information integration mechanism of interaction channel. This method was based on the MCG Skin database and color distribution expression.
Although the above scholars have studied this, due to the lack of human–computer interaction design from the perspective of customer satisfaction, the user’s satisfaction with human–computer interaction with intelligent electric vehicles is low. In order to solve this problem and improve users’ satisfaction in the process of human–computer interaction with intelligent electric vehicles, this paper presents a human–computer interaction method for intelligent electric vehicles, which enables users to view data from different angles and select potential data, thus improving the human–computer interaction effect of intelligent electric vehicles.
2. Research on the Human–Computer Interaction Principle of IEV
2.1. Composition of IEV System
Although smart electric vehicles have will become the trend of vehicle discovery in the future, consumers’ acceptance of smart electric vehicles is still uneven. The study found that consumers will consider the differences in vehicle structure, attitude, environmental awareness, innovation, identity and emotion when choosing electric vehicles_ Element, in which the structural aspect is the key factor bearing the brunt. Compared with traditional internal combustion engine vehicles, IEVs cancel the engine, and add new mechanisms such as the power supply system and drive motor system according to different driving modes. According to the change of system function, the IEV is mainly composed of an electric drive control system, an on-board power supply control system and an auxiliary control system.
- Power control system: the system is the whole vehicle controller of IEV, including central control unit, drive controller, motor, and mechanical transmission device. The main function is to convert the electric energy stored in the power battery pack into the kinetic energy of the wheel. At the same time, when the electric vehicle decelerates and brakes, the kinetic energy of the wheel is converted into electric energy and stored in the power battery pack;
- On board power supply control system: the system is the power source of IEV, including charging controller, battery and corona unit. The main function of the charging controller is to control the charger to charge the battery pack and monitor the use of the battery;
- Auxiliary control system: the system is the controller of the IEV driving assistance and on-board entertainment system, including the power steering unit, temperature control unit, auxiliary power source, intelligent interconnection interaction module, etc. [9,10,11,12]. The auxiliary power source mainly provides power to the power steering system, air conditioner and other auxiliary equipment. The function of intelligent interconnection and interaction module connects people, vehicles and transportation to form an effective linkage network.
2.2. Human–Computer Interaction of IEV
The human–computer interaction of IEVs refers to the ways and steps that users perform in the process of using an IEV. The user’s operation behavior is affected by the user’s cognition and task [13]. The human–computer interaction system of an IEV is equivalent to the communication bridge between users and vehicles. It aims to improve users’ driving performance and safety and enable users to quickly and efficiently obtain and process driving information. IEV human–computer interaction is a kind of human–computer interaction, which not only contains the general characteristics of human–computer interaction, but also has certain particularity:
- Interactive environment: IEV users are in a dynamic environment, and the information they receive also has certain dynamic fluidity and uncertainty. Therefore, the design of an IEV human–computer interface has the characteristics of real-time processing information and auxiliary decision-making;
- Interactive tasks: the purpose of users using the functions of the IEV system is diverse, and different purposes lead to the difference of in users’ tasks in the process of human–computer interaction. Therefore, the interaction mode of IEV human–computer interaction system should reduce or optimize the steps of users dealing with driving tasks;
- Interaction object: the information processed by the human–computer interaction system of IEV is not only the information between people and vehicles, but also the information between vehicle and vehicle, vehicle intelligent equipment, vehicle traffic network, etc. [9]. Therefore, the human–computer interaction system of an IEV needs to effectively screen and present the information to users;
- Interactive content: the IEV has changed from a simple means of transportation to a living space with multiple types of information interaction, and the interactive content in the vehicle has also expanded from simple driving information to user travel and life information. IEV can be regarded as an interactive intelligent mobile terminal device.
2.3. Interaction Principle
The design of human–computer interaction behavior mode of IEV information interface needs to pay attention to two points: the first is not to hinder the main task of driving; the second step is to optimize the secondary task of driving. In the experiment of tactile feedback of automobile interaction, relevant scholars found that the complexities of the interface interaction, interaction mode, interaction frequency, and button position directly affect the driver’s driving performance. Therefore, according to the technical characteristics and user needs of electric vehicles, this paper puts forward the optimization principle of interactive behavior and the multi-channel principle of interactive behavior.
- Interactive behavior optimization principle
In the process of IEV information interface design, the design of interface functions shall meet the needs of users, that is, relevant functions shall be convenient for users to quickly find and use, and the possible needs of users shall be considered from the perspective of users to improve the scientificity of the design [6]. General system design requires users to pay a certain learning cost. This principle aims to think about the design of information architecture from the perspective of users, reduce users’ learning cost and improve interface availability and ease of use. Based on the mobile interconnection characteristics of IEV, the information interconnection between mobile devices and vehicles has become an important element to improve the driving experience of vehicles and the development trend of vehicles in the future. Therefore, integrating and optimizing the interaction behavior of a mobile device interface and automobile information interface is the key to the interaction of the automobile interface in the future, so as to make the IEV gradually transition from an independent means of transportation to a device node in intelligent internet life.
- 2.
- Multi channel principle of interactive behavior
The traditional human–computer interaction mode is completed by the interaction between the user’s hands and eyes and the mouse, keyboard, display, and other equipment, while the multi-channel human–computer interaction makes full use of human senses to interact with the computer system in a precise or imprecise mode. As introduced in the previous chapter, the characteristics of multi-channel interaction include multi-dimensional interaction, two-way interaction, implicit interaction, and imprecision of interaction [14]. The human–computer interaction interface of IEV applies the principle of multi-channel design, that is, use the user’s visual, auditory, and tactile control interface functions to improve the pleasure and efficiency of user experience. In terms of hearing, the voice assistant in the interface helps the driver to complete the function operation without diverting his sight, so as to improve the driver’s driving performance. The interface key sound and reversing prompt sound give users real-time operation feedback. In terms of touch, the user interface is the vibration feedback embedded in the screen, which can quickly stimulate the user’s response similar to auditory feedback.
3. Design of a Human–Computer Interaction Method for Intelligent Electric Vehicle Based on Big Data Analysis Technology
3.1. Application of Interaction in Big Data Visualization
So far, the interaction in big data visualization is divided into the following types of applications according to media:
- Computer mouse control interaction;
- Handheld device touch command interaction;
- Speech recognition interaction;
- Somatosensory recognition interaction (including gesture recognition);
- AR interaction;
- Eye tracking interaction;
- EEG control interaction;
- Integrated media “cross screen” interaction.
The above mainstream interactive media have their own application scenarios, advantages and disadvantages [15]. As far as the most widely used and mature computer is concerned, it has huge computing power, especially the computer connected to the distributed computer network, so it can perform complex computing and analysis. Because of its relatively small power, handheld devices do not need to perform too many calculations and analysis, and simply carry out visual display and respond to input instructions from users. Therefore, many characteristics of the interaction interface and its potential technology must be considered in interaction design [16]. These features include processing power, storage capacity, battery power, display resolution, and display size. In addition, users’ cognitive activities must be suitable for technology in order to be able to perform the necessary tasks. For example, if the underlying technology is a handheld device, the possibility of intensive information processing in computing space is limited compared with computers. The underlying technology of the interactive interface construction also affects the possibility of interactive behavior that can be provided and the way to process information in interaction and presentation space. For example, some technologies may limit the form of operation that interactive behavior can take [10].
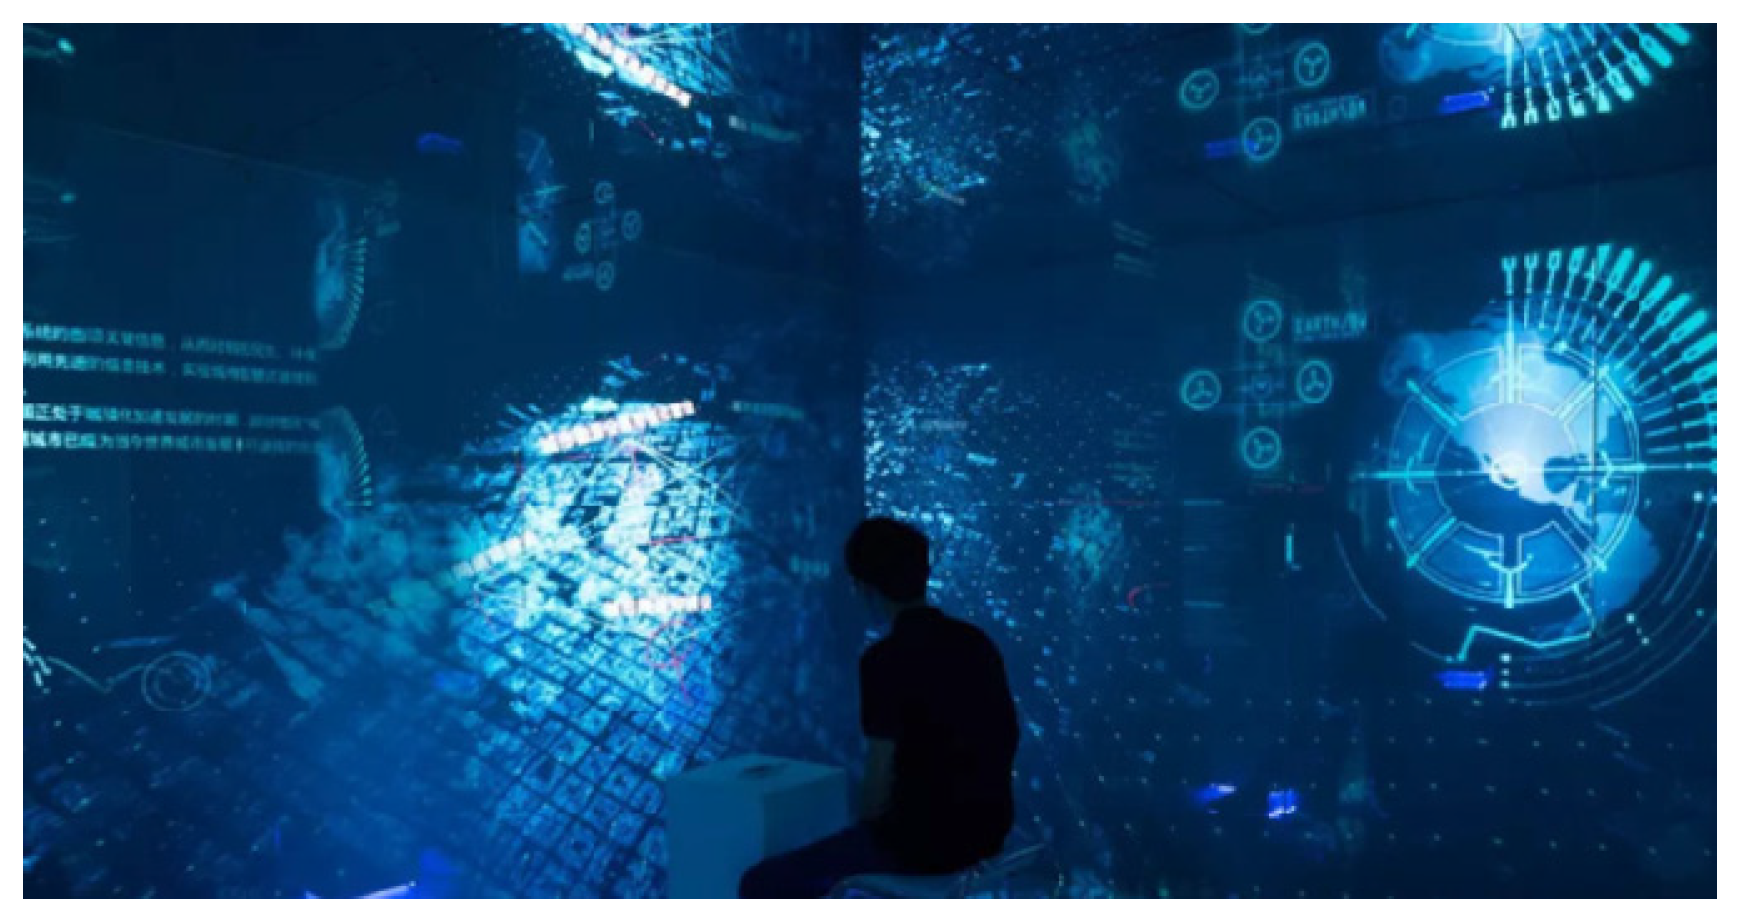
With the maturity of interaction technology in the past two years, more and more interactive media have been applied to the big data visualization interface, such as somatosensory interaction, AR interaction, eye movement, and EEG (Electro- EncephaloGram) interaction, in an attempt to return users to a “natural” human–computer interaction mode. Somatosensory interaction is an interactive way to directly interact with the surrounding devices or environment by means of body action, sound, eye rotation, and so on. Figure 1 shows the large art installation of fully immersive glass house at the 2018 China smart Expo, which shows you the new concept of smart city and the digital display, interaction and experience of Smart Life visualization through three-dimensional digital content and multimedia digital technology [17].
AR (Augmented Reality) interaction uses AR Augmented Reality Technology and three-dimensional technology, takes AR head display or glasses as the visualization window, and carries out visual presentation through gesture operation and handle operation. AR gesture interaction is a gesture interaction device based on the principle of image detection. The camera captures the displacement and action of the hand and can be superimposed on the VR head display device for gesture interaction. As shown in Figure 1, the typical device leap motion of this interaction mode has a large gesture range, which is completely equivalent to the use range of both hands in real life. The AR handle operation is a button that can be clicked through the physical handle. It has a tactile feedback mechanism, such as oculus touch device. The gesture interaction supported by it makes the actions of detail interaction, secondary interaction, and roaming interaction more detailed by virtue of high-precision gesture recognition. It can also be combined with a tracking device to increase the immersion of interaction. These AR interactive media devices are currently in the development stage and have their own limitations in the realization of technology and user experience. Therefore, the mainstream media in big data visualization is still computer-based.
The interaction in big data visualization is divided into the following two types of applications according to the intelligence of the interface: simple interactive application and intelligent interactive application. At present, most big data visualization interfaces simply wait for user input and output feedback. With the rapid development of artificial intelligence, the interactive interface can gradually play an active role in information processing. The visual interface can intelligently calculate and process by itself in the background, and actively prompt users with appropriate information or give warnings. For example, both opera map and Apple’s own map are map visualization applications. Apple’s own map simply carries out path planning according to the destination entered by the user, while the Gaode map can intelligently predict the user’s purpose, so as to reduce the user’s operation when driving. However, with the increasing needs of users and picky use habits, the non intelligent interactive applications will inevitably be gradually updated and iterated to intelligent interactive applications, otherwise they will be eliminated by the times.
3.2. Cognitive Mechanism in Big Data Visual Interaction
The purpose of interaction design is to help users better achieve their goals and meet their needs. Therefore, the primary problem of how to master the essence of user needs is an important aspect. User behavior is only performance, and the essence of behavior is driven by user’s cognitive model. Therefore, in interaction design, it is necessary to establish corresponding research models and conduct comprehensive research in combination with cognition such as perception, memory, and thinking. Only by understanding the cognitive characteristics of users, studying user behavior from the cognitive level, and combining these characteristics to design the underlying system functional architecture and the surface user interface, can we meet the user’s cognition from the bottom and achieve the consistency between cognition and mental model in the system representation. Cognitive theory can help us understand the behavior of users from the level of human cognition and mind, understand the meaning of design criteria more deeply, and then use design criteria more flexibly. Distributed cognition believes that cognitive processes are distributed in internal mental space and external environment. In order to carry out complex cognitive activities, such as those in the process of interaction with the interface, people often combine and process information from internal and external representations in a comprehensive and dynamic way.
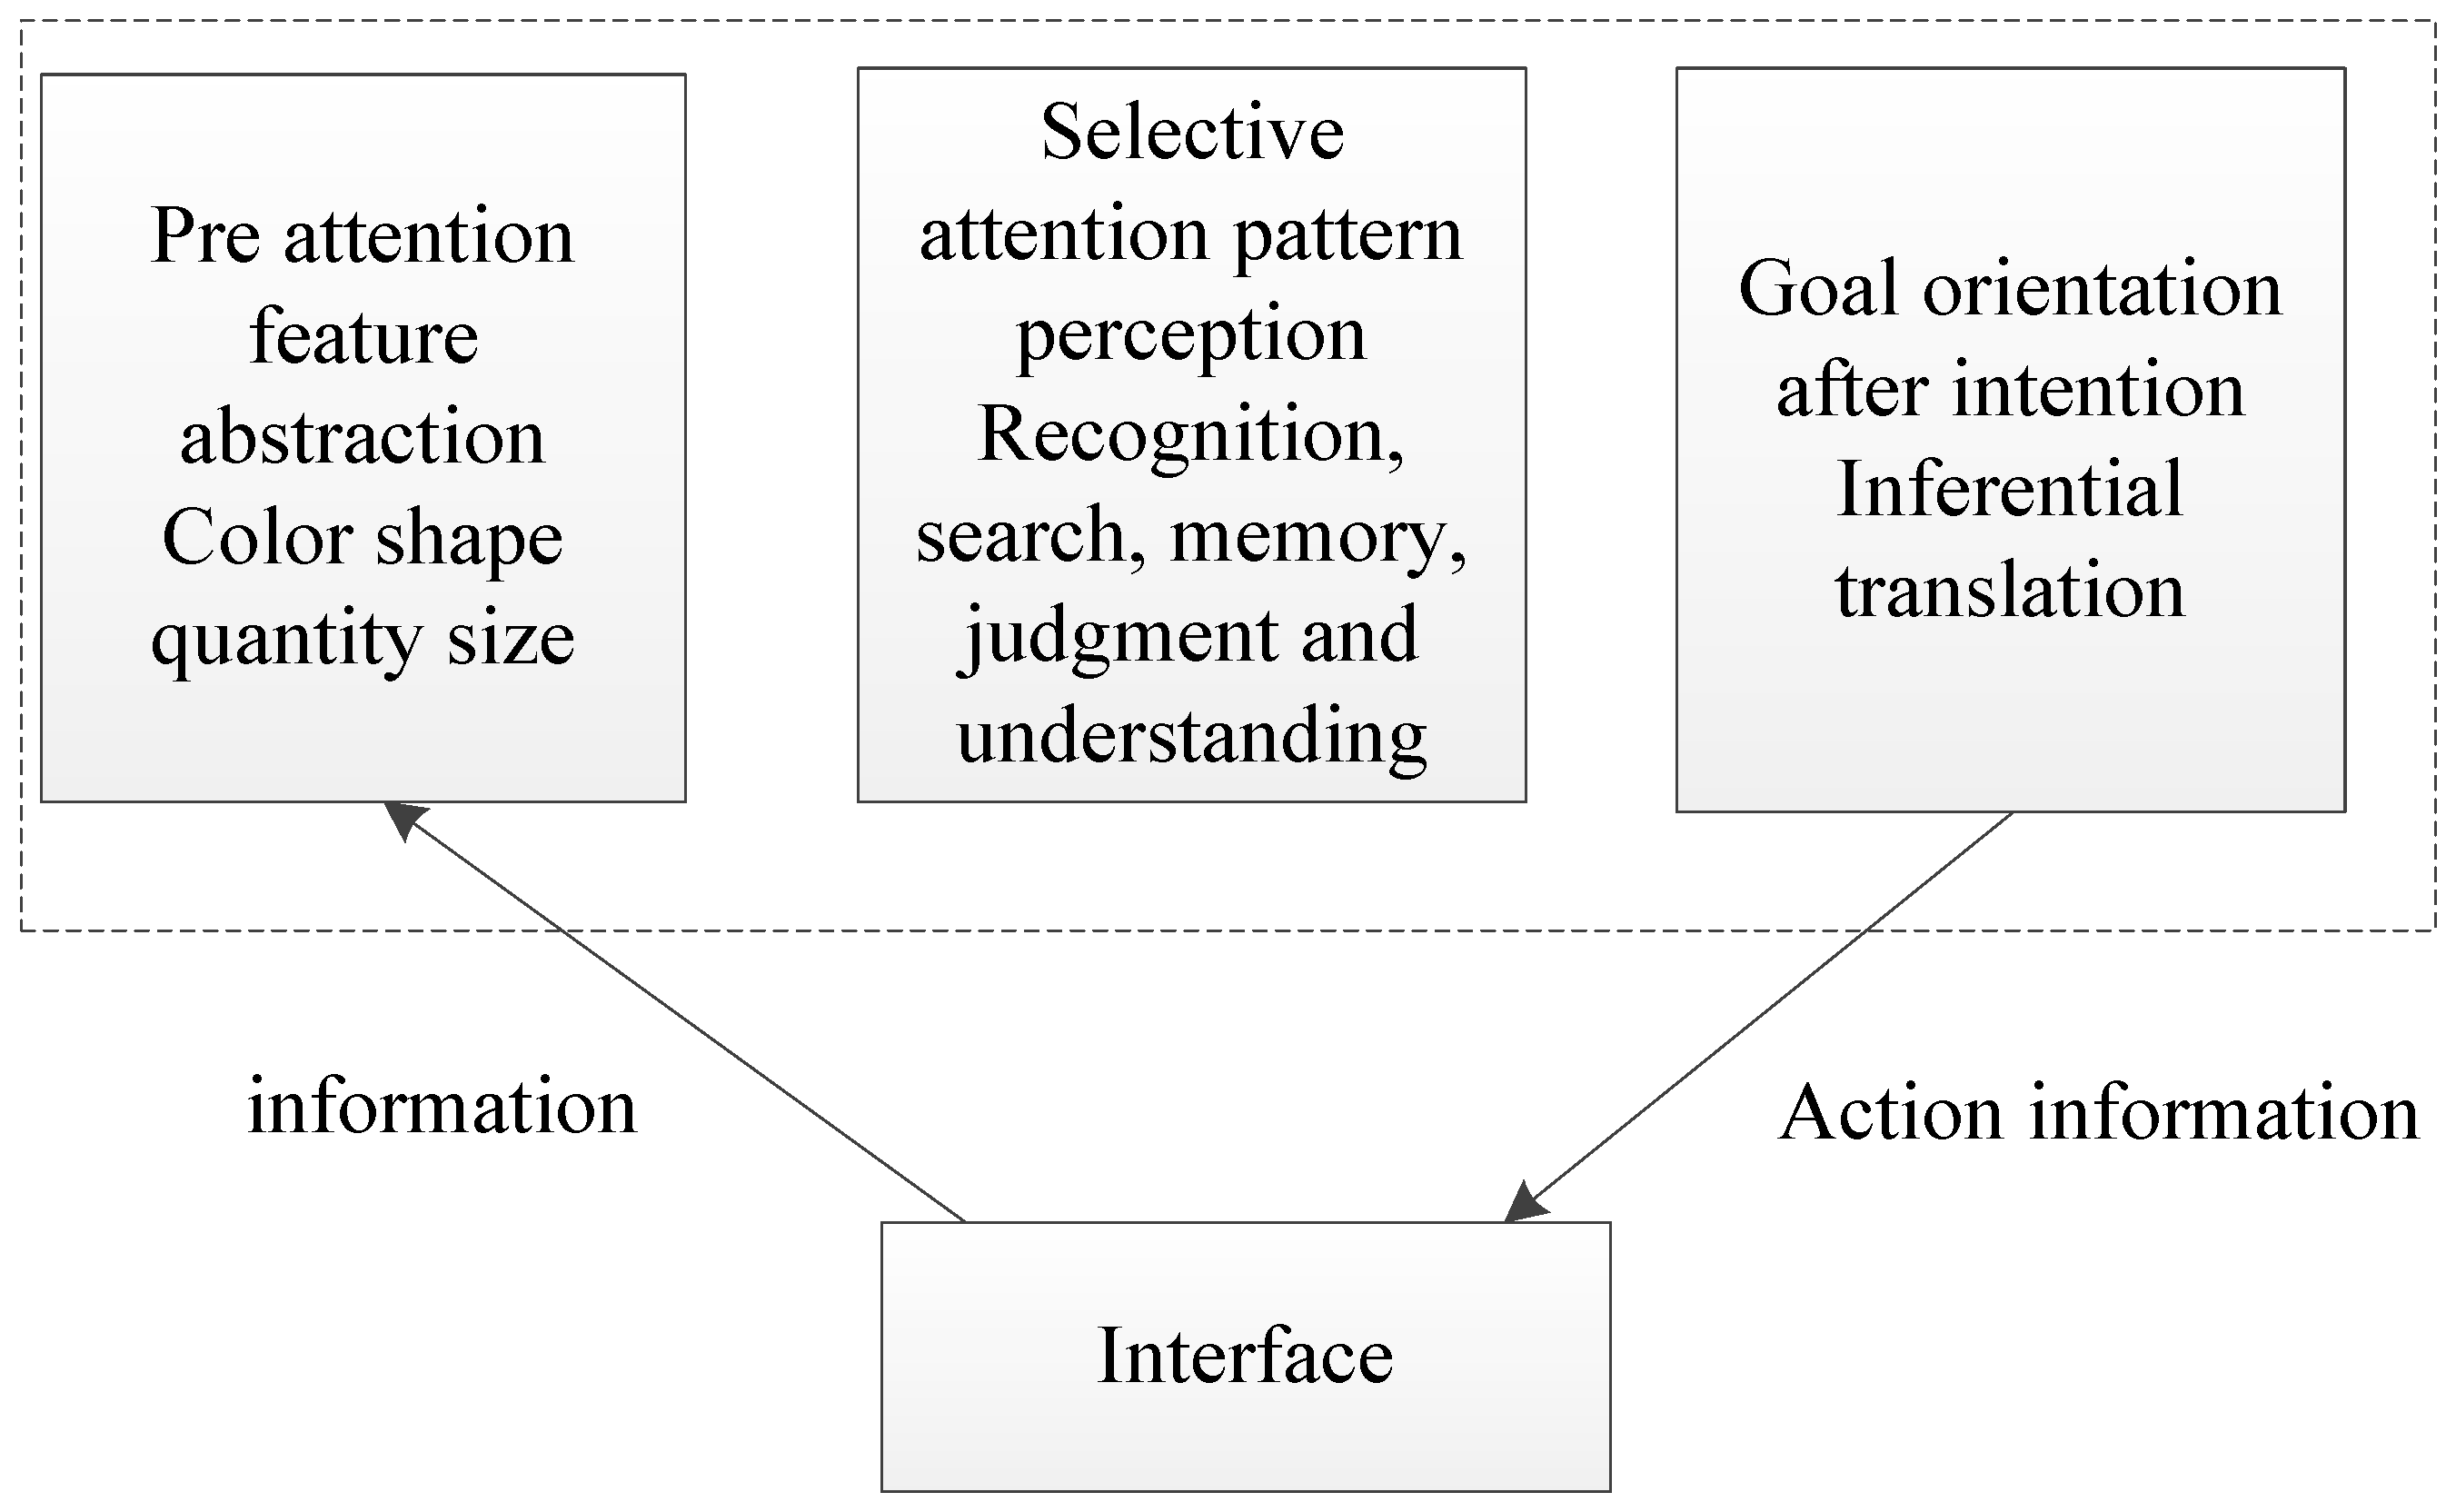
Figure 2 describes the three stages of information processing in mental space. The first stage of this process is the pre attention stage, also known as feature abstraction. Our visual system pretreatment many features in our field of vision within 250 milliseconds without any conscious cognitive effort. These features include length, direction, width, hue, curvature and intersection. Pre attention processing is largely independent of conscious cognitive processing and prior knowledge. Therefore, some general principles of pre attention processing are very important for the effective design of data visualization, because appropriate visualization design can make full use of some characteristics of pre attention processing. The second stage is the selective attention stage, also known as pattern perception. This involves a focus on specific areas in the visual field and a quick division of areas through thinking such as recognition, search, memory, judgment and understanding. This stage is generally a bridge between perception and cognition. In the context of most visualization studies, the first two stages are usually considered as part of perception. For the first two stages of processing, researchers have put forward many principles and strategies of visual design. The third stage is intentional post attention to adjust, add, create, or remove psychological representations, models and patterns, so it is a serialized goal-oriented process. At this stage, users consciously perform tasks, such as putting forward hypotheses, comparing them with the existing psychological structure, constructing analogies, connecting information items through reasoning, classifying information items and so on. This is also where metacognitive awareness and regulation occur, that is, users plan cognitive activities, interact with the interface, monitor the implementation of these activities, and evaluate the results of these tasks. At present, most visualization studies only focus on the first two stages, so there is a lack of comprehensive research on psychospatial information processing in visualization research.
3.3. Information Interface Design
Firstly, the instrument panel interface design. In the design of IEV human-computer interaction information interface system, the instrument panel is located in the most accessible position directly in front of the user’s eyes. Therefore, the information function displayed by the instrument panel should be the function of assisting the main task of driving, and it is also the function most frequently used by the user. This part of the function displays the current vehicle status and on-board equipment operation during driving, assists the driver in making decisions and triggers other driving tasks. Therefore, the functions of the instrument panel mainly include the following three types:
- Current vehicle condition: including vehicle speed, vehicle driving condition, power consumption, energy consumption, vehicle auxiliary driving information and time.
- Vehicle detection and transformation identification: including vehicle detection at startup and vehicle state transformation during driving.
- Main entertainment task: including the current playback of on-board entertainment system.
Secondly, information interaction design. When users drive smart electric vehicles, although the instrument panel is the most accessible area of sight, too many information levels will distract users’ attention and affect driving performance and safety. At the same time, the instrument panel is located at the back of the steering wheel, which is not conducive to the interactive operation of hands on the screen. Therefore, in this design, each information level of the instrument panel is a single attribute level, and in the interactive mode, it only provides the screen data that the user can watch, not the gesture operation that the user can operate. In the function design of instrument panel information interface, vehicle status information and vehicle detection and transformation identification information are to meet the needs of driving main tasks, and the display signals of music and radio are to meet the needs of driving secondary tasks. This is because when the driver is driving the vehicle, operating the central control screen will affect driving performance and driving safety. Therefore, the main driving secondary task requirements are designed in the area where the line of sight is easy to reach.
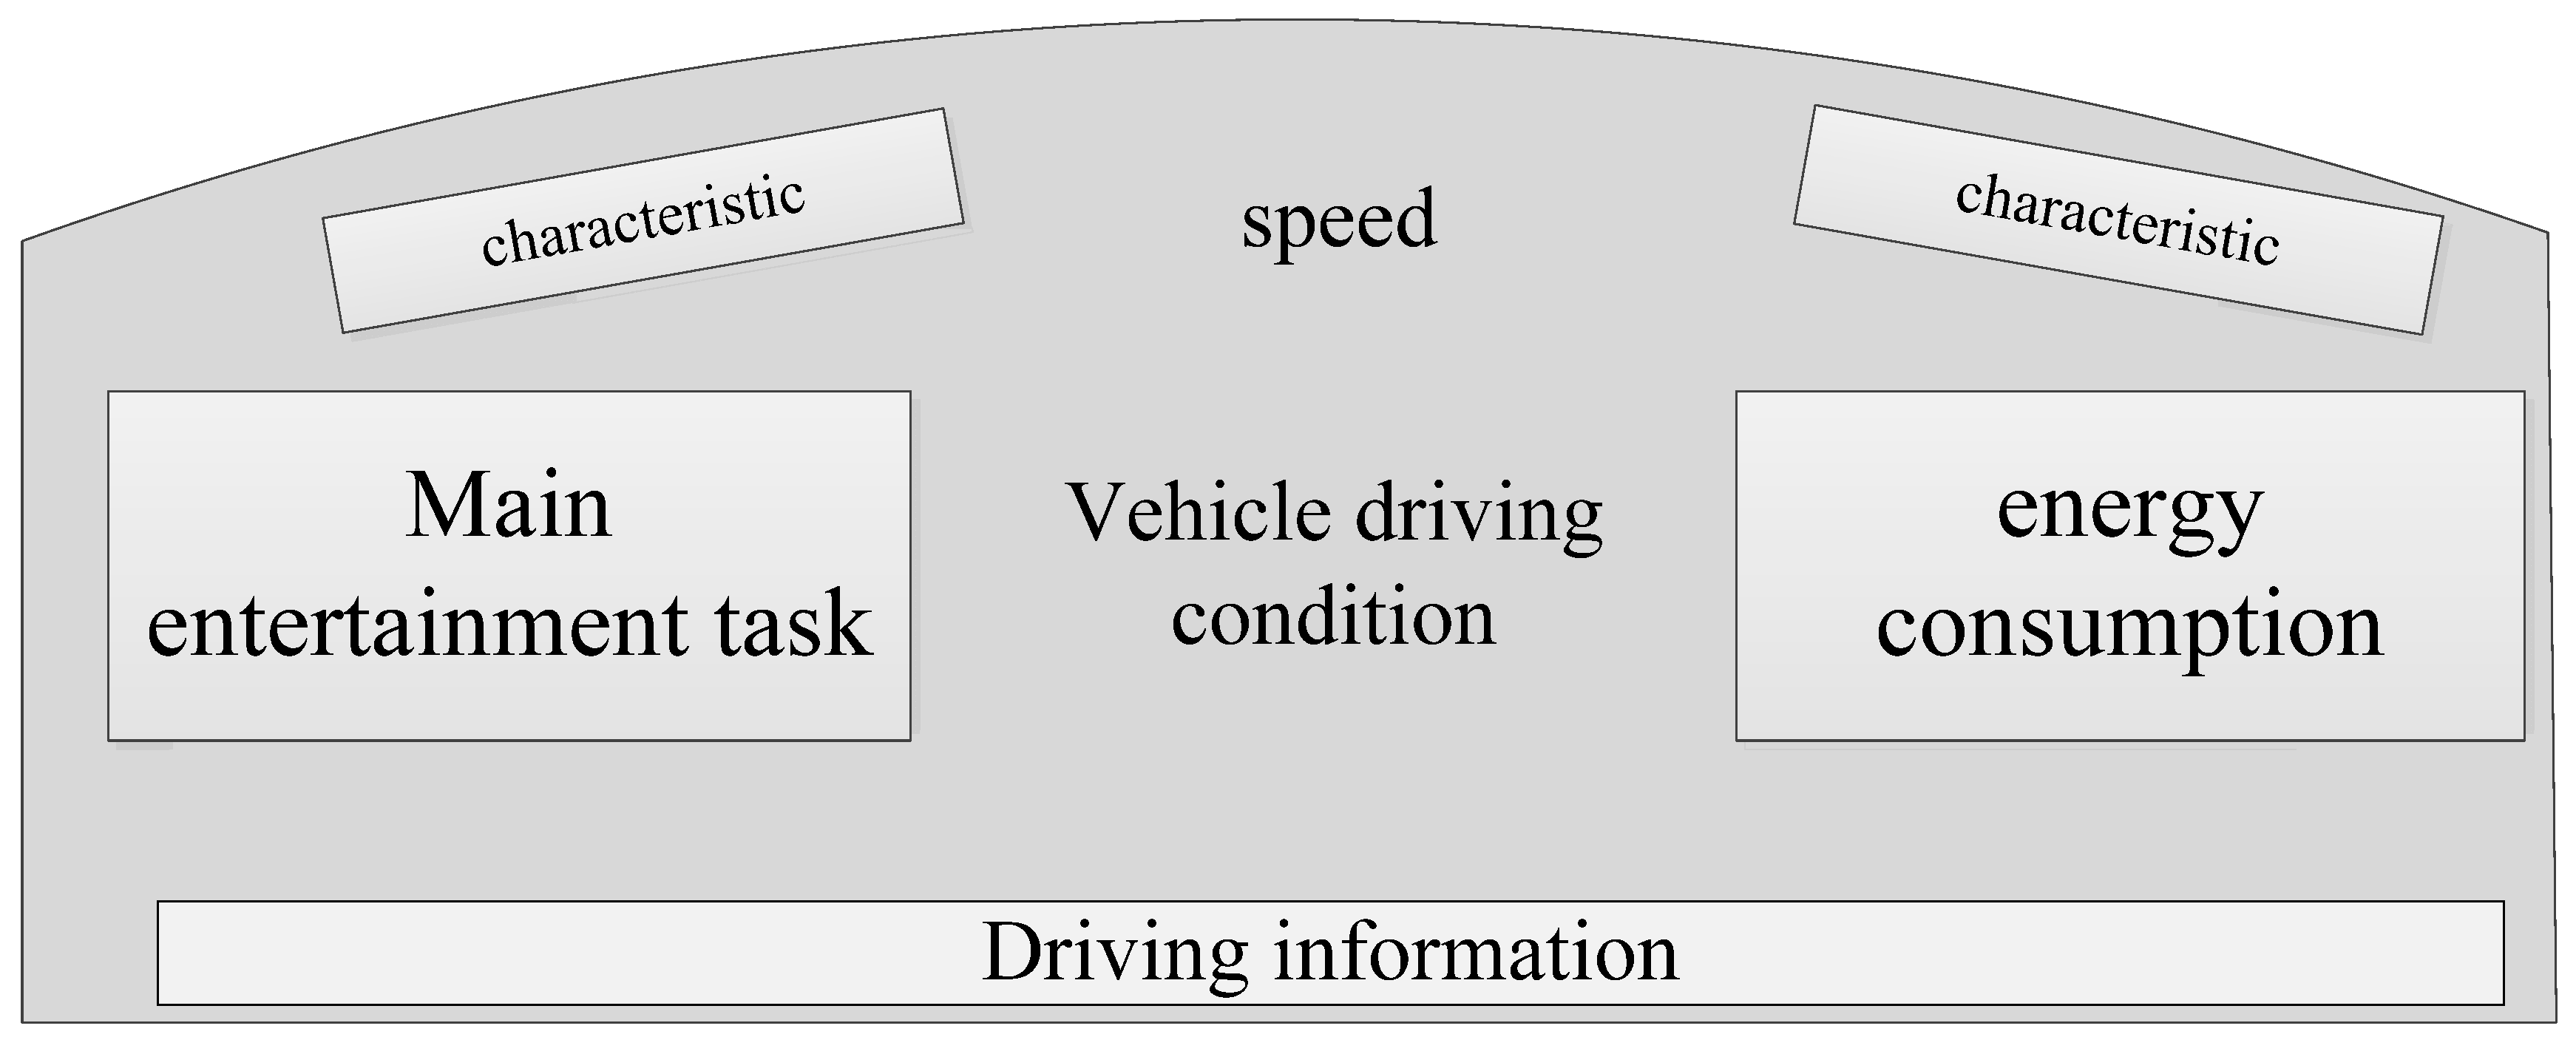
Thirdly, structural layout design. According to the division of the functions of the instrument panel of the IEV information interface, the structural layout of the instrument panel interface is shown in Figure 3. This structural layout is conducive to users to quickly view the vehicle situation and make judgments for the next task. At the same time, ensure users’ driving efficiency and safety.
In the interface color design of an IEV Weixi interface instrument panel, a dark gradient is used as the background color to reduce the impact of bright color on users’ attention. The left side of the instrument panel is the entertainment task, the right side is the energy consumption statistics, and the middle part is the condition of the vehicle on the road. The vehicle detection identification and status identification are displayed to the customer in four colors: red (ED ^ 1b23), green (35ce14), yellow (eb8f0d) and blue (1481ce) through the form of icons. Among them, red indicates that the hidden danger needs to be solved immediately, yellow indicates that the hidden danger needs to be checked, blue indicates that the auxiliary driving function is on, and green indicates that the vehicle function is on. The purpose of energy consumption mapping is to help users understand the energy consumption of self: B and analyze their driving habits. Users can increase their real driving range of electric vehicles by modifying their driving habits.
3.4. HUD Interface Design
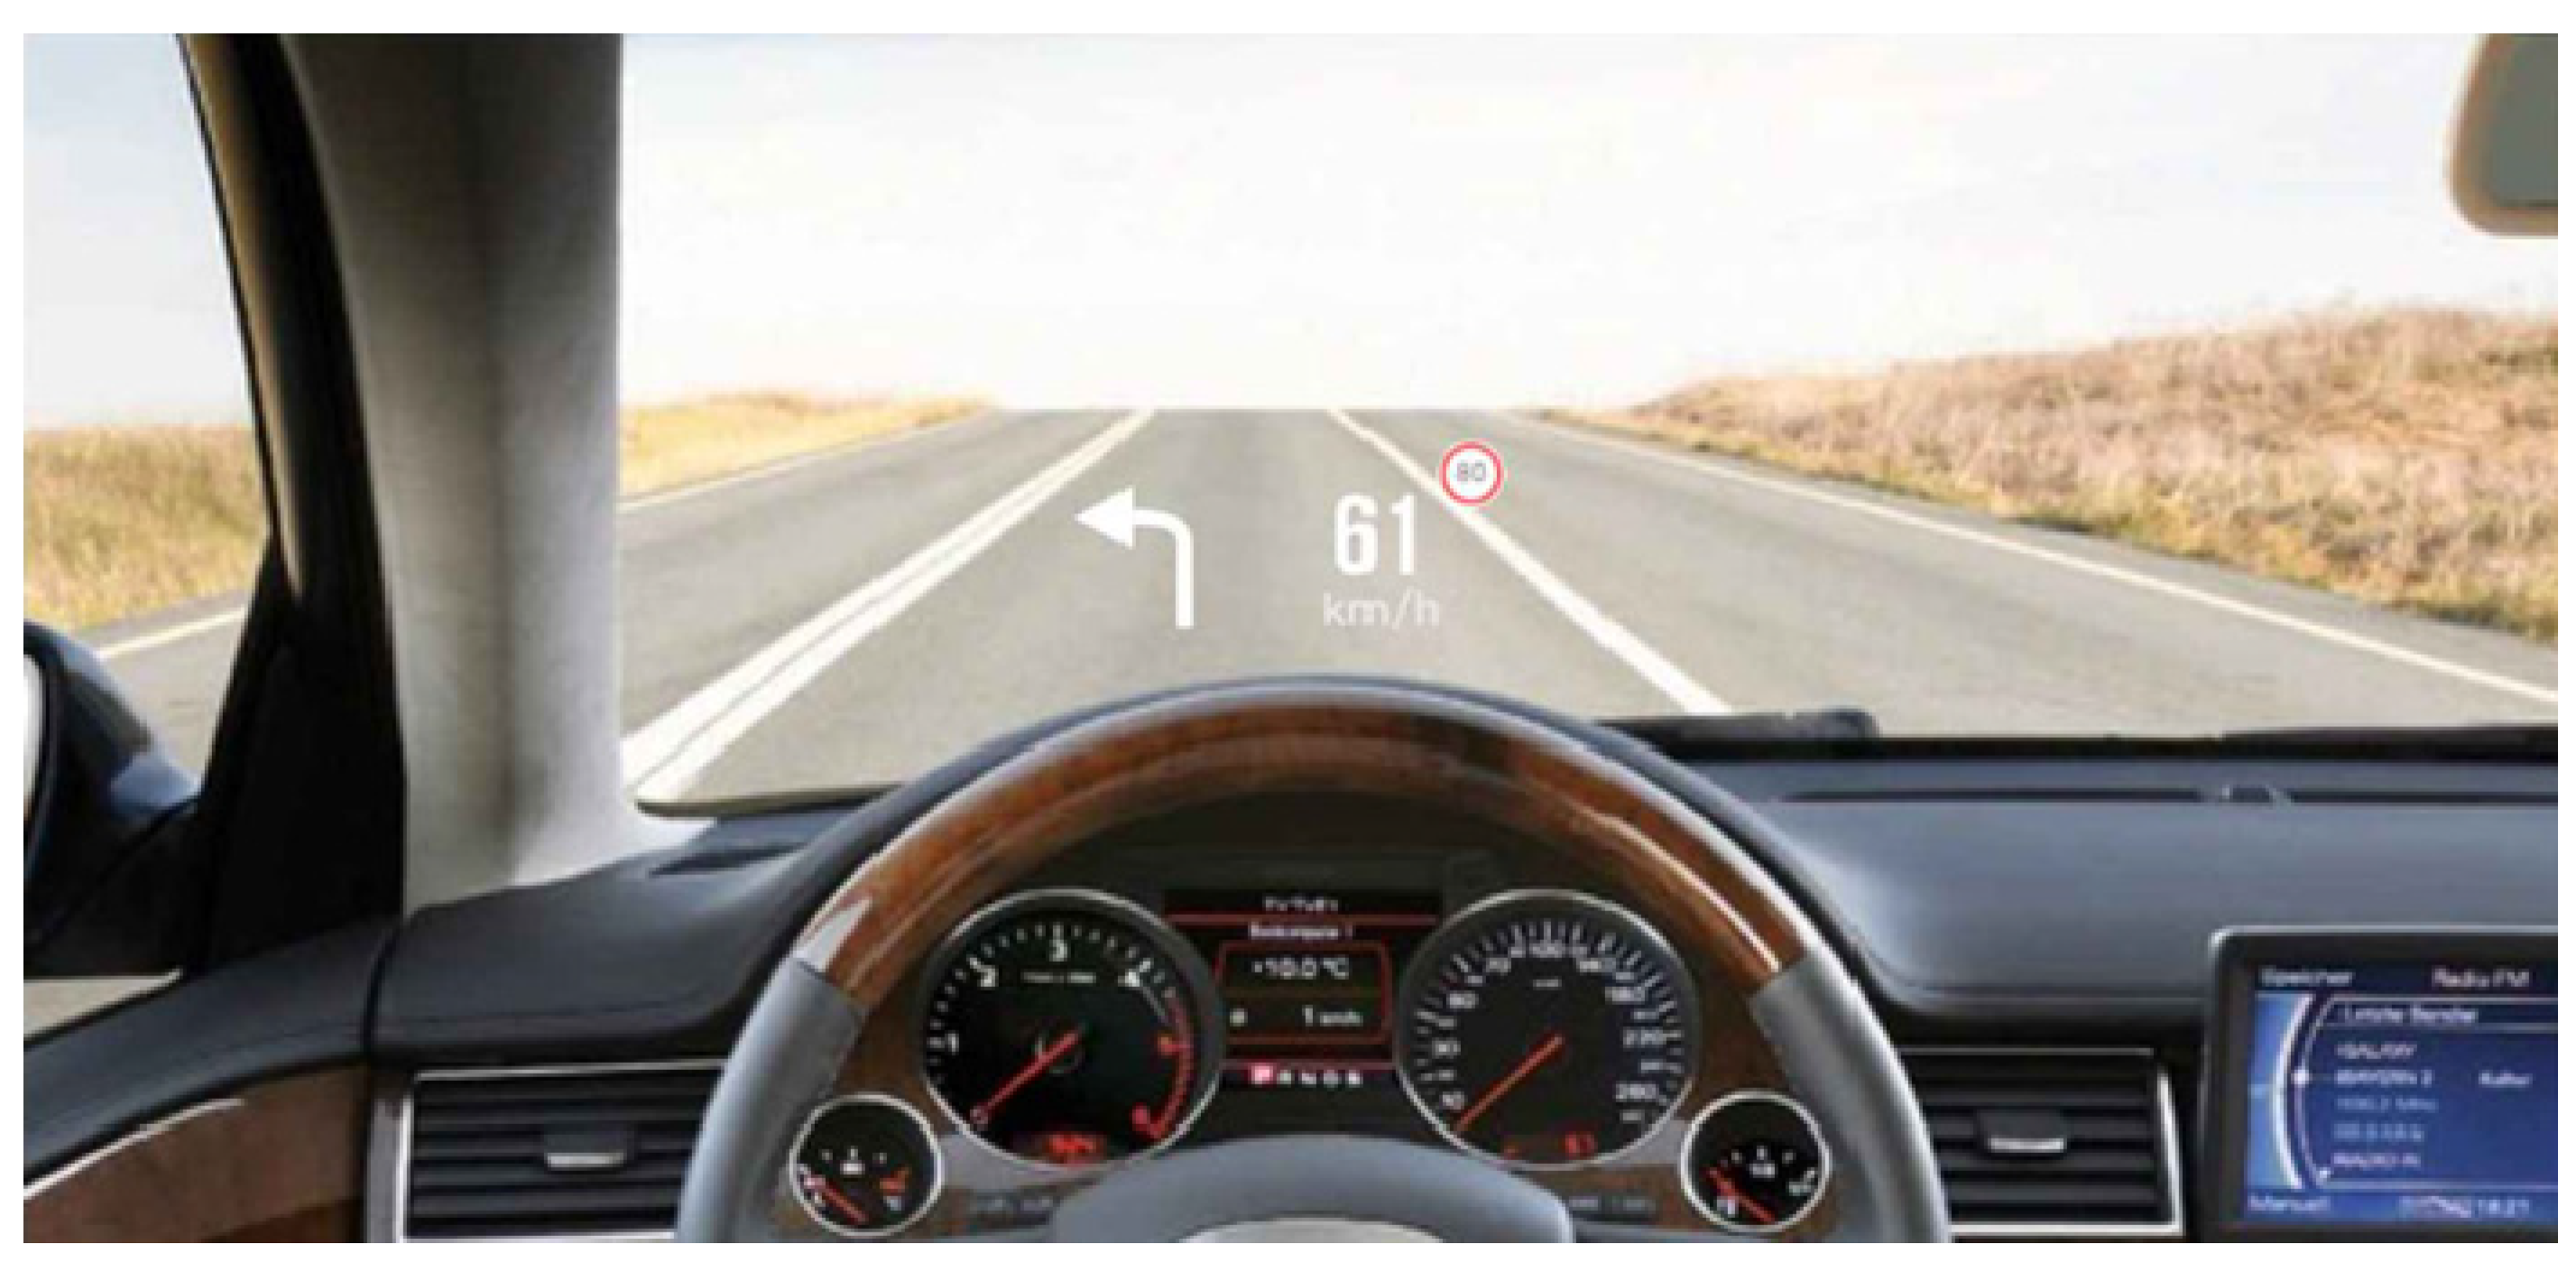
The HUD display content in the human–computer interaction information interface design of an IEV is located in the driver’s driving field of vision, and the display information is fused with the real information. Therefore, the information function design of HUD display should not only meet the needs of the driver’s main driving task, but also ensure that the information is concise, intuitive and easy to read, so as to prevent the driver from cognitive overload. The driver’s focus in the driving process is the road situation in front of the line of sight, and the human–computer interaction information related to the main driving task is the vehicle equipment and vehicle driving situation. In this design, the HUD interface functions include vehicle speed information, steering reminders, and road condition information.
In this design, the interface design based on HUD display function is mostly symbols and single digital display, which reduces the cognitive load of users. At the same time, the color brightness has an adjustable function with the difference of external light intensity and external reference, as shown in Figure 4. In this design, the HUD display interface consists of two parts: one is the steering prompt, the other is the overspeed reminder.
3.5. Interaction Model Design
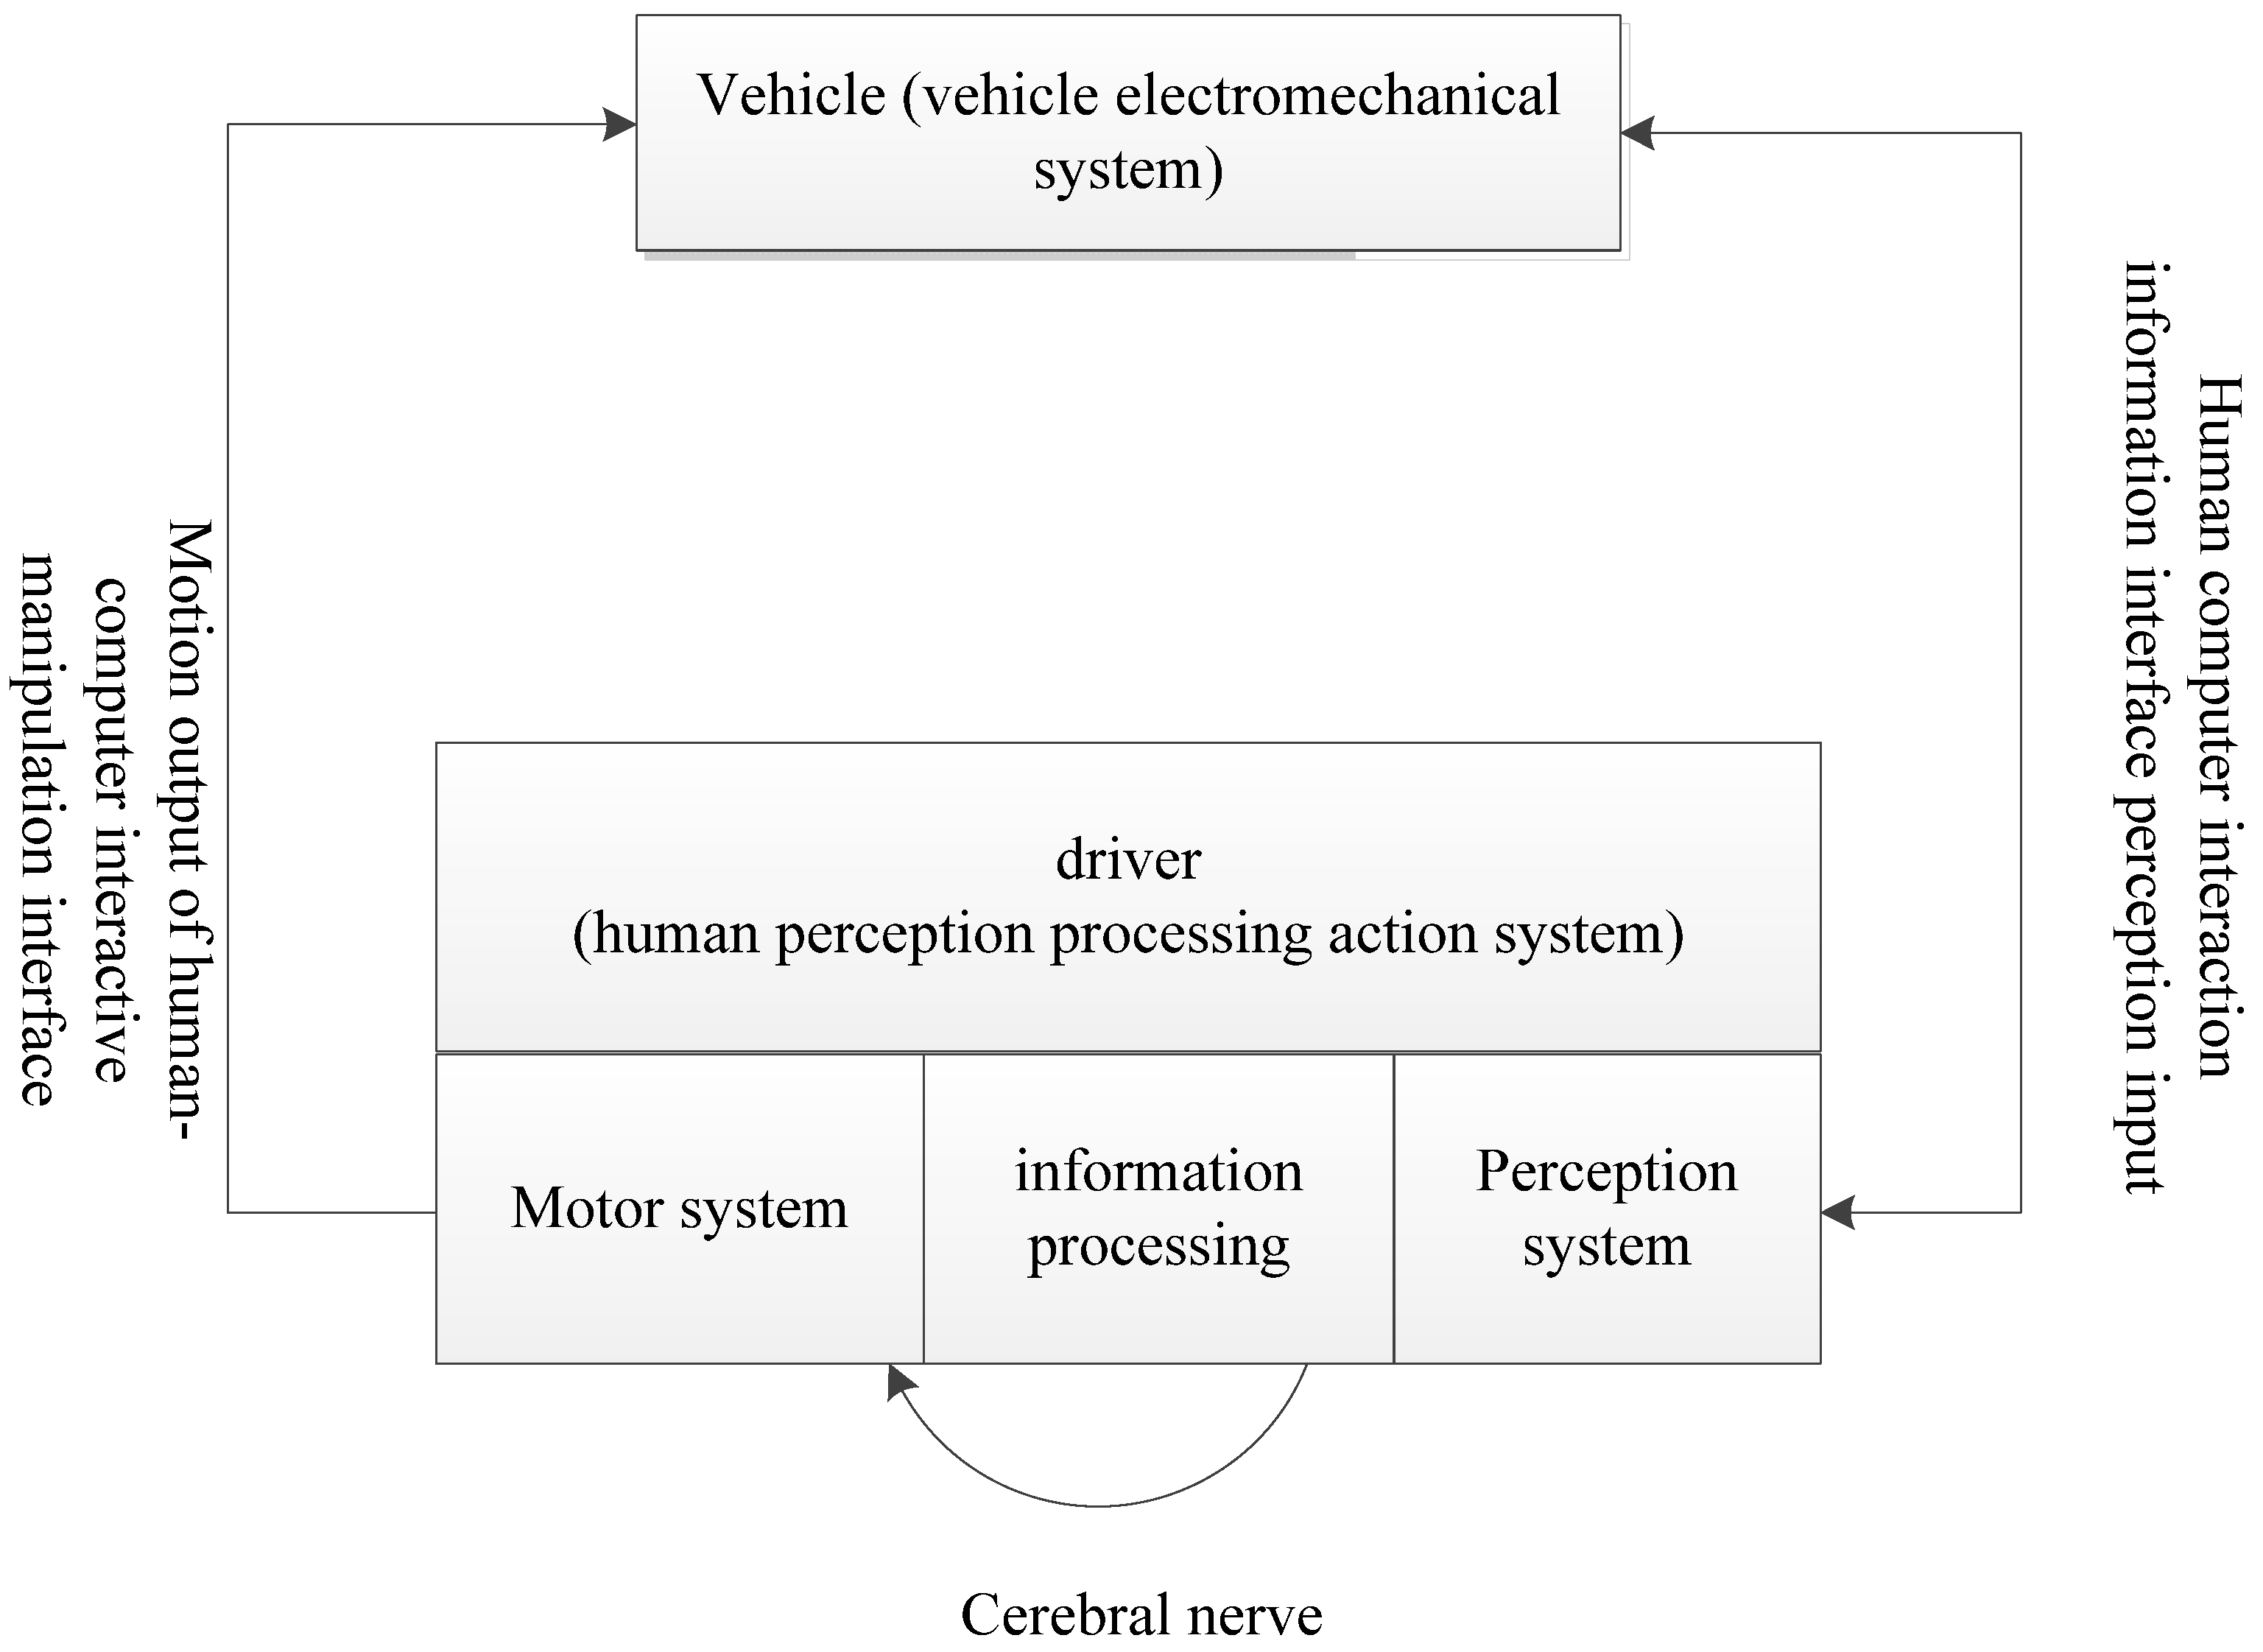
In the human–vehicle interaction system, the driver, as a complex human perception processing action system, has three basic functions in the interaction system: one is to complete the information input perception function through the human perception system, the other is to complete the information analysis, processing, storage, and processing function through the human brain nerve, and the third is to perform the manipulation and control of the vehicle through the human motion system. Figure 5 shows the interaction between man and vehicle system.
In the human–computer interaction system, according to the actual needs of the specific system, mathematical models will be used to describe the behavior of the operator, the response of the machine and the usability evaluation of the human–computer interaction interface.
Human behavior model: describing the function of human controller and modeling is a classic content of a man–machine system. The transfer function model is a quasi linear intuitive model proposed through human input/output. The transfer function expression is shown in Formula (1).
In the above formula, is the gain constant of the operator; Is the delay constant; is the lag time constant of neuromuscular system; and are the lead time and lag time constants of the manipulator, respectively. term can be regarded as the compensation network of the operator, which generally changes due to the characteristics of the controlled object. The item reflects the inherent characteristics of human beings. For some input/output semi-automatic control systems, using this quasi–linear transfer function model to describe human dynamic characteristics can obtain satisfactory results. The behavior model is used to guide the overall design. According to the characteristics of the operator’s compensation network, it can guide the form and expression of the system interface, so as to shorten the time and improve the information transmission efficiency of the man–machine interface.
Reaction time model: when the operator operates and monitors the equipment, there is a reaction time from the occurrence of information stimulation to taking corresponding actions. The length of reaction time is related to the reaction quantity. The reaction quantity is the reaction value of human sensory organs to the senses. It is the quantitative expression of the external physical and chemical quantities to the stimulation of human sensory organs. The reaction time is also related to the speed of the human brain’s transmission and processing of sensory information, and to the strength characteristics of the operator’s action. If is used to represent the control time of the operator, that is, the reaction time, then
In the above formula, is the latency of response, which means from the emergence of information stimulation to the transmission and processing of sensory information by the brain. This time is related to the state and intensity of equipment information and the processing speed of human brain. is the movement time, which indicates the delay time for the operator to realize the expected action, also known as the movement time. It is related to the biomechanical characteristics of the operator, and the shape and color of the operating mechanism. In order to respond as soon as possible, the latency and exercise time should be shortened.
According to the transfer function model and time model, the design of a human–computer interaction design interface needs to take the reaction time as the index. Because each person has different characteristics, the reaction time of a single operator cannot be used as the basis for the effect of the interactive interface. Multiple samples are selected for experiments, and different early warning values are set at the same time, so as to change the characteristics of the controlled object.
Evaluation model: The evaluation of multi-channel interface can be transformed into the comprehensive evaluation of interface state set , available channel set and human–computer interaction when realizing task set . From two aspects of interface performance and human-computer interaction, and using the weighted average method, the multi-channel interface can be quantitatively evaluated.
where is a finite set of states; is the set of interactive channels supported by ; is a set of tasks implemented in . evaluation value is the weighted average of interface performance evaluation value and human–computer interaction evaluation value.
Let be the evaluation weight of performance and be the evaluation weight of human–computer interaction:
is the evaluation value of interface performance , is the evaluation value of human–computer interaction when the user uses channel set to complete task set , and is the evaluation value of , then
Accordingly, the human–computer interaction design of IEV based on big data analysis is realized.
The pseudo code of interactive interface display design is as follows:

So far, the design of human-computer interaction method for intelligent electric vehicle is realized.
4. Experiment
4.1. Experimental Scheme
In order to ensure the implementation of the experiment, a personalized integrated controller with multi steering mode was built based on MATLAB/Simulink software, and the “b-class-hatcheback-2012” car model built in CarSim was transformed into a full line controlled electric vehicle. For this model, only the main parameters and structures related to control were modified here. The measured values of each parameter are shown in Table 1. In addition, the specific layout structure of the wheel assembly of the electric vehicle controlled by the whole line led to the limited vertical free travel of the suspension, so the suspension stiffness of the real vehicle was large. Here, the suspension stiffness of the original CarSim model was increased by 5%. Structurally, the four-wheel alignment parameters were set to zero to ensure that the wheel plane was perpendicular to the ground. Finally, the personalized integrated controller independently controlled the rotation angle and torque of the four wheels of the vehicle model.
Considering that the long-term mode requires long-term driving accumulation to produce effect, the long-term mode was solidified into three types: , “soothing”; , “general type”; , “Sports”, value is the reciprocal 1/15.7 of the linear estimated steering transmission ratio of CarSim built-in b-class-hatcheback-2012 hatchback car.
Therefore, in addition to the handling stability under various experimental conditions, the corresponding verification contents of mode effectiveness were as follows: the effectiveness of steering sensitivity of three long-term modes; the short-term mode under each long-term mode can adaptively adjust the steering sensitivity according to the steering intention and switch smoothly; The yaw response under various inputs should not be too complex, otherwise the driver cannot establish an internal model, which makes it difficult for the driver to master the steering characteristics of the vehicle. Therefore, the yaw response form is also the performance to be evaluated under each experiment. In order to form a contrast with the steering short effect mode, a fourth type of mode is added here: , , which belongs to the understeer vehicle under the “general” long-term mode, which is called “traditional vehicle”. The pavement conditions under each experiment are set as to fully verify the internal characteristics and performance of the vehicle system.
4.2. Experimental Result
In order to ensure the accuracy of the experimental analysis, the relevant experiments were carried out in the same experimental environment. The simulation software used was simulation, the system was Windows 10, the processor was 1 GHz, the available hard disk space was 16 GB, and the data set used in the experiment was 100–600 MB. The experimental analysis was carried out on this basis.
4.2.1. Human–Computer Interaction Response Time of an IEV
To verify the human-computer interaction efficiency of the design method in this paper, please compare it with the reference method [6]–reference method [8]. The comparison results are shown in Table 2.
It can be seen from Table 2 that when the number of participants is was 100, the human–computer interaction response time of the method in reference [6] was 122 ms, the human–computer interaction response times of the methods in reference [7,8] were 102 ms and 57 ms, respectively, and the human–computer interaction response time of the method in this paper was 5 ms. When the number of participants was 200, the human–computer interaction response time of the method in reference [6] was 156 ms, the human–computer interaction response times of the method in reference [7,8] were 128 ms and 64 ms, and the human–computer interaction response time of the design method in this paper was 8 ms. When the number of participants was 500, the response time of the human–computer interaction method was 286 ms, the responses time of the methods in references [7,8] were 189 ms and 92 ms, and the response time of the method designed in this paper was 15 ms. It can be seen that the human–computer interaction response of the design method proposed in this paper was far lower than that of other methods and had a higher response efficiency. This is because the method in this paper was based on a human–computer interaction mechanism to complete the design of an information interface and HUD interface and to establish the interaction model, which had a stronger pertinence and higher response efficiency.
4.2.2. Human–Computer Interaction Satisfaction of IEV
To verify the human–computer interaction satisfaction of this method, it as compared with reference method [6]–reference method [8], and the comparison results are shown in Table 3.
According to the analysis in Table 3, no matter how many people participate in the evaluation, the human–computer interaction satisfaction of the design method in this paper was always higher than that of the other two methods, up to 98%, while the highest satisfaction of the other three methods was only 79%, 76%, 86%, far lower than that of the design method in this paper, indicating that the interaction effect of the design method was good. The reason for this phenomenon is that the method first analyzed the human–computer interaction principle of intelligent electric vehicles, expounded the application of interaction in big data visualization, designed the cognitive mechanism of big data visualization interaction, and truly designed the cognitive mechanism of human–computer interaction from the perspective of customers.
5. Conclusions
In order to improve the human–computer interaction effect of intelligent electric vehicles, this paper designed the human–computer interaction method of an intelligent electric vehicle. First, the application of interaction in big data visualization was analyzed. According to the cognitive mechanism of big data visualization interaction, the information interface and HUD interface were designed, and the interaction model was established. So far, the method design of human–computer interaction of intelligent electric vehicles is was realized. The experimental results showed that the human-computer interaction response time of the design method was only 15 ms, and the human-computer interaction satisfaction was 98%, indicating that the design method had a good interaction effect, which has a certain prospect in improving the satisfaction of human–computer interaction effect of intelligent electric vehicles.
Author Contributions
Conceptualization, T.B.; Formal analysis, Y.G.; Investigation, S.L. and S.W.; Methodology, T.B.; Project administration, S.L.; Writing—original draft, T.B.; Writing—review and editing, T.B. All authors have read and agreed to the published version of the manuscript.
Funding
This research received no external funding.
Informed Consent Statement
Not applicable.
Data Availability Statement
All data generated or analyzed during this study are included in this published article.
Conflicts of Interest
The authors declare no conflict of interest.
References
- Liang, C.A.; Munson, S.A.; Kientz, J.A. Embracing four tensions in human-computer interaction research with marginalized people. ACM Trans. Comput.-Hum. Interact. (TOCHI) 2021, 28, 1–47. [Google Scholar] [CrossRef]
- Luo, Z.G.; Zhuo, X.R.; Che, Z.; Liang, Y.Q. Research on energy saving application of new energy vehicle air conditioner in human-computer interaction system. Refrigeration 2021, 40, 52–57. [Google Scholar]
- Liu, Z.G.; Hao, J.H.; Liu, N. Research on measurement method of vehicle human-computer interaction visual parameters. AutoParts 2020, 20, 83–87. [Google Scholar]
- Sun, D.W.; Guo, H.J.; Ding, M.Z.; Chen, Y. Research on interactive experience design of automobile digital interface for elderly users. J. Anhui Univ. Technol. Soc. Sci. Ed. 2020, 37, 52–55. [Google Scholar]
- Geng, Y. Research on human-computer interaction design of automobile center console based on safety principle. Mech. Eng. Autom. 2022, 16, 223–226. [Google Scholar]
- Fu, Q.; Fu, J.; Zhang, S.; Li, X.; Guo, J.; Guo, S. Design of intelligent human-computer interaction system for hard of hearing and non-disabled people. IEEE Sens. J. 2021, 21, 23471–23479. [Google Scholar] [CrossRef]
- Abosuliman, S.S.; Almagrabi, A.O. Computer vision assisted human computer interaction for logistics management using deep learning. Comput. Electr. Eng. 2021, 96, 107555. [Google Scholar] [CrossRef]
- Chen, Y.; Huang, Y.B.; Xie, J. Human computer interaction isolated gesture recognition model assisted by artificial intelligence. Comput. Simul. 2021, 3, 360–364. [Google Scholar]
- Zhang, Y. Computer-assisted human-computer interaction in visual communication. Comput.-Aided Des. Appl. 2020, 18, 109–119. [Google Scholar] [CrossRef]
- Wei, W.; Wu, J.; Zhu, C. Special issue on situation awareness in intelligent human-computer interaction for time critical decision making. IEEE Intell. Syst. 2020, 35, 3–5. [Google Scholar] [CrossRef]
- Aalund, R.; Diao, W.; Kong, L.; Pecht, M. Understanding the non-collision related battery safety risks in electric vehicles a case study in electric vehicle recalls and the LG Chem battery. IEEE Access 2021, 9, 89527–89532. [Google Scholar] [CrossRef]
- Mori, E.; Kelkar, S. Introduction to the special issue on interface architects: The evolution of human–computer interaction. IEEE Ann. Hist. Comput. 2020, 42, 6–7. [Google Scholar] [CrossRef]
- Pikhart, M. Human-computer interaction in foreign language learning applications: Applied linguistics viewpoint of mobile learning. Procedia Comput. Sci. 2021, 184, 92–98. [Google Scholar] [CrossRef]
- Sha, Y.; Feng, T.; Xiong, X.; Yang, T. Designing online psychological consultation expert system using human-computer interaction. Mob. Inf. Syst. 2021, 2021, 6458924. [Google Scholar] [CrossRef]
- Le, H.V.; Mayer, S.; Henze, N. Deep learning for human–computer interaction. Interactions 2020, 28, 78–82. [Google Scholar] [CrossRef]
- Yy, A.; Dm, B.; My, C. Human–computer interaction-based decision support system with applications in data mining. Future Gener. Comput. Syst. 2021, 114, 285–289. [Google Scholar]
- Sun, P.; Wu, D.; Liu, C. High-sensitivity tactile sensor based on Ti2C-PDMS sponge for wireless human–computer interaction. Nanotechnology 2021, 32, 295506. [Google Scholar] [CrossRef] [PubMed]
Figure 1.
Immersive somatosensory interaction.

Figure 2.
Three stages of information processing in mental space.

Figure 3.
Instrument panel layout.

Figure 4.
HUD display interface design rendering.

Figure 5.
Man–car system.


Table 1.
CarSim vehicle model parameters based on full line controlled electric vehicles.
| Parameter | Physical Meaning | Value |
|---|---|---|
| Vehicle mass (kg) (considering the driver’s mass) | 900 | |
| Sprung mass (kg) (considering the driver’s mass) | 817 | |
| Yaw moment of inertia (kg·m2) | 1169.1 | |
| Distance from front axle to centroid (m) | 1.103 | |
| Distance from rear axle to centroid (m) | 1.244 | |
| Rear track width (m) | 1.416 | |
| Rear track width (m) | 1.375 | |
| Centroid height (m) | 0.54 | |
| Cornering stiffness of each tire | (N/deg) − 2600 |
Table 2.
Human–computer interaction response time of an IEV.
| Data Set/MB | Human–Computer Interaction Response Time of IEV/ms | |||
|---|---|---|---|---|
| The Method of Reference [6] | The Method of Reference [7] | The Method of Reference [8] | The Method of This Paper | |
| 100 | 122 | 102 | 57 | 5 |
| 200 | 156 | 128 | 64 | 8 |
| 300 | 187 | 136 | 83 | 9 |
| 400 | 226 | 162 | 88 | 12 |
| 500 | 286 | 189 | 92 | 15 |
| 600 | 291 | 218 | 99 | 16 |
Publisher’s Note: MDPI stays neutral with regard to jurisdictional claims in published maps and institutional affiliations. |
© 2022 by the authors. Licensee MDPI, Basel, Switzerland. This article is an open access article distributed under the terms and conditions of the Creative Commons Attribution (CC BY) license (https://creativecommons.org/licenses/by/4.0/).
Share and Cite
MDPI and ACS Style
Ba, T.; Li, S.; Gao, Y.; Wang, S. Design of a Human–Computer Interaction Method for Intelligent Electric Vehicles. World Electr. Veh. J. 2022, 13, 179. https://doi.org/10.3390/wevj13100179
AMA Style
Ba T, Li S, Gao Y, Wang S. Design of a Human–Computer Interaction Method for Intelligent Electric Vehicles. World Electric Vehicle Journal. 2022; 13(10):179. https://doi.org/10.3390/wevj13100179
Chicago/Turabian StyleBa, Tao, Shan Li, Ying Gao, and Shijun Wang. 2022. "Design of a Human–Computer Interaction Method for Intelligent Electric Vehicles" World Electric Vehicle Journal 13, no. 10: 179. https://doi.org/10.3390/wevj13100179