Article

Geographic Distribution of Registered Packaged Water Production in Ghana: Implications for Piped Supplies, Groundwater Management and Product Transportation

1
Ghana School of Public Health, University of Ghana, Legon, Accra, Ghana
2
British Geological Survey, Maclean Building, Wallingford OX10 8BB, UK
3
Geography and Environment, University of Southampton, Highfield, Southampton SO17 1BJ, UK
*
Author to whom correspondence should be addressed.
Water 2017, 9(2), 142; https://doi.org/10.3390/w9020142
Submission received: 9 December 2016 / Accepted: 16 February 2017 / Published: 21 February 2017

Abstract

:
Packaged water consumption has grown rapidly in urban areas of many low-income and middle-income countries, but particularly in Ghana. However, the sources of water used by this growing packaged water industry and the implications for water resource management and transport-related environmental impacts have not been described. This study aimed to assess the spatial distribution of regulated packaged water production in Ghana, both in relation to demand for natural mineral water and hydrogeological characteristics. A total of 764 addresses for premises licensed to produce packaged water from 2009 to 2015 were mapped and compared to regional sachet water consumption and examined beverage import/export data. We found evidence to suggest that packaged water is transported shorter distances in Ghana than in developed countries. Groundwater abstraction for packaged water is low relative to piped water production and domestic borehole abstraction nationally, but may be locally significant. For natural mineral water, producers should be able to address the most widespread water quality hazards (including high salinity, iron and nitrates) in aquifers used for production through reverse osmosis treatment. In future, packaged water producer surveys could be used to quantify unregulated production, volumes of piped versus groundwater abstracted and treatment processes used.

1. Introduction

With a projected increase in the urban African population of over 300 million between 2010 and 2030 [1], supplying water services to the region’s growing cities remains a priority. Although the proportion of urban population using improved water sources rose from 83% to 87% between 1990 and 2015 in urban sub-Saharan Africa [2], many African cities became reliant on increasingly distant rivers and groundwater bodies to meet demand for piped water during the 1990s [3]. More generally, the water demands of megacities can extend far into surrounding agricultural areas [4]. Alongside the piped water demand from urban populations being met by more distant sources, consumption of packaged water (i.e., water sold in bottles or plastic bags) has also grown in low-income and middle-income countries [5], particularly in urban areas [6]. However, most studies of packaged drinking water in low-income and middle-income countries have focussed on quality and consumption (e.g., [7,8]) or management of plastic waste generated [9,10] and far fewer on production [11,12]. The scale and implications of this emerging urban packaged water demand in terms of water resource management in the hinterlands of cities therefore remain unclear.
There is similarly little evidence on the environmental impact of the packaged water industry in low-income and middle-income countries. In the USA, however, environmental impact studies suggest that whilst bottled tap water may be produced close to urban centres, natural mineral water products marketed as “spring water” may be transported much longer distances from pristine environments, increasing the energy required to meet demand [13]. These studies indicate that long-distance transportation of packaged water can generate energy costs comparable to or exceeding those from production [13]. Under the Millennium Development Goals [14], depending on specific circumstances affecting individual countries, packaged water was sometimes considered unsustainable and therefore an “unimproved” water source in monitoring safe water access. Quantification of the spatial distribution of packaged water production could thus help inform policy surrounding this growing industry through better understanding of transportation-related environmental impacts. It could also provide insights into the water-related challenges faced by an industry that consumers increasingly depend on.
Given this context, this study aims firstly to identify and compare the spatial distribution of packaged water production licenses issued by the two regulatory bodies in Ghana. Secondly, we aim to examine the distances packaged water is transported in Ghana by analysing regional regulated production relative to consumption, as well as packaged water imports. Finally, we aim to assess the industry’s contribution to groundwater abstraction and related water quality issues affecting raw groundwater. In doing so, we seek to identify knowledge gaps in understanding packaged water production patterns that cannot be answered using available secondary data resources and require further primary data collection and fieldwork.

2. Materials and Methods

2.1. Packaged Water Production and Hydrogeology in Ghana

In Ghana, packaged water in the form of 500 mL filled bags or “sachets” is now widely consumed, with 43.1% of urban households reporting it as their main drinking water source in 2014 [15]. This is an increase from 15.2% in 2008 [16] and 3.0% in 2003. Despite Ghana′s packaged water industry now being the main drinking water supply source for almost half of urban consumers, the origins of the water supplied remain unclear. The industry is regulated by the Ghana Standards Authority (GSA) and Food and Drugs Authority (FDA) [11]. The FDA regulates sachet production via producer inspection and registration, mandatory since 2012 [17]. To register facilities, the FDA reviews production system details, employee health certificates, and proposed primary packaging labels provided by producers. The FDA then tests water, and conducts annual routine inspection visits as well as up to three unscheduled visits to production facilities per year. The GSA is responsible for the standards used by the FDA. The GSA is responsible for two standards, with a more stringent standard covering production of natural mineral water (Ghana Standard 220; GS220) “obtained directly from natural or drilled sources from underground water-bearing strata” [18]. Such waters should be collected under conditions that guarantee their purity and a prescribed chemical composition. A second standard (Ghana Standard 175; GS175) covers other forms of packaged water, notably packaged tap water, but also groundwater that may not meet mineral water requirements [19]. The GSA also authorises voluntary use of its Mark of Conformity (“seal”) by producers. To use its seal, which is widely recognized by consumers, the GSA requires producers to purchase relevant standards documents and present copies of business registration certificates and packaging samples. The GSA then inspects facilities and product safety management documentation, and tests water samples. Thus, in summary, there is a voluntary producer registration system run by the GSA and a similar but mandatory system run by the FDA. An unknown proportion of small-scale producers, known as “abalowe”, remain unregistered in both systems [20]. Regulation of groundwater abstraction is the responsibility of the Water Resources Commission (WRC) [21], whilst tariffs for commercial users of piped water are set by the Public Utilities Regulatory Commission.
The extent of groundwater versus piped use for sachet water production in Ghana is currently unknown, but has been debated in media reports [22]. Some groundwater is used for both regulated [18] and unregulated sachet water supply in Ghana [23]. Tariffs for packaged water producers using piped water from the national piped water utility, the Ghana Water Company Ltd, have become more expensive relative to other commercial users. In 2005, commercial users across all sectors paid the same piped water tariff of 6911 Ghanaian Cedi (GH₵GH₵) ($0.78 USD)/1000 L [24]. In September 2006, a special tariff of 20,375 GH₵ ($2.25 USD)/1000 L was introduced specifically for packaged water producers, 2.5 times the rate paid by other commercial users (8150 GH₵ ($0.90 USD)/1000 L) [25]. By July 2016, the packaged water producer tariff was 50.79 GH₵ ($12.84 USD)/1000 L, 6.1 times the rate paid by other commercial users (8.36 GH₵ ($2.11 USD)/1000 L) [26]. Thus, since 2006 tariff structures have increasingly discouraged packaging of piped water, although there remains no evidence on yearly trends in packaged water production from piped versus groundwater.
Ghana can be divided into two main and two minor hydrogeological units. The major units include the basement complex which covers 54% of the country and dominates western Ghana and comprises: (1) Lower Proterozoic volcanics and metasediments of the Birimian system and Middle Proterozoic sediments of the Tarkwaian system; and (2) the Mobile Belt of the Dahomeyan system (gneiss), the Togo series (quartzite, schist and silicified limestone) and Buem formation (argillaceous and volcanic sediments) [27]. The second major unit is the Voltaian system which covers 45% of the country in central and eastern Ghana. This comprises Proterozoic–Palaeozoic sedimentary formations including sandstones, shales, mudstones and conglomerates. The first minor unit comprises three coastal aquifers of Cenozoic and Mesozoic sediments: (1) recent sand deposits with thin freshwater lenses; (2) sandy clay Red Continental deposits which usually contain saline water; and (3) Cretaceous limestone at a depth of 100 m usually containing freshwater [28]. The second minor unit includes recent alluvial sand and gravel deposits, which are locally important [29]. Average borehole yields are highest for the Birimian units of the basement complex and the coastal and alluvial units (3.3–4.3 L/s) [30] and lowest for the Dahomeyan units of the basement complex (typically < 1 L/s). Borehole success rates follow similar patterns and both borehole success rates and yields vary considerably within and between hydrogeological units and sub-units [29].
Although groundwater is considered to be of generally good quality in Ghana [29], high total dissolved solids up to 2000 mg/L are found in the shallow groundwaters in the Keta basin and the Accra plains and these coastal aquifers are particularly vulnerable to overpumping and saline intrusion [31]. High fluoride concentrations up to 5 mg/L are found in some groundwaters in north-west and north-eastern granitic and volcanic terrains [32], whilst elevated arsenic concentrations (up to 141 μg/L) are reported in the Birimian basement aquifers [33]. The most widespread issue is high iron, over 60 mg/L in some instances, affecting up to a third of boreholes drilled in Ghana [29]. In some instances, the high iron is thought to originate from corrosive groundwaters reacting with borehole casing and other pump components. High nitrate and microbiological contamination of shallow groundwater sources in urban and rural settings is a widespread threat to drinking water quality [34].

2.2. Data

To assess domestic packaged water production, records were obtained of sachet and bottled water producers registered with the GSA nationally and with the FDA in the Greater Accra region. GSA records covered the period December 2009 to October 2015 and were drawn from published lists of registered producers, e.g., [35], whilst the FDA provided records directly for currently registered producers only, as of June 2016. Imported and exported volumes of unsweetened beverage waters and ice from 1996 to 2013 as reported by the Government of Ghana were also downloaded from the United Nations Comtrade international trade statistics database [36]. We chose UN Comtrade over other trade databases (e.g., the World Trade Organization’s Integrated Database) because of its greater country and period coverage [37]. We examined imports reported by Ghana, since imports are typically recorded more accurately than exports, as imports generate tariff revenues while exports do not.
Data from the 2012–2013 Ghana Living Standards Survey Round 6 (GLSS6) were used to assess the regional pattern of sachet consumption. The GLSS6 was designed to be nationally and regionally representative, sampling 1200 enumeration areas (EAs) from within 10 regions using probability-proportional-to-population size. Those living in individual households were included in the survey, whilst institutional populations living in schools, hospitals, etc., were excluded. Within each selected EA, 15 households were systematically selected, giving an overall sample size of 18,000 households. The GLSS6 included a question that asked selected households about packaged water purchases. Following an initial visit, GLSS6 teams made six separate weekly follow-up visits and asked about water purchases since the last visit.

2.3. Data Pre-Processing and Analysis

To map packaged water manufacturing, addresses or place-names for manufacturers from these sources were geocoded using the Google Maps Application Programming Interface (API), version 2 (Mountain View, CA, USA). Where addresses or placenames could not be found using this API, they were geocoded using the MapQuest API (Denver, CO, USA) to the OpenStreetMap global database (OpenStreetMap Foundation, Sutton Coldfield, West Midlands, UK) via the geocodeopen tool in Stata v13 (StataCorp, College Station, TX, USA). Manual searches in Google Maps were subsequently used to review any remaining place names or addresses lacking coordinates. Since GSA registration is voluntary whereas FDA registration is compulsory, we mapped the spatial distribution of producers registered with the two bodies separately to identify potential differences. To assess whether there were differences in the geographic distribution of natural mineral water producers versus other packaged water producers, we performed separate kernel density estimation on the resultant geocoded locations for these two groups. We used a quartic kernel function [38] and a bandwidth derived from the standard and median distance to the producer-weighted mean centre of the pooled locations.
In the Ghanaian GLSS6, packaged water expenditure and unit prices were recorded, so daily volumes purchased were calculated by dividing expenditure by the appropriate price. Units of sale for sachets are standard across Ghana and were either 500 mL for individual sachet purchases or bulk purchases of 15 L sachet “bags” (comprising 30 mL × 500 mL sachets). We then calculated the total volumes purchased by region in 2012–2013 using the Stata svy set of commands to account for the multi-stage sample design. Total packaged water consumption by region was then compared graphically to the number of GSA licences granted for packaged and natural mineral water combined. We also compared total national packaged water consumption from the GLSS6 to imported water beverages, as reported through the UN Comtrade database.

3. Results

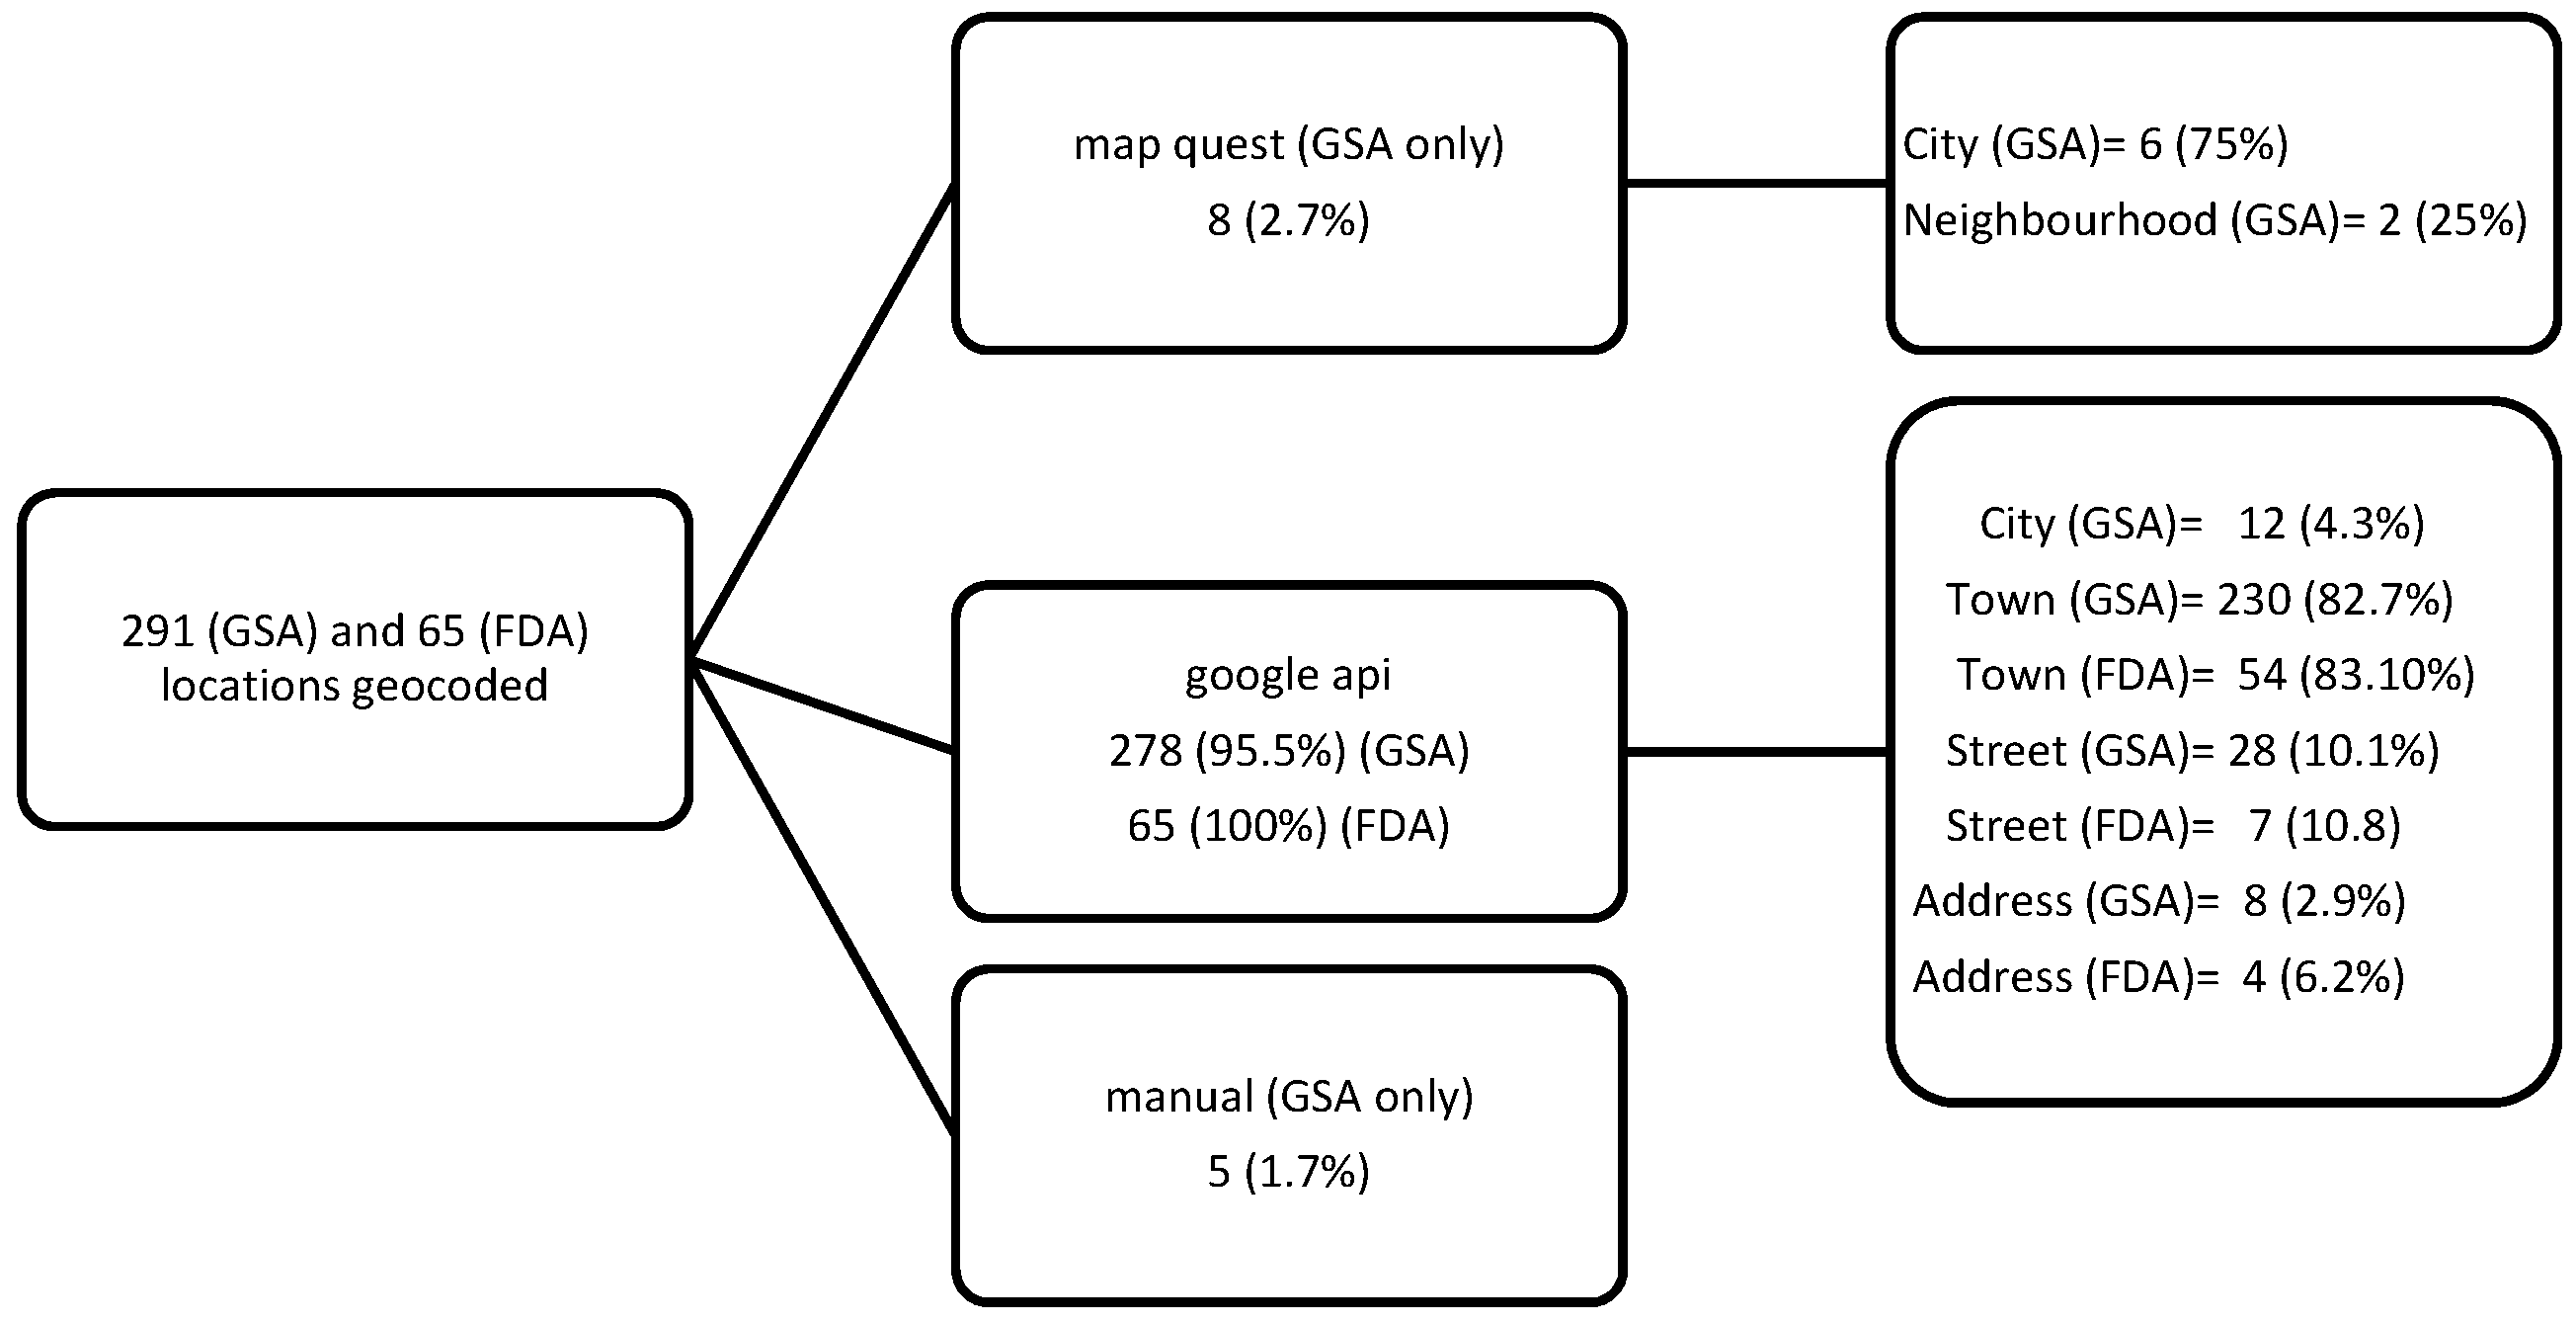
3.1. Geocoding and Characteristics of Registered Packaged Water Production

In total, there were 764 instances of manufacturers registering with the GSA. These instances related to 291 locations, of which 278 were geocoded using the Google Maps API and the remainder either via the MapQuest API or manually (Figure 1). All were geocoded to at least the city level and the majority to the town or neighbourhood level, with only eight being geocoded to address level. The FDA records contained 180 manufacturers in 65 locations across the Greater Accra Region. The locations were all geocoded with Google Maps API to town level or higher precision (Figure 1).
More licences were granted by the GSA for production of bagged (sachet) water than for bottled water (Table 1), with more licences granted under packaged water than for the mineral water standard. As of June 2016, the FDA had similarly granted more licences (116; 64.4%) for packaged water than mineral water.

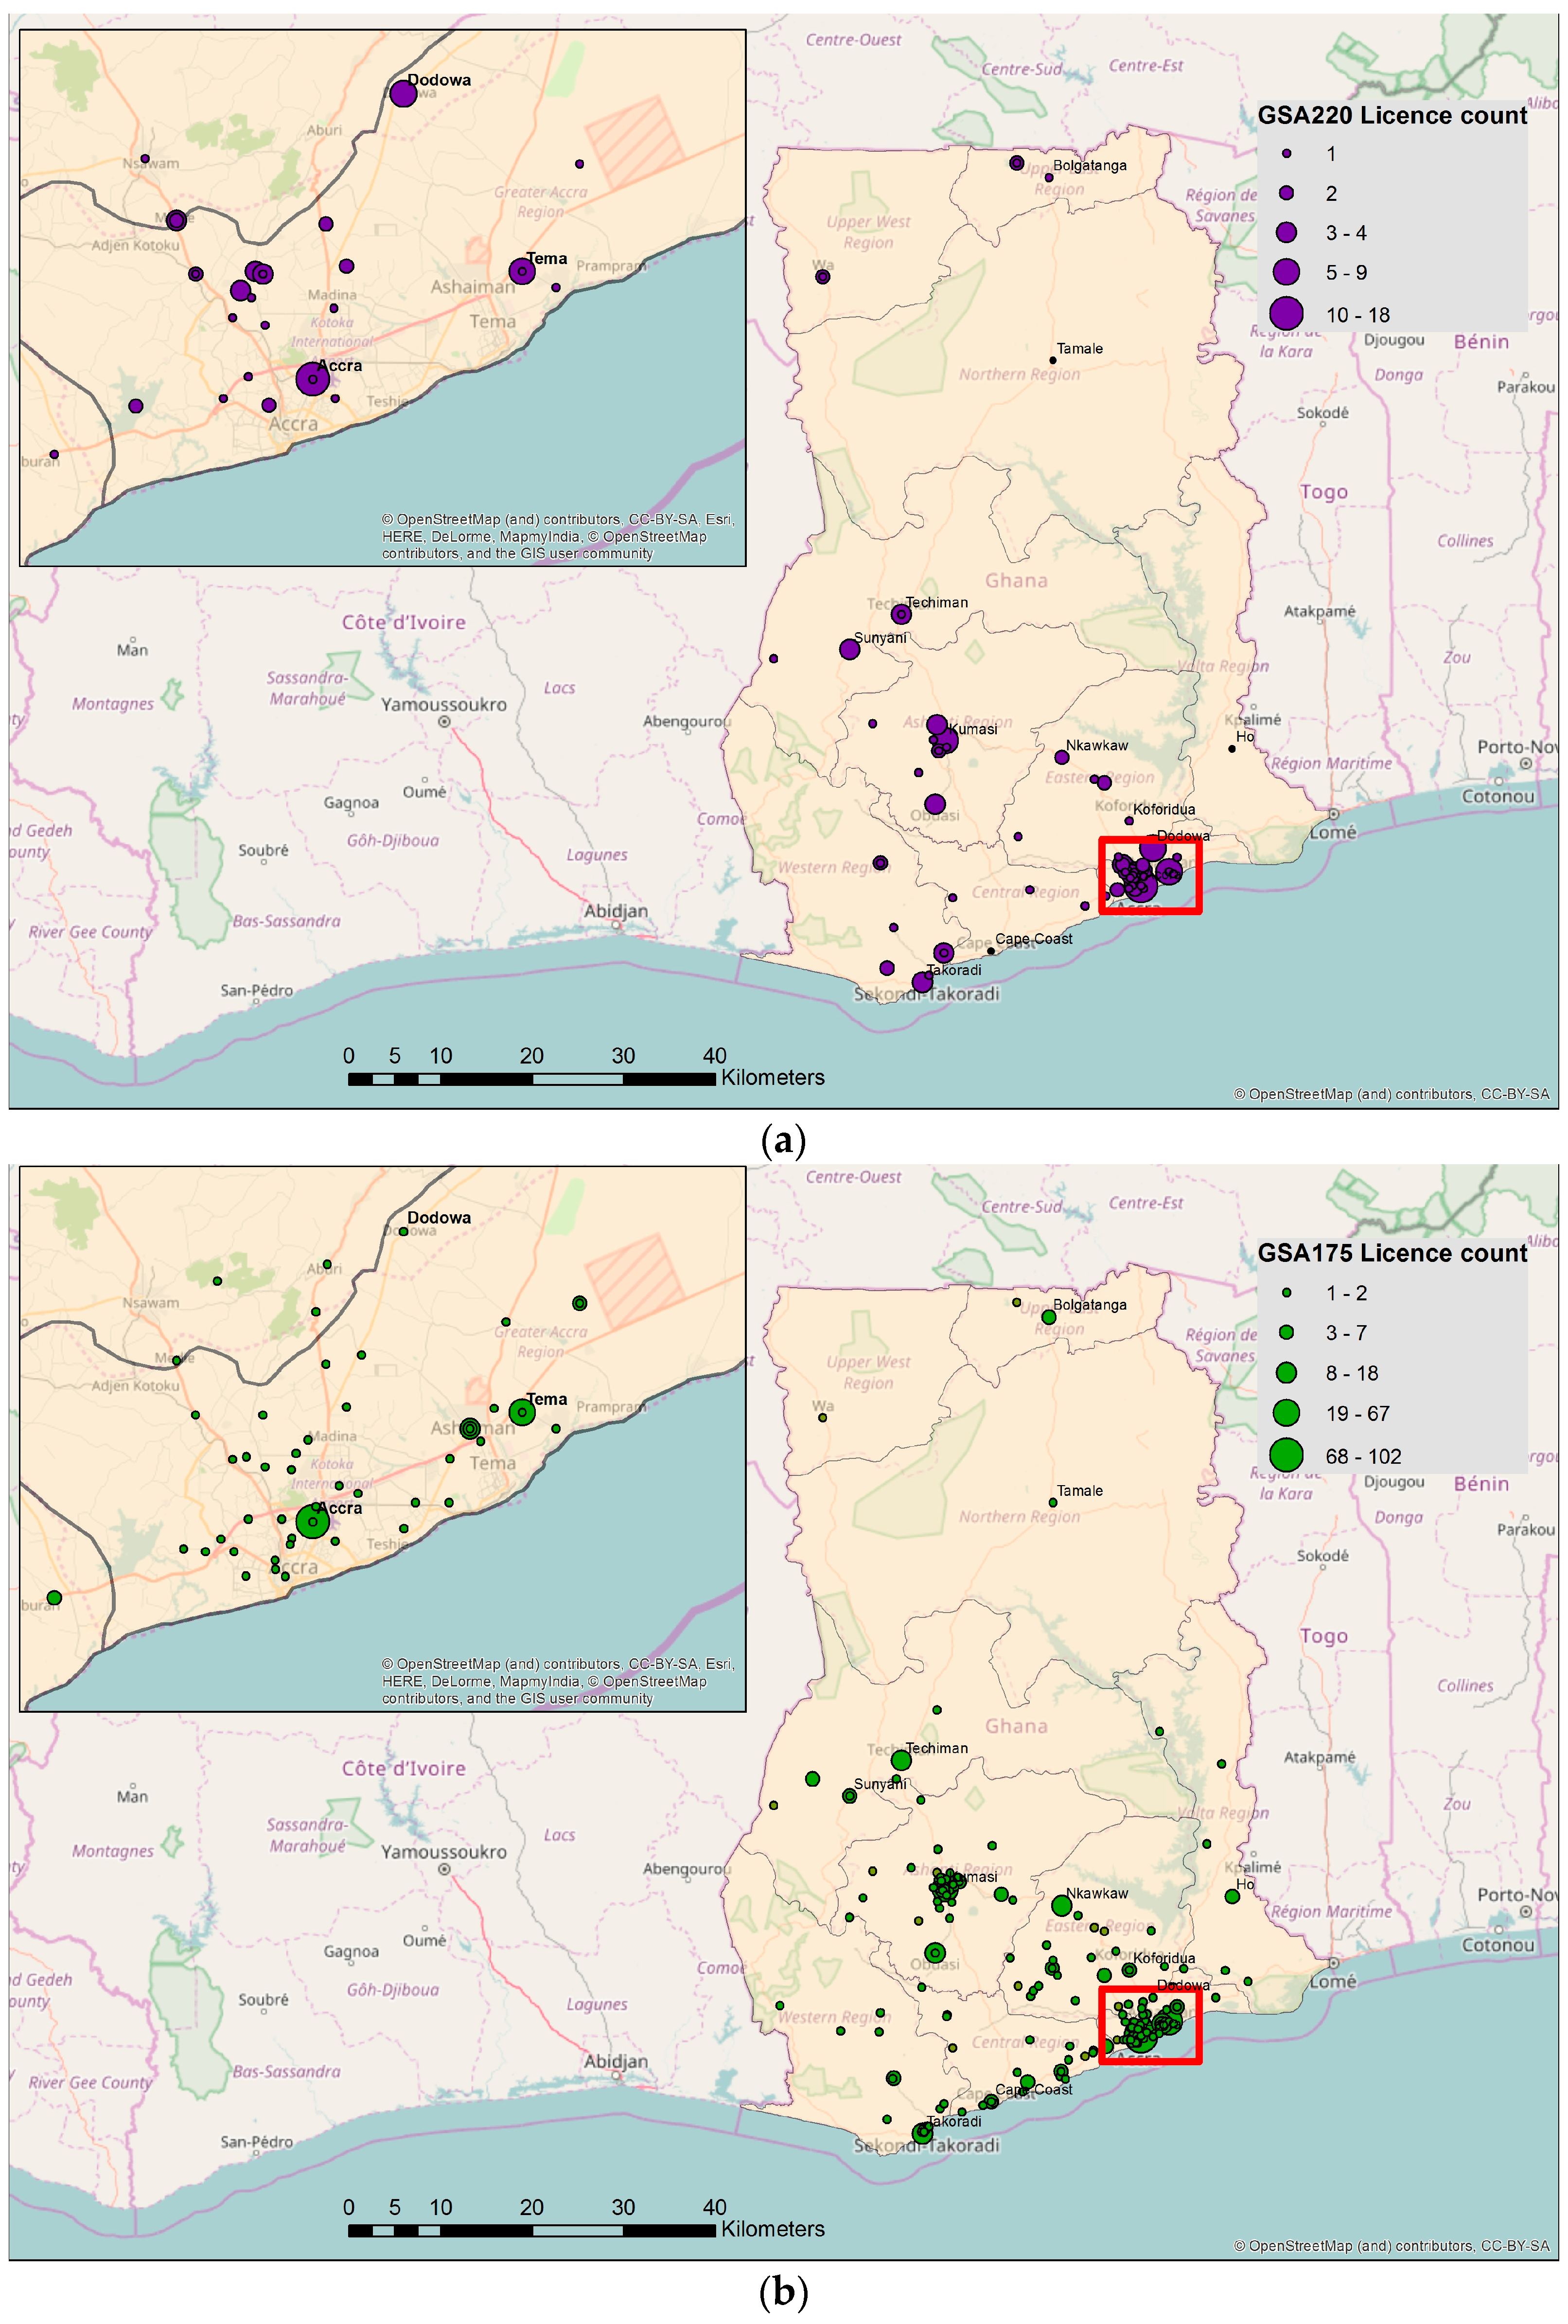
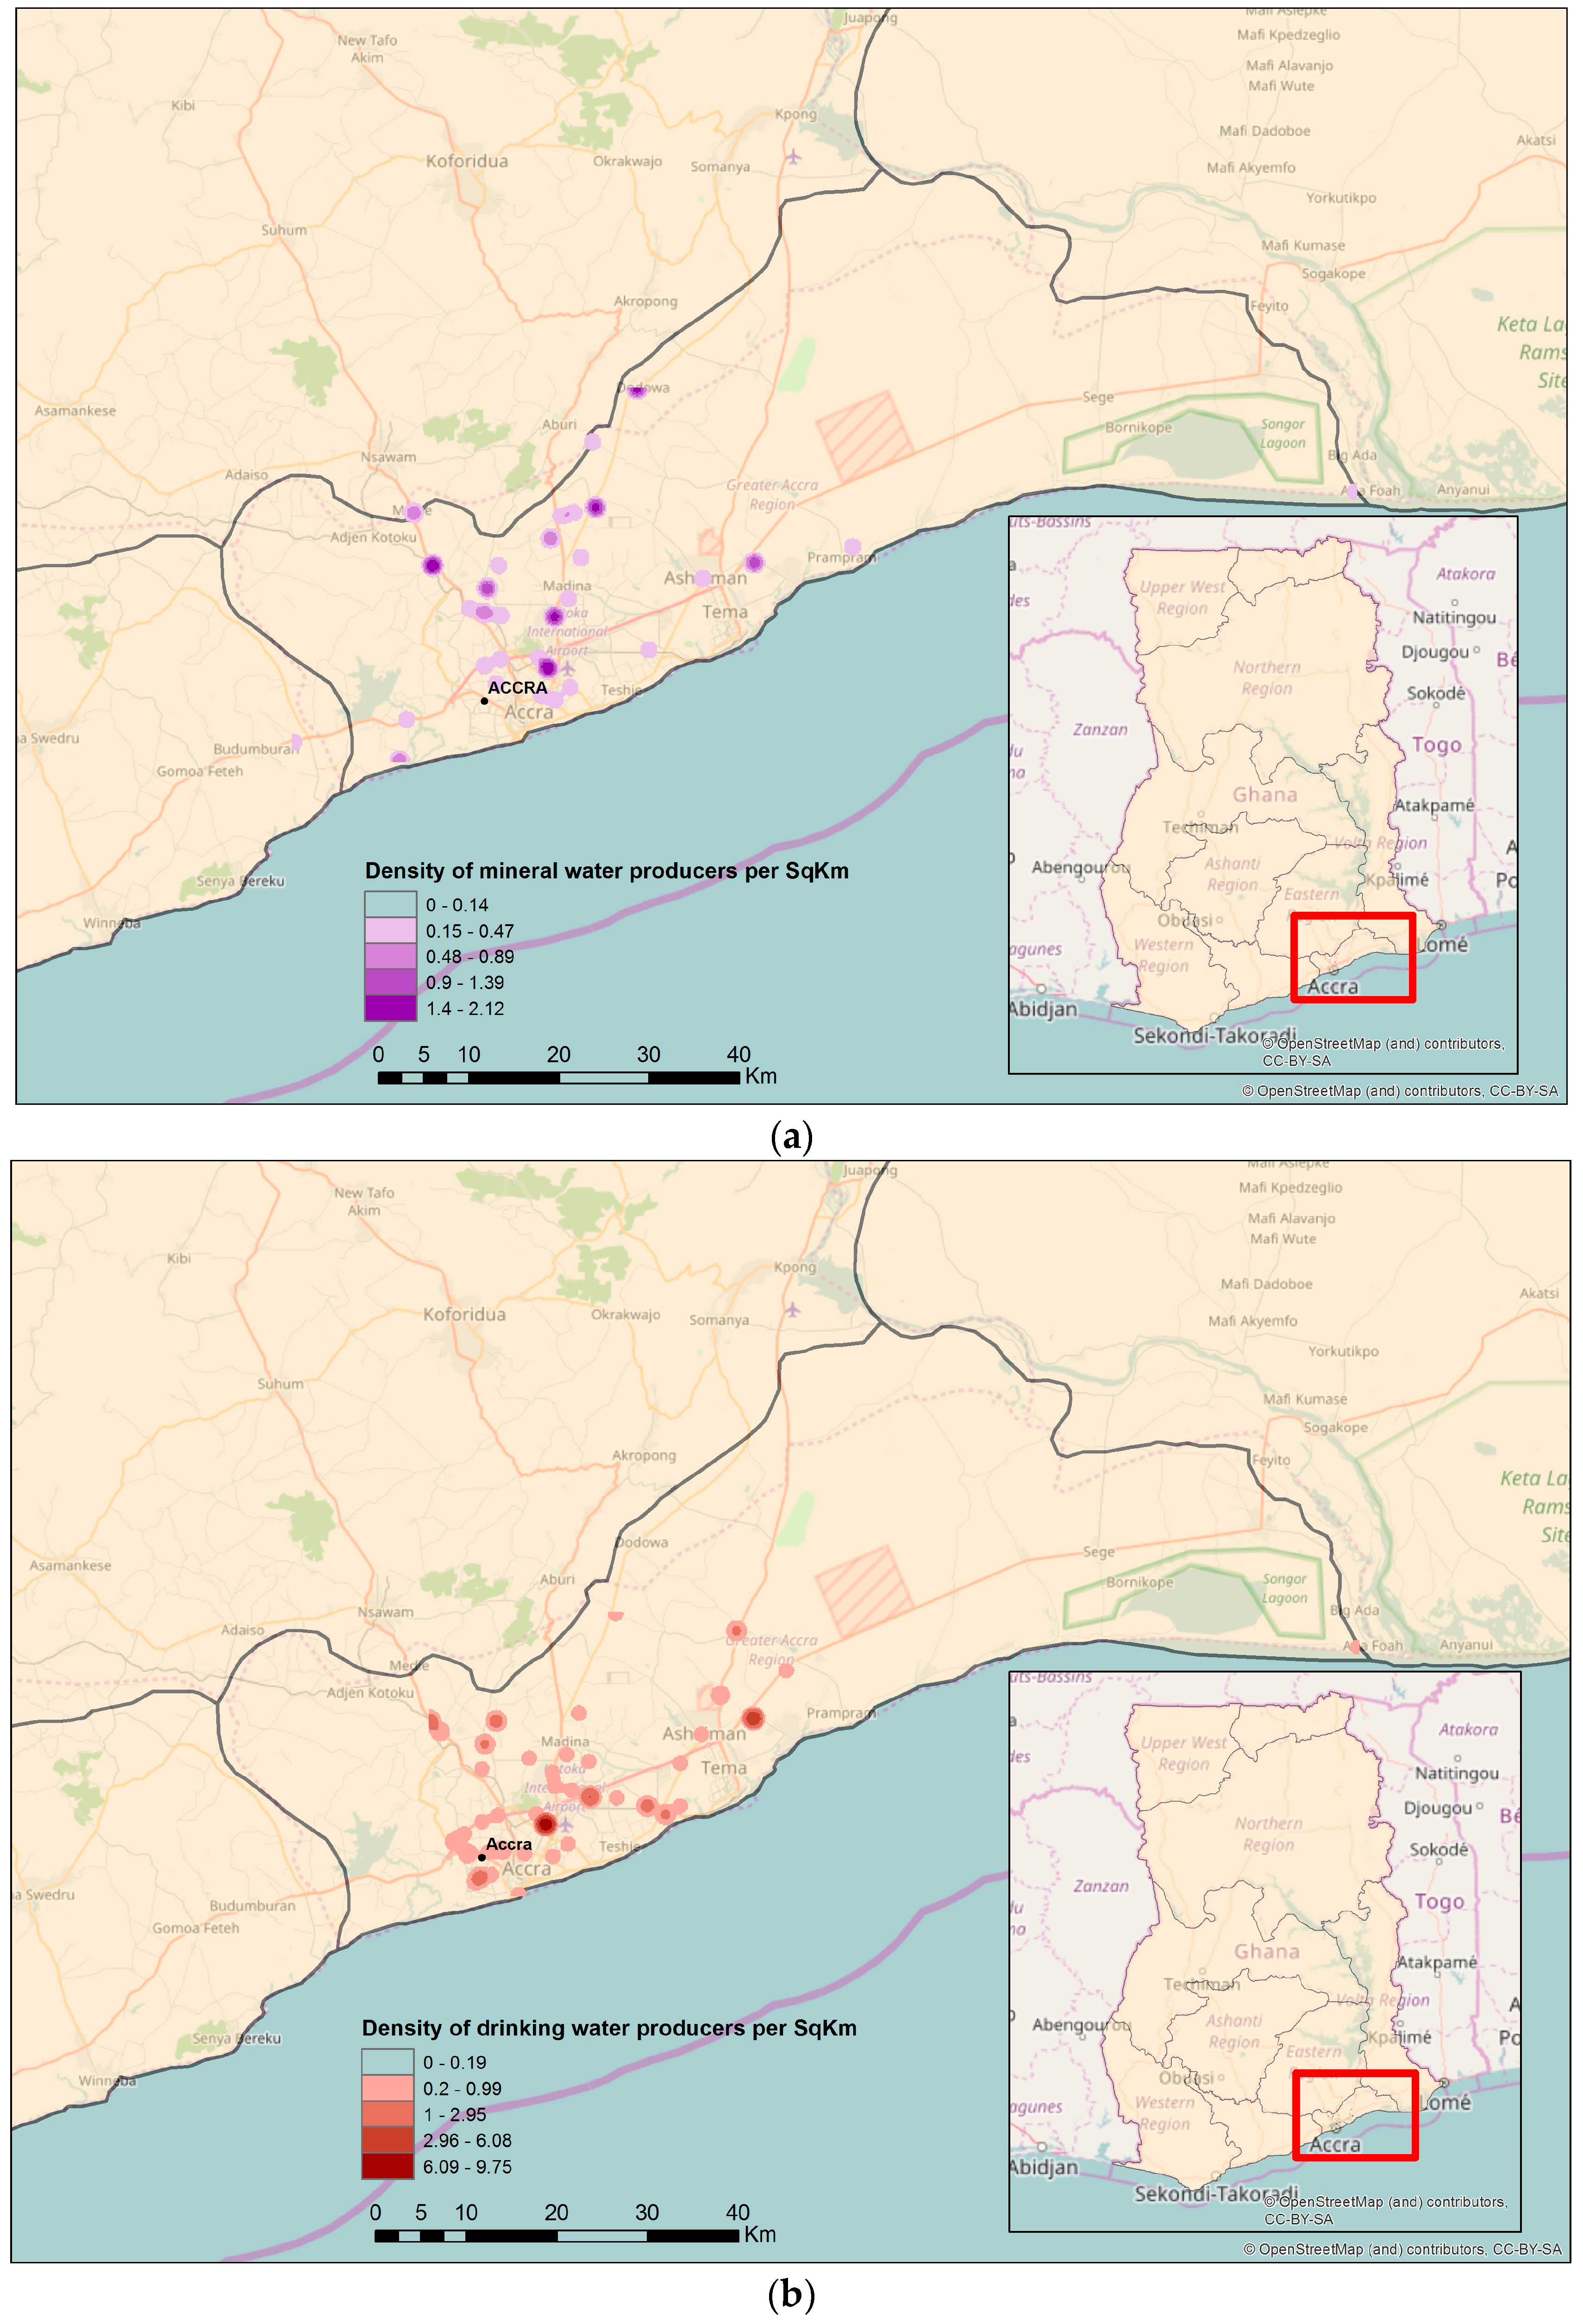
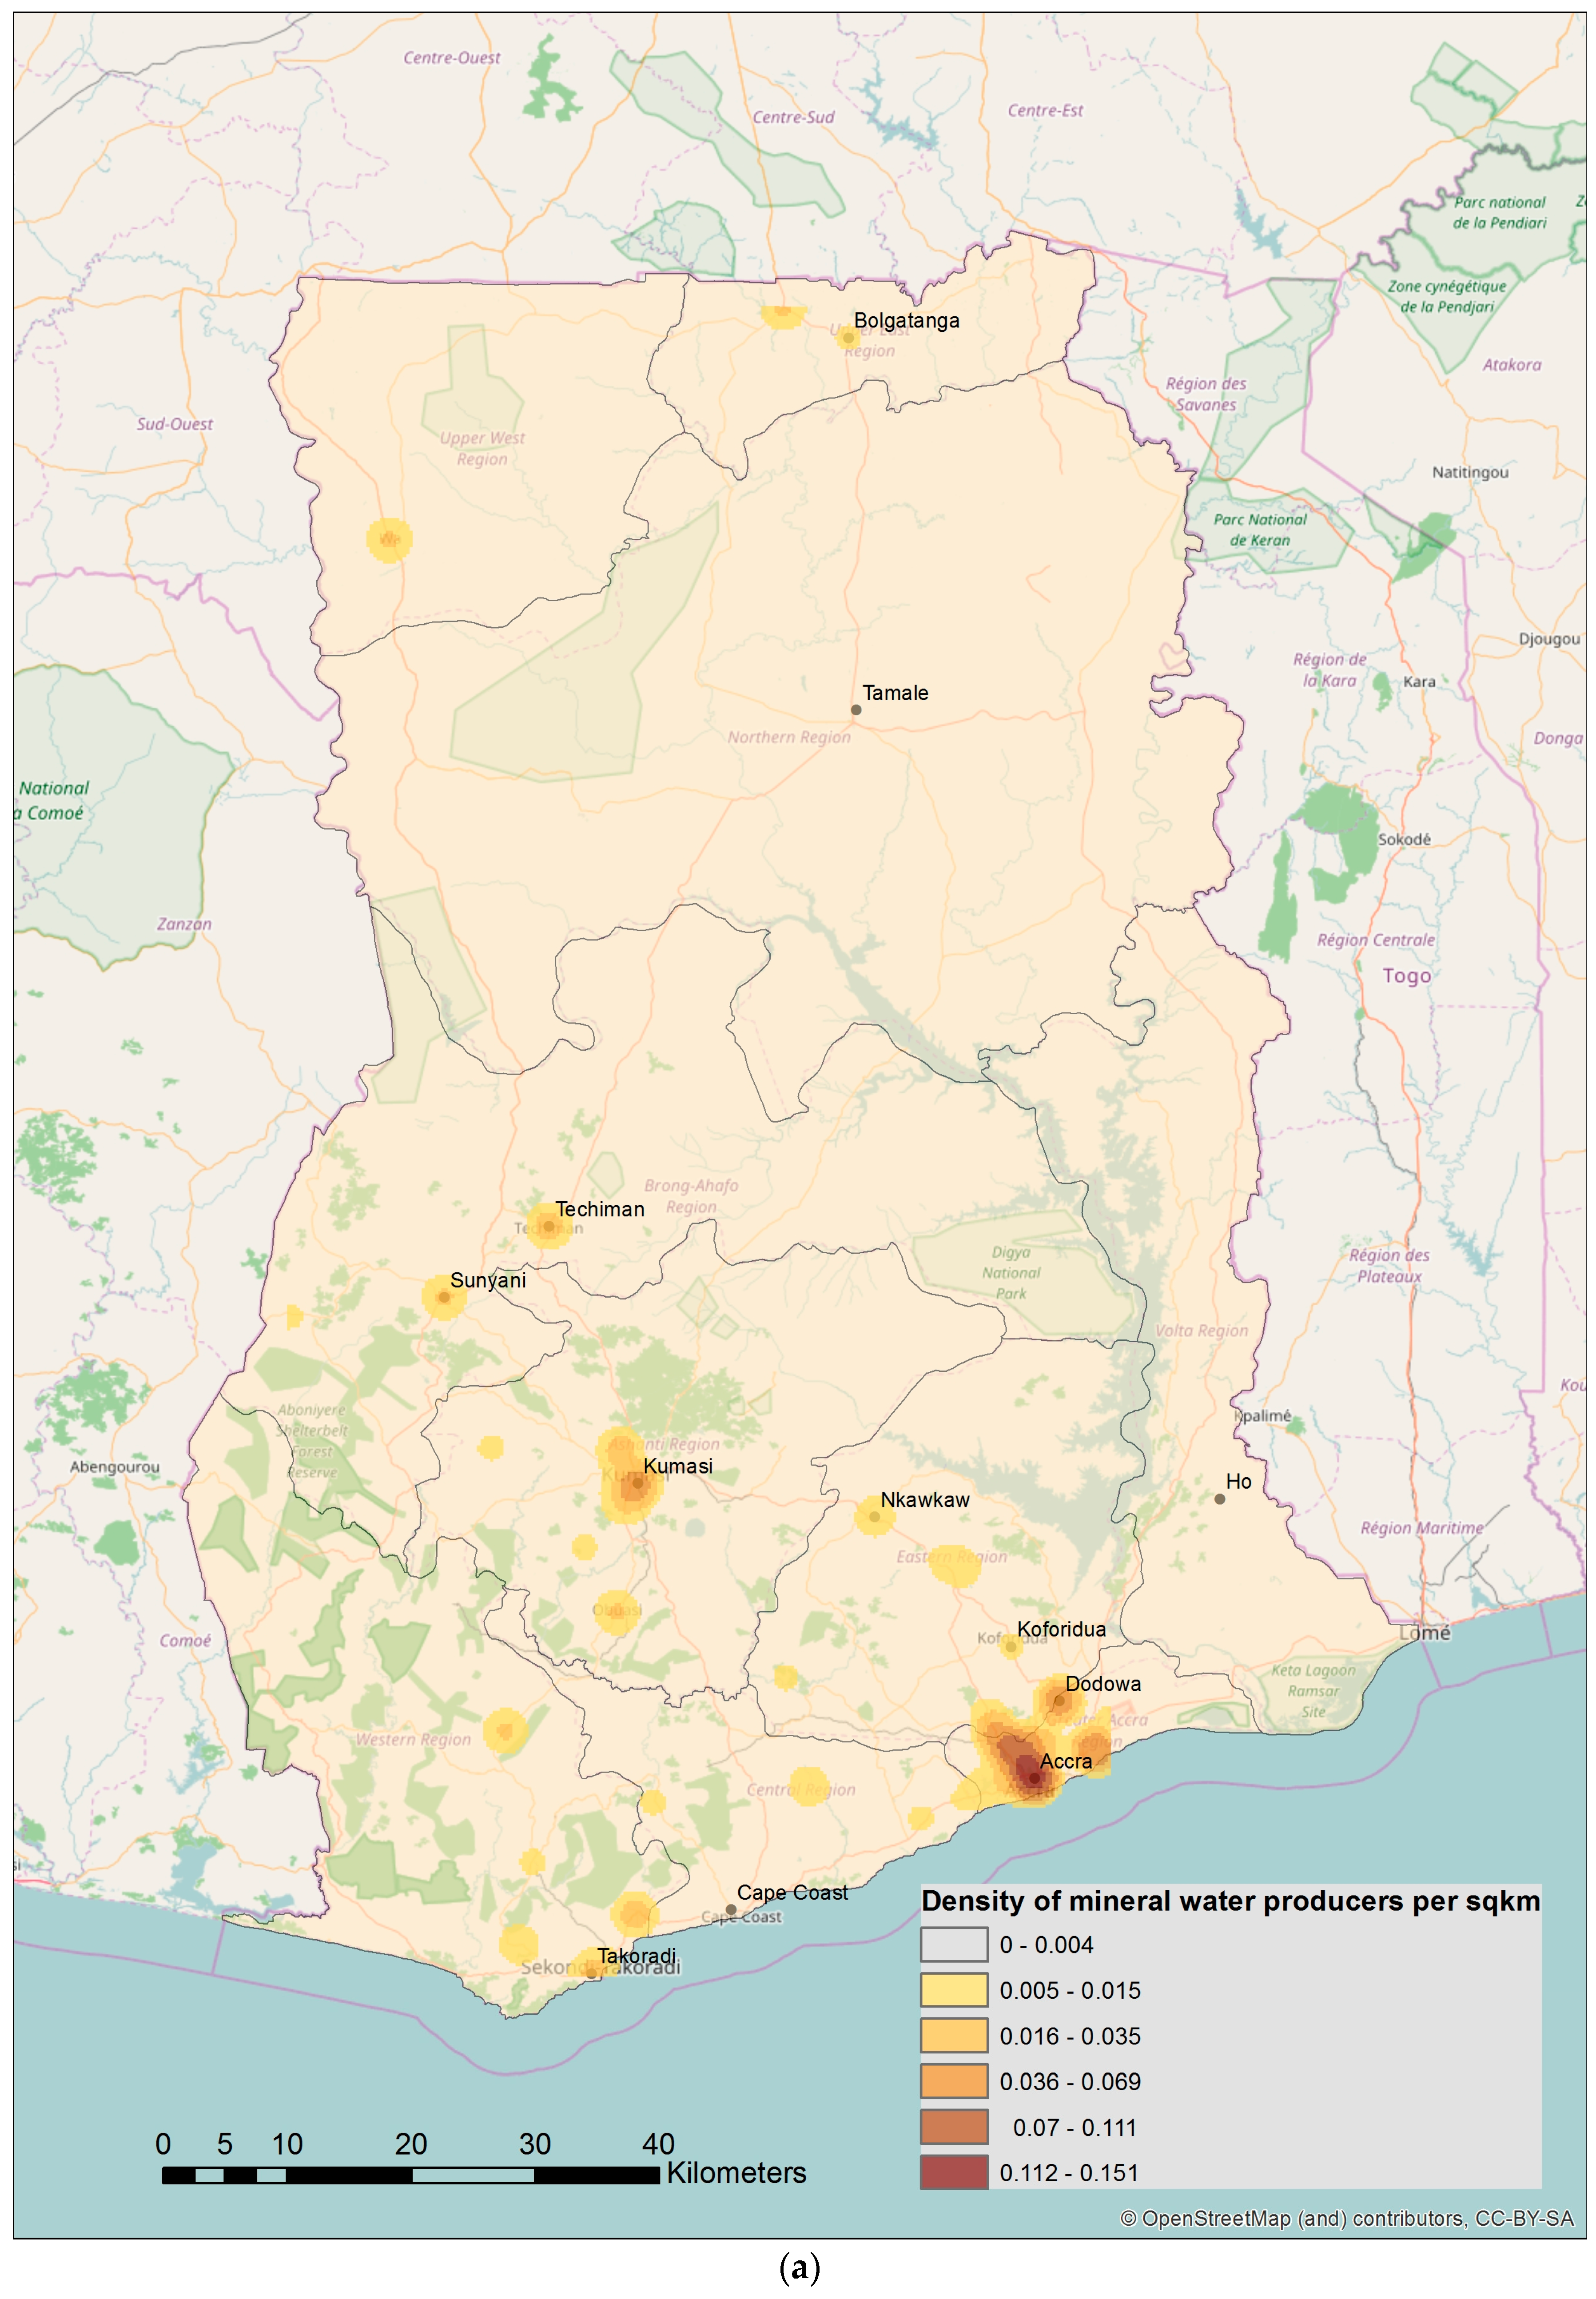
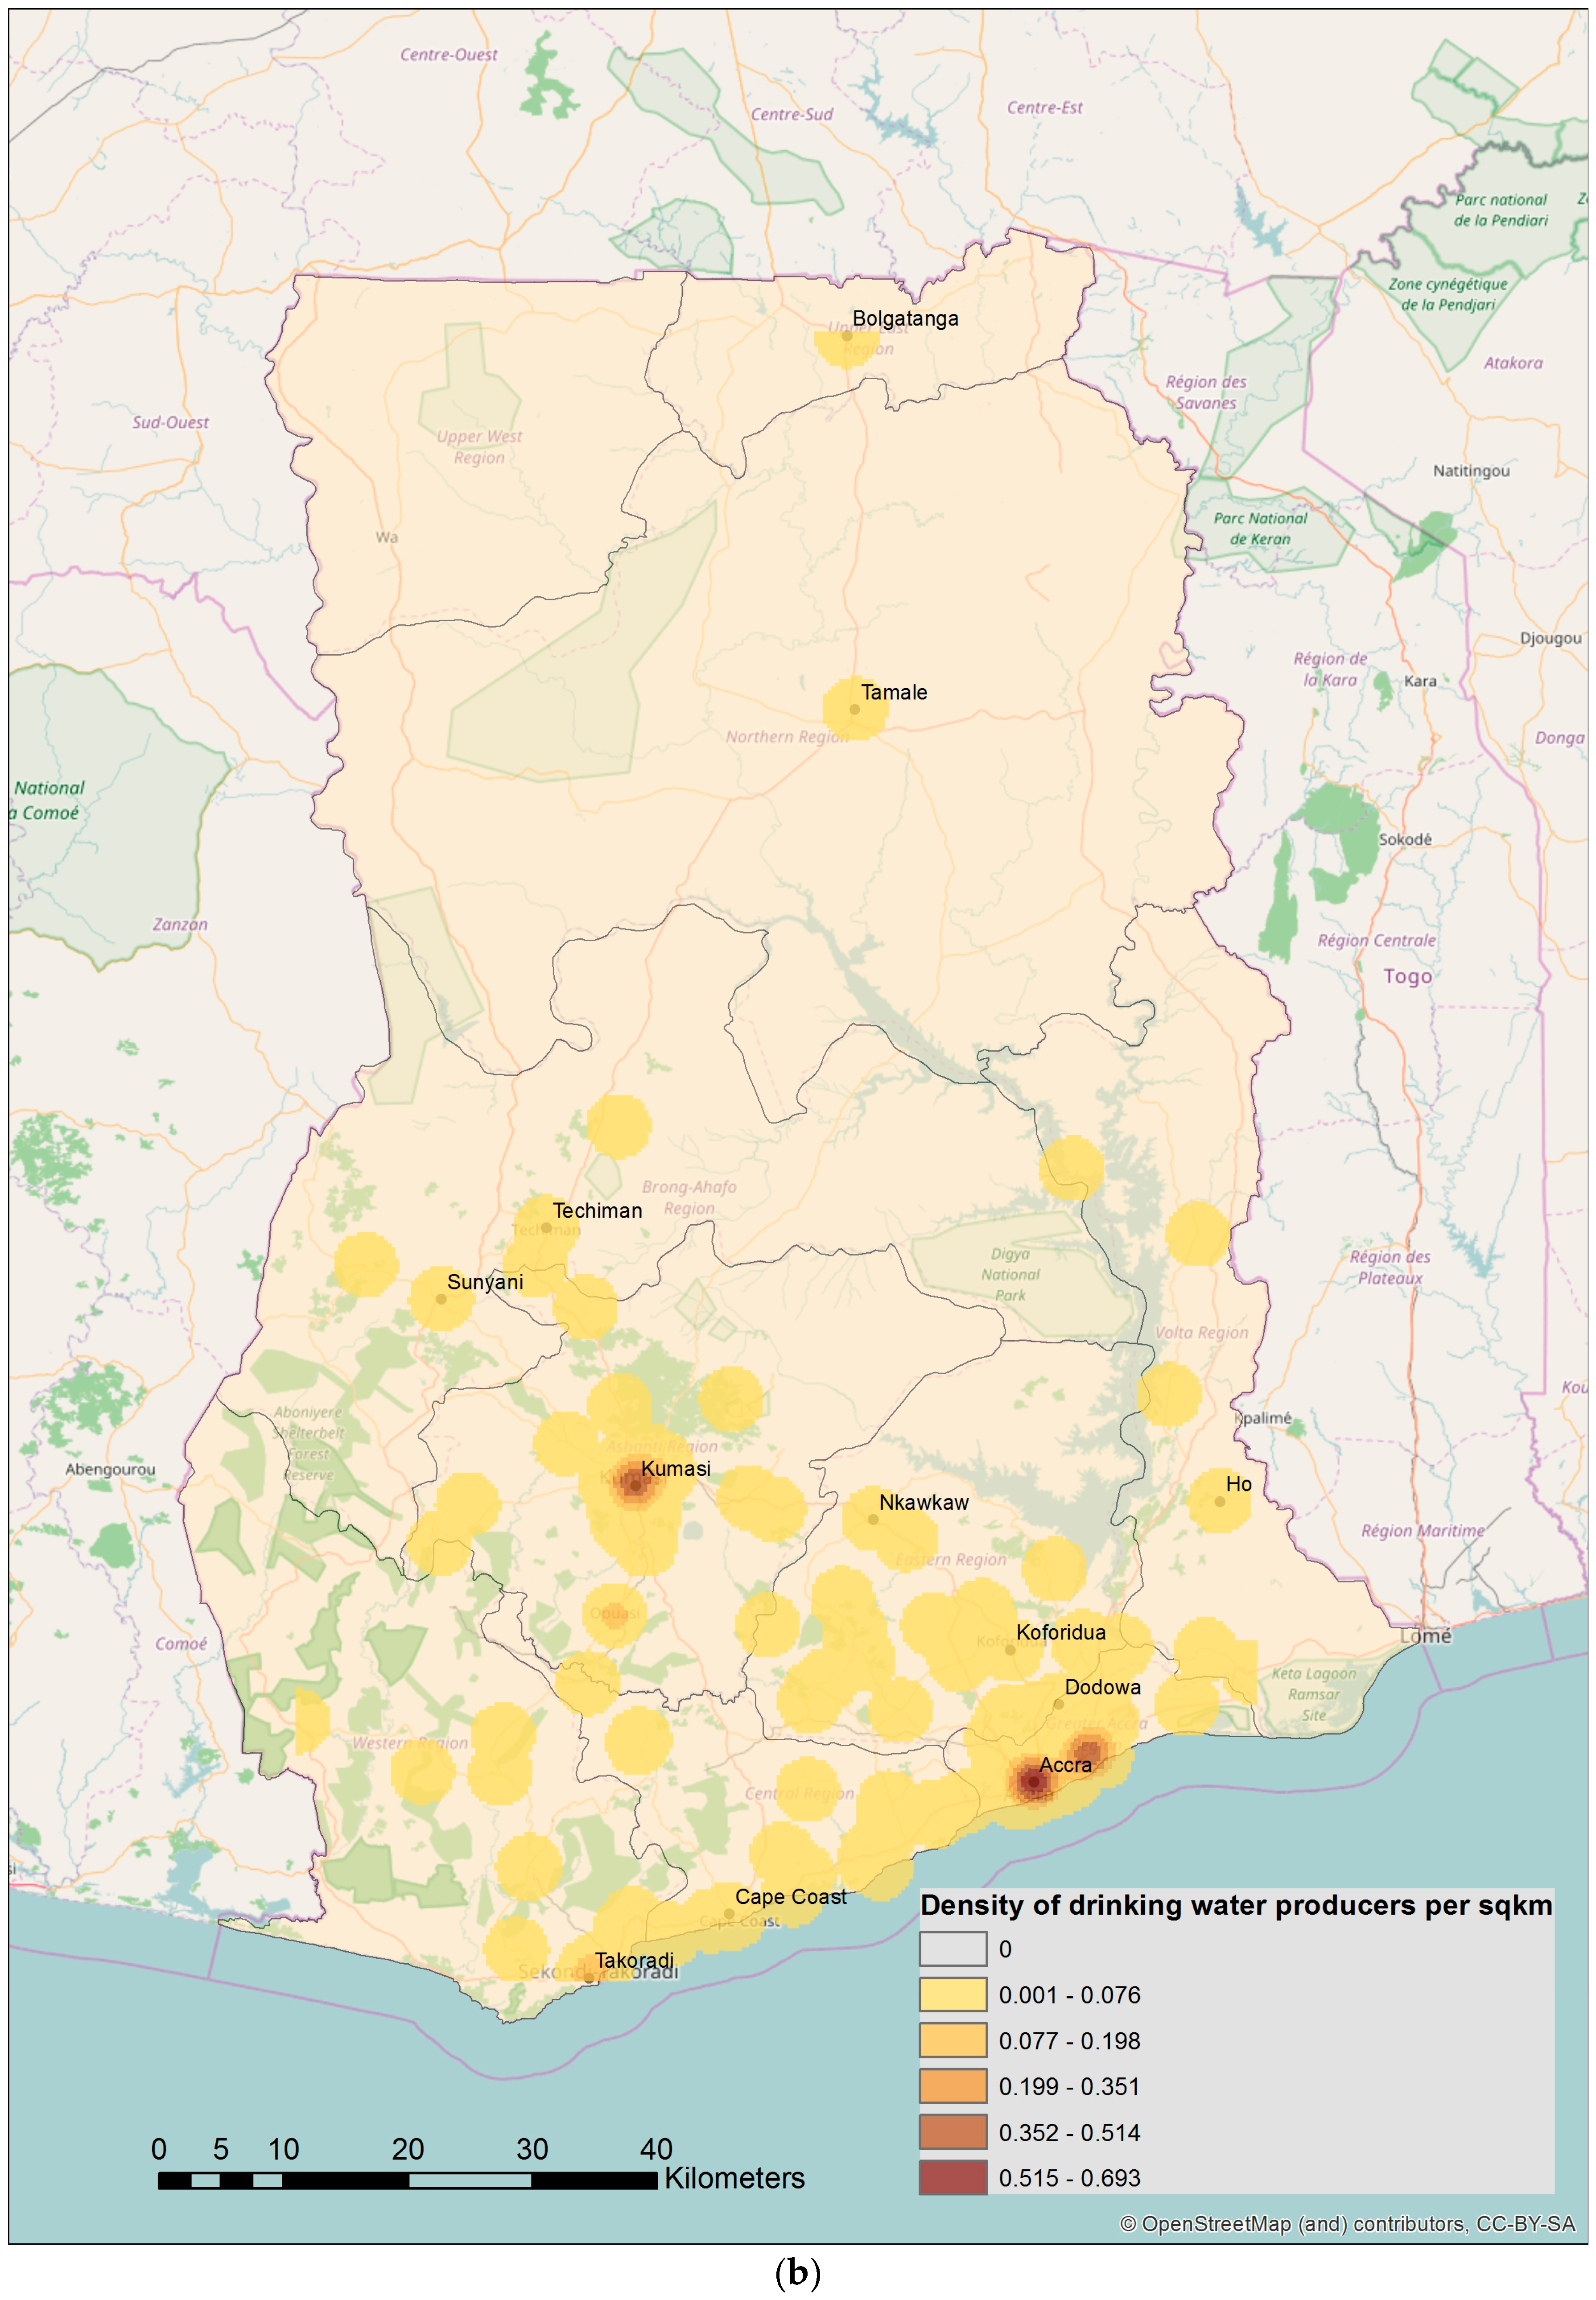
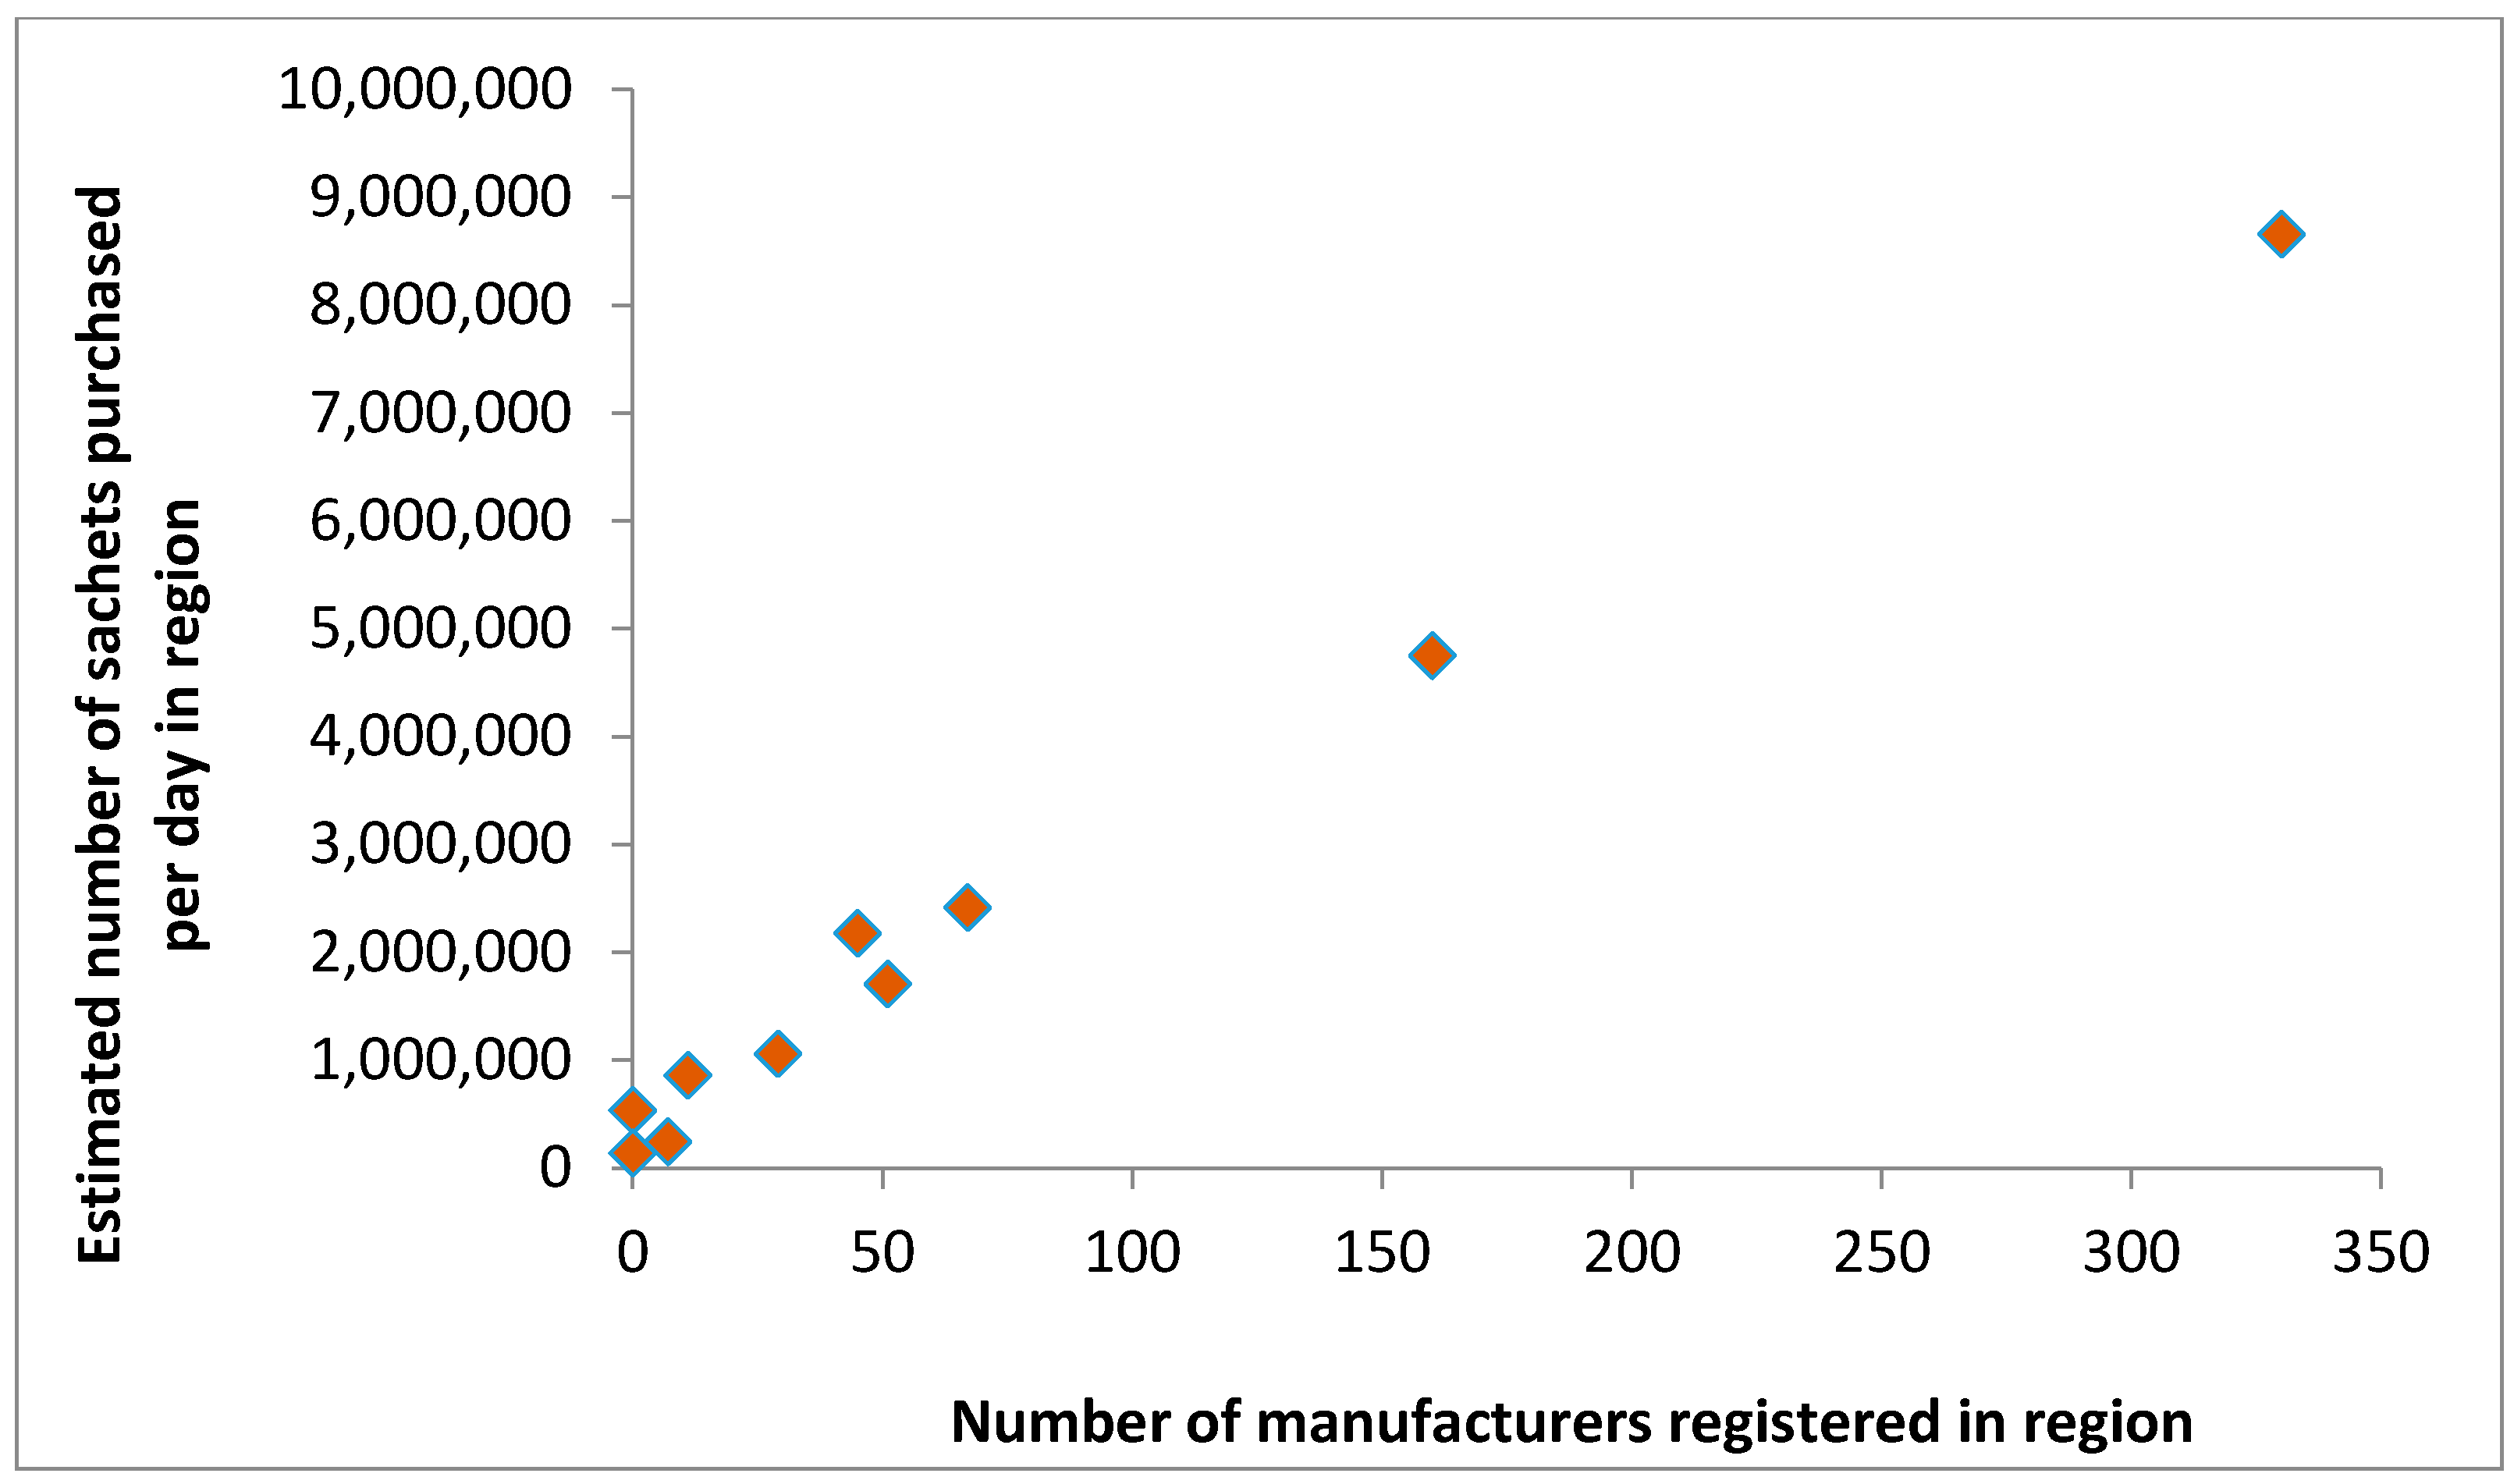
3.2. Spatial Patterns of Registered Packaged Water Production

Figure 2 shows the spatial distribution of licences granted by the GSA for natural mineral water and packaged drinking water products from 2009 to 2015. For both types of product, registered manufacturing is concentrated around Accra and Kumasi, Ghana’s two main urban centres. This distribution also reflects large numbers of producer addresses that could only be imprecisely geocoded to the town or city level. The majority of GSA licences granted were in the Ashanti and Greater Accra regions containing these two cities. However, there are some geographic differences between natural mineral water and packaged water production. In Accra (inset map), for example, there are more natural mineral water producers to the north of the city along the border with Eastern Province.
Figure 3 shows the spatial distribution of FDA licences active as of June 2016 within Greater Accra. In a manner similar to the GSA records in Figure 2, FDA licences for mineral water production are somewhat more concentrated to the north of Accra city relative to packaged water production.
Figure 4 shows the density of natural mineral water producer licences versus other packaged water licences based on GSA records for 2009–2015. The natural mineral water producers, many of whom produce bottled water, were more heavily concentrated around the major urban centres such as Accra, Kumasi and Sunyani. Six of the ten regional capitals in Ghana had high counts of packaged water producers, as did other industrialised municipalities, such as Techiman and Nkawkaw.
Figure 5 shows the number of GSA packaged water licences in relation to sachet consumption (as estimated from the 2012–2013 GLSS6 survey data) by region. Both production and consumption were concentrated in the Greater Accra and Ashanti regions and were highly correlated.

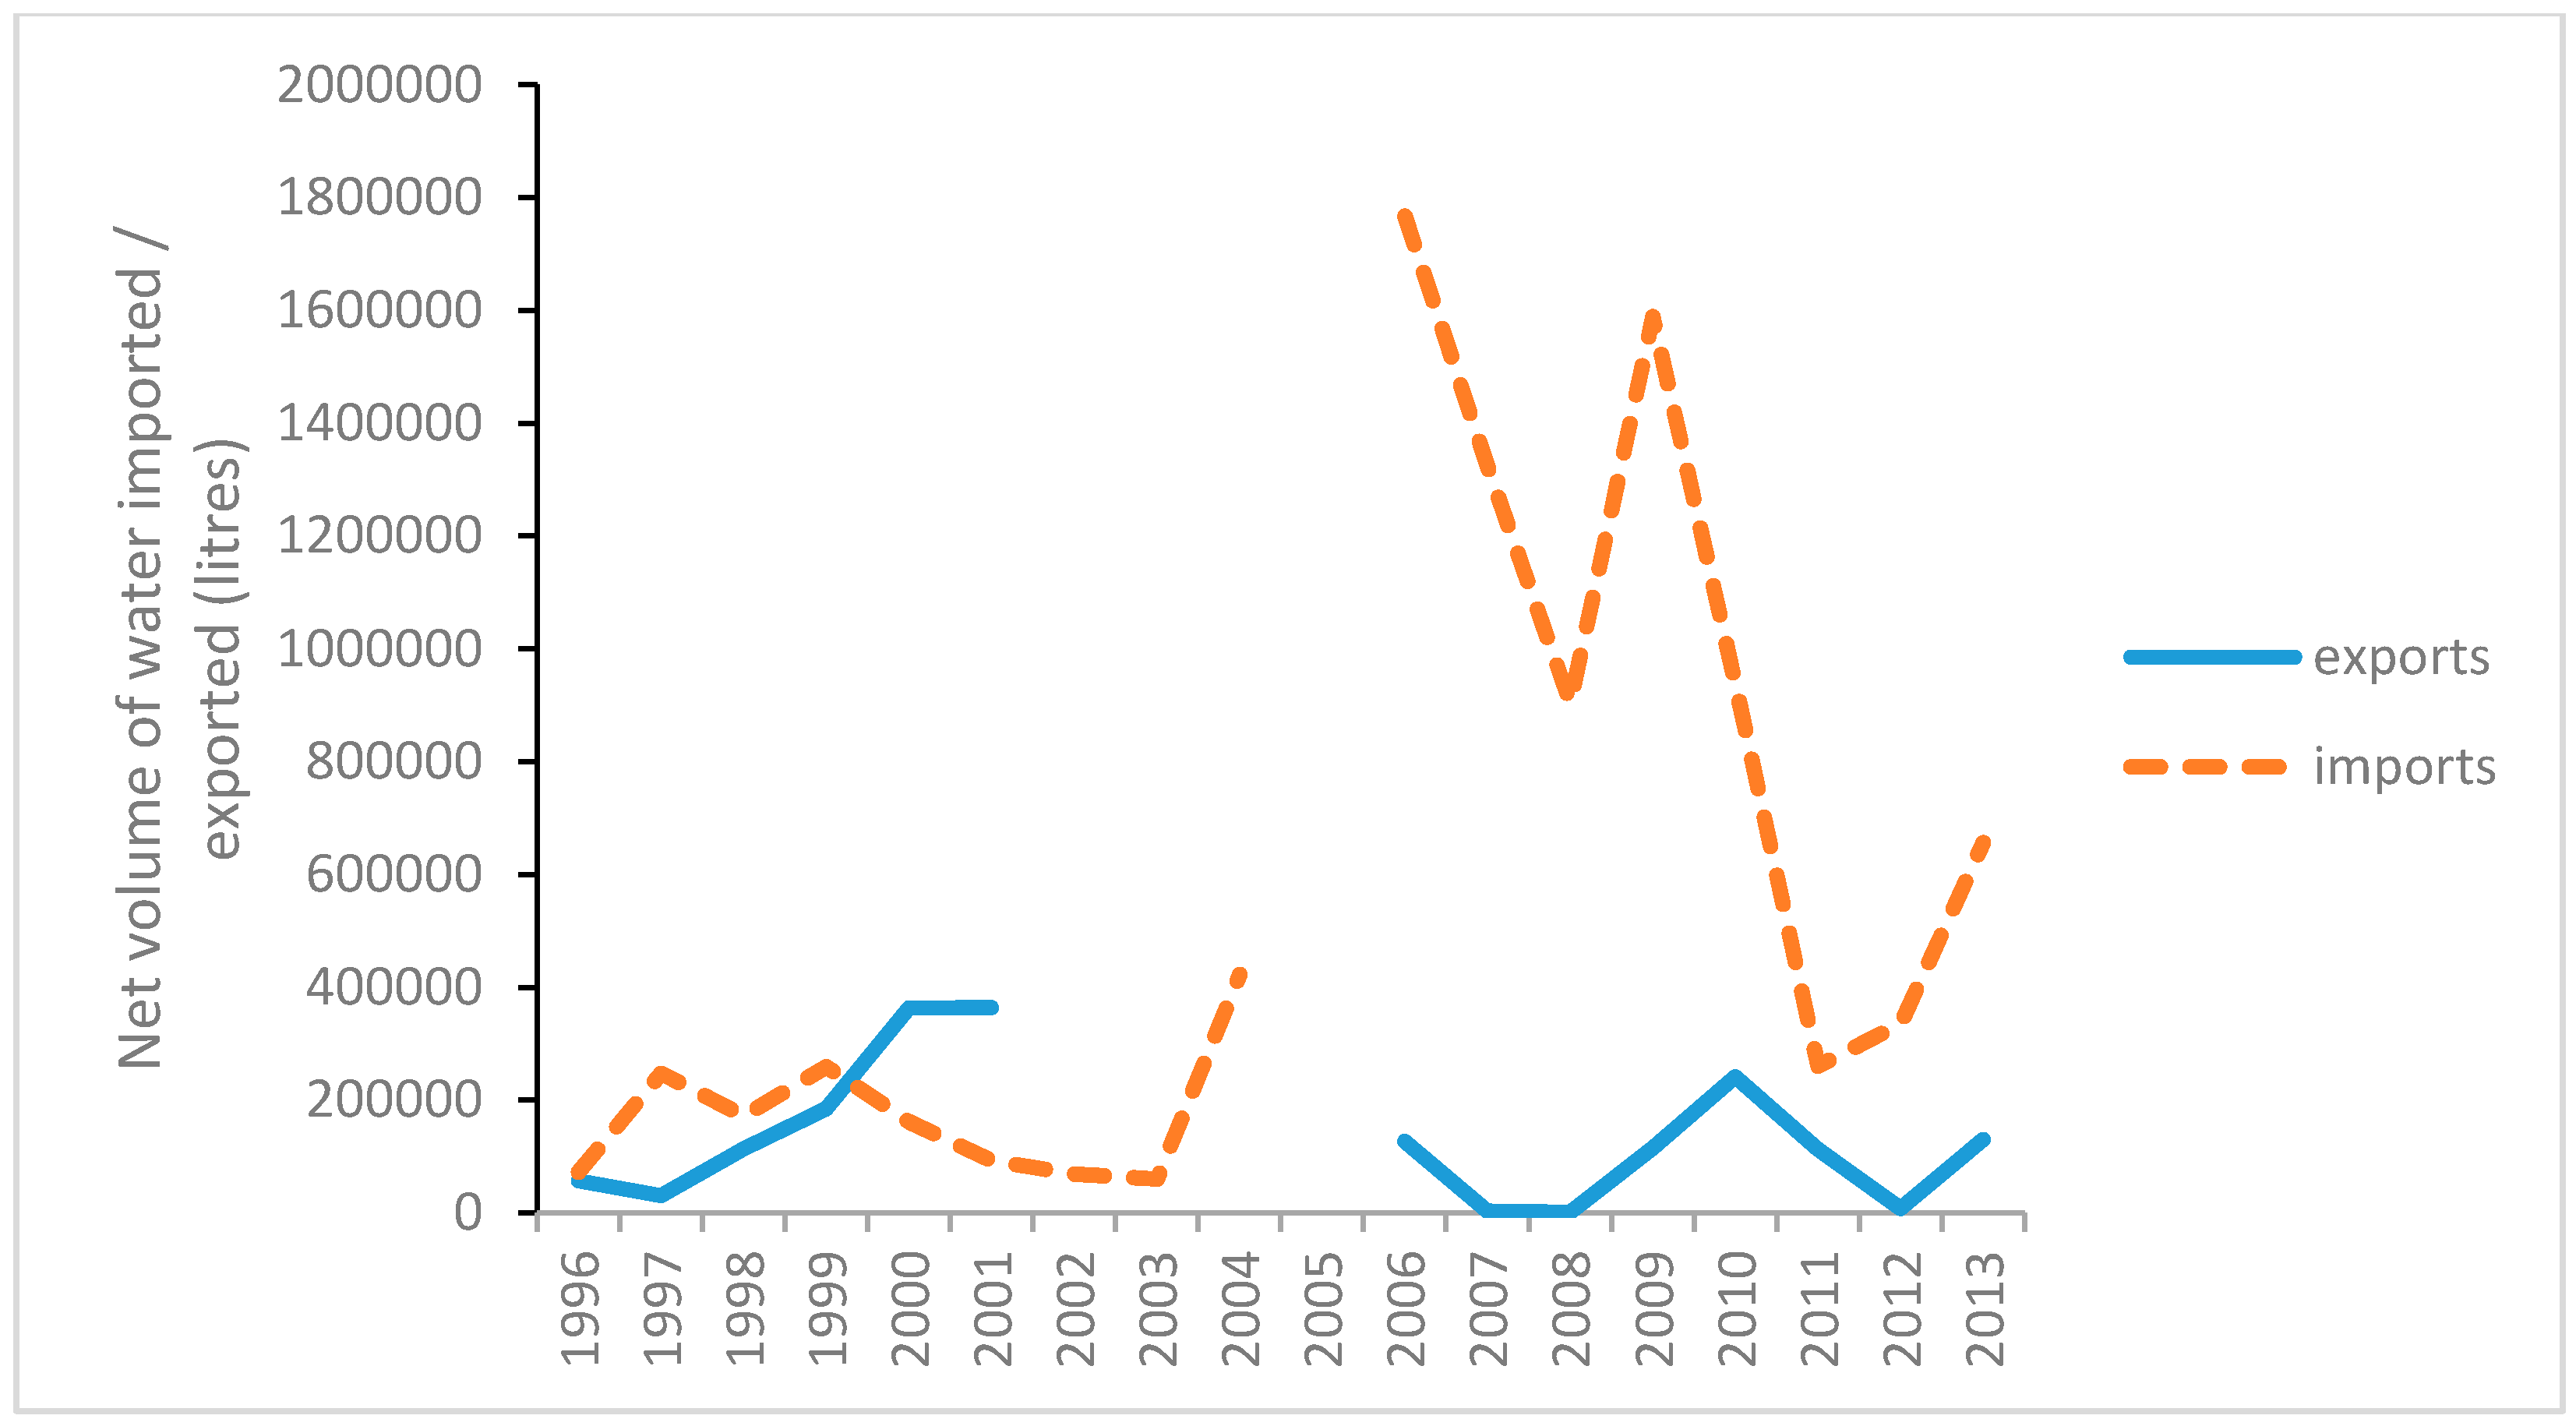
3.3. Imported Beverage Waters

Figure 6 shows the volume of unsweetened beverage water and ice imported into Ghana from 1996 to 2013. Imported volumes were greatest from 2006 to 2009, but fell thereafter. Missing data reflect years where Ghana did not report beverage water imports to the United Nations. There is no evidence to suggest missing data from 2005 affected reported imports in 2006. The GLSS6 survey data suggested Ghanaian households consumed over 11 million L of sachet water daily in 2012–2013 (Figure 5), so these imports met only a very small fraction of this demand (0.01% in 2012; 0.02% in 2013).

4. Discussion

Although urban packaged water consumption in low-income and middle-income countries is growing, there is little research on packaged water production and its implications for water resource management in such countries. Our study provides evidence on packaged water production in Ghana, where growth of packaged water consumption has been particularly rapid. Despite GSA registration being voluntary and FDA registration compulsory, geographic patterns in licences issued by both regulators were broadly similar for the Greater Accra region (Figure 2 and Figure 3). According to both GSA and FDA records, packaged water production took place in Accra and Tema but natural mineral water production was more concentrated to the north of the city. Combining total consumption estimated via the GLSS6 (Figure 5) with reported imports (Figure 6), we found that demand for packaged water is overwhelmingly met (99.98%) through domestic production rather than imports. Registered production of both natural mineral water and other packaged water is closely aligned with consumption at regional level (Figure 5). This contrasts with the USA, where natural mineral waters are reportedly transported long distances [13]. In the USA in 2013, UN Comtrade data suggested that 680,156 L/year of a reported 46 billion L/year of packaged water consumed [5] was met through imports from other nations. The estimated proportion of packaged water consumed from imports was thus higher for the USA (1.48%) than for Ghana (0.02%). Given the need for Ghanaian producers to sell packaged water at low prices, this finding is plausible and implies lower energy costs of packaged water transportation in low and middle income countries relative to high-income countries. In contrast to the growing water footprint from urban piped utilities [3], Figure 4 suggests that regulated packaged water production takes place close to the urban centres where packaged water is consumed, though most packaged water originates from piped systems.
According to both FDA and GSA records, far more licences were issued for packaged water production (64% and 81% respectively) than for natural mineral water production. This suggests that despite the introduction of higher piped water tariffs for packaged water producers in 2006 [25], piped water remains the most widespread source of sachet water. Whilst 8.1% of GSA licences were for bottled water and 85.9% for sachets (Table 1), the GLSS6 recorded bottled water as the main drinking water source for just 0.6% of urban households, relative to 44.5% for sachets [39]. Thus, as “premium” products, both bottled and natural mineral water may represent a lower share of sachet volumes consumed than the producer licence statistics suggest. Conversely, since natural mineral water must meet be drawn from “water-bearing strata from which all possible precautions should be taken within the protected perimeters to avoid any pollution” [18], it is possible some packaged drinking water may originate from aquifers that do not meet these conditions. Thus, it remains unclear if 90% of sachets are packaged tap water, as claimed by the national water utility, the Ghana Water Company Ltd (GWCL) [22].
The estimated 4.1 million m3/year of sachet water consumed in 2012–2013 (from groundwater and piped water combined) represents 3.7% of an estimated 112.3 million m3/year of piped water consumption met through the GWCL in 2009 [40]. In volumetric terms, packaged water production is therefore a small fraction of piped water consumption, but may be locally significant in the areas identified in Figure 2b and Figure 3b. A reported concentration of sachet producers around Tema [11], where piped supply interruptions are less frequent, is also apparent here (Figure 3b). The nationally representative GLSS6 included a module that tested source water for Escherichia coli (E. coli), and found that 47.2% of public standpipes, 26.2% of water piped to plots, and 33.9% of water piped to dwellings tested positive for E. coli [39]. Thus, aside from higher tariffs, the main challenges for sachet producers using piped water are likely to be supply interruptions and treatment to remove such microbial contamination of piped water.
The spatial distribution of packaged water production confirms earlier reports that groundwater abstraction for packaged water production is concentrated in the Densu Basin [41], which includes the capital, Accra. In Ghana, an estimated 84% of groundwater abstracted is for domestic use via boreholes and hand-dug wells, with 140.5 million m3/year abstracted from domestic boreholes [28]. Our results suggest that nationally, abstraction for packaged water production represents a very small proportion of total groundwater abstraction. As estimated from the GLSS6, total volumes of packaged water consumed regionally (originating both from piped and groundwater) were 7% or less of published estimates of total domestic groundwater abstraction [28] (Table 1) from boreholes, for all regions except Greater Accra. In Greater Accra, where aquifer salinity restricts domestic borehole use, estimated package water volumes consumed represented 63% of estimated borehole abstraction. Although this proportion does not differentiate packaged piped water from packaged groundwater, it suggests that groundwater abstraction for packaged water production may be locally significant in parts of this region. This is borne out by reports from the Densu Basin to the northwest of Accra. In 2005, based on abstraction licences and inspection of industrial premises, the WRC estimated that major packaged water producers were among several industries abstracting up to 1 million m3/year in the basin [42], of an estimated 2.4 million m3/year of groundwater abstracted.
The concentration of the regulated packaged water industry around Accra and in the Densu Basin has several implications for production processes and its regulation in terms of water quality. From a producer’s perspective, overall groundwater in the Basin is weakly acidic, with mineralization/salinity increasing from the north towards the coastal Togo formations [43]. This could lead to borehole functionality and maintenance challenges due to potentially chemically aggressive, acidic and low specific electric conductivity (SEC) waters (<100 μS·cm−1) in the northern Basin, and high SEC Na-Cl waters (2–10 mS·cm−1) which are also chemically aggressive to steel components and clearly of concern from a water quality perspective. Aquifer vulnerability within basement rocks which underlie the Basin is high, since the shallow weathered regolith in the granite-gneiss complex, which dominates the Basin, is particularly vulnerable to pollution and over-abstraction due to low storage and variable yields. High nitrate and chloride levels, above World Health Organisation guideline values, are reported for many boreholes and wells within the central and lower Basin, which has extensive agricultural land use and urbanization [44]. There is little published data on microbiological contamination in groundwater in the Basin, though high borehole turbidity has been widely observed across the Basin (e.g., [45]), which strongly suggests that faecal contamination of water could affect any sachet producers reliant on shallow wells and poorly constructed boreholes. Reverse osmosis would be an appropriate treatment process for addressing the high salinity, chloride, nitrate and faecal contamination risks in some parts of the basin. Where packaged water production draws on aquifers prone to these hazards, regulatory inspection of production premises could focus on the integrity of such treatment processes for public health protection. Given calls for cross-sector linkages in groundwater management [46], there is scope to connect packaged water regulation with integrated groundwater resource management, for example through sharing of data on licences granted for beverage production by the GSA and FDA with groundwater abstraction records held by the WRC. Given reported localized variation in borehole drilling success rates within hydrogeological units and sub-units [30], there is a considerable financial risk to producers who invest in borehole drilling, without suitable hydrogeological investigations, to avoid piped water rationing and increased utility tariffs.
Our findings are affected by several sources of uncertainty. Our analysis is dependent on the completeness and accuracy of the GSA and FDA producer registers. However, smaller-scale, unregistered sachet producers known as “abalowes” are known to operate in Ghana [11,20] and such unregistered production is not captured in our analysis. Given that unregistered producers typically sell sachets at discounted prices [11], such producers are likely to be located close to urban centres of demand, to reduce transport costs. In common with many developing countries, Ghana lacks an address referencing system for precise geocoding [47]. Furthermore, whilst regulators record manufacturing facility locations as well as registered business addresses, there is potential for the two to be confused. The town-level precision of geocoded producer addresses and coarse spatial resolution of some of the hydrogeological map layers used may thus have affected our assessment of the density of packaged water abstraction. Our examination of the spatial pattern of packaged water production and consumption did not consider the distribution sector of the supply chain. It is thus possible that packaged water is transported long distances to markets, despite the proximity of production facilities to major urban centres. We also assume that packaging and source water extraction take place at the same location.
These limitations relating to the content of regulatory databases and household surveys highlight potential knowledge gaps that could be addressed through field visits to producer premises and interviews with those working in the industry. The actual distribution channels used by producers could be explored by tracing supply chain entities backwards from interviews with retailers, thereby capturing unregulated as well as regulated production. Subsequent follow-up interviews with the distributors and producers identified would enable greater understanding of production processes among unregistered producers, volumes sold, and the extent of groundwater use and treatment by both regulated and unregulated producers under both the packaged and natural mineral water standards. Such work would also enable more precise georeferencing of production facilities, assessment of uncertainty in regulatory databases, and thereby greater insights into groundwater abstraction, safety and management. The approach taken here could be applied in other countries with registers of regulated packaged water producers, such as Nigeria, where the National Agency for Food and Drug Administration holds similar records of certified producers [48,49].

Acknowledgments

This work was funded by the Royal Society (“Enhancing understanding of domestic groundwater quality and contamination hazards in Greater Accra”, Ref: SM150014). Open access publishing costs were funded by the University of Southampton.

Author Contributions

Mawuli Dzodzomenyo, Dan Lapworth, and Jim Wright conceived and designed the analysis; Winfred Dotse-Gborgbortsi, Nicola Wardrop and Jim Wright processed and analysed the data; Mawuli Dzodzomenyo wrote the paper.

Conflicts of Interest

The authors declare no conflict of interest. The founding sponsors had no role in the design of the study; in the collection, analyses, or interpretation of data; in the writing of the manuscript, and in the decision to publish the results.

References

  1. United Cities and Local Governments (UCLG). Basic Services for All in an Urbanizing World: Third Global Report of United Cities and Local Governments on Local Democracy and Decentralization Gold III; UCLG: Barcelona, Spain, 2013; p. 433. [Google Scholar]
  2. United Nations Human Settlement Programme (UN-Habitat). Urbanization and Development: Emerging Futures; World Cities Report 2016; UN-Habitat: Nairobi, Kenya, 2016; p. 262. [Google Scholar]
  3. Showers, K.B. Water scarcity and urban Africa: An overview of urban-rural water linkages. World Dev. 2002, 30, 621–648. [Google Scholar] [CrossRef]
  4. Li, E.; Endter-Wada, J.; Li, S. Characterizing and contextualizing the water challenges of megacities. J. Am. Water Resour. Assoc. 2015, 51, 589–613. [Google Scholar] [CrossRef]
  5. Rodwan, J. Bottled Water 2013: Sustaining Vitality-Us and International Developments and Statistics. Bottled Water Report. 2014, p. 11. Available online: http://www.bottledwater.org/public/2011%20BMC%20Bottled%20Water%20Stats_2.pdf (accessed on 20 February 2017).
  6. Stoler, J.; Fink, G.; Weeks, J.R.; Otoo, R.A.; Ampofo, J.A.; Hill, A.G. When urban taps run dry: Sachet water consumption and health effects in low income neighborhoods of Accra, Ghana. Health Place 2012, 18, 250–262. [Google Scholar] [CrossRef] [PubMed]
  7. Kassenga, G.R. The health-related microbiological quality of bottled drinking water solid in Dar es Salaam, Tanzania. J. Water Health 2007, 5, 179–185. [Google Scholar] [CrossRef] [PubMed]
  8. Bordalo, A.A.; Machado, A. Water bags as a potential vehicle for transmitting disease in a West African capital, Bissau. Int. Health 2015, 7, 42–48. [Google Scholar] [CrossRef] [PubMed]
  9. Njeru, J. The urban political ecology of plastic bag waste problem in Nairobi, Kenya. Geoforum 2006, 37, 1046–1058. [Google Scholar] [CrossRef]
  10. Quartey, E.T.; Tosefa, H.; Danquah, K.A.B.; Obrsalova, I. Theoretical framework for plastic waste management in Ghana through extended producer responsibility: Case of sachet water waste. Int. J. Environ. Res. Public Health 2015, 12, 9907–9919. [Google Scholar] [CrossRef] [PubMed]
  11. Stoler, J.; Weeks, J.R.; Fink, G. Sachet drinking water in Ghana′s Accra-Tema metropolitan area: Past, present, and future. J. Water Sanit. Hyg. Dev. 2012, 2, 223–240. [Google Scholar] [CrossRef] [PubMed]
  12. Fisher, M.B.; Williams, A.R.; Jalloh, M.F.; Saquee, G.; Bain, R.E.S.; Bartram, J.K. Microbiological and chemical quality of packaged sachet water and household stored drinking water in Freetown, Sierra Leone. PLoS ONE 2015, 10, e0131772. [Google Scholar] [CrossRef] [PubMed]
  13. Gleick, P.H.; Cooley, H.S. Energy implications of bottled water. Environ. Res. Lett. 2009, 4. [Google Scholar] [CrossRef]
  14. Stoler, J. Improved but unsustainable: Accounting for sachet water in post-2015 goals for global safe water. Trop. Med. Int. Health 2012, 17, 1506–1508. [Google Scholar] [CrossRef] [PubMed]
  15. Ghana Statistical Service (GSS); Ghana Health Service (GHS); ICF International. Ghana Demographic and Health Survey 2014; ICF International: Rockville, MD, USA, 2015; p. 530.
  16. Ghana Statistical Service (GSS); Ghana Health Service (GHS); ICF Macro. Ghana Demographic and Health Survey 2008; GSS, GHS and ICF Macro: Accra, Ghana, 2009; p. 512.
  17. Government of Ghana. Public Health Act; Government of Ghana: Accra, Ghana, 2012; Volume 851, p. 194.
  18. Ghana Standards Authority. Water Quality—Specification for Natural Mineral Water; GS 220, 2005; Ghana Standards Authority: Accra, Ghana, 2005; p. 9.
  19. Ghana Standards Authority. Water Quality—Specification for Drinking-Water; Ghana Standards Authority: Accra, Ghana, 2009; p. 23.
  20. Peloso, M.; Morinville, C. ‘Chasing for water’: Everyday practices of water access in peri-urban Ashaiman, Ghana. Water Altern. 2014, 7, 121–139. [Google Scholar]
  21. Water Resources Commission. Drilling Licence and Groundwater Development Regulations; Water Resources Commission: Accra, Ghana, 2006; Volume LI1827, p. 15. [Google Scholar]
  22. Arku, J. Sachet Water Is Not Repackaged Tapwater–FDA. Daily Graphic, 29 January 2016. Available online: http://www.graphic.com.gh/news/general-news/sachet-water-is-not-repackaged-tap-water-fda.html (accessed on 20 February 2017).
  23. Ahimah, J.K.; Ofosu, S.A. Evaluation of the quality of sachet water vended in the New Juaben municipality of Ghana. Int. J. Water Res. Environ. Eng. 2012, 4, 134–138. [Google Scholar]
  24. Public Utilities Regulatory Commission. Publication of Water Tariffs: May-July 2005; Public Utilities Regulatory Commission: Accra, Ghana, 2005; p. 3. [Google Scholar]
  25. Public Utilities Regulatory Commission. Publication of Water Tariffs, September 2006; Public Utilities Regulatory Commission: Accra, Ghana, 2006; p. 3. [Google Scholar]
  26. Public Utilities Regulatory Commission. Publication of Water Tariffs, July 2016; Public Utilities Regulatory Commission: Accra, Ghana, 2016; p. 3. [Google Scholar]
  27. MacDonald, A.M.; Calow, R.C.; Andrews, A.; Appiah, S. Groundwater Management in Drought Prone Areas of Africa, Northern Ghana—Inception Report; British Geological Survey: Nottingham, UK, 1996; p. 63. [Google Scholar]
  28. Kortatsi, B.K. Groundwater utilization in Ghana. In Future Groundwater Resources at Risk; International Association of Hydrological Sciences: Helsinki, Finland, 1994; Volume 222, pp. 149–156. [Google Scholar]
  29. Gyau-Boakye, P.; Kankam-Yeboah, K.; Darko, P.K.; Dapaah-Siakwan, S.; Duah, A.A. Groundwater as a vital resource for rural development: Example from Ghana. In Applied Groundwater Studies in Africa; Adelana, S.M.A., MacDonald, A.M., Eds.; CRC Press/Balkema: London, UK, 2008; pp. 149–169. [Google Scholar]
  30. Dapaah-Siakwan, S.; Gyan-Boakye, P. Hydrogeologic framework and borehole yields in Ghana. Hydrogeol. J. 2000, 8, 405–416. [Google Scholar] [CrossRef]
  31. Kortatsi, B.K. Hydrochemical characterization of groundwater in the Accra plains of Ghana. Environ. Geol. 2006, 50, 299–311. [Google Scholar] [CrossRef]
  32. Apambire, W.B.; Boyle, D.R.; Michel, F.A. Geochemistry, genesis, and health implications of fluoriferous groundwaters in the upper regions of Ghana. Environ. Geol. 1997, 33, 13–24. [Google Scholar] [CrossRef]
  33. Smedley, P.L. Arsenic in rural groundwater in Ghana. J. Afr. Earth Sci. 1996, 22, 459–470. [Google Scholar] [CrossRef]
  34. Gibson, K.E.; Opryszko, M.C.; Schissler, J.T.; Guo, Y.Y.; Schwab, K.J. Evaluation of human enteric viruses in surface water and drinking water resources in southern Ghana. Am. J. Trop. Med. Hyg. 2011, 84, 20–29. [Google Scholar] [CrossRef] [PubMed]
  35. Ghana Standards Authority. List of Products Certified in February 2015; Ghana Standards Authority: Accra, Ghana, 2015; p. 5.
  36. UN Comtrade Database. Available online: http://comtrade.un.org/ (accessed on 17 February 2017).
  37. Amjadi, A.; Schuler, P.; Kuwahara, H.; Quadros, S. World Integrated Trade Solution User’s Manual; World Bank: Washington, DC, USA, 2011; p. 230. [Google Scholar]
  38. Silverman, B.W. Density Estimation for Statistics and Data Analysis; Chapman and Hall: New York, NY, USA, 1986. [Google Scholar]
  39. Ghana Statistical Service. Ghana Living Standards Survey Round 6 Main Report; Ghana Statistical Service: Accra, Ghana, 2014; p. 244.
  40. International Benchmarking Network for Water and Sanitation Utilities. Ib-Net Database. Available online: http://www.ib-net.org/ (accessed on 23 January 2017).
  41. Obuobie, E.; Boubacar, B. Ghana. In Groundwater Availability and Use in Sub-Saharan Africa: A Review of 15 Countries; Pavelic, P., Giordano, M., Keraita, B., Ramesh, V., Rao, T., Eds.; International Water Management Institute: Colombo, Sri Lanka, 2012; pp. 42–62. [Google Scholar]
  42. Water Resources Commission. Densu River Basin: Integrated Water Resources Management Plan; Water Resources Commission: Accra, Ghana, 2007; p. 90. [Google Scholar]
  43. Dickson, A.; Abass, G.; Tetteh, T.A.; Richmond, F.; Piotr, M. Hydrochemical evolution and groundwater flow in the Densu River Basin, Ghana. J. Water Res. Prot. 2011, 3, 632. [Google Scholar] [CrossRef]
  44. Gibrilla, A.; Osae, S.; Akiti, T.; Adomako, D.; Ganyaglo, S.; Bam, E.P.; Hadisu, A. Origin of dissolved ions in groundwater in the northern Densu River Basin of Ghana using stable isotopes of 18O and 2H. J. Water Res. Prot. 2010, 2, 3504. [Google Scholar] [CrossRef]
  45. Amoako, J.; Karikari, A.Y.; Ansa-Asare, O.D. Physico-chemical quality of boreholes in Densu Basin of Ghana. Appl. Water Sci. 2011, 1, 41–48. [Google Scholar] [CrossRef]
  46. Foster, S.; Ait-Kadi, M. Integrated water resources management (IWRM): How does groundwater fit in? Hydrogeol. J. 2012, 20, 415–418. [Google Scholar] [CrossRef]
  47. Goldberg, D.W.; Wilson, J.; Knoblock, C. From text to geographic coordinates: The current state of geocoding. J. Urban Reg. Inf. Syst. Assoc. 2007, 19, 33–47. [Google Scholar]
  48. National Agency for Food and Drug Administration and Control. Registered Food Products. Available online: http://www.nafdac.gov.ng/index.php/product-registration/registered-food-products (accessed on 10 November 2015).
  49. Olaoye, O.A.; Onilude, A.A. Assessment of microbiological quality of sachet-packaged drinking water in Western Nigeria and its public health significance. Public Health 2009, 123, 729–734. [Google Scholar] [CrossRef] [PubMed]
Figure 1. Flowchart, showing geocoding engines used and precision of geocoded locations for 764 records of packaged water manufacturers who registered with either the nationwide with the Ghana Standards Authority (GSA) from 2009 to 2015; or with the Food and Drugs Authority (FDA) in the Greater Accra region, as of June 2016.
Water 09 00142 g001
Figure 2. Number of licences granted between December 2009 and October 2015 by the Ghana Standards Authority for production of (a) natural mineral water under Ghana Standard 220 (GS220) and (b) packaged drinking water under Ghana Standard 175 (GS175).
Water 09 00142 g002
Figure 3. Density of licences granted within the Greater Accra region as of June 2016 by the Food and Drugs Authority for production of (a) natural mineral water under Ghana Standard 220 (GS220) and (b) packaged drinking water under Ghana Standard 175 (GS175).
Water 09 00142 g003
Figure 4. Density of Ghana Standards Authority producer licences, 2009–2015 for (a) natural mineral waters under Ghana Standard 220 (GS220) and (b) other forms of packaged water including tap water under Ghana Standard 175 (GS175).
Water 09 00142 g004aWater 09 00142 g004b
Figure 5. Estimated daily sachet consumption in 2012–2013 (from the Ghana Living Standard Survey) versus number of Ghana Standards Authority producer licences granted from 2009 to 2015 by region.
Water 09 00142 g005
Figure 6. Annual volumes of imported and exported unsweetened beverage waters and ice, 1996–2013, as reported by the Government of Ghana (source: Department of Economic and Social Affairs/United Nations Statistics Division, United Nations Comtrade database).
Water 09 00142 g006
Table 1. Characteristics of packaged water products registered with the Ghana Standards Authority, December 2009 to October 2015.
Product CharacteristicNo. of GSA Licences (%)
Year of producer registration
Registration date not recorded20 (2.6)
December 200912 (1.6)
2010131 (17.1)
2011151 (19.8)
2012 145 (5.9)
2013149 (19.5)
2014157 (20.5)
January–October 201596 (12.6)
20163
Product registered
Packaged water (bagged)579 (75.8)
Mineral water (bagged)77 (10.1)
Bottled water62 (8.1)
Both bagged and bottled water23 (3.0)
Dispenser drinking water19 (2.5)
Ice cubes1 (0.1)
Region of production
Ashanti173 (22.6)
Brong-Ahafo30 (3.9)
Central51 (6.7)
Eastern63 (8.2)
Greater Accra334 (43.7)
Upper East7 (0.9)
Volta14 (1.8)
Western67 (8.8)
Upper West3 (0.4)
Northern1 (0.1)
Not specified/geocoded18 (2.4)
Standard
Mineral water (GS220)145 (19.0)
Packaged water (GS175)619 (81.0)
Total764
Note: 1 Some GSA records were missing in 2012.

