Article

Investigation of the Growth and Mortality of Bacteria and Synechococcus spp. in Unvegetated and Seagrass Habitats

1
Institute of Marine Environment and Ecology, National Taiwan Ocean University, Keelung 20224, Taiwan
2
Center of Excellence for the Oceans, National Taiwan Ocean University, Keelung 20224, Taiwan
3
Department of Marine Environmental Engineering, National Kaohsiung University of Science and Technology, Kaohsiung 81157, Taiwan
4
A.O. Kovalevsky Institute of Biology of the Southern Seas, Russian Academy of Sciences, 299011 Sevastopol, Russia
5
Laboratory of Marine Ecosystems, Institute for Advanced Research, Sevastopol State University, 299053 Sevastopol, Russia
6
Penghu Fisheries Biology Research Center, Fisheries Research Institute, Ministry of Agriculture, Penghu 880, Taiwan
*
Author to whom correspondence should be addressed.
Water 2024, 16(7), 939; https://doi.org/10.3390/w16070939
Submission received: 17 February 2024 / Revised: 16 March 2024 / Accepted: 20 March 2024 / Published: 25 March 2024
(This article belongs to the Special Issue Biogeochemical Processes in the Aquatic Environment)

Abstract

:
There is no doubt that seagrass beds constitute one of the most productive ecosystems in shallow coastal waters. Despite this, picoplankton in seagrass ecosystems has received relatively little attention. The purpose of this study was to compare picoplankton growth and mortality rates between seagrass and unvegetated habitats using chamber incubations. We tested two main hypotheses: (i) incubation with seagrass would result in higher bacterial growth rates due to increased DOM release from seagrass photosynthesis, and (ii) Synechococcus spp. would be lower in the presence of seagrass due to competition for inorganic nutrients. Bacterial growth rates were higher in seagrass chambers (2.44 d–1) than in non-seagrass chambers (2.31 d−1), respectively, suggesting that organic carbon coming from the seagrass community may support bacterial production. Furthermore, the growth rate of Synechococcus spp. was significantly lower in the seagrass treatment than in the non-seagrass treatment, likely reflecting nutrient competition with the seagrass. Small-scale chambers proved to be a useful tool for studying the factors controlling spatial and temporal patterns of picoplankton across different habitats. Furthermore, future studies should examine picoplankton growth over a wider range of spatial scales in seagrass beds and adjacent unvegetated sediment.

1. Introduction

In coastal waters, seagrass meadows are common. Their presence enhances biodiversity by increasing habitat complexity and ecological niches [1,2]. Organic and inorganic matter are deposited by seagrass when the current velocity and wave action are reduced [3]. Furthermore, studies on the effects of seagrass have found that epiphytes and seagrass are the main organic carbon producers [4]. Some evidence suggests that seagrass contributes 50% of the total gross primary productivity of the open bay site [5]. Lindeboom and Sandee [6] found that epiphytes within seagrass communities contribute 36% to the gross primary productivity of these habitats. Consequently, a large percentage of the primary production in seagrass meadows is unavailable to predators for consumption and is converted into detritus [7]. In addition, a large fraction of photosynthesized compounds are released as dissolved organic matter (DOM) [8], which is the primary source of organic matter and energy for free-living heterotrophic bacteria. The bioavailable DOM is released by seagrass roots as well as by the leaves, making it available to heterotrophic bacteria in both pelagic and benthic habitats [9]. Although seagrass and microbes are linked, they are rarely examined together in coastal waters, despite their obvious biological importance.
DOM is metabolically the most significant source of carbon and nutrients for heterotrophic bacteria [10]. Previous studies suggested that DOM is partly derived from phytoplankton [11,12]. Furthermore, as coastal vegetation is dominated by seagrass ecosystems with high productivity, seagrasses play a crucial role in biogeochemical fluxes [13]. The effects of these DOM sources on degradation pathways are unknown, but a study found that organic matter sources might have a significant impact on bacterial carbon metabolism [14]. In an early study, it was reported that the abundance of bacteria in seagrass beds was approximately ten times higher than that without seagrass [15]. While growing, seagrass secretes DOM into the water, which can be used by algae and bacteria, facilitating carbon transfer from dissolved particles [16]. Accordingly, changes in the relative contribution of phytoplankton and macrophytes to DOM can affect carbon flux in marine food webs, especially via microbes [10,17]. In addition, bacterial abundance and metabolism in aquatic ecosystems are mainly constrained by the availability of resources (bottom-up control) and mortality by protistan grazers and viruses (top-down control) [18,19,20]. However, to date, few studies have examined bacterial mortality, especially the relative contributions of grazing and viral lysis to bacterial communities in seagrass environments [21]. Our understanding of the factors constraining microbial plankton stocks and activity in coastal seagrass regions remains limited. An accurate measure of bacterial growth and mortality is essential for understanding and quantifying the carbon cycle in seagrass-dominated ecosystems.
Furthermore, competition for resources among phytoplankton and seagrasses is highlighted in the conceptual framework. In the ocean, Synechococcus spp. comprise the largest portion of the prokaryotic picophytoplankton, generating a substantial fraction of the total primary production. There is some evidence that Synechococcus spp. contribute a significant portion (>50%) of phytoplankton biomass and production [22]. As autotrophic organisms, Synechococcus spp. compete with seagrass for inorganic nutrients and light for growth. In a report on seagrass ecosystems, the abundance of Synechococcus spp. was low compared with other ecosystems [23]. Moreover, other studies have shown the effects of seagrass on Synechococcus spp., which showed a decrease in Synechococcus spp. following contact with an ecosystem of seagrass, likely due to grazing control [24]. In addition, seagrass leaves directly trapped natural picophytoplankton populations, resulting in negative net rates of population growth in the presence of seagrass. Although the growth rate of picophytoplankton was high, the biomass of picophytoplankton remained low, perhaps because of the high removal of picophytoplankton by seagrass leaves [25].
This study was conducted with a benthic chamber to examine how seagrass environments affect bacterial and Synechococcus spp. growth and mortality rates. The relative effects of seagrass on bacterial and Synechococcus spp. growth and mortality rates were investigated in benthic chambers with and without seagrass. The following hypotheses were tested in this study: (i) incubation with seagrass resulted in higher bacterial growth rates because seagrasses release more DOM during photosynthesis and (2) Synechococcus spp. compete with seagrass for inorganic nutrients, which resulted in a relatively low growth rate of Synechococcus sp. We aim to learn more about the interaction between seagrass and other microbes (especially bacteria and picophytoplankton), as well as how we can improve our understanding of ecosystem processes.

2. Materials and Methods

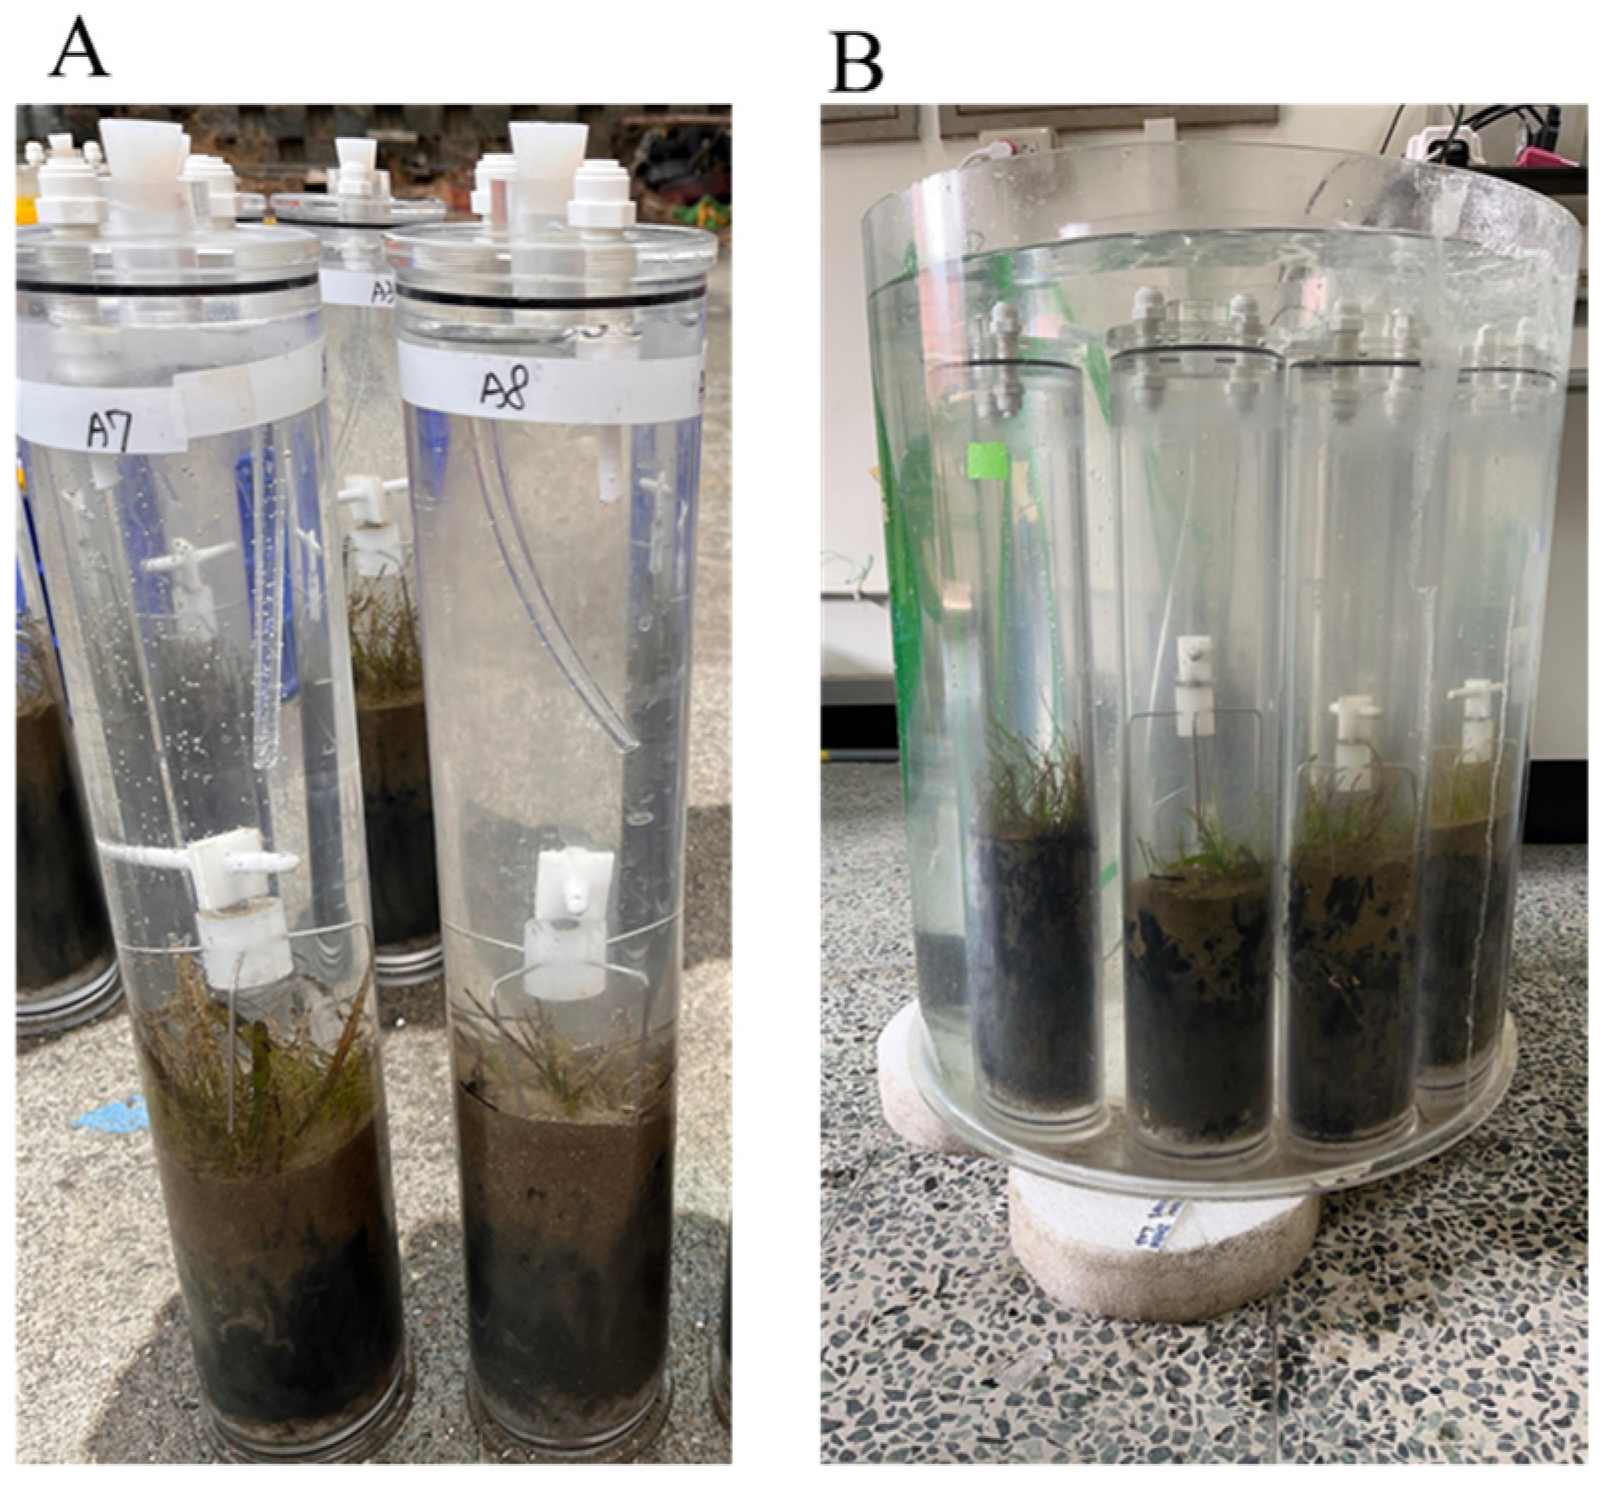
2.1. Study Site and Sampling Methods

In the southern Taiwan Strait, the Penghu Islands comprise 92 islands and islets. In the Taiwan Strait, warm currents flow northward throughout the year, whereas a northeasterly monsoon in winter lessens the strength of the warm current and drives cold currents northwest. This study was conducted in the coastal waters of Penghu Island, west of Taiwan, situated between 25°37.07′ N and 119°31.58′ E. A temperature logger indicated enormous fluctuations in water temperatures in the sampling area, ranging from 12 °C in winter to 35 °C in summer (unpublished data). The seagrass meadows in this region serve as restoration sites featuring primarily Halodule uninervis and Halophila ovalis, with seagrass cover varying from 20% to 90%. These seagrasses remain submerged throughout the day, with water depths ranging from 1.7 m to 4.4 m. The sediment is predominantly sandy and composed mainly of carbonate materials. As far as we are aware, there has been no study on picoplankton and bacteria abundance or dynamics at our study site.
The surface seawater and seagrass samples with sediment were collected in October 2023. We gently poured surface water into 10 L polypropylene carboys after collecting it with a bucket. Following the casting of the sampling bucket, the temperature of the water was measured immediately, and all samples were brought to the laboratory within 30 min. Two enclosure experiments were conducted with seagrasses and unvegetated sediments using an ex situ benthic chambers approach. Benthic chambers (10 cm diameter × 50 cm length) were gently pushed approximately 20 cm into the unvegetated sediment and seagrass habitats (Figure 1A), enabling discrimination of bacterial and Synechococcus spp. growth and mortality between the control system (sediment + water column) and the seagrass system (sediment + seagrass + water column). Each chamber was capped with an air-tight Plexiglas lid that contained an inflow and outflow sampling port. After collection, the chambers were transported to the incubation site within 1 h for pre-incubation. About 100 L site water was collected near the sampling site to be used for the incubation. Upon return to the incubation site, chambers were submerged in the 100 L acrylic incubation tanks filled with site water (Figure 1B). The water was maintained at in situ temperature and continuously recirculated via a chiller. The tanks were exposed to natural sunlight, simulating field conditions. The overlying water in the chambers was gently mixed by a magnetic stirrer driven by the rotating magnet in the middle of the incubation tanks. Stir bars were placed approximately 10 cm above the sediment surface, and the rotating speed of the rotor was set to 30 rpm. Prior to starting measurements, chambers were allowed to acclimate in the incubation tanks for 6 h to ensure steady-state concentration profiles. Chambers were sealed with Plexiglas lids 30 min before sampling. Water samples were slowly taken from the chamber after each experiment was incubated for 8 h in the lab. We took water samples from the chambers for the modified dilution experiment. DOC concentration was analyzed in previous studies [26]. DOC content was measured by filtering water through a 0.7 µm glass fiber filter (GF/F, Whatman). To prevent contamination with organic materials, the glass bottles for DOC analysis were pre-washed in 0.1 N HCl and precombusted at 450 °C for 4 h before analysis.

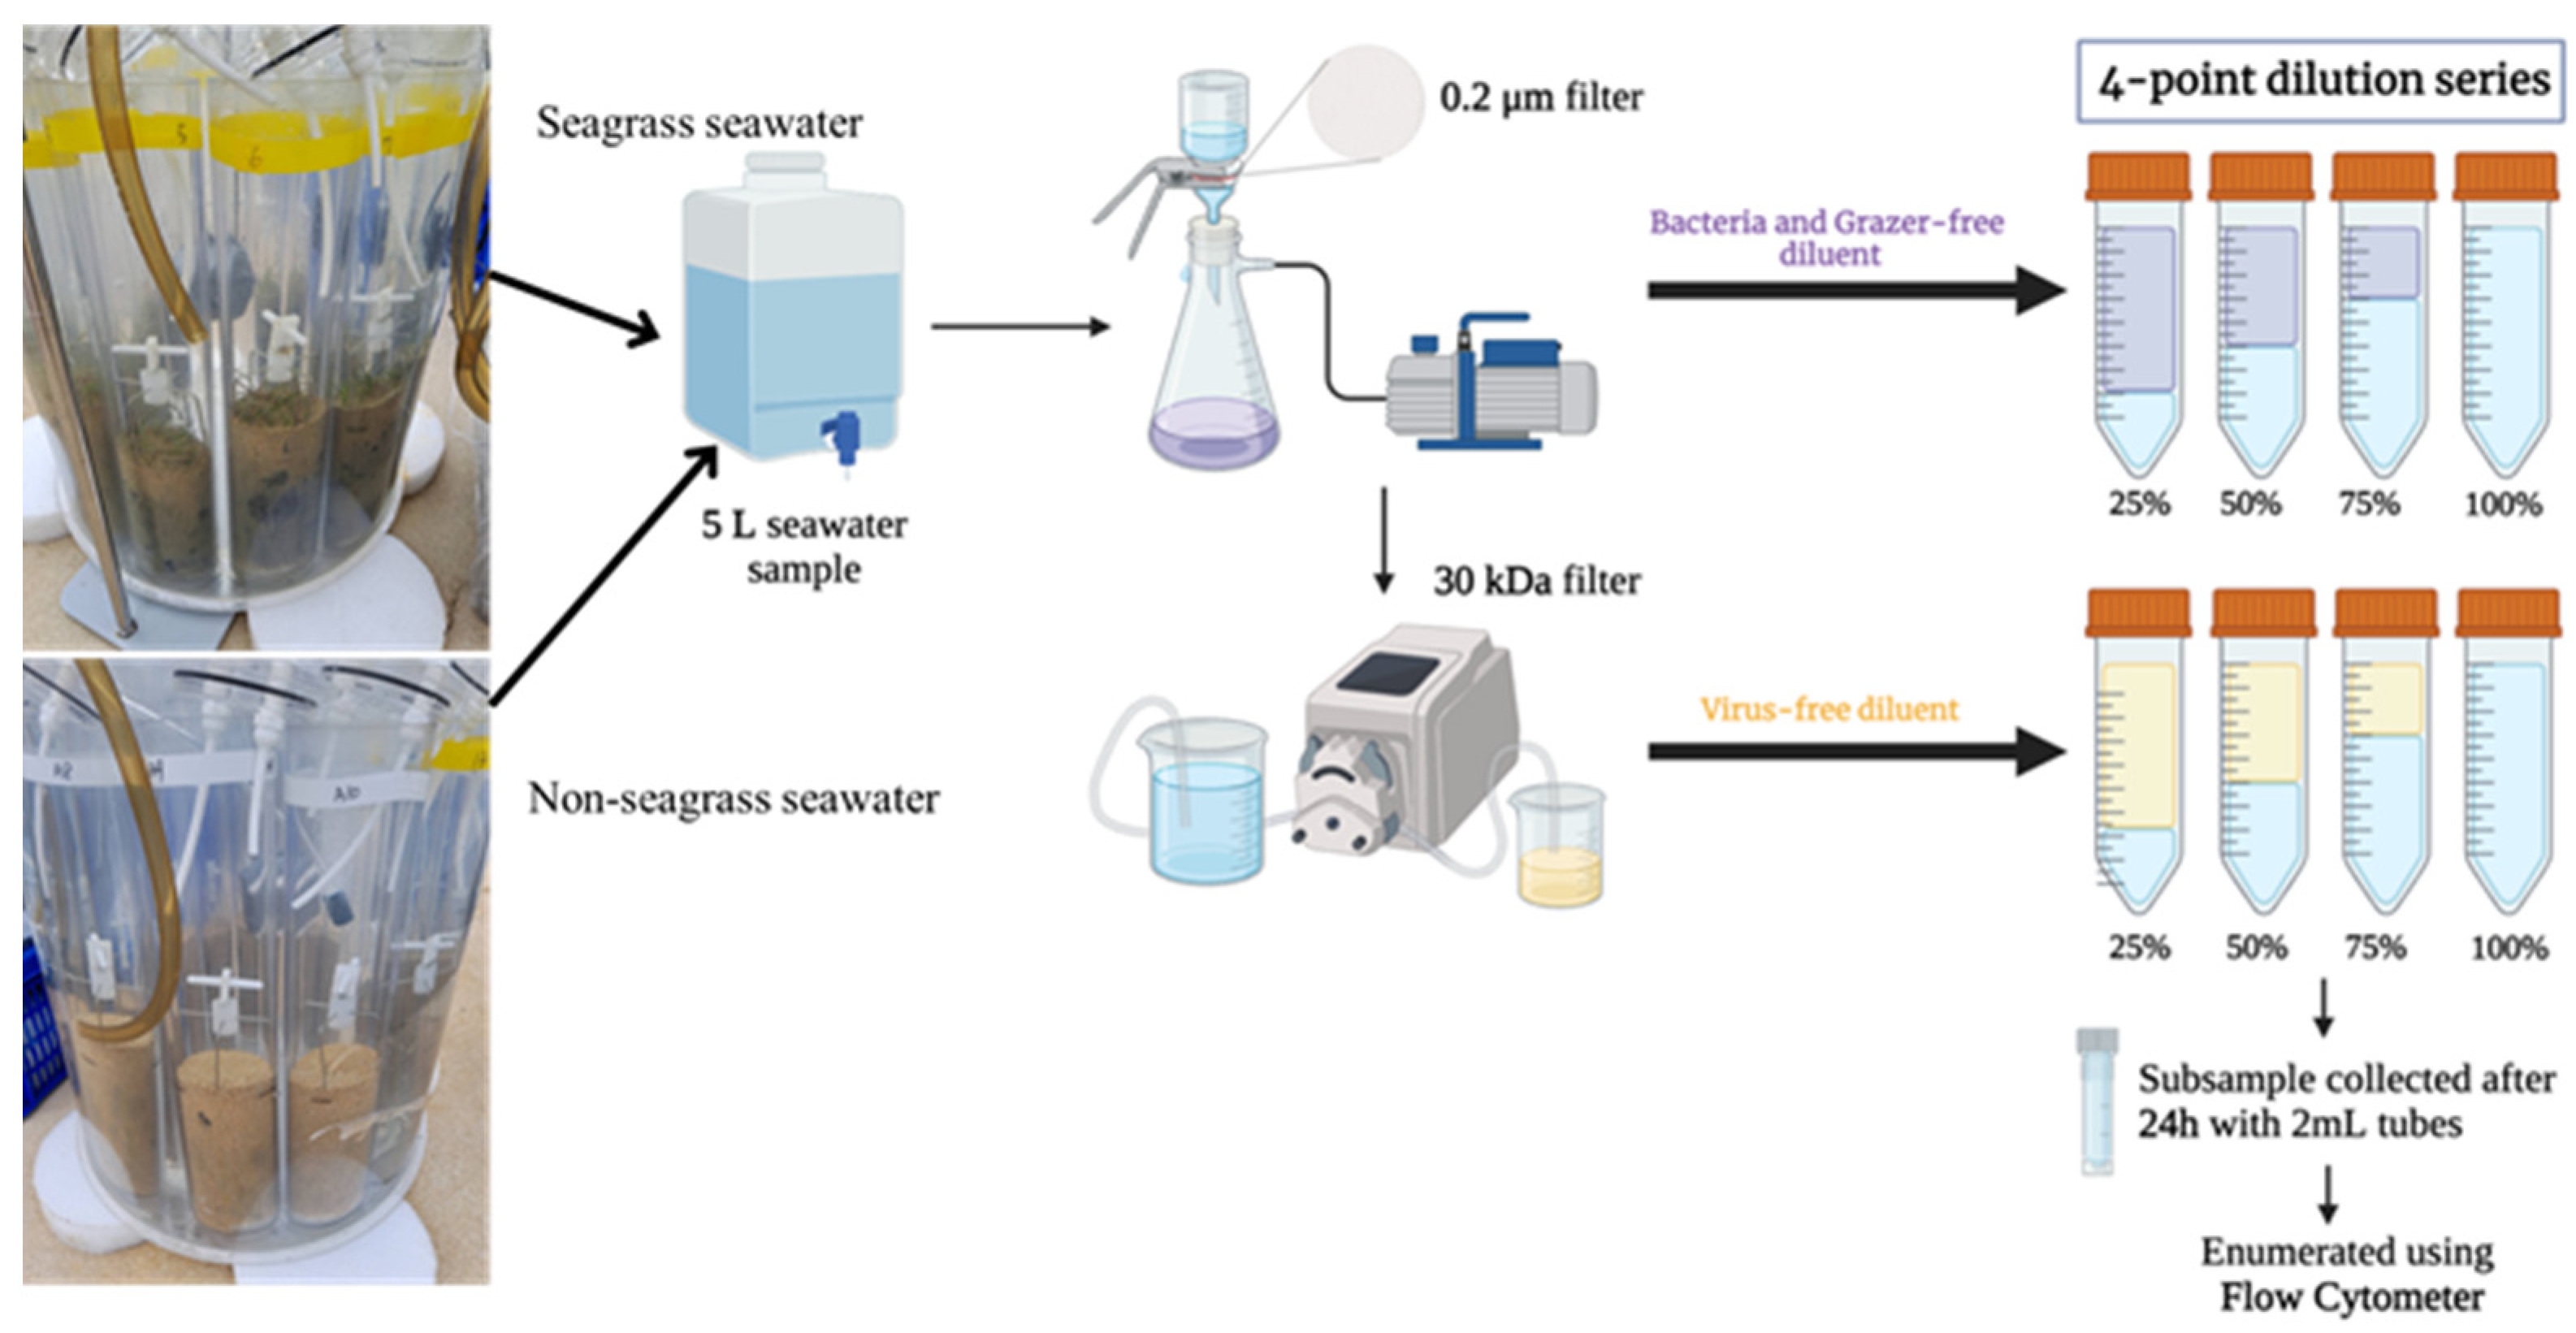
2.2. Modified Dilution Experiments

A comparison of seagrass-containing surface waters with unvegetated waters was performed to determine how the seagrass environment affected bacterial and Synechococcus spp. growth and loss (Figure 2). These results were obtained using the modified dilution method [27] to examine bacterial and Synechococcus spp. growth, grazing, and viral lysis rates. We first collected subsample water from the chambers and passed it through a 10 µm mesh filter to remove large microzooplankton. We then passed it through Nuclepore 47 mm filters (type PC, pore size 0.2 m) to gather the standard diluent. A 4-point dilution series of 25, 50, 75, and 100% of 10 µm filtered seawater serial dilutions were prepared with filtered seawater of 0.2 µm pore size. Viral mortality and grazing were altered in a dilution series using 30 kDa filtered seawater instead of 0.2 µm filtered water. Triplicates of 50 mL polycarbonate bottles were incubated for 24 h under natural light in a water bath set at the in situ seawater temperature at the time of sampling (Figure 1). We collected water from every bottle at the beginning (T0) and the end (T24) of the incubation period to test for bacteria and Synechococcus sp. The calculated net growth rate for bacteria and Synechococcus spp. was ln(Nt24/N0)/t for each dilution of the experiment (0.2 µm and 30 kDa). The final and initial abundances of bacteria and Synechococcus spp. are represented, respectively, by Nt24 and N0, while t represents the duration of the experiment (24 h). In our study, we calculated the growth, grazing, and viral-induced mortality coefficients for bacteria and Synechococcus spp., following Evans et al. [26]. Calculating the growth rates of bacteria and Synechococcus spp. (µ) without both mortality factors was accomplished through a 30 kDa dilution series regression. Based on the slope of a 0.2 m-filtered seawater dilution series, a nanoflagellate grazing coefficient (mg) was calculated. The slope of the seawater dilution series of 30 kDa also served as a basis for determining the nanoflagellate grazing and viral-induced mortality coefficients (mv + mg). Based on this equation, virus-induced bacterial and Synechococcus spp. mortality is equal to the difference between the slopes of the two regressions, which is mv = [(mv + mg) − mg].

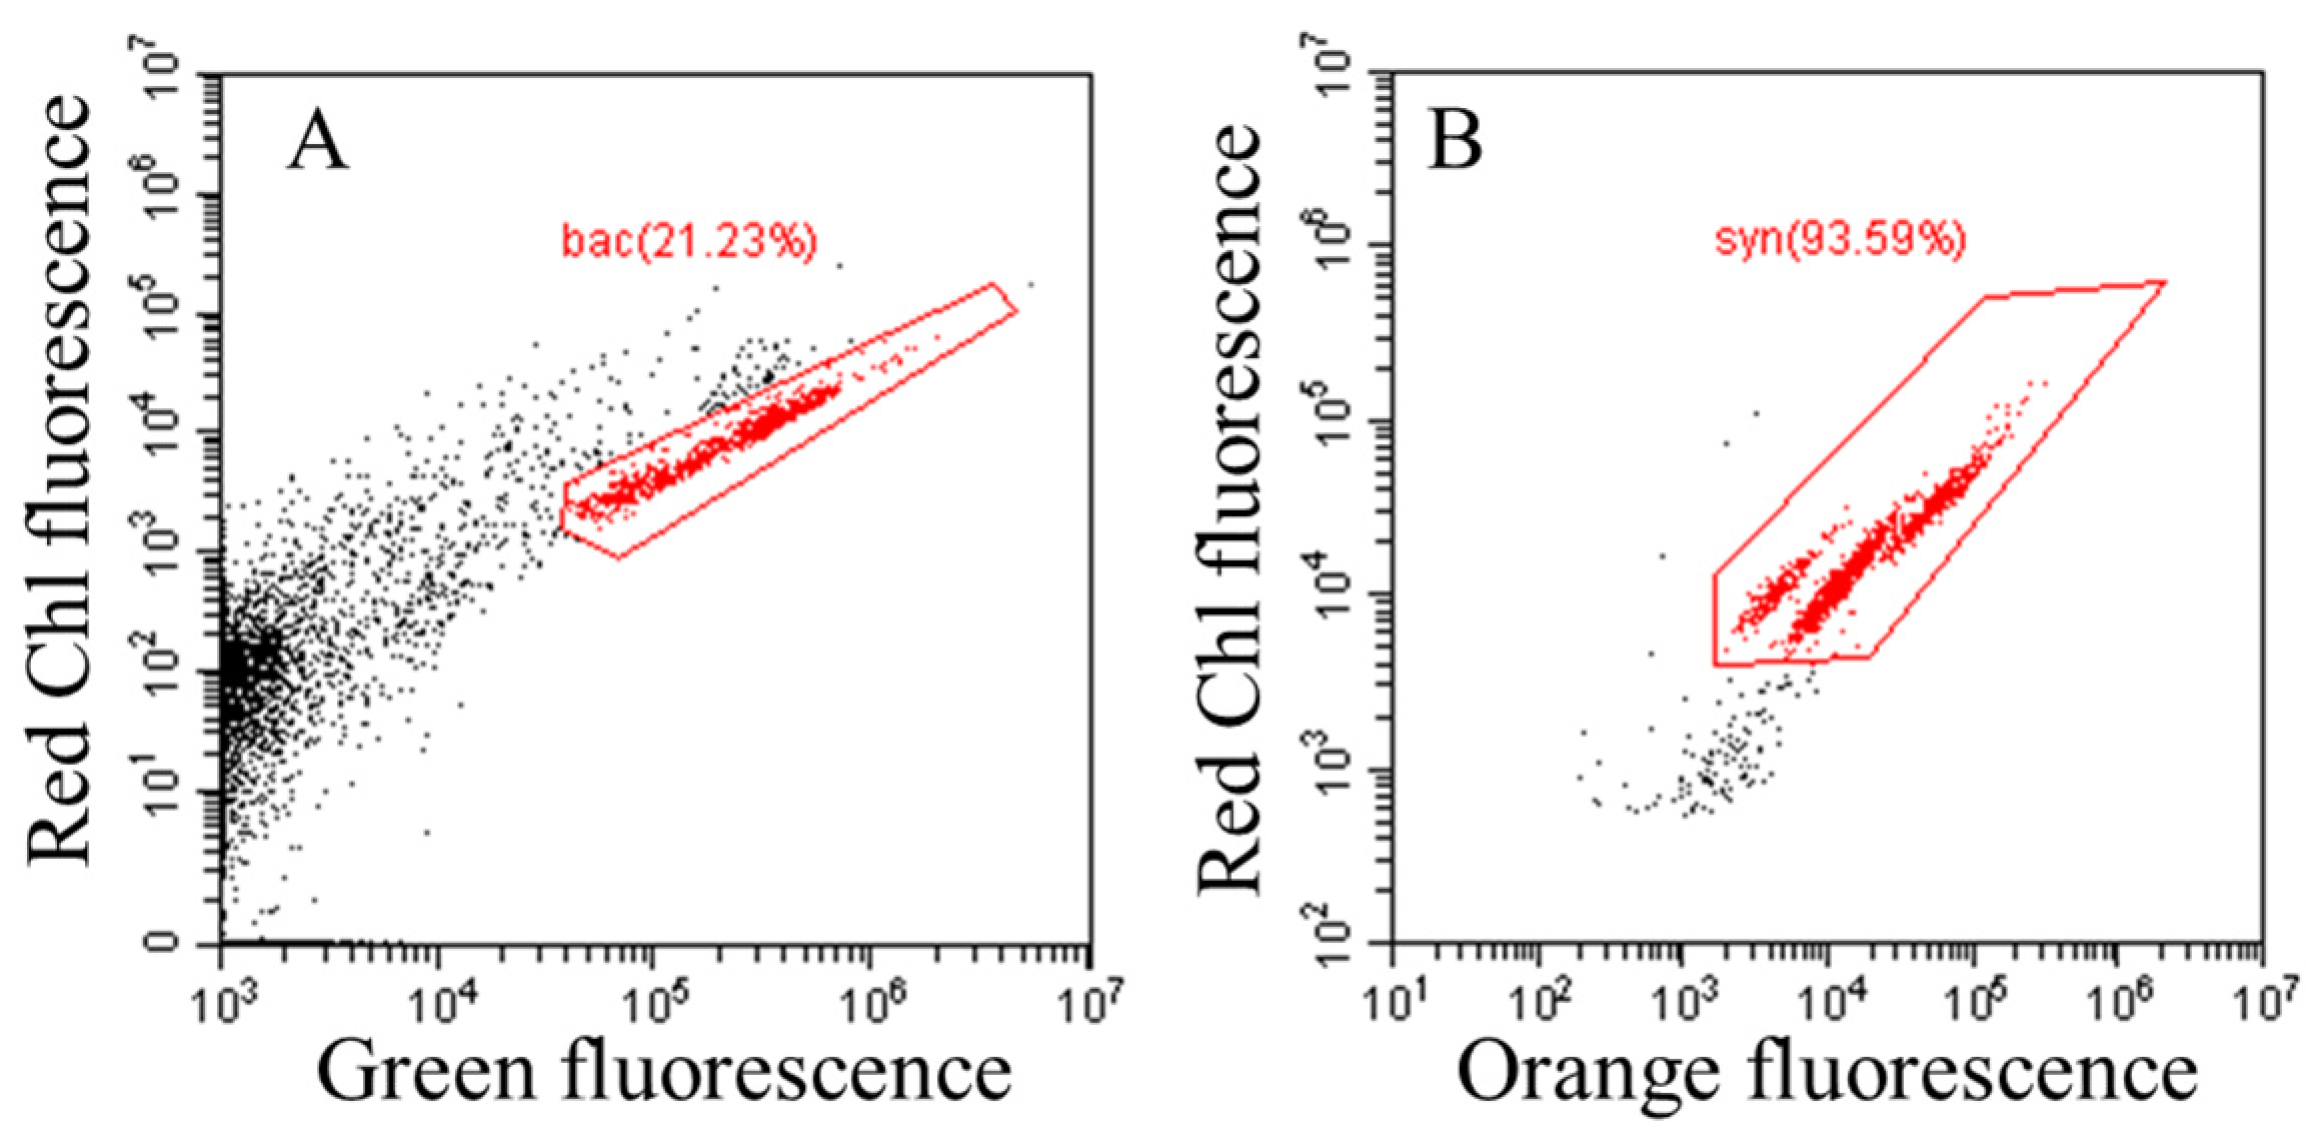
2.3. Flow Cytometric Analysis

The CytoFLEX S flow cytometer (FCM) (Beckman Coulter, Indianapolis, IN, USA) was equipped with a 488 nm argon-ion laser, a 525 nm filter, and a SYBR signal trigger for the analysis of bacteria and Synechococcus sp. SYBR Green I (final concentration 1:10,000) was added to bacteria samples for 15 min in the dark before FCM was applied, as described by Hammes and Egli [28]. TE buffer stained with the same concentration of SYBR Green I was used as blank controls to eliminate noise in the buffer. As described previously [29], Synechococcus spp. were identified and enumerated by light scattering and fluorescence signals, with orange fluorescence being a unique characteristic of phycoerythrin-containing Synechococcus spp. (Figure 3).

2.4. Data Analysis

To estimate instantaneous growth and mortality due to grazing and viral lysis, a linear regression analysis of apparent growth rates against the whole water fraction of each dilution series (0.2 µm and 30 kDa) was conducted. The significance of the regression analysis in the 0.2 µm fractionated and 30 kDa dilution series was tested using analysis of variance (ANOVA). An F-test was used to investigate whether there was a significant difference between the mortality slopes between the 0.2 m and 30 kDa dilution series, thus assessing the magnitude of viral mortality in these experiments. Statistical analysis was performed using STATISTICA 7.0 software (SAS).

3. Results

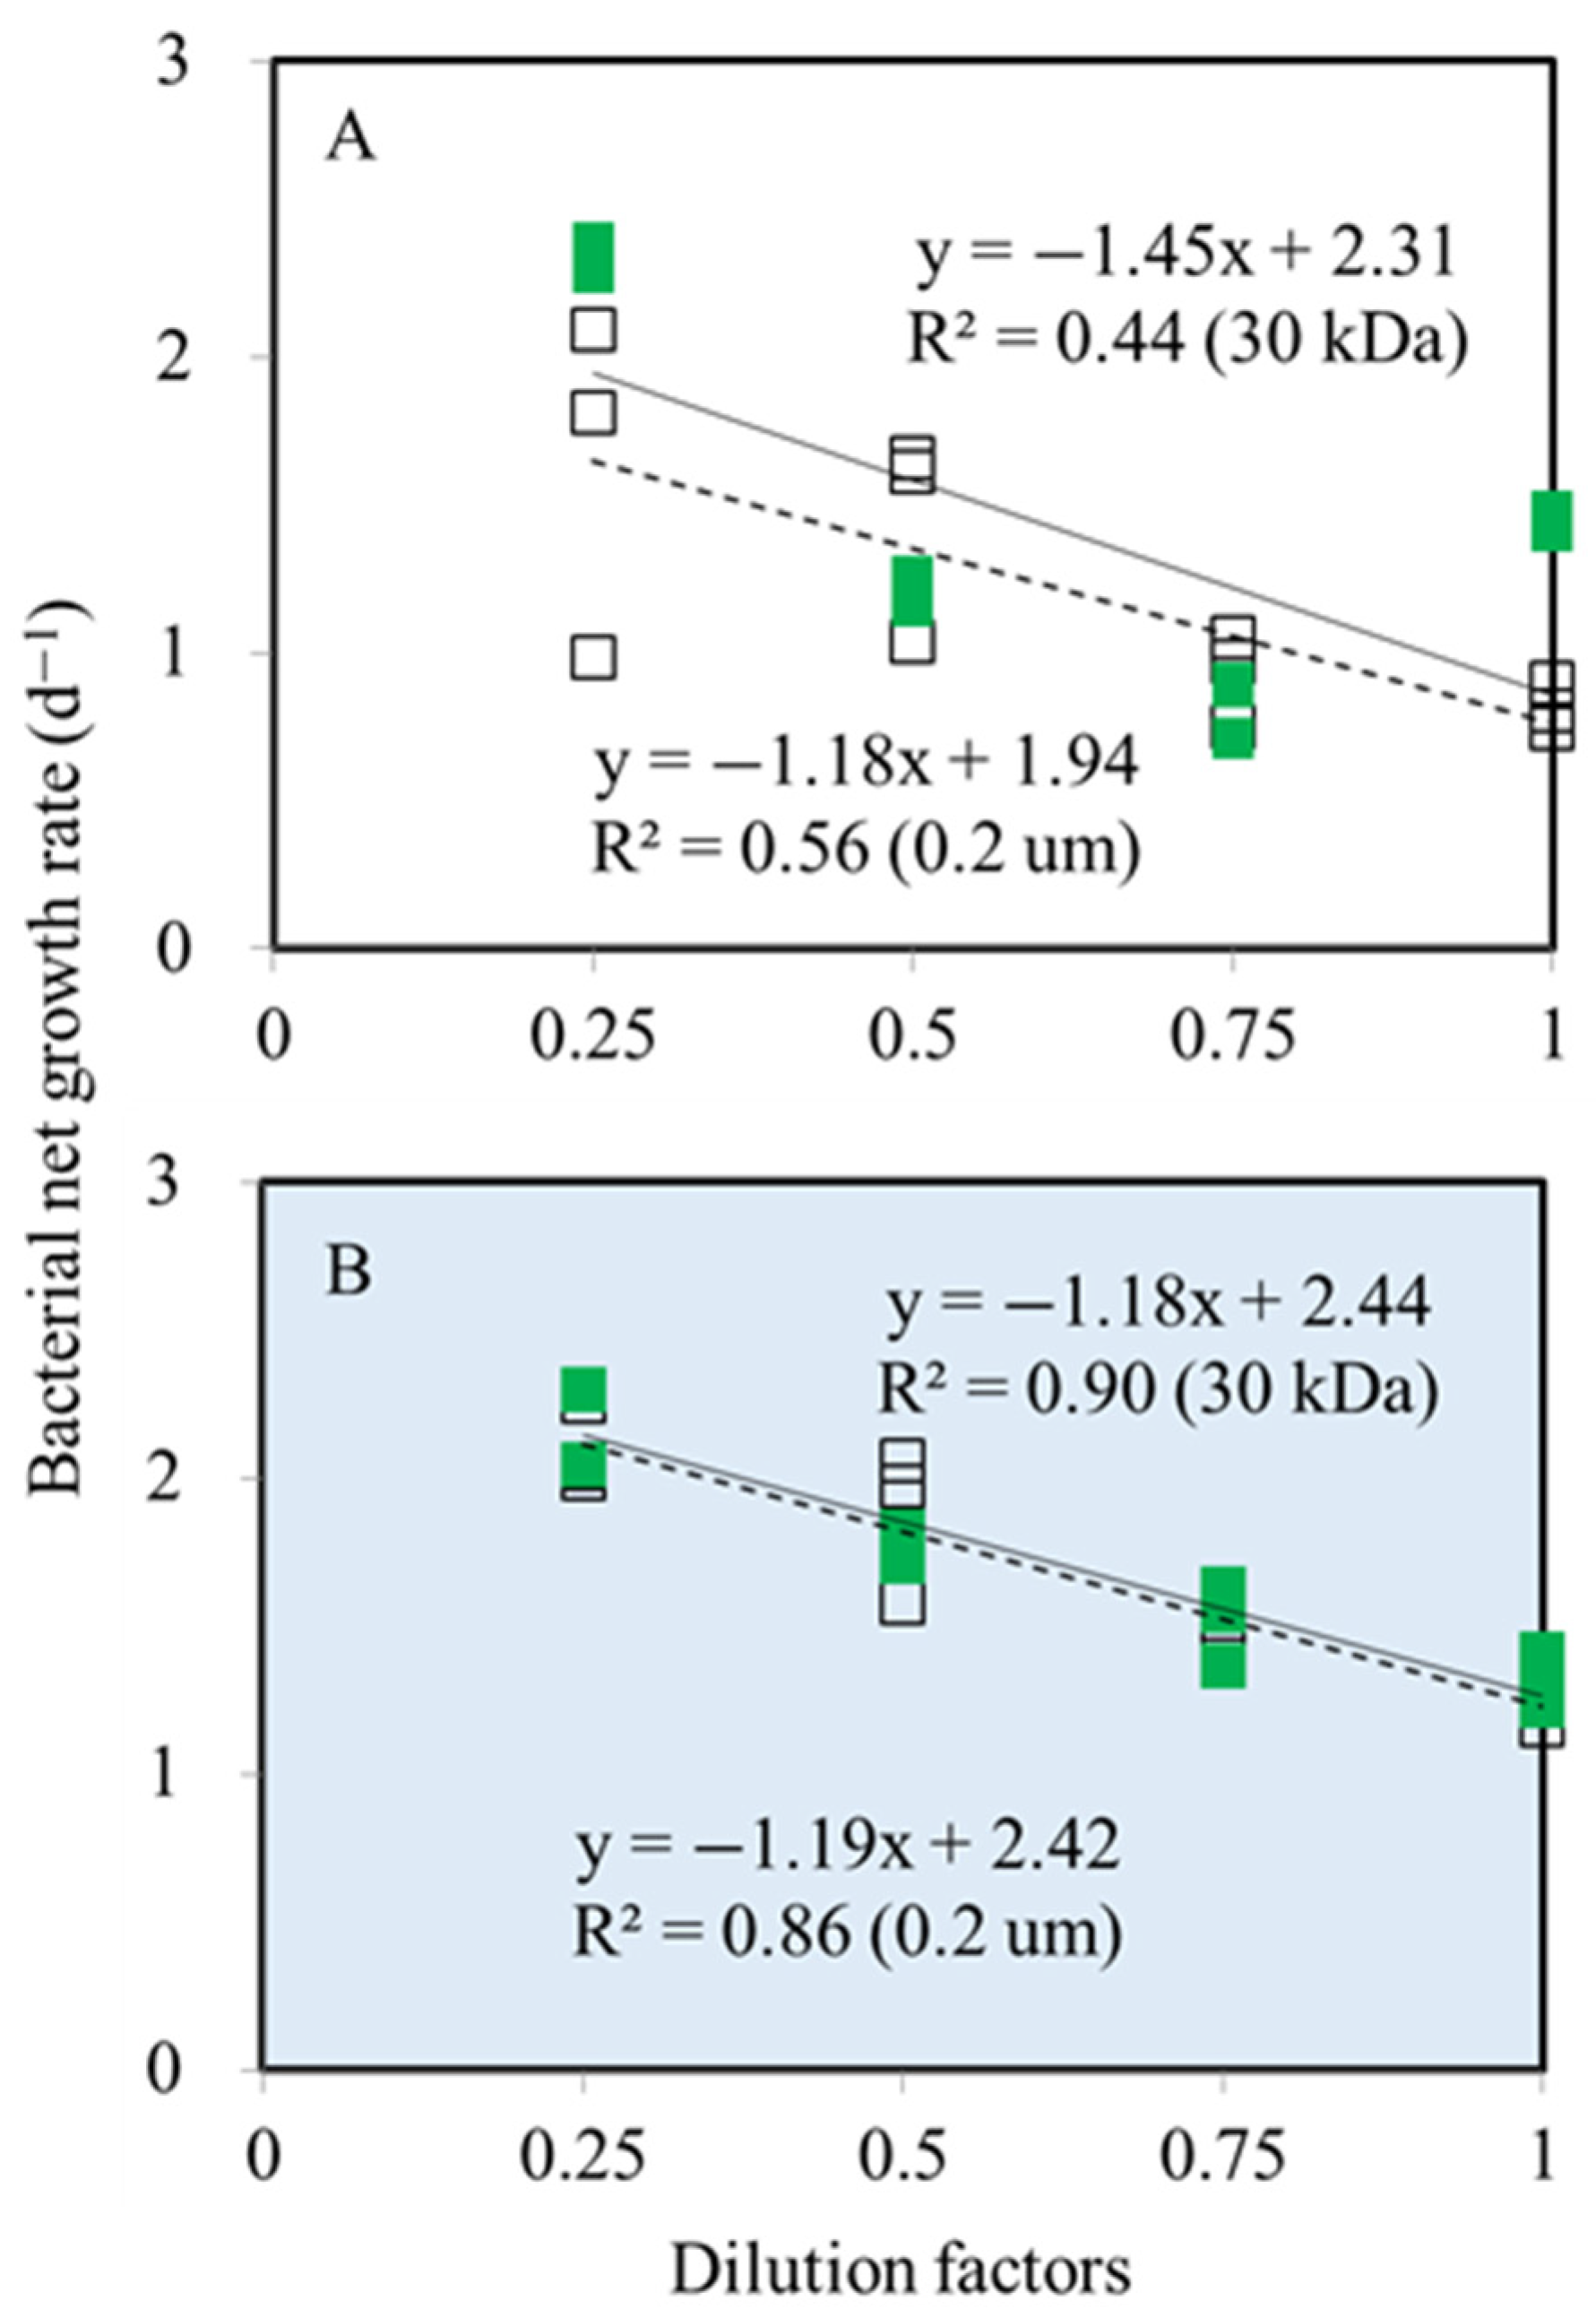
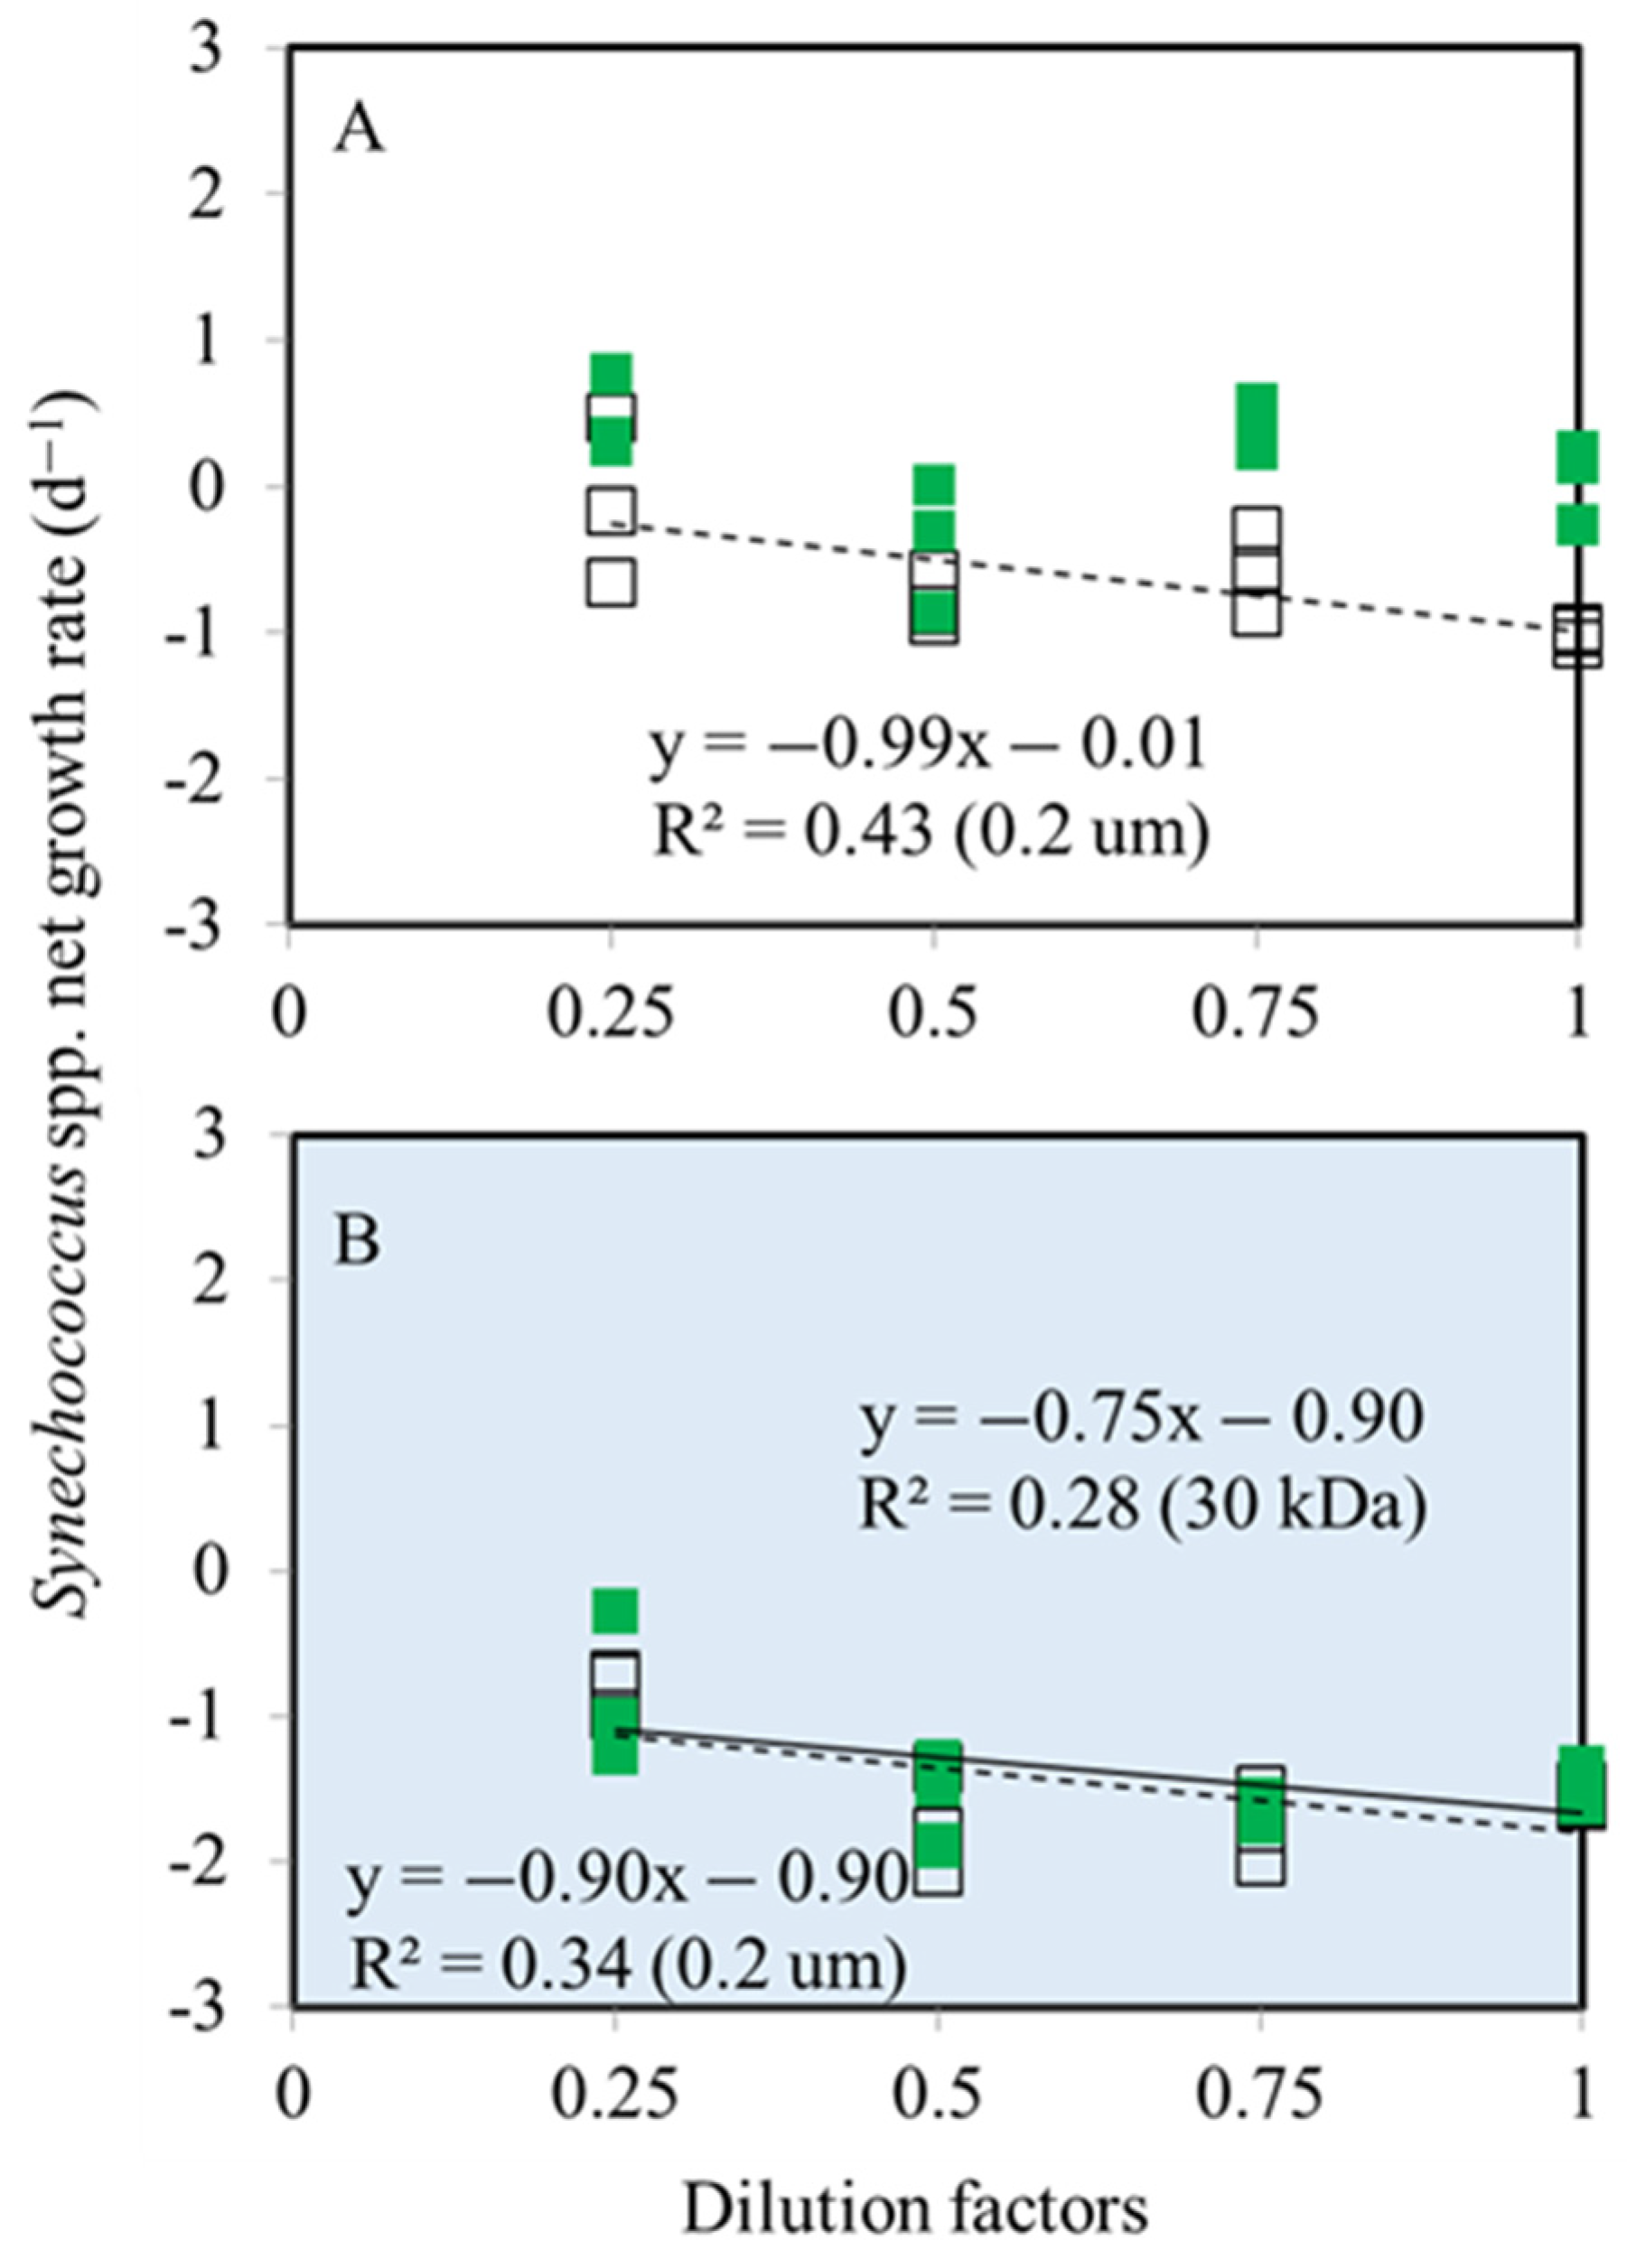
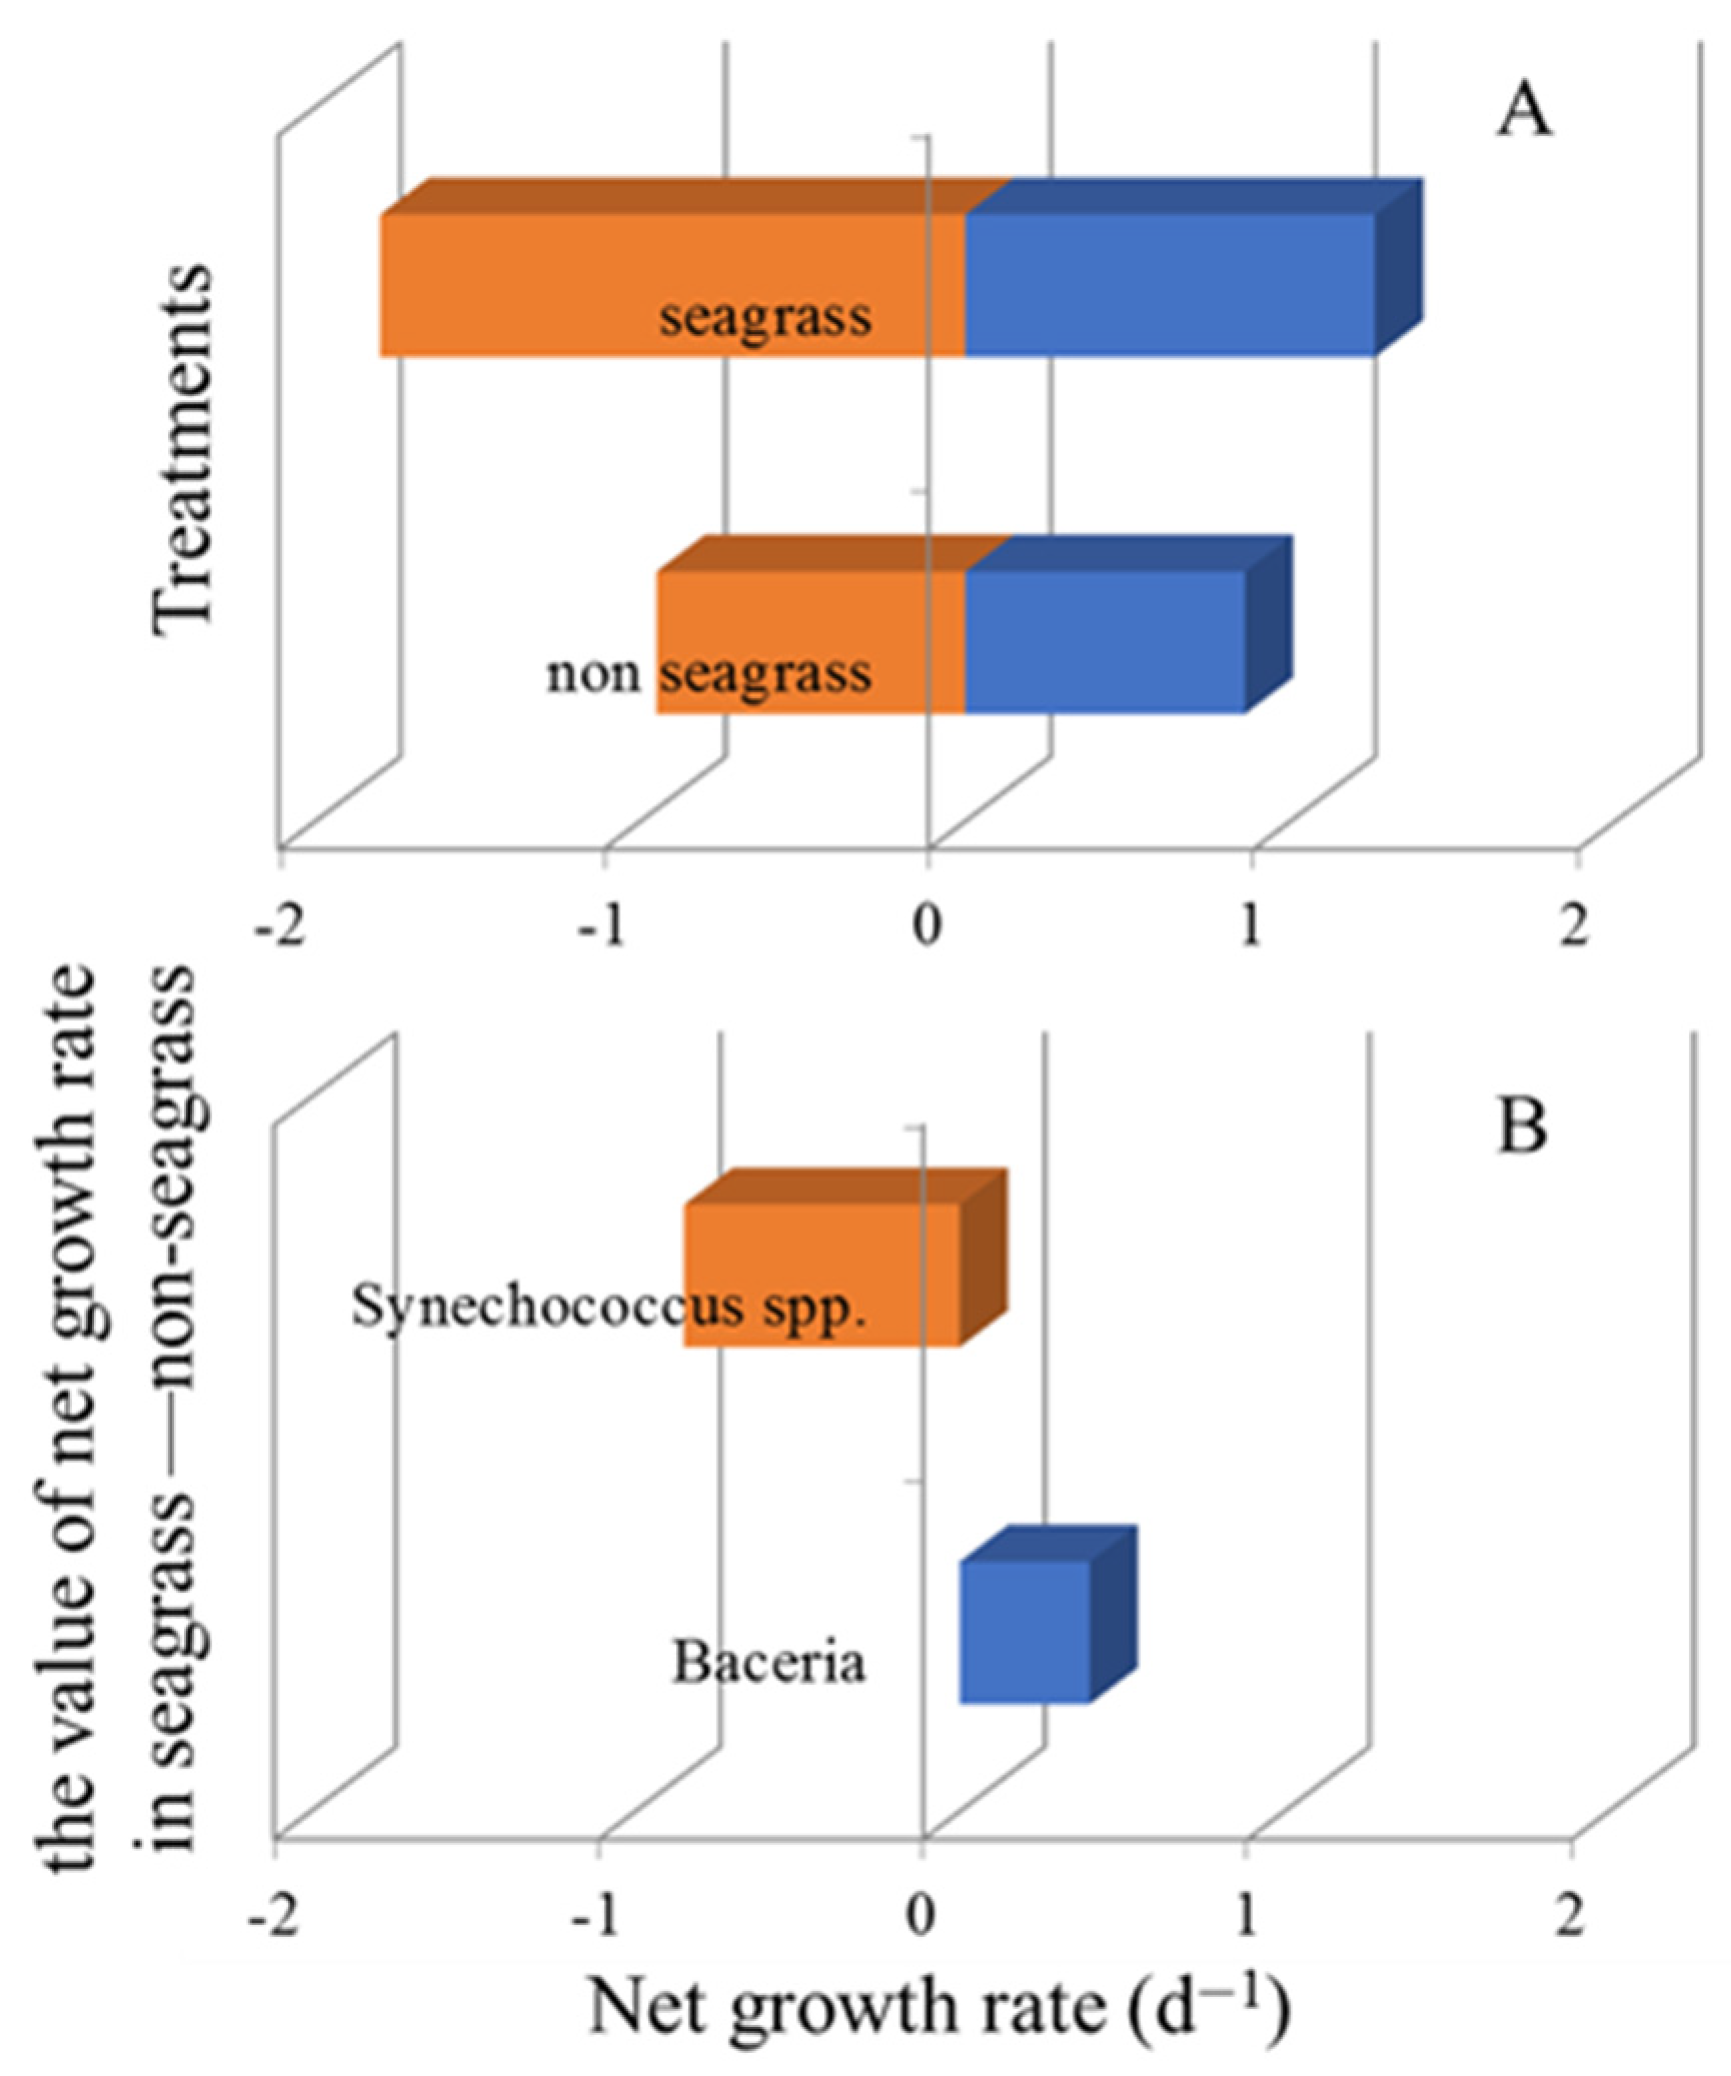
3.1. Bacterial and Synechococcus spp. Growth Rates

In this study, the water temperature in the chambers was 24 °C. According to Figure 4, an increase in the apparent growth rate is proportional to the dilution factor using least-square regression analysis. A negative slope was observed in both dilution series, regardless of seagrass presence (ANOVA, p < 0.05) (Figure 4). Based on the y-intercepts of these regression lines (Figure 4A,B), the fractionated 30 KDa series without and with seagrass showed 2.31 and 2.44 d–1. In the absence of lytic and grazing pressures, these values correspond to the instantaneous growth rate of bacteria.
For Synechococcus spp. studies without seagrass chambers, no significant relationship was observed between dilution and net growth rates in the 30 kDa dilution series (ANOVA, p > 0.05) (Figure 5A). According to the averaged values of 100% unfiltered water, the growth rate of Synechococcus spp. was 0.04 d−1 in this case (Figure 5A). Furthermore, there was a significant linear relationship between the net growth rate and dilution for both dilution series in the experiment with seagrass (ANOVA, p < 0.05). From the intercept of the linear regression of the 30 kDa dilution series, the growth rate of Synechococcus spp. was calculated to be −0.90 d−1 (Figure 5B).

3.2. Bacterial and Synechococcus spp. Mortality

In the modified dilution experiments conducted without seagrass chambers, the regression coefficients (slopes) were 1.45 and 1.18 d–1 for fractionated series of 30 kDa and 0.2 µm, respectively (ANOVA, p < 0.05) (Figure 4A). Both slopes were not significantly different (F-test, p > 0.05). Moreover, both dilution series were not significantly different in slope between the 2 lines in the seagrass chambers (F-test, p > 0.05) (Figure 4B). Accordingly, grazing was the only significant source of bacterial mortality at that time, and the estimated bacterial grazing rate was 1.18 d−1 without seagrass and 1.19 d−1 with seagrass (Figure 4).
Based on fractionated series 0.2 µm for the Synechococcus spp., the slope of the regression represents protozoan grazing and measurements of 0.99 and 0.90 d−1 without and with seagrass, respectively (ANOVA, p < 0.05) (Figure 5).
To determine which bacteria and Synechococcus spp. in abundance could accumulate, we calculated the net growth rate (μNet = μ − (g + v)) (Figure 6). According to the slope of the grazer-and-virus-free diluent series regression of 30 kDa, the net growth rate of bacteria was 1.26 d−1 in seagrass and 0.86 d−1 in seagrass-free samples. In these analyses, the estimated μNet was positive, with all bacteria detected in the incubations without and with seagrass chambers (Figure 6A). When comparing the difference in bacterial net growth rate between water in seagrass and water in non-seagrass chambers (the value of seagrass minus non-seagrass), we found a positive value (Figure 6B). It is possible to observe a higher accumulation of bacteria in seagrass presence chambers in this situation. For Synechococcus spp., the μNet estimates were negative, regardless of the presence of seagrass (Figure 6A). Based on these results, there was a decrease in the abundance of Synechococcus spp. both in chambers with and without seagrass. Comparing seagrass chambers with non-seagrass chambers, Synechococcus spp. abundance may have decreased dramatically in seagrass chambers with a generally negative net growth rate (Figure 6B).

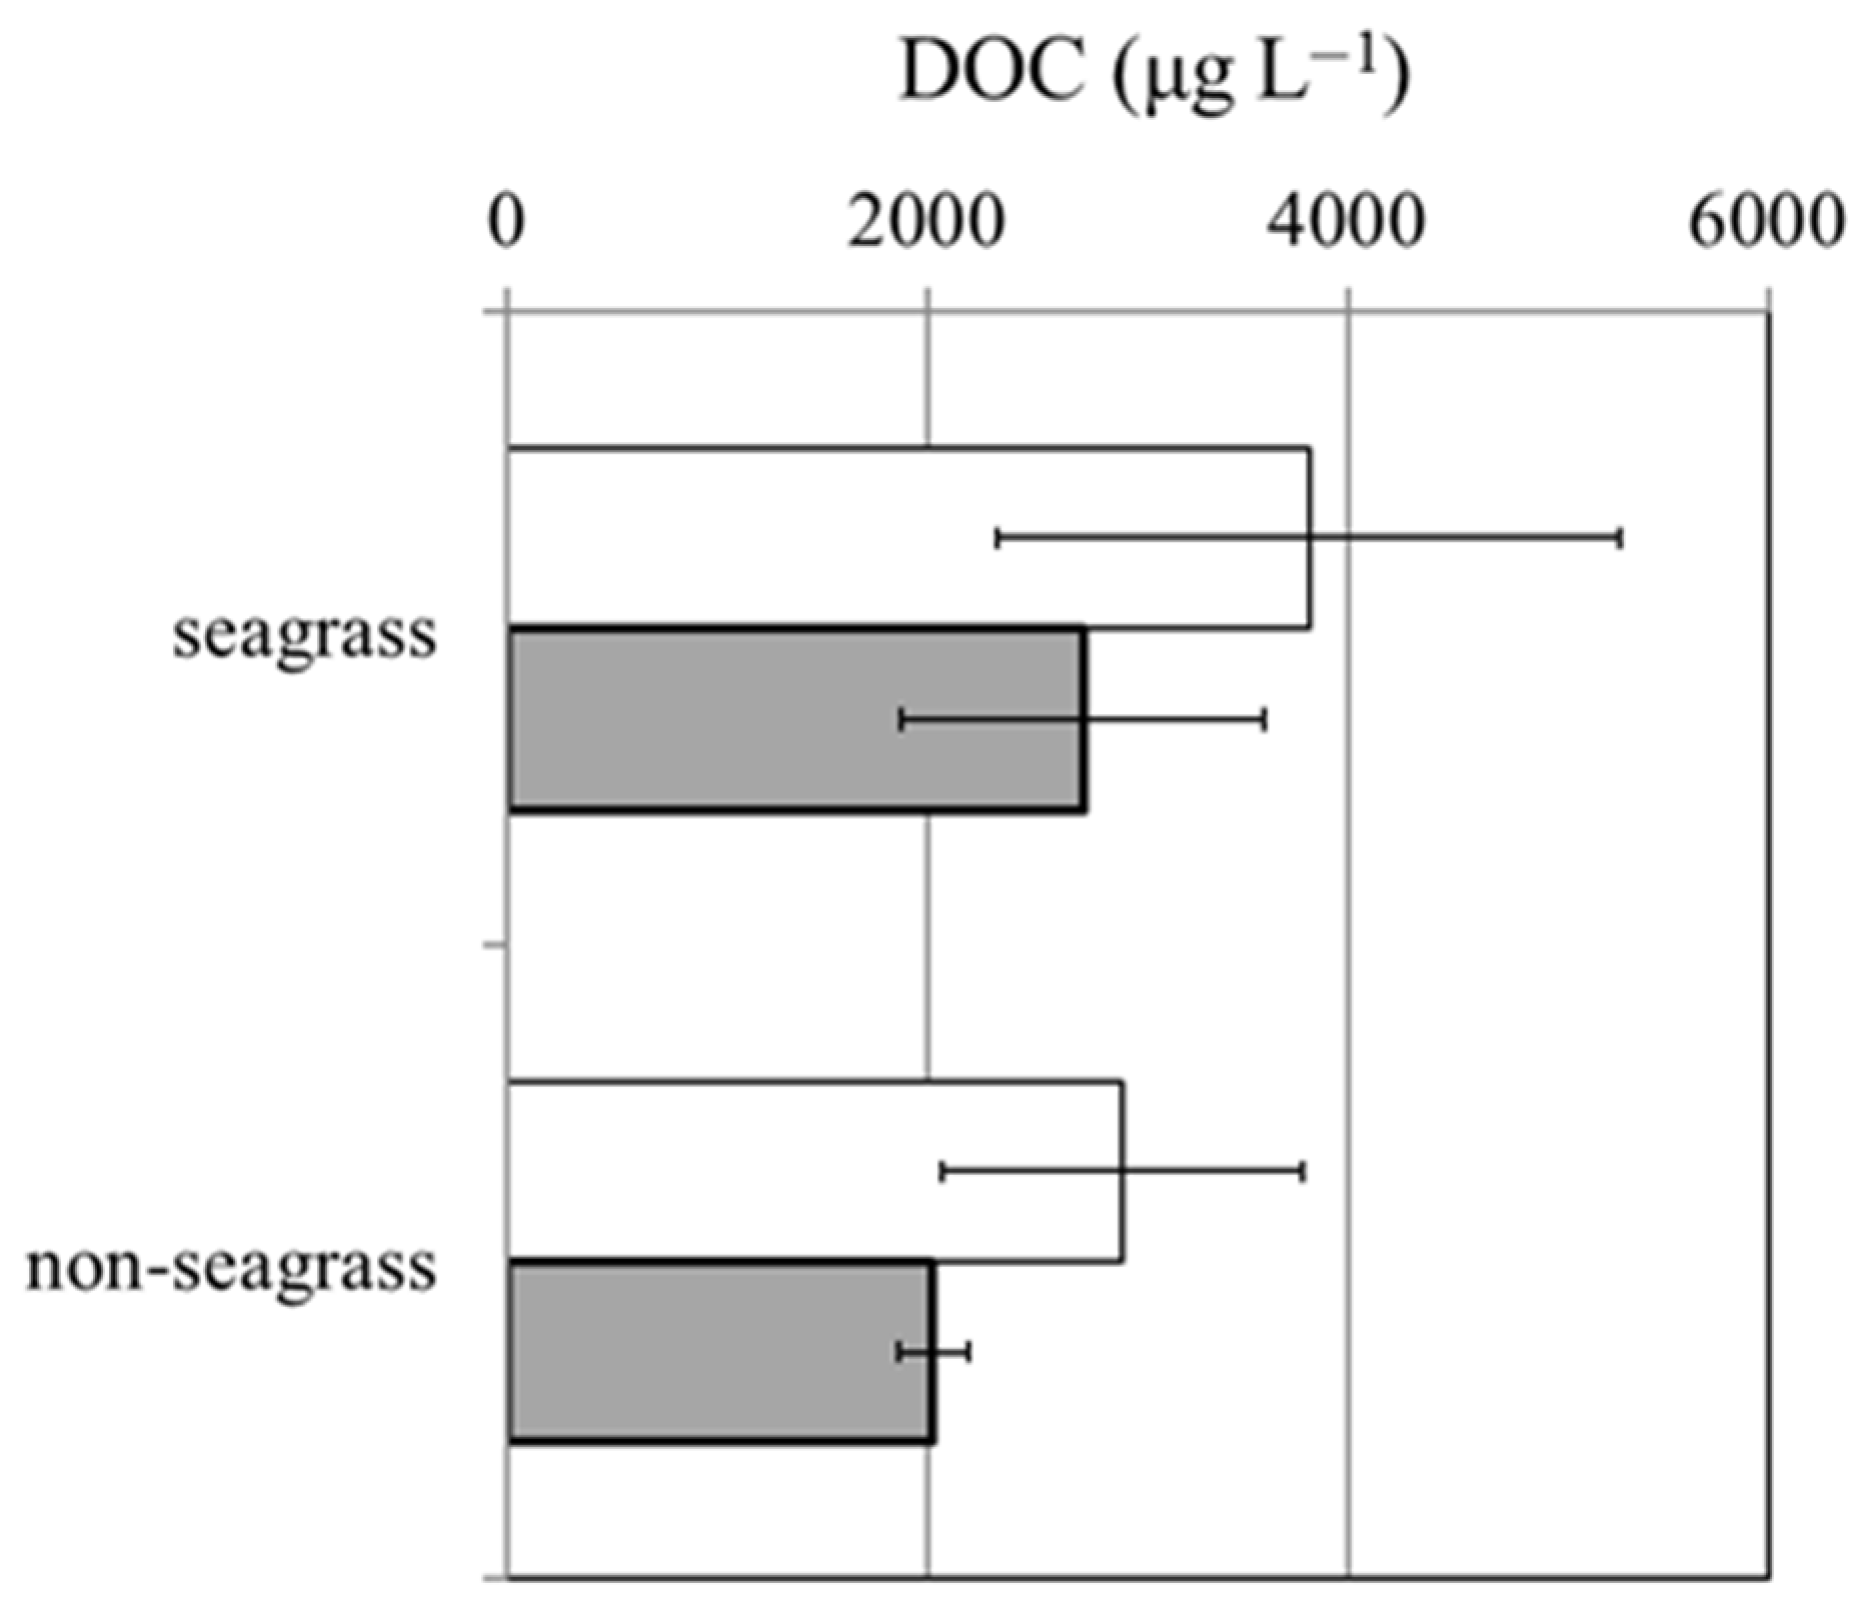
3.3. Dynamic Changes in DOC Concentration
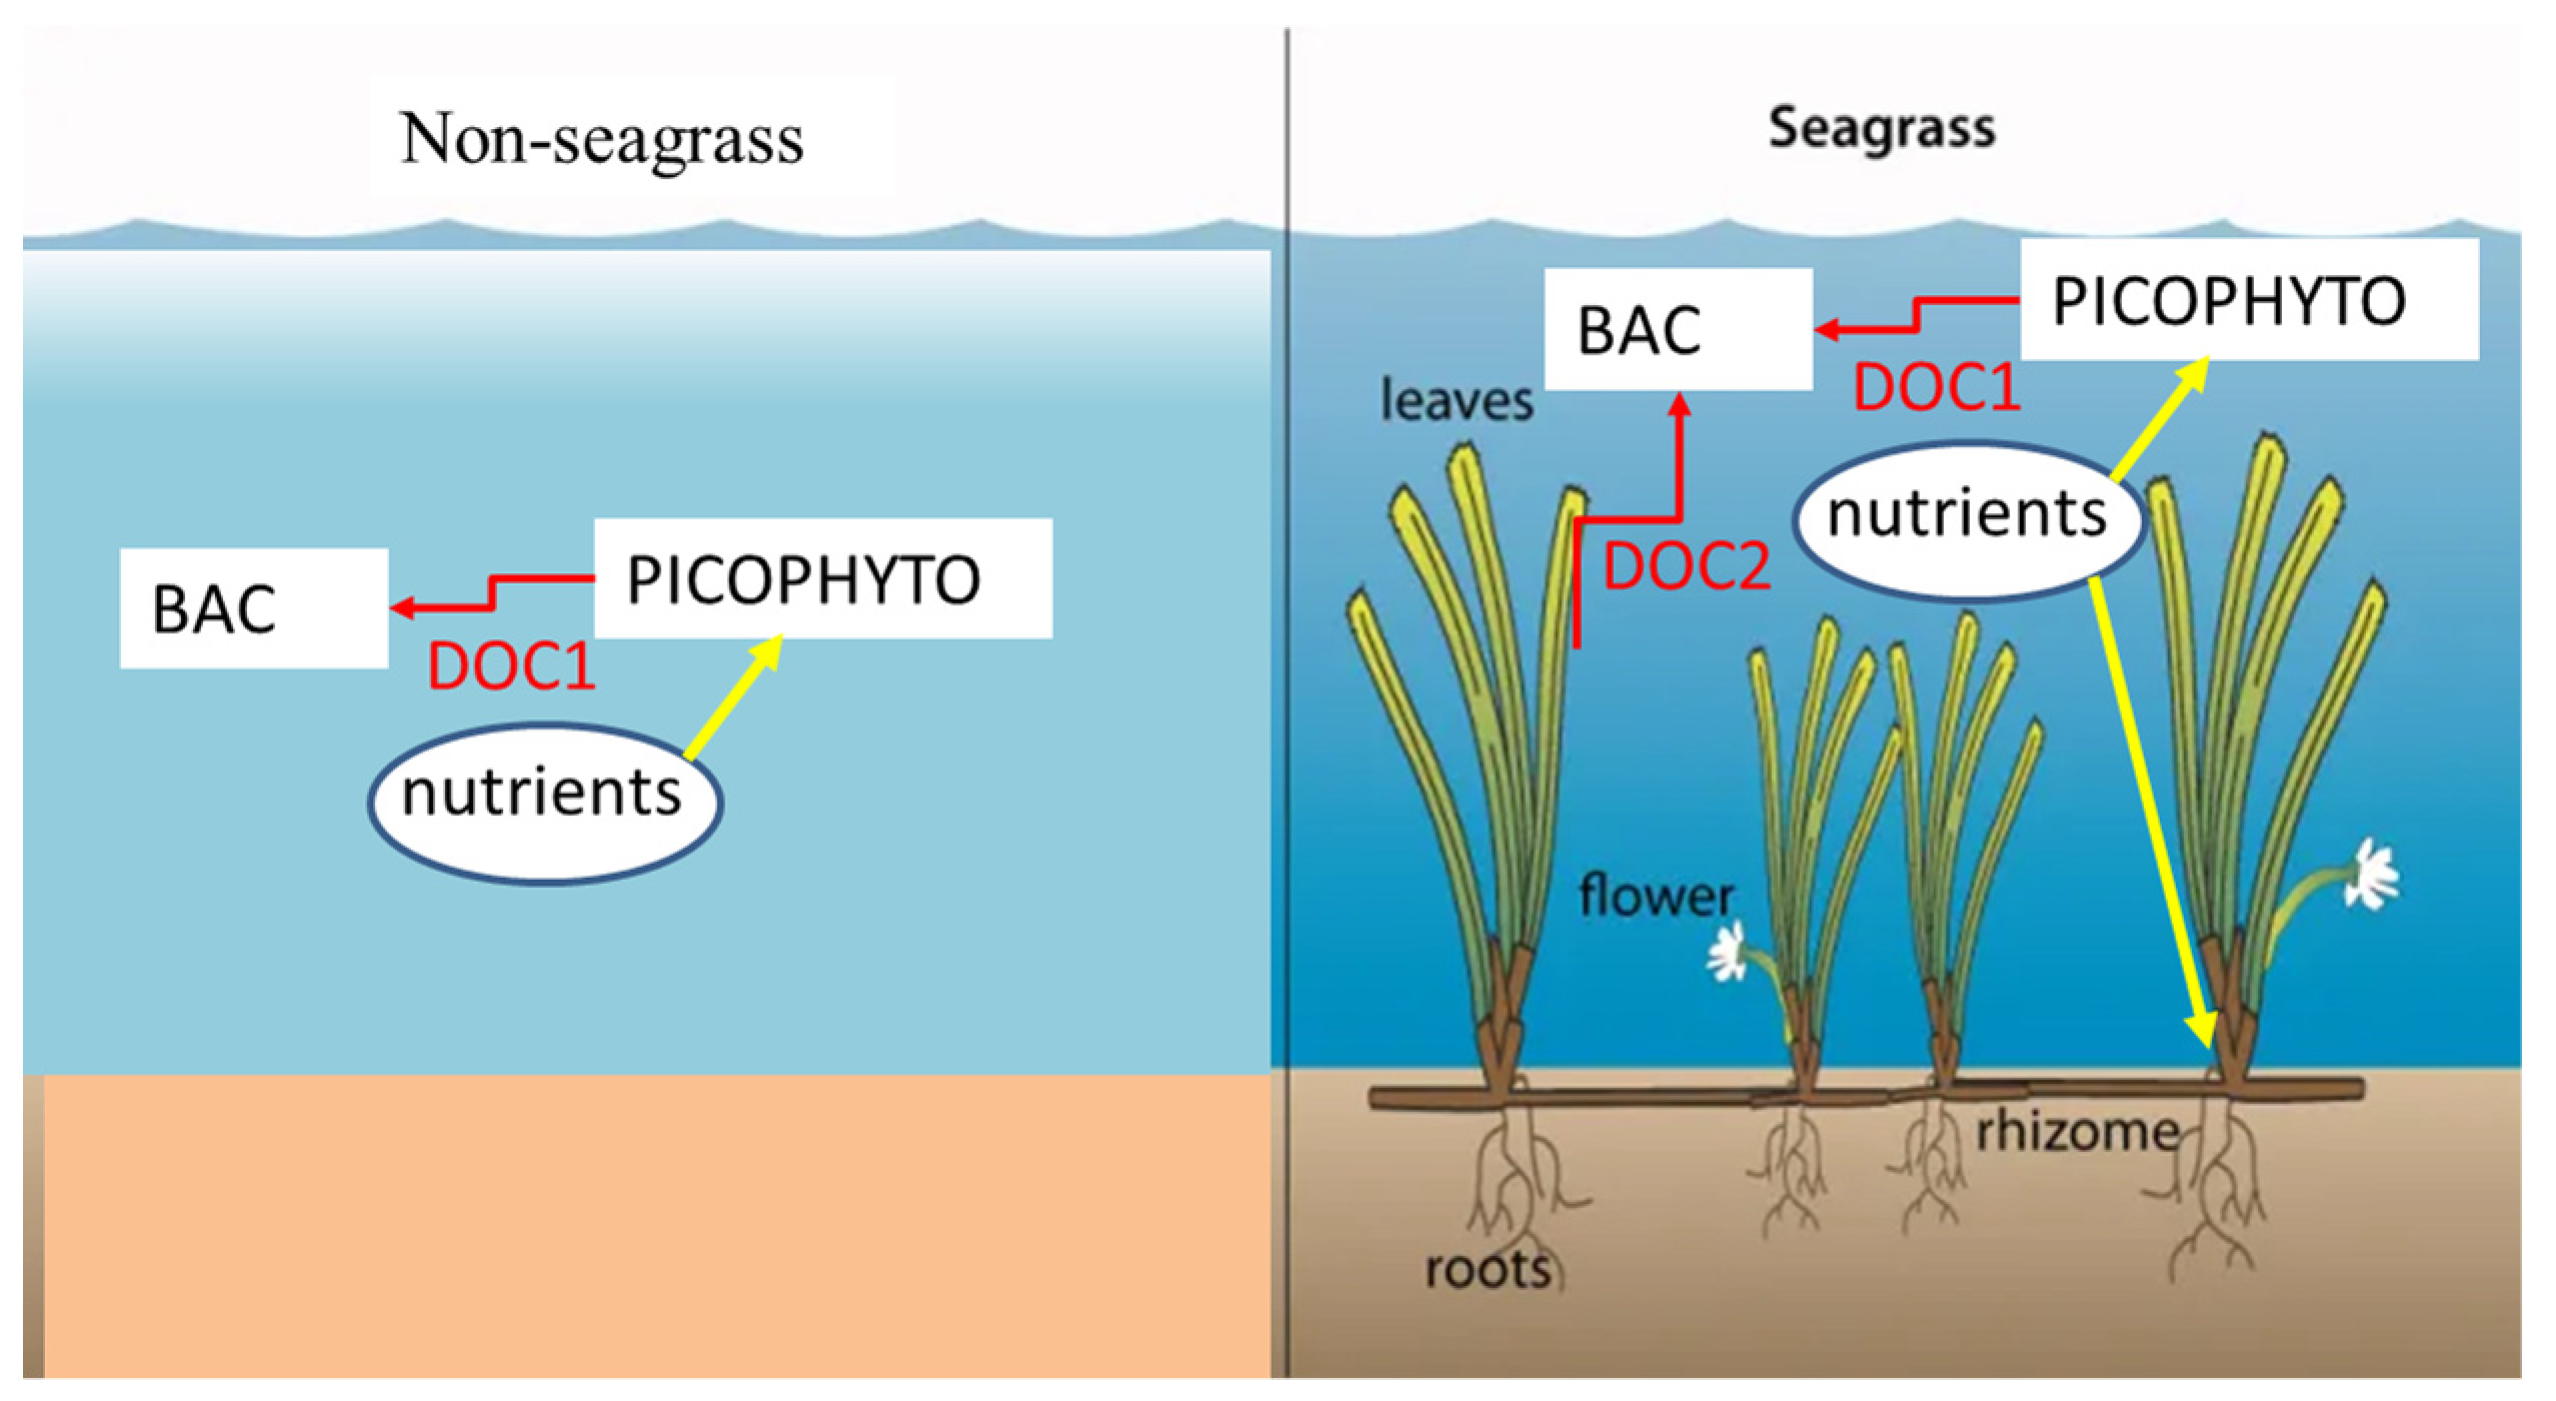
In the current study, DOC levels were measured in chambers containing seagrass and non-seagrass. The average concentration in the seagrass environment had a slightly higher level of DOC (3814 ± 1479 µg L−1) compared to non-seagrass chambers (2930 ± 855 µg L−1) at the beginning of incubation (Figure 5). Nonetheless, no significant difference was detected between seagrass and non-seagrass treatments (t-test, p > 0.05). After 24 h incubation, the concentration of DOC decreased to 2741 ± 861 and 2027 ± 164 µg L−1 in seagrass and non-seagrass chambers, respectively (Figure 7).

4. Discussion

When seagrass is present in a soft sediment environment, it increases its physical complexity, which will have a significant impact on the local environment compared with its surroundings. Furthermore, a seagrass ecosystem is essential for coastal carbon cycling because it balances coastal carbon and buffers regional ocean acidity. By studying bacterial and Synechococcus spp. growth and loss in seagrass ecosystems, we can calculate ocean carbon flux and find clues to unknown carbon sinks. In this study, we investigated different changes in bacterial and Synechococcus spp. growth and mortality (grazing versus virus-induced mortality) in benthic chambers with and without seagrass. In this study, the net growth rate of bacteria was higher in the seagrass chambers than in the non-seagrass chambers. Furthermore, the growth rate of Synechococcus spp. was negative and calculated to be −0.90 d−1 in seagrass chambers. Using the modified dilution technique, we determined that grazing was the only significant source of bacterial and Synechococcus spp. mortality at that time.
In the original dilution protocol, phytoplankton grazing rates were determined by nutrient amendments, ensuring that the dilution effect was not affecting phytoplankton growth rates [30]. The efficacy of this part of the procedure, especially in the modified method that also considers viral mortality, has been questioned in some recent studies. The addition of nutrients to oligotrophic environments stimulated microzooplankton-induced mortality rates of cyanobacteria, which led to the overestimation of microzooplankton grazing rates. This probably resulted from improving food quality in cyanobacterial cells. Nutrient addition was also shown to increase viral burst size, which in turn led to an increase in viral production [31], resulting in an overestimation of viral-induced mortality. Kimmance and Brussaard [32] also advise against adding nutrients to dilution experiments because of the potential for unnatural growth rates. Therefore, nutrition was not added to the incubations in this study.
This manuscript concludes that all virus-mediated effects are non-significant, which is one of the most important results of the analysis. The low levels of lysis in environments may be explained by the confounding effects of viral infections on the growth and mortality of bacteria and Synechococcus spp. Furthermore, an appropriate incubation period must be determined for a regression curve to have a significant slope. The duration of the viral latent period is determined by not only the growth rate of the bacteria or picophytoplankton but also by the time between viral contact and lysis of the bacteria or picophytoplankton. The duration of incubation used in our study of 24 h is a critical aspect to consider. In previous studies, it has been shown that the lytic period of bacteriophages and cyanophages varies considerably, but most are associated with 24 h [33]. Because the incubation period is relatively long, it is possible that conditions were altered during incubation, resulting in substrate limitations as well as changes in bacterial and viral abundances. An important factor for the detection of virus-mediated effects in modified dilution assays is the duration of incubation. In addition, viruses and grazers appear to interact very complexly, potentially leading to antagonistic or synergistic effects on picoplankton [34]. It has been shown that nanoflagellates, through direct consumption of viruses or by grazing preferentially on viral-infected cells, can reduce viral abundance and infectivity [35].
Seagrass affects microbial communities according to the hydrodynamics and concentrations of organic matter and nutrients in a given environment. In the process of growing seagrass, the seagrass secretes DOM into the water, which bacteria can use to convert dissolved carbon into particle carbon [16,23]. There has been considerable evidence of bacterial abundance and production in seagrass ecosystems [15,36]. The abundance of bacteria found in seagrass beds is approximately ten times higher than that found in regions without seagrass [15]. In addition, 2–11% of the organic carbon produced by seagrass roots and rhizomes can be consumed by bacteria during photosynthesis [36]. Furthermore, organic carbon from sources outside the seagrass community can also increase bacterial productivity [36]. In the present study, we found that, at the onset of incubation, the average total heterotrophic bacterial abundance was 5.1 ± 0.9 and 3.7 ± 0.5 × 10⁵ cells mL–1 in seagrass and non-seagrass chambers, respectively. Seagrass habitats also demonstrated a slightly higher net growth rate for bacteria than non-seagrass habitats (Figure 6A). This result supports our hypothesis, which is that seagrass releases more DOM during photosynthesis; therefore, incubation with seagrass leads to higher bacterial growth rates. However, a recent study in Florida Bay examined benthic and pelagic autotrophic communities to better understand the sources of organic matter for bacteria [37]. This study suggests that bacteria select carbon, nitrogen, and phosphorus-rich organic matter that is readily available and similar to themselves. It was found that pelagic bacteria were tightly coupled to phytoplankton biomass and expended the greatest amount of extracellular enzyme effort to meet the carbon requirement of seagrass; however, seagrass production and nutrient content were unrelated to pelagic bacteria activity [37]. We observed that the growth rates of bacteria were higher in seagrass treatments, whereas Synechococcus spp. had a negative growth rate, which was calculated to be −0.90 d−1. In this regard, phytoplankton sources of DOM contribute to bacterial growth rates in a minor manner. The differences in these areas may be related to the different organic matter compositions and availability.
An important component of the functioning of seagrass ecosystems is the interaction between seagrass meadows and the water column [25]. Seagrass beds, for example, play an important role in early diagenesis in superficial sediments [38], and this has a significant effect on the flux of nutrients at the sediment–water interface, affecting water column primary production. According to this research, Synechococcus spp. have a negative growth rate in seagrass chambers. There is most likely nutrient competition between seagrasses and pelagic primary producers to explain the negative growth rate of Synechococcus spp. According to previous studies, benthic microalgae and seagrasses obtained nutrients from sediment pore waters and the water column [39]. Seagrasses can also take up nutrients from sediment, which helps maintain high production rates in water with nutrient scarcity [40]. Water column nutrients are also useful for benthic microalgae in overcoming nutrient limitations, as suggested by Rizzo et al. [41].
It may be possible to speculate about possible explanations for the variation in the growth of bacteria and Synechococcus spp. in seagrass meadows and non-vegetated areas from the present study. In the seagrass meadow environment, two major carbon sources are most likely to support bacterial growth. The extracellular release of DOC by phytoplankton occurs during photosynthesis (DOC1). The DOC released by seagrasses during photosynthesis is shown in DOC2 (Figure 8). A difficult aspect of this study was estimating the percentage of primary productivity from phytoplankton or seagrass that contributed to bacterial productivity in seagrass environments. Further, there should be more DOC concentration in the seagrass region, and the results from the seagrass chambers confirm this conclusion. During the study period, seagrass chambers had slightly higher DOC concentrations than non-seagrass chambers (Figure 7). When nutrient supply rates are low or moderate, seagrasses take up inorganic nitrogen and inorganic phosphorus through their leaves, competing with phytoplankton in the water column for nutrients (Figure 8).
Moreover, seagrass leaves also trap natural picophytoplankton populations. As a result, the seagrass canopy caused negative net growth rates of picophytoplankton [42]. According to Cummins et al. [42], picophytoplankton growth rates were negatively impacted by seagrass leaves after 2 h of incubation. This study also showed that in chambers without seagrass leaf controls, the net growth rates of natural picophytoplankton populations remained positive. In this study area, our results indicate that this mechanism is also a significant loss process for picophytoplankton.
In summary, the present study was designed to compare the growth and mortality rates of bacteria and Synechococcus spp. in different habitats (treatments with and without seagrass) in the chambers. A consistent difference in the growth of bacteria and Synechococcus spp. was found between non-seagrass and seagrass habitats. In seagrass chambers, bacterial growth was higher than that in non-seagrass chambers, suggesting that organic carbon coming from outside the seagrass community may increase bacterial growth. Furthermore, the growth rate of Synechococcus spp. was significantly lower in the seagrass treatment than in the non-seagrass treatment, so there is most likely nutrient competition between seagrasses and primary producers to explain the lower growth rate of Synechococcus sp. Because small-scale chambers are important for understanding the processes that produce and maintain spatial and temporal patterns of picoplankton, experiments designed to test hypotheses related to growth and mortality may be most effective. Furthermore, future studies will examine the scales of spatial variation in picoplankton growth in both field habitats. Additionally, Blue Carbon strategy management aims to enhance CO2 sequestration and reduce greenhouse gases through the management of coastal vegetation, particularly seagrass meadows. While seagrass meadows have recently been recognized as important marine carbon stores, there remains a lack of data on how habitat restoration can increase carbon sinks and stocks in coastal waters. This study provides evidence for the potential of seagrass habitat to enhance carbon available by bacteria and bacterial production will be transferred to higher trophic levels by grazing in the coastal zone. There is a possible impact on the fate and cycling of organic matter in our study region due to this shift.

Author Contributions

Conceptualization: A.-Y.T.; methodology: A.-Y.T., P.W.-Y.C., M.O. and J.-J.C.; validation: A.-Y.T.; formal analysis: P.W.-Y.C., M.O., R.-F.S. and A.-Y.T.; investigation: A.-Y.T., P.W.-Y.C., C.N.A., M.N., Y.-L.S. and M.O.; resources: A.-Y.T. and W.-C.C.; data curation: A.-Y.T.; writing—original draft preparation: A.-Y.T. and P.W.-Y.C.; writing—review and editing: A.-Y.T. and V.M.; funding acquisition: A.-Y.T., V.M. and W.-C.C. All authors have read and agreed to the published version of the manuscript.

Funding

This research was conducted in the frame of the Russian state assignments No. 1023032700553-3 and FEFM-2024-0013 and supported by the Ministry of Science and Technology, ROC (Taiwan), grant number MOST 111-2119-M-019-002.

Data Availability Statement

All data are provided in the main text.

Conflicts of Interest

The authors declare no conflict of interest.

References

  1. Ambo-Rappe, R. Differences in richness and abundance of species assemblages in tropical seagrass beds of different structural complexity. J. Environ. Sci. Technol. 2016, 9, 246. [Google Scholar] [CrossRef]
  2. Deepika, S.; Srinivasan, A.; Padmavathy, P.; Jawahar, P. Seasonal variation of phytoplankton diversity in seagrass ecosystem of Mandapam coast of Gulf of Mannar. J. Exp. Zool. India 2018, 21, 499–506. [Google Scholar]
  3. Hendriks, I.E.; Sintes, T.; Bouma, T.J.; Duarte, C.M. Experimental assessment and modeling evaluation of the effects of the seagrass Posidonia oceanica on flow and particle trapping. Mar. Ecol. Prog. Ser. 2008, 356, 163–173. [Google Scholar] [CrossRef]
  4. Unsworth, R.K.F.; Nordlund, L.M.; Cullen-Unsworth, L.C. Seagrass meadows support global fisheries production. Conserv. Lett. 2019, 12, e12566. [Google Scholar] [CrossRef]
  5. Pollard, P.C.; Moriarty, D.J.W. Organic carbon decomposition, primary and bacterial productivity, and sulphate reduction, in tropical seagrass beds of the Gulf of Carpentaria, Australia. Mar. Ecol. Prog. Ser. 1991, 69, 149–159. [Google Scholar] [CrossRef]
  6. Lindeboom, H.J.; Sandee, A.J.J. Production and consumption of tropical seagrass fields in eastern Indonesia measured with bell jars and microelectrodes. Neth. J. Sea Res. 1989, 23, 181–190. [Google Scholar] [CrossRef]
  7. Mateo, M.A.; Romero, J. Detritus dynamics in the seagrass Posidonia oceanica: Elements for an ecosystem carbon and nutrient budget. Mar. Ecol. Prog. Ser. 1997, 151, 43–53. [Google Scholar] [CrossRef]
  8. Barrón, C.; Apostolaki, E.T.; Duarte, C.M. Dissolved organic carbon fluxes by seagrass meadows and macroalgal beds. Front. Mar. Sci. 2014, 1, 42. [Google Scholar]
  9. Martin, B.C.; Gleeson, D.; Statton, J.; Siebers, A.R.; Grierson, P.; Ryan, M.H.; Kendrick, G.A. Low light availability alters root exudation and reduces putative beneficial microorganisms in seagrass roots. Front. Microbiol. 2018, 8, 2667. [Google Scholar] [CrossRef]
  10. Lønborg, C.; Álvarez-Salgado, X.A.; Duggan, S.; Carreira, C. Organic matter bioavailability in tropical coastal waters: The Great Barrier Reef. Limnol. Oceanogr. 2018, 63, 1015–1035. [Google Scholar] [CrossRef]
  11. Elovaara, S.; Eronen-Rasimus, E.; Asmala, E.; Tamelander, T.; Kaartokallio, H. Contrasting patterns of carbon cycling and dissolved organic matter processing in two phytoplankton–bacteria communities. Biogeosciences 2021, 18, 6589–6616. [Google Scholar] [CrossRef]
  12. Eigemann, F.; Rahav, E.; Grossart, H.P.; Aharonovich, D.; Voss, M.; Sher, D. Phytoplankton Producer Species and Transformation of Released Compounds over Time Define Bacterial Communities following Phytoplankton Dissolved Organic Matter Pulses. Appl. Environ. Microbiol. 2023, 89, e00539-23. [Google Scholar] [CrossRef] [PubMed]
  13. Kristensen, E.; Bouillon, S.; Dittmar, T.; Marchand, C. Organic carbon dynamics in mangrove ecosystems: A review. Aquat. Bot. 2008, 89, 201–219. [Google Scholar] [CrossRef]
  14. Apple, J.K.; Giorgio, P.D. Organic substrate quality as the link between bacterioplankton carbon demand and growth efficiency in a temperate salt-marsh estuary. ISME J. 2007, 1, 729–742. [Google Scholar] [CrossRef] [PubMed]
  15. Delille, D.; Canon, C.; Windeshausen, F. Comparison of Planktonic and Benthic Bacterial Communities Associated with a Mediterranean Posidonia Seagrass System. Bot. Mar. 1996, 39, 234–249. [Google Scholar] [CrossRef]
  16. Yang, D.; Shan, X.; Liu, S. Bacterioplankton, Picoeukaryotes and Synechococcus Distribution Associated with Seagrass in South Coast of Hainan Island, China. Nat. Resour. 2014, 2014, 48438. [Google Scholar] [CrossRef]
  17. Säwström, C.; Hyndes, G.A.; Eyre, B.D.; Huggett, M.J.; Fraser, M.W.; Lavery, P.S.; Thomson, P.G.; Tarquinio, F.; Steinberg, P.D.; Laverock, B. Coastal connectivity and spatial subsidy from a microbial perspective. Ecol. Evol. 2016, 6, 6662–6671. [Google Scholar] [CrossRef] [PubMed]
  18. Tsai, A.Y.; Gong, G.C.; Hung, J. Seasonal variations of virus- and nanoflagellate-mediated mortality of heterotrophic bacteria in the coastal ecosystem of subtropical western Pacific. Biogeosciences 2013, 10, 3055–3065. [Google Scholar] [CrossRef]
  19. Morán, X.A.; Baltar, G.; Carreira, F.C.; Lønborg, C. Responses of physiological groups of tropical heterotrophic bacteria to temperature and DOM additions: Food matters more than warming. Environ. Microbiol. 2020, 22, 1930–1943. [Google Scholar] [CrossRef]
  20. Sabbagh, E.I.; Calleja, M.L.; Daffonchio, D.; Morán, X.A.G. Seasonality of top-down control of bacterioplankton at two central Red Sea sites with different trophic status. Environ. Microbiol. 2023, 25, 2002–2019. [Google Scholar] [CrossRef]
  21. Chen, P.W.-Y.; Olivia, M.; Chou, W.-C.; Shiu, R.-F.; Mukhanov, V.; Tsai, A.-Y. Differences in Bacterial Growth and Mortality between Seagrass Meadows and Adjacent Unvegetated Areas. J. Mar. Sci. Eng. 2023, 11, 1979. [Google Scholar] [CrossRef]
  22. Llabrés, M.M.; Agustí, S. Picophytoplankton cell death induced by UV radiation: Evidence for oceanic Atlantic communities. Limnol. Oceanogr. 2006, 51, 21–29. [Google Scholar] [CrossRef]
  23. Li, L.; Jiang, Z.; Wu, Y.; He, J.; Fang, Y.; Lin, J.; Liu, S.; Huang, X. Interspecific differences in root exudation for three tropical seagrasses and sediment pore-water dissolved organic carbon beneath them. Mar. Pollut. Bull. 2021, 173, 113059. [Google Scholar] [CrossRef]
  24. Wit, R.; Troussellier, M.; Courties, C.; Buffan-Dubau, E.; Lemaire, E. Short-Term Interactions between Phytoplankton and Intertidal Seagrass Vegetation in a Coastal Lagoon (Bassin d’Arcachon, SW France). Hydrobiologia 2012, 699, 55–68. [Google Scholar] [CrossRef]
  25. Agawin, N.S.; Duarte, C.M. Evidence of direct particle trapping by a tropical seagrass meadow. Estuaries 2002, 25, 1205–1209. [Google Scholar] [CrossRef]
  26. Shiu, R.-F.; Vazquez, C.I.; Tsai, Y.-Y.; Torres, G.V.; Chen, C.-S.; Santschi, P.; Quigg, A.; Chin, W.-C. Nano-plastics induce aquatic particulate organic matter (microgels) formation. Sci. Total Environ. 2020, 706, 135681. [Google Scholar] [CrossRef] [PubMed]
  27. Evans, C.; Archer, S.D.; Jacquet, S.; Wilson, W.H. Direct estimates of the contribution of viral lysis and microzooplankton grazing to the decline of a Micromonas spp. population. Aquat. Microb. Ecol. 2003, 30, 207–219. [Google Scholar] [CrossRef]
  28. Hammes, F.; Egli, T. Cytometric methods for measuring bacteria in water: Advantages, pitfalls and applications. Anal. Bioanal. Chem. 2010, 397, 1083–1095. [Google Scholar] [CrossRef]
  29. Olson, R.J.; Zettler, E.R.; Armbrust, E.V.; Chisholm, S.W. Pigment, size and distribution of Synechococcus in the North Atlantic and Pacific oceans. Limnol. Oceanogr. 1990, 35, 45–58. [Google Scholar] [CrossRef]
  30. Landry, M.R.; Hassett, R.P. Estimating the grazing impact of marine microzooplankton. Mar. Biol. 1982, 67, 283–288. [Google Scholar] [CrossRef]
  31. Weinbauer, M.G.; Christaki, U.; Nedoma, A.; Simek, K. Comparing the effects of resource enrichment and grazing on viral production in a meso-eutrophic reservoir. Aquat. Microb. Ecol. 2003, 31, 137–144. [Google Scholar] [CrossRef]
  32. Kimmance, S.A.; Brussaard, C.P.D. Estimation of viralinduced phytoplankton mortality using the modified dilution method. In Manual of Aquatic Viral Ecology; Wilhelm, S., Weinbauer, M., Suttle, C., Eds.; American Society of Limnology and Oceanography: Waco, TX, USA, 2010; pp. 65–73. [Google Scholar]
  33. Traving, S.J.; Clokie, M.R.J.; Middelboe, M. Increased acidification has a profound effect on the interactions between the cyanobacterium Synechococcus sp. WH7803 and its viruses. FEMS Microbiol. Ecol. 2014, 87, 133–141. [Google Scholar] [CrossRef]
  34. Miki, T.; Jacquet, S. Complex interactions in the microbial world: Underexplored key links between viruses, bacteria and protozoan grazers in aquatic environments. Aquat. Microb. Ecol. 2008, 51, 195–208. [Google Scholar] [CrossRef]
  35. Bettarel, Y.; Sime-Ngando, T.; Bouvy, M.; Arfi, R.; Amblard, C. Low consumption of virus-sized particles by heterotrophic nanoflagellates in two lakes the French Massif Central. Aquat. Microb. Ecol. 2005, 39, 205–209. [Google Scholar] [CrossRef]
  36. Holmer, M.; Andersen, F.Ø.; Nielsen, S.L.; Boschker, H.T. The importance of mineralization based on sulphate reduction for nutrient regeneration in tropical seagrass sediments. Aquat. Bot. 2001, 71, 1–17. [Google Scholar] [CrossRef]
  37. Williams, C.J.; Boyer, J.N.; Jochem, F.J. Microbial activity and carbon, nitrogen, and phosphorus content in a subtropical seagrass estuary (Florida Bay): Evidence for limited bacterial use of seagrass production. Mar. Boil. 2009, 156, 341–353. [Google Scholar] [CrossRef]
  38. Deborde, J.; Abril, G.; Mouret, A.; Jézéquel, D.; Thouzeau, G.; Clavier, J.; Bachelet, G.; Anschutz, P. Effects of seasonal dynamics in a Zostera noltii meadow on phosphorus and iron cycles in a tidal mudflat (Arcachon Bay, France). Mar. Ecol. Prog. Ser. 2008, 355, 59–71. [Google Scholar] [CrossRef]
  39. Hansen, J.W.; Udy, J.W.; Perry, C.J.; Dennison, W.C.; Lomstein, B.A. Effect of the seagrass Zostera capricorni on sediment microbial processes. Mar. Ecol. Prog. Ser. 2000, 199, 183–196. [Google Scholar] [CrossRef]
  40. Eyre, B.D.; Ferguson, A.J. Comparison of carbon production and decomposition, benthic nutrient fluxes and denitrification in seagrass, phytoplankton, benthic microalgae-and macroalgae-dominated warm-temperate Australian lagoons. Mar. Ecol. Prog. Ser. 2002, 229, 43–59. [Google Scholar] [CrossRef]
  41. Rizzo, W.M.; Lackey, G.J.; Christian, R.R. Significance of eutrophic, subtidal sediments to oxygen and nutrient cycling in a temperate estuary. Mar. Ecol. Prog. Ser. 1992, 86, 51–61. [Google Scholar] [CrossRef]
  42. Cummins, S.P.; Roberts, D.E.; Ajani, P.; Underwood, A.J. Comparisons of assemblages of phytoplankton between open water and seagrass habitats in a shallow coastal lagoon. Mar. Freshw. Res. 2004, 55, 447–456. [Google Scholar] [CrossRef]
Figure 1. Picture of benthic chambers (10 cm diameter × 50 cm length) (A), 100 L acrylic incubation tanks with benthic chambers (B).
Water 16 00939 g001
Figure 2. Chambers with seagrass and sediments. Flow chart showing the modified dilution experiment. For details, see the main text.
Water 16 00939 g002
Figure 3. Flow cytometric characterization of heterotrophic bacteria (bac) and Synechococcus spp. (syn) populations. (A) Bacteria separated according to differing nucleic acid content (SYBR green fluorescence) (x-axis) and red fluorescence (y-axis); heterotrophic bacteria with lower red fluorescence levels; (B) Synechococcus spp. population was discriminated and enumerated according to their orange (x-axis) and red fluorescence (y-axis).
Water 16 00939 g003
Figure 4. Dilution plots of net bacterial growth rate (d−1) versus seawater fraction in parallel experiments. Open and closed squares represent growth rates from the 0.2 μm (dash line) and 30 kDa (solid line) dilution series, respectively. (A) Chambers without seagrass and (B) chambers with seagrass.
Water 16 00939 g004
Figure 5. Dilution plots of net Synechococcus spp. growth rate (d−1) versus the seawater fraction in parallel experiments. Open and closed squares represent growth rates from the 0.2 μm (dash line) and 30 kDa (solid line) dilution series, respectively. (A) Chambers without seagrass and (B) chambers with seagrass.
Water 16 00939 g005
Figure 6. Net growth rate of bacteria (blue) and Synechococcus spp. (orange) in seagrass and non-seagrass chambers (A). Difference in bacterial and Synechococcus spp. net growth rate between water in seagrass and non-seagrass chambers (B).
Water 16 00939 g006
Figure 7. Average concentration of DOC at the beginning of incubation (white) and after 24 h incubation time (grey) in seagrass and non-seagrass chambers.
Water 16 00939 g007
Figure 8. Image: the interaction of seagrass meadows, bacteria (BAC), and picophytoplankton (PICOPHYTO). DOC1: DOC is released extracellularly from phytoplankton photosynthesis. DOC2: DOC is released by seagrasses during photosynthesis.
Water 16 00939 g008
Disclaimer/Publisher’s Note: The statements, opinions and data contained in all publications are solely those of the individual author(s) and contributor(s) and not of MDPI and/or the editor(s). MDPI and/or the editor(s) disclaim responsibility for any injury to people or property resulting from any ideas, methods, instructions or products referred to in the content.

