
A Case Study of a Reverse Osmosis Based Pumped Energy Storage Plant in Canary Islands
by
 , and
, and
Juan Carlos Lozano Medina
,
Carlos Alberto Mendieta Pino
,
Alejandro Ramos Martín
and
Federico León Zerpa
* Process Engineering Department, EIIC, University of Las Palmas de Gran Canaria, 35001 Las Palmas de Gran Canaria, Spain
*
Author to whom correspondence should be addressed.
Water 2024, 16(4), 515; https://doi.org/10.3390/w16040515
Submission received: 23 December 2023
/
Revised: 29 January 2024
/
Accepted: 2 February 2024
/
Published: 6 February 2024
(This article belongs to the Special Issue Advanced Desalination Technologies for Water Treatment)
Abstract
:Gran Canaria, due to its status as an island, has an isolated energy system (IES). This has made it dependent on itself for energy production, which is basically obtained from: (a) Wind and solar energy, which equals 19% of the total energy produced, (b) Energy obtained from the burning of fossil fuels in the energy production equipment of the existing thermal power stations, which equals 81% of the total energy produced. A solution must be found to the current production system, which is already partially obsolete and is due for renewal and/or decommissioning, in order to avoid “Energy Zero”, which means a change in the production cycle. In addition, the incorporation of a pumped hydroelectric energy storage plant “Chira-Soria” into the Gran Canaria electricity system represents another, even more important, change in the dynamics followed up to now. Basically, this plant, which is hydraulically stabilized by means of a seawater desalination plant, incorporates energy storage by storing water at high altitude to be turbined under appropriate conditions. The new situation will be analyzed with this incorporation and the option of an integrated operation in the overall energy system of Gran Canaria will be considered.
1. Introduction
Pumped hydroelectric power plants (PHEs) are one of the most widely used renewable energy production systems in the world [1,2,3,4,5,6,7,8,9,10]. The need for decarbonization, the penetration of renewable energies, and the broader vision of the management of our resources could be obtained with these technologies by improving their storage capacity [11,12,13,14,15]. Moreover, this is not different to other island energy systems [5,7,8,16], for instance in the Canary Islands [2,4,9,17,18] and specifically in Gran Canaria, which faces a fourfold challenge in the coming years:
(a) To meet the energy production objectives to satisfy a growing demand, using the current production plants that will be replaced with the progressive incorporation of new production technologies and to satisfy the needs opened by these obsolete units to be dismantled, plus the increase in demand that is foreseen [1,4,19,20,21,22,23]. It currently covers a growing demand of 3350 GWh (demand in 2021), supported by an installed capacity of 1278.45 MW.
(b) Avoiding the collapse of the system, a possible “Energy zero” or “blackout”, due to the incapacity and obsolescence of the energy system, which requires an action plan that addresses with technical solvency the incorporation of systems capable of satisfying the current growing demand. Renovating the partially obsolete energy production plant in Gran Canaria is the great challenge, which is already in the process of being renovated and/or dismantled. This plant is more than 30 years old, and its technological standards in terms of the current demanded requirement of minimum fuel consumption, maximum energy production, and minimum emissions are far from the desired expectations for such production [3,24,25,26,27,28,29,30]. All of this is aggravated by the types of fuel used, fuel oil, and diesel oil, ignoring other alternatives that are environmentally better and even energetically more efficient [24,25,26]. Gran Canaria’s energy production depends 79.4% on imported fossil fuels for electricity generation [26,27]. In the year 2021, this has a direct impact on the increase of electricity costs and CO emissions [2,9,23].
(c) To achieve a progressive decarbonization of the generation system by incorporating more renewables or environmentally neutral systems [23,28]. Currently, in the year 2021, the penetration of renewable energies in Gran Canaria stands at 20.6%, [23,29] but is still the great challenge [1,4]. Environmental awareness has increased, this has led to the mobilization of island governments, promoting wind farms and encouraging the installation of solar panels, etc. Synthetic fuels with neutral CO2eq emissions, could be one of the solutions, it is a question of promoting this use [2,18,30,31].
(d) Similarly, and due to the scarcity of water resources [32], it is necessary to optimize and integrate alternative water resource systems into the island’s energy system by means of a reverse osmosis desalination plant (SWRO), to stabilize the water levels required by the PEHS. SWROs have proven their suitability, currently representing 65% of those implemented in the world [33,34]. In addition, these SWRO systems have implemented energy consumption reduction systems to minimize their carbon emission [33,35,36,37]. On the other hand, we find the adjustment and integration of the operating dynamics of the PEHs within an energy system [38,39,40]. All of this represents a change in the dynamics of the island’s energy system to date, as it provides energy storage that can be used under appropriate conditions to pump water to the upper level, improve the penetration of energy from renewable and neutral sources and reduce greenhouse gases (GHG) emissions.
The aim of this article is to analyze the proposed incorporation of the new “Chira-Soria” PHEs into the global energy system of Gran Canaria, considering whether their integration into this energy system is effective and helps to alleviate the current shortcomings, and evaluating their operation, their virtues and shortcomings. Likewise, a study of the stabilization of water levels in the face of losses in the dams is proposed to guarantee the operation of the system, studying the capacity of the SWRO to satisfy the losses associated with the operation of the hydroelectric system, considering that variations in rainfall would not affect the operation of the PHEs.
2. Current Energy Production Situation in Gran Canaria
The analysis data of the anon 2021 is taken, as it is the last official data available. Based on such data, Gran Canaria’s current energy production in 2021 is supported by four steam turbines, five diesel units, five gas turbines, two combined cycles with double gas turbines and steam turbines, all of which represents 80.1% of the installed power (1024.06 MW), with the percentage of installed power from renewables being 19.9% (254.39 MW), which brings the total installed power to 1278.45 MW. The total energy demand was 3,350,094 MWh of which 2,661,453 MWh (79.4%) were produced in thermal power plants by fossil fuel combustion and 668,641 MWh (20.6%) by wind and photovoltaic systems of which 55,823 MWh are produced by photovoltaic panels (1.7%) and 632,818 MWh by wind generation (18.9%), as can be seen in Table A1.
As can be seen from the data taken from the average daily usage, Table A2 is the operation of the equipment is below the recommended level. This is due to its age which leads to difficulty in its use, more breakages, more hours in repairs, more hours of maintenance, in short, increasing variable operating costs, and the solution that is finally given is to have a lot of equipment in reserve ready for use when breakages occur.
This leads to excess power due to an excess of equipment close to the limit of its useful life. From the data extracted from the average daily usage, in Table A2, we obtain the average daily use data (h/day) for all the technologies, which is 7.30 h/day for combustion equipment, representing an average use of 30.41%. The highest figure is for the combined cycle with a use of 10.41 h/day, which represents an average use of 43.46%.
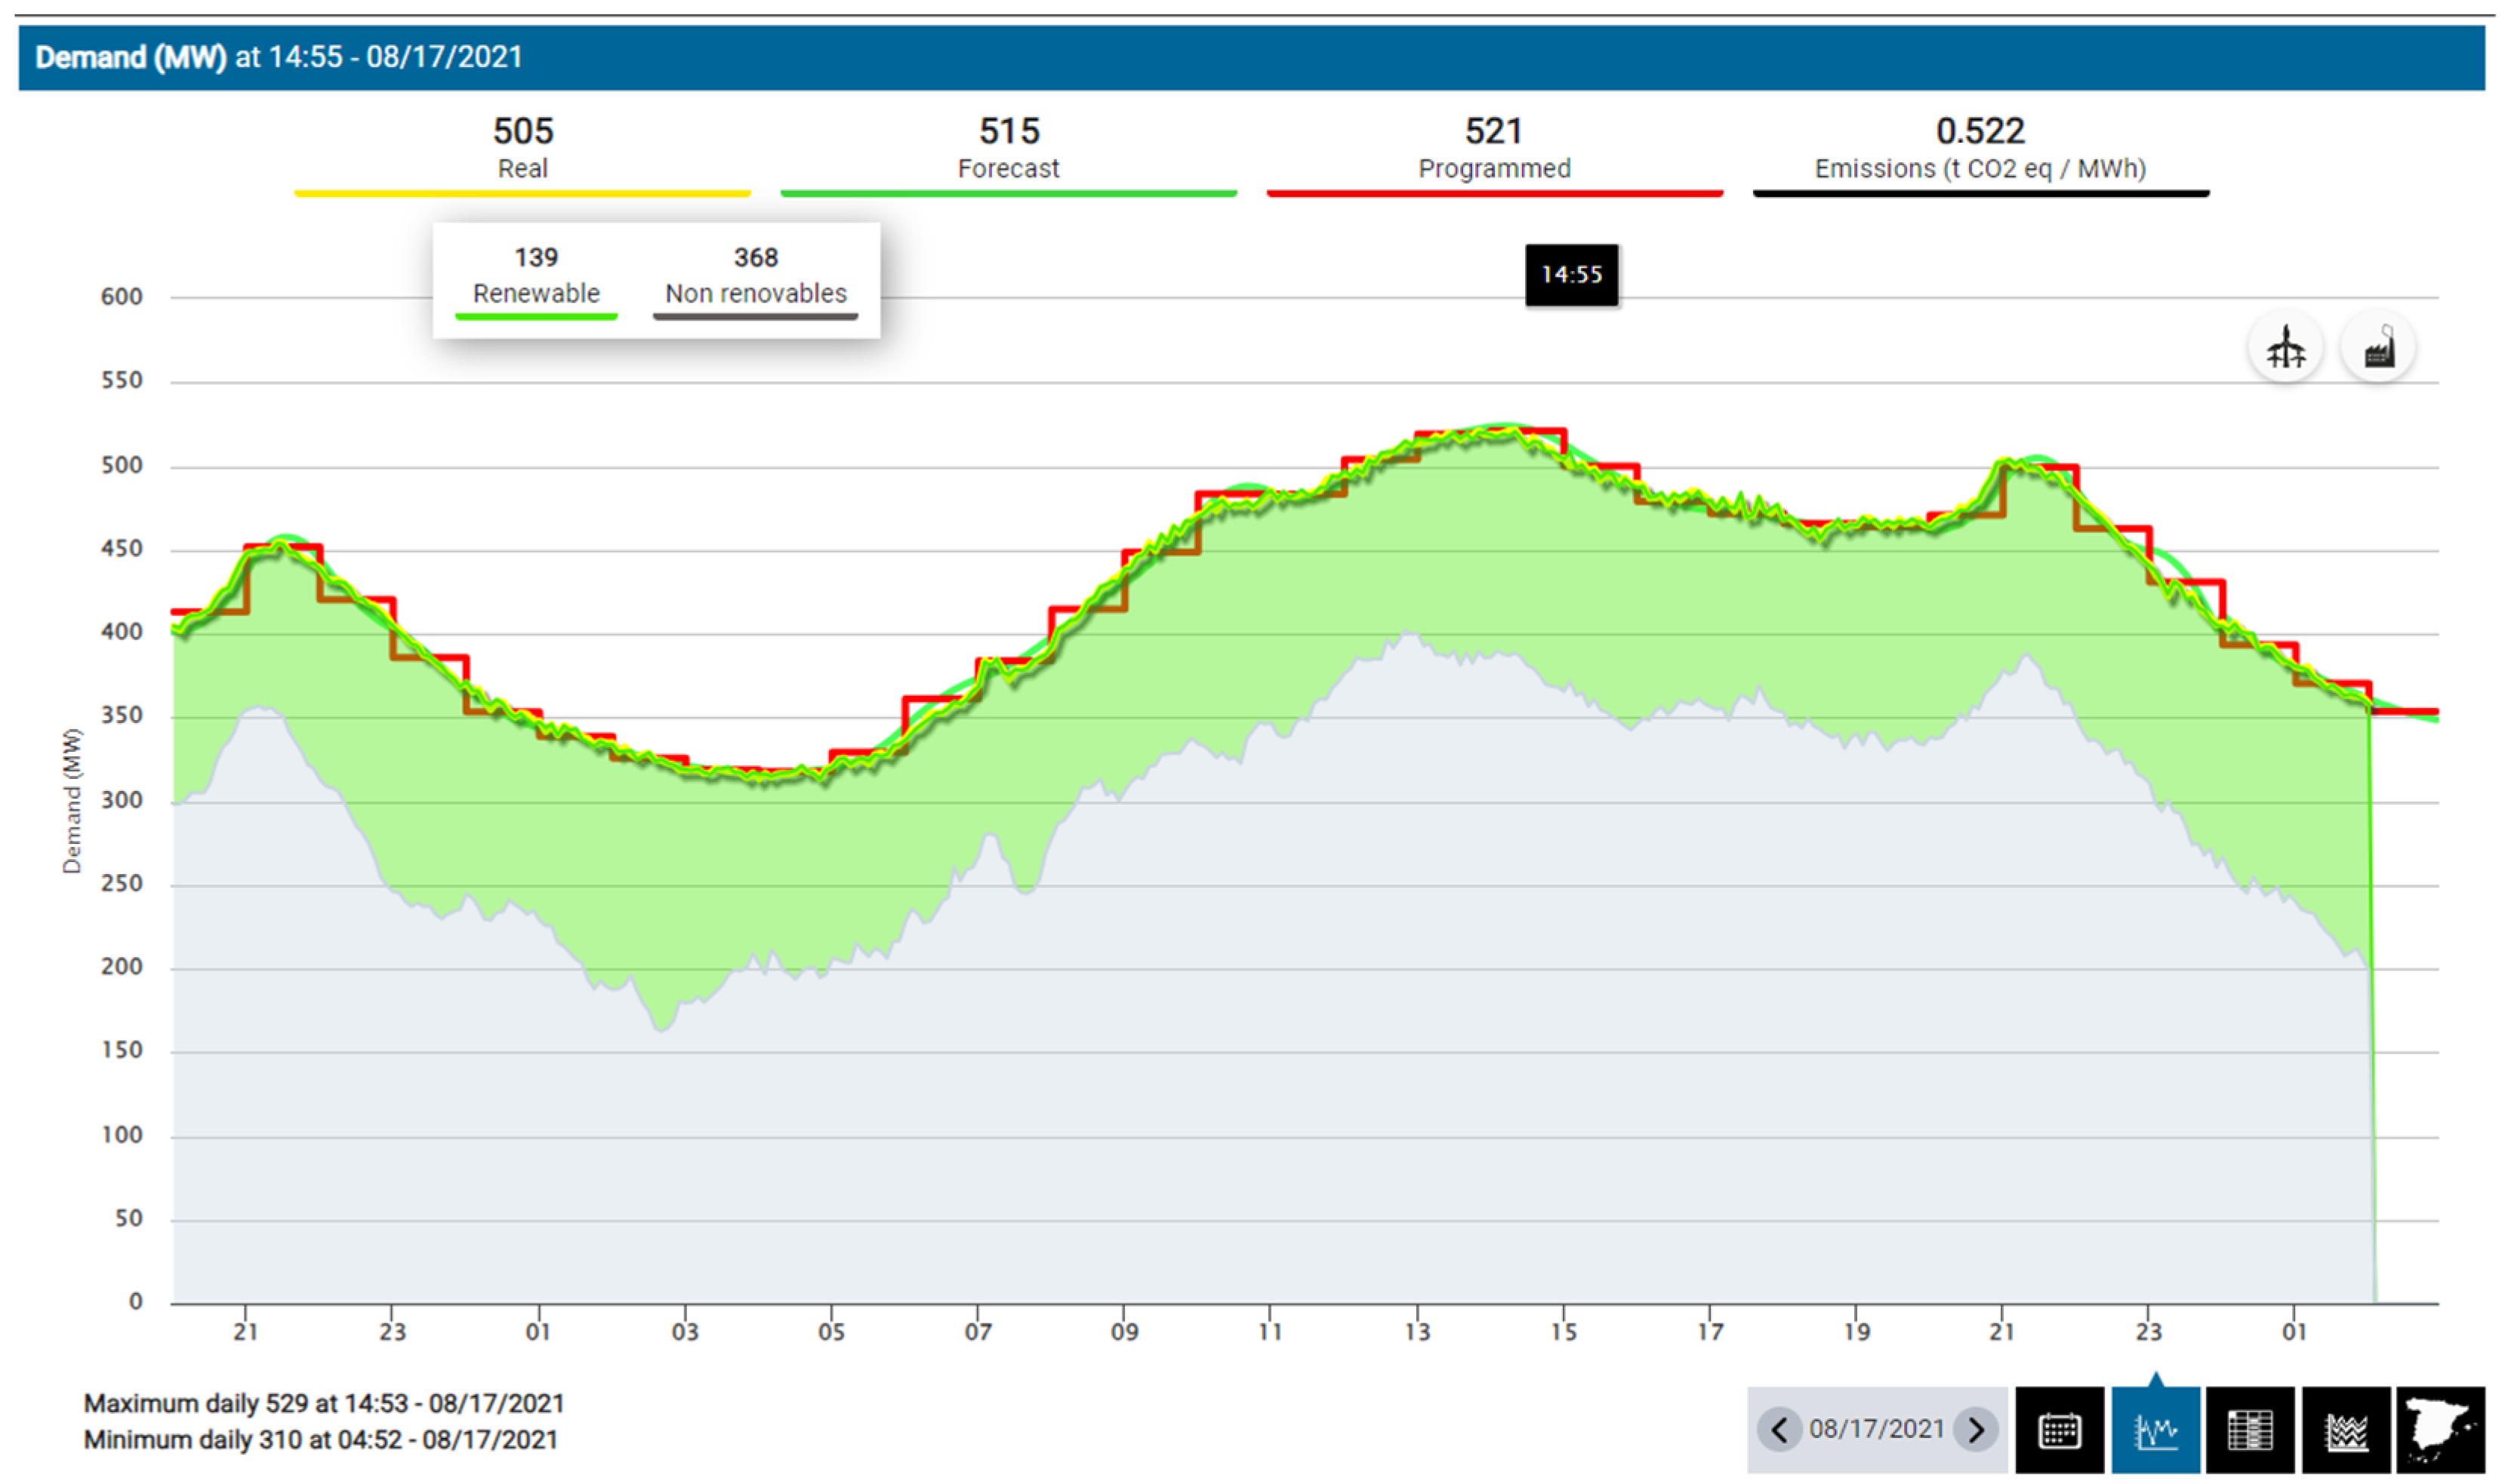
The study of the day of highest energy demand is a good indicator of the situation that the energy system of Gran Canaria must face in the immediate future, 17 August 2021 at 14:53, with 529.0 MW of instantaneous power. This day and time of peak power is the maximum since 2007. At that peak time, the point demand was met with 138.7 MW of renewables and 390.3 MW of non-renewables. The behavior of energy supply in response to this peak demand, distinguishing between renewables and non-renewables, is shown in Figure 1.
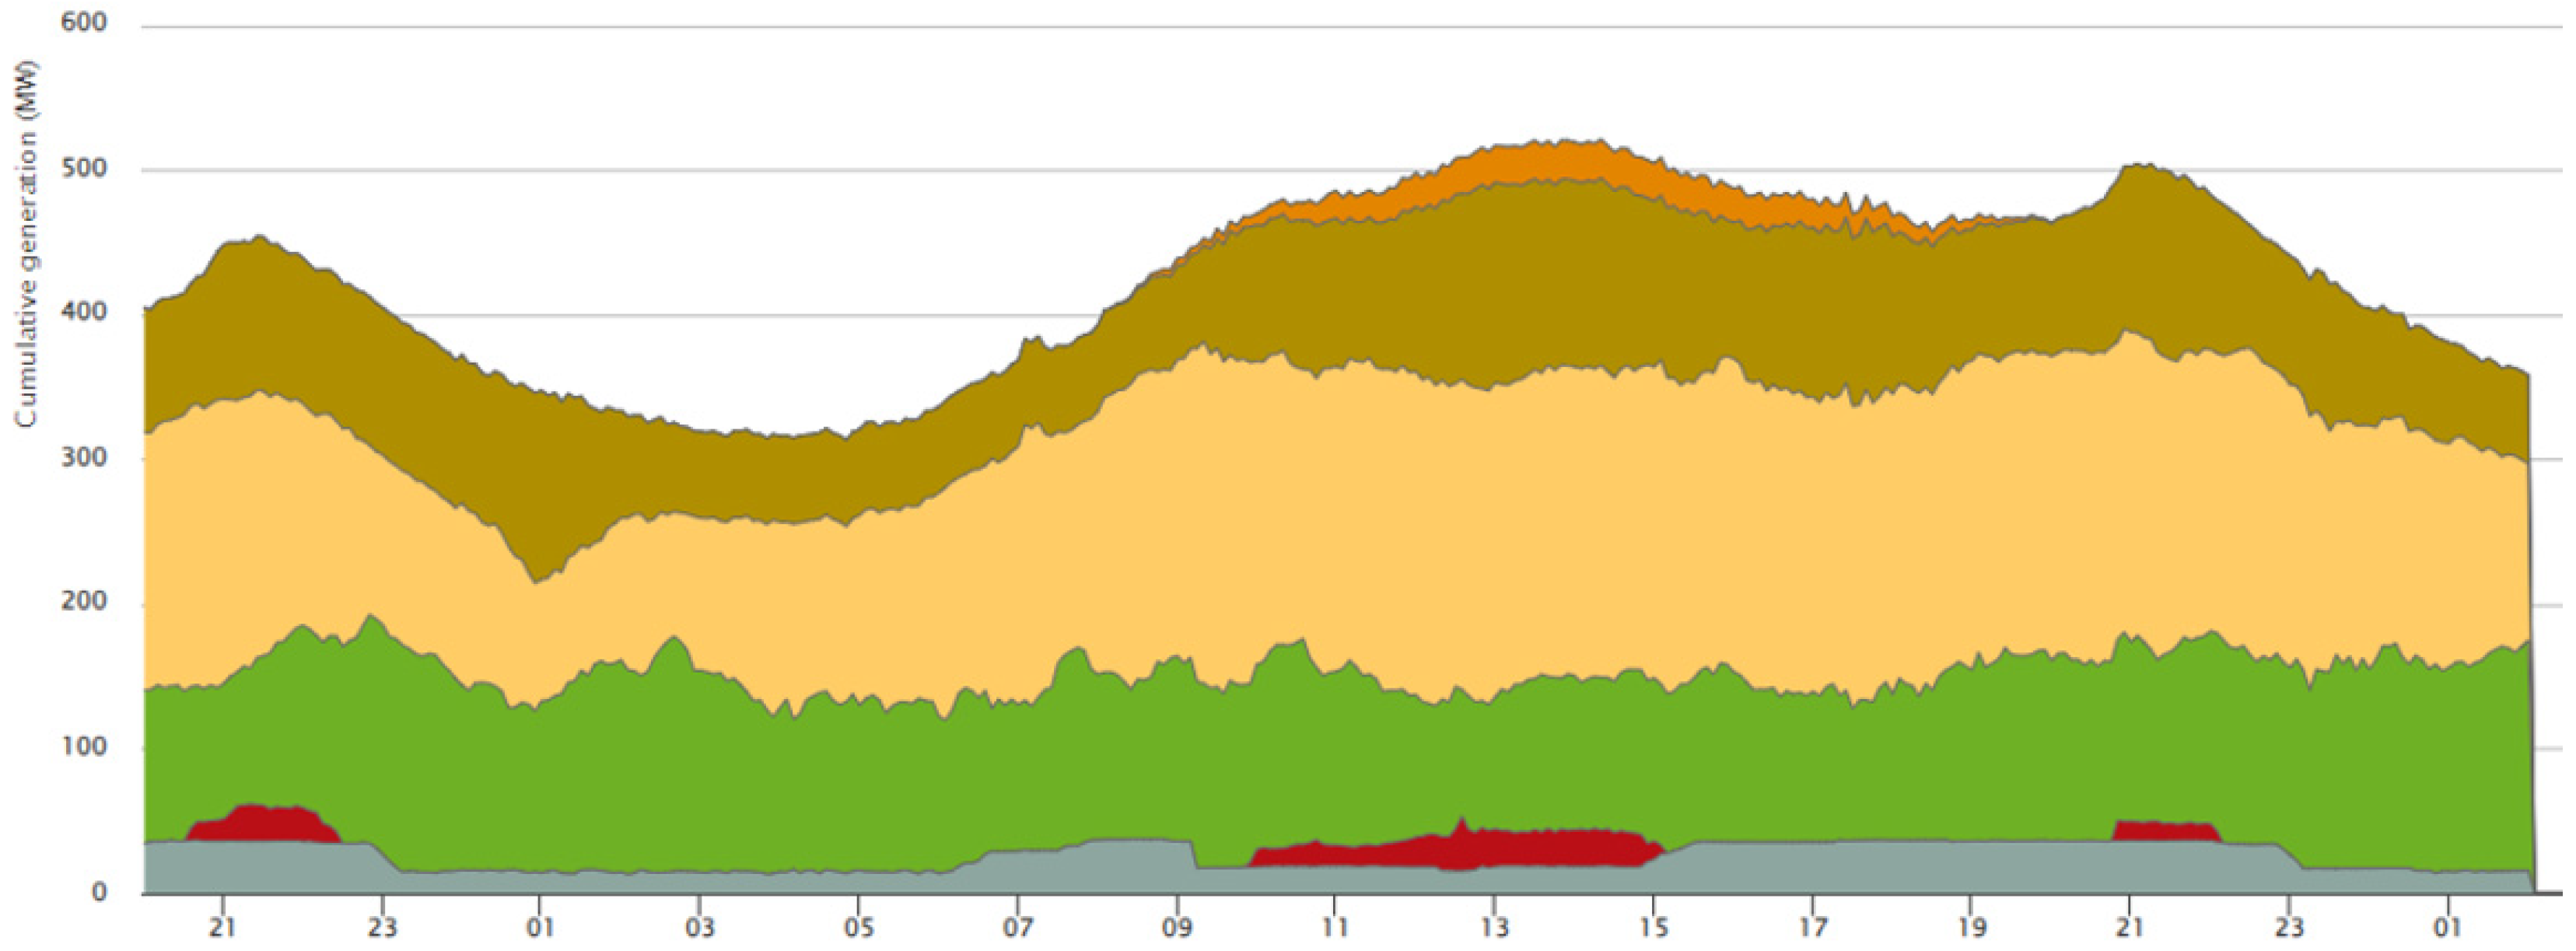
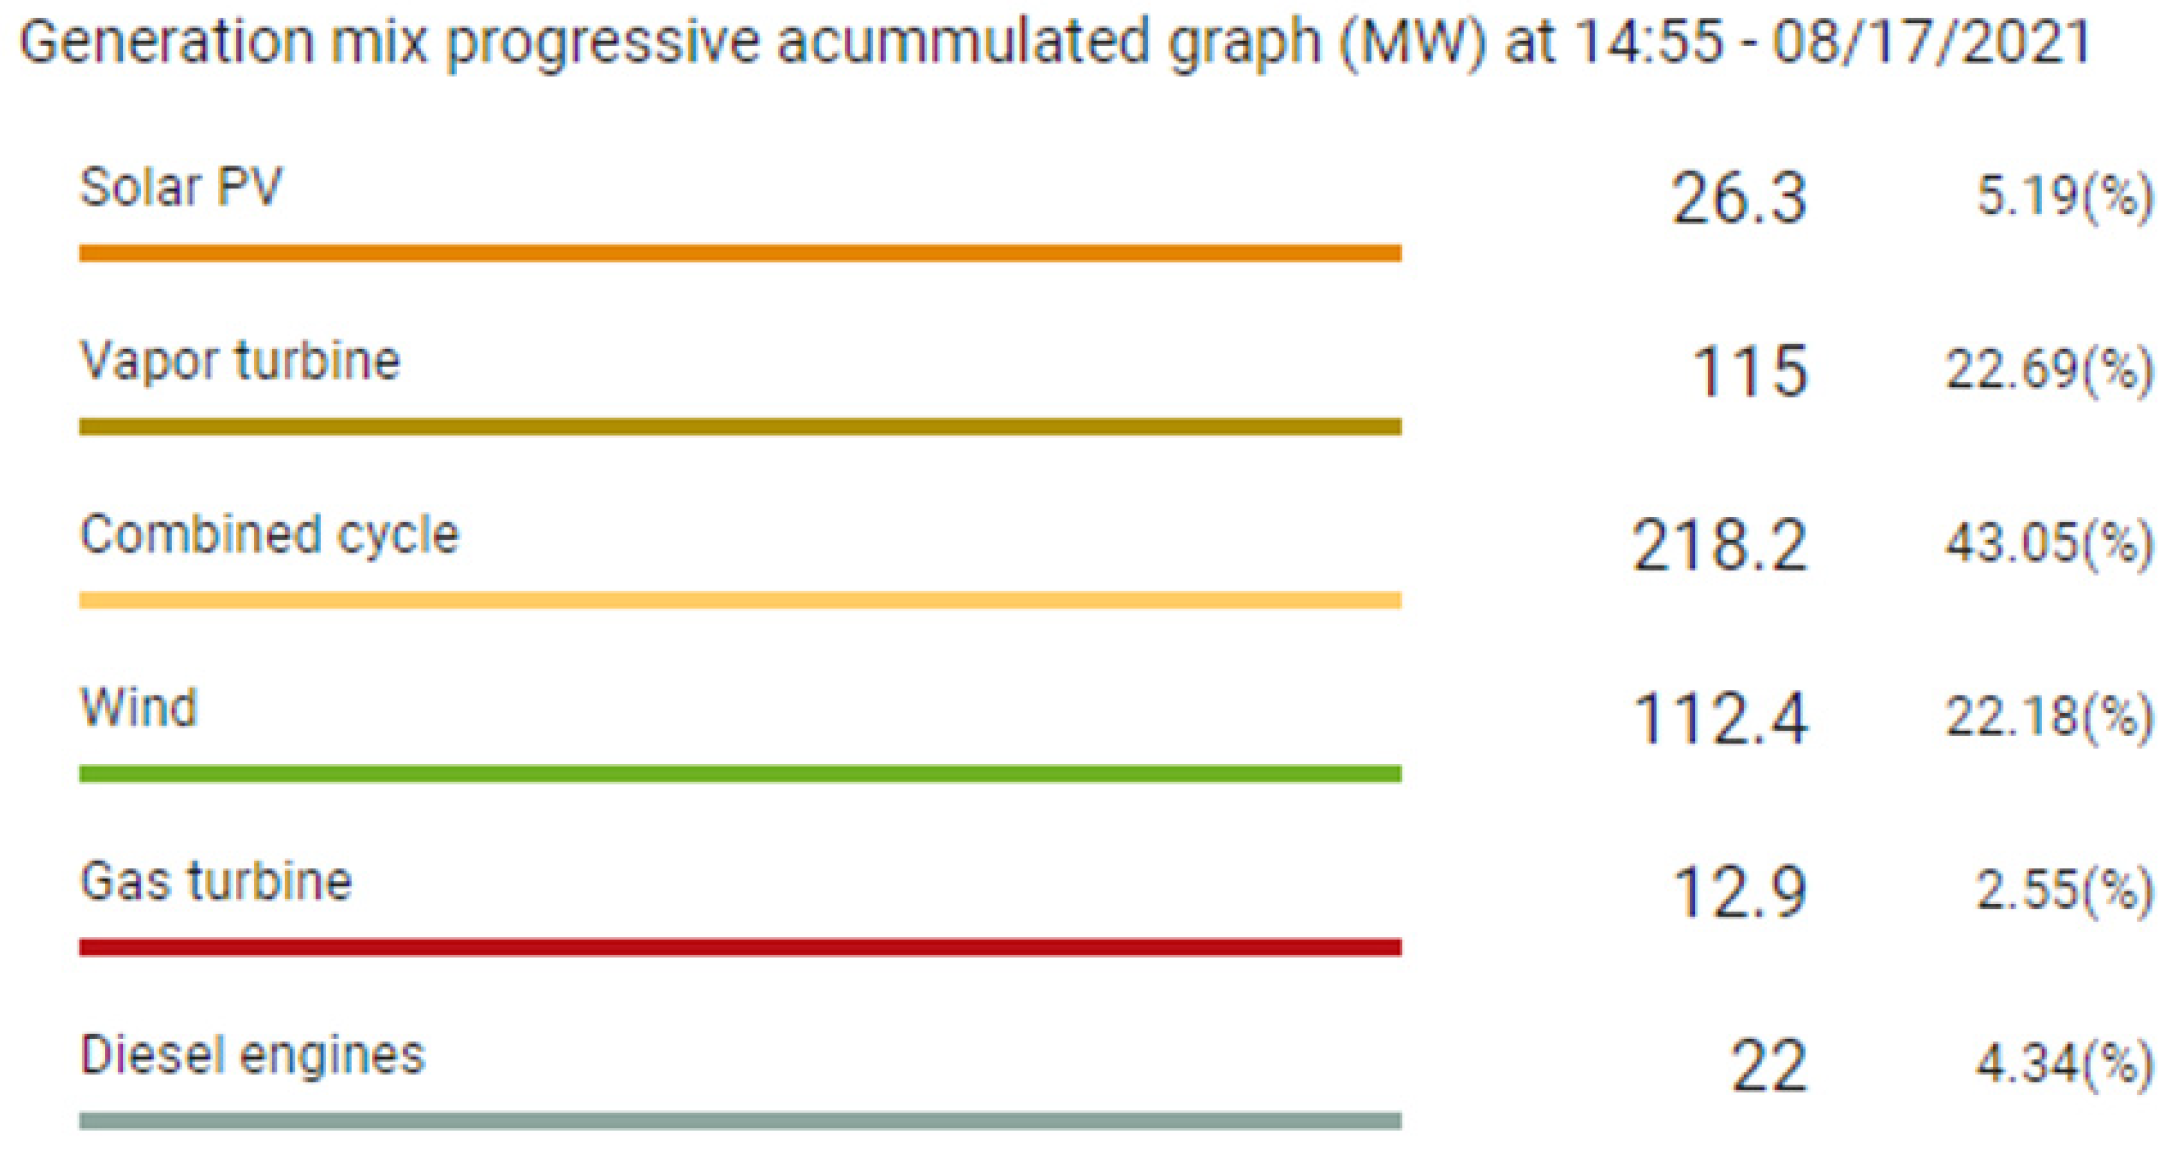
In Figure 2, all the production equipment is differentiated. At the time of highest annual demand, the equipment that contributed the most was the combined cycle with 218.2 MW (43.09%), followed by the steam turbine with 115.0 MW (22.69%), wind with 112.4 MW (22.18%), solar with 26.3 MW (5.19%), diesel engines with 22.0 MW (4.34%), and the one that contributed the least was the gas turbine with 12.9 MW (2.55%).
Table 1 shows the type of fuel burned by technology and the type of GHG emitted.
The total tons of fuel consumed in energy production in 2021 amounted to 555,811 t and the total tons of GHGs in 2021 as a result of their combustion amounted to 1,782,561 tCO2eq, with the final energy supplied, net losses being 3,076,109 MWh, and the GHG emissions 1,782,561 tCO2eq, the emission factor on the island of Gran Canaria for the year 2021 was 0.579 tCO2eq/MWh.
3. “Chira-Soria” PHEs Analysis
“Chira-Soria” is a new pumped hydroelectric power plant, PHEs, designed and thought of several years ago and currently being built on the island of Gran Canaria. It is focused on taking advantage of the unevenness of two existing dams to produce energy through turbines. It is estimated that it will be operational in 2026 and will be the first facility of its kind on the island, and together with the rest of Gran Canaria’s energy production equipment, it will serve a population of approximately one million inhabitants. This facility is located in the municipality of Tejeda.
3.1. Expectations of the Chira-Soria Pumped-Storage Hydroelectric Power Station (PHEs)
The wind power station installed on Gran Canaria in 2021 is 205.24 MW in an electricity system whose valley demand in 2021 was 257 MW, and where there is a contingent of new installation projects (wind and photovoltaic) with a potential of 725 MW, that at least have authorization for access to the grid.
The objective of the PHEs “Chira-Soria” would be to provide security of supply, ensuring the integration of the non-manageable renewable energy system. The high variability of the already installed wind generation introduces rapid frequency changes in the electricity system. These changes will continue to increase as installed wind power capacity increases. Frequency changes negatively affect consumers and could even lead to market disruptions. In this respect, the PHEs “Chira-Soria” would help mitigate the increasing degradation of frequency quality, making the system more stable, robust, and secure. It would also enable the penetration, under safe and quality of service conditions, of the expected large contingent of renewable energy. In this way, it would be possible to store surplus renewable energy that cannot be directly integrated into the system, making power balances viable and minimizing surpluses of renewable energy.
Because of the greater integration of renewables using an energy storage system, there would be a displacement of thermal generation in favor of renewable energy, with the consequent reduction of emissions, CO2 and NOx, which would bring economic and environmental advantages. It will allow adding flexibility to the energy system where the existing thermal generation park, designed for another energy context, lacks the necessary features for the adequate integration of renewable energies for the energy transition. The PHEs “Chira-Soria” would be characterized by a massive energy storage capacity, as well as by using a technology that would allow, depending on its operating mode, maintenance of the synchronous characteristic of the electricity system, necessary for its operation, providing inertia, short-circuit power, etc.
In addition, a desalination plant would be incorporated to produce sufficient water to compensate for the losses associated with the operation of the hydroelectric system, and variations in rainfall would not affect the operation of the PHEs. At present, the productive uses linked to the crops that supply the Chira and Soria reservoirs are subject to the availability of resources, an aspect that depends on the rainfall regime in the south of Gran Canaria. The desalination plant would keep the water in the reservoir within the appropriate volume limits.
3.2. Technical Characterisation of the PHEs ‘Chira-Soria’
3.2.1. Description of Units
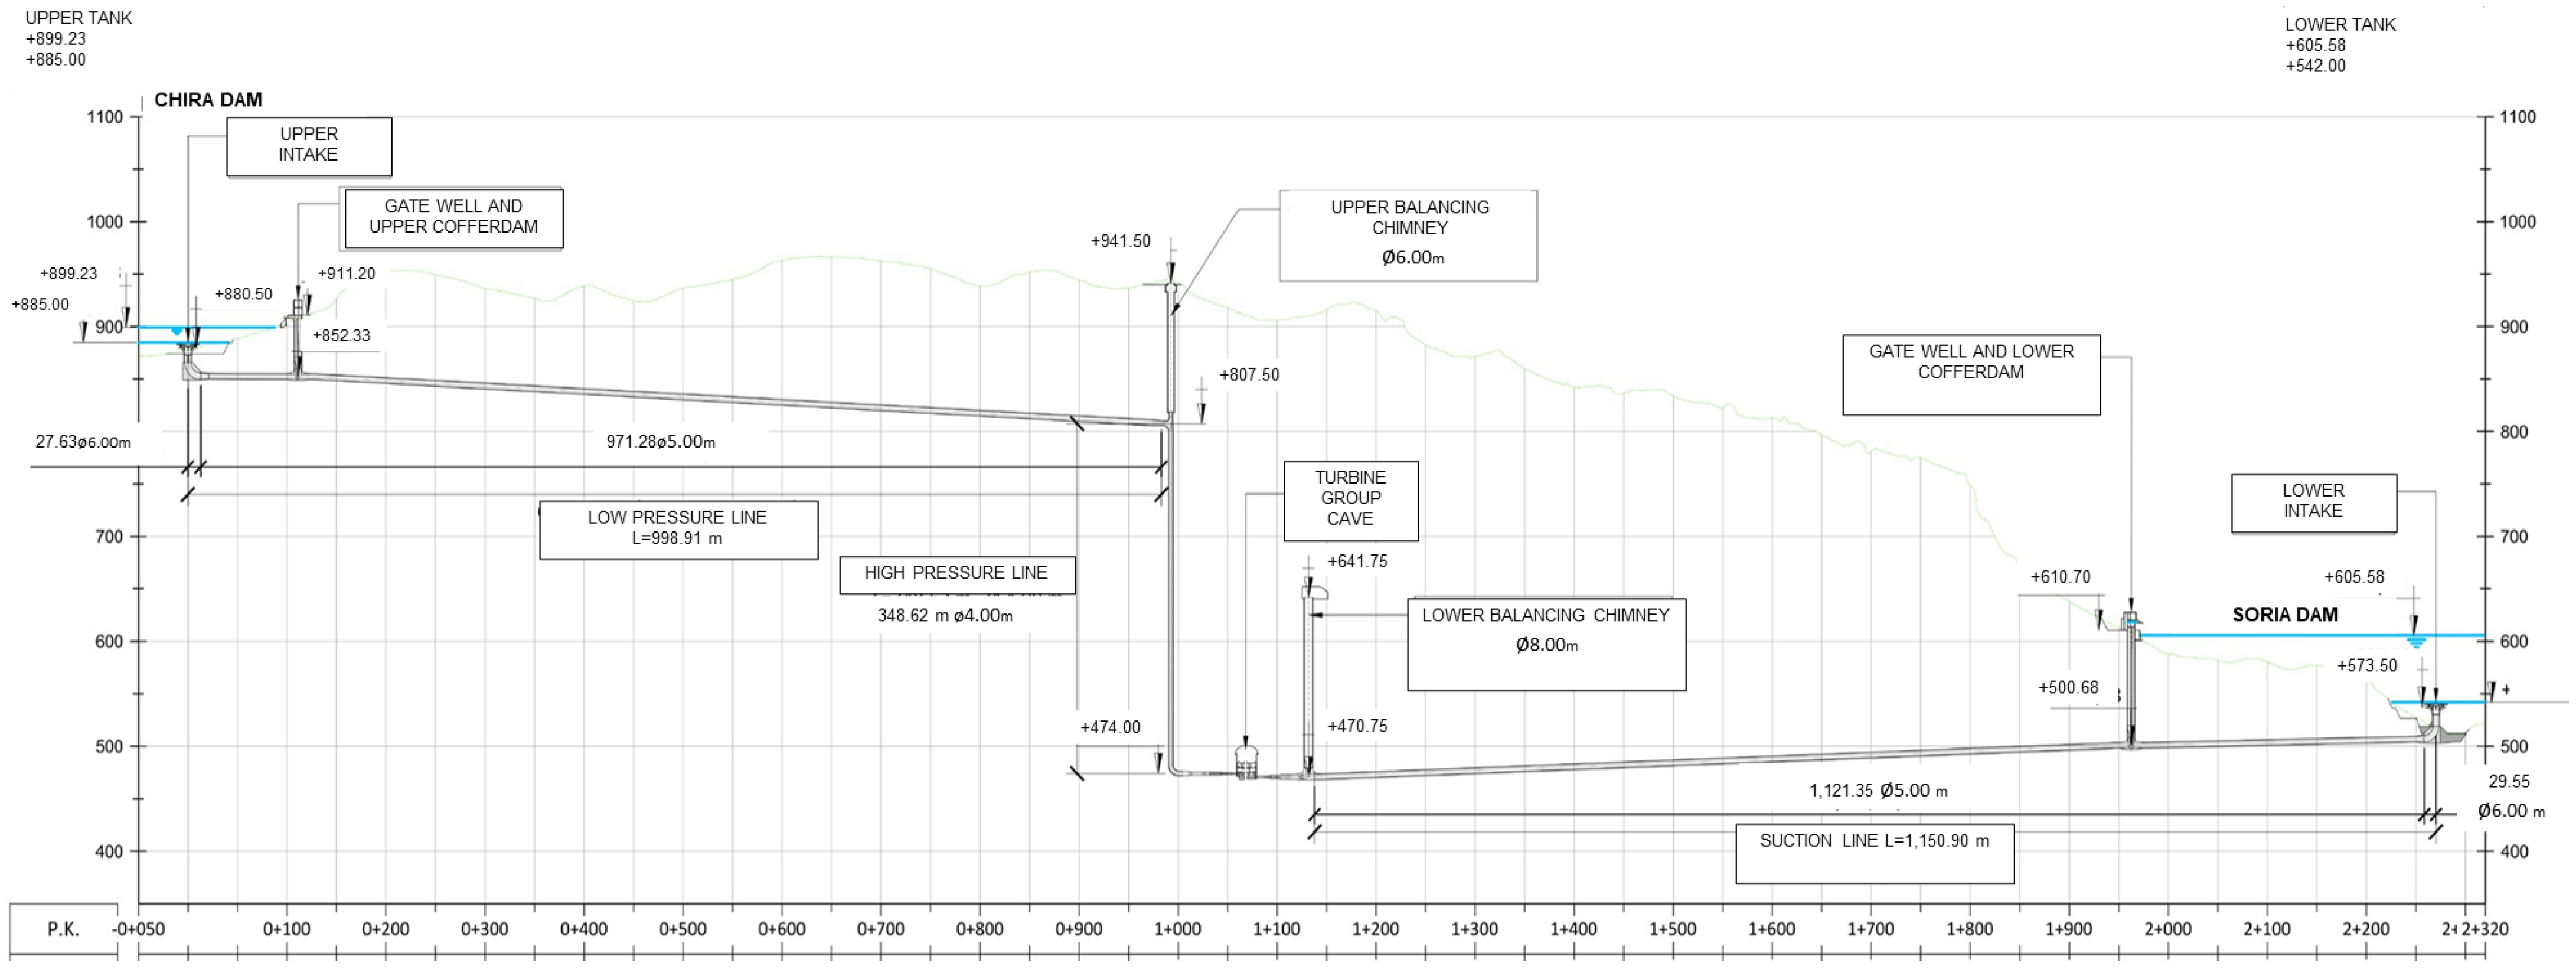
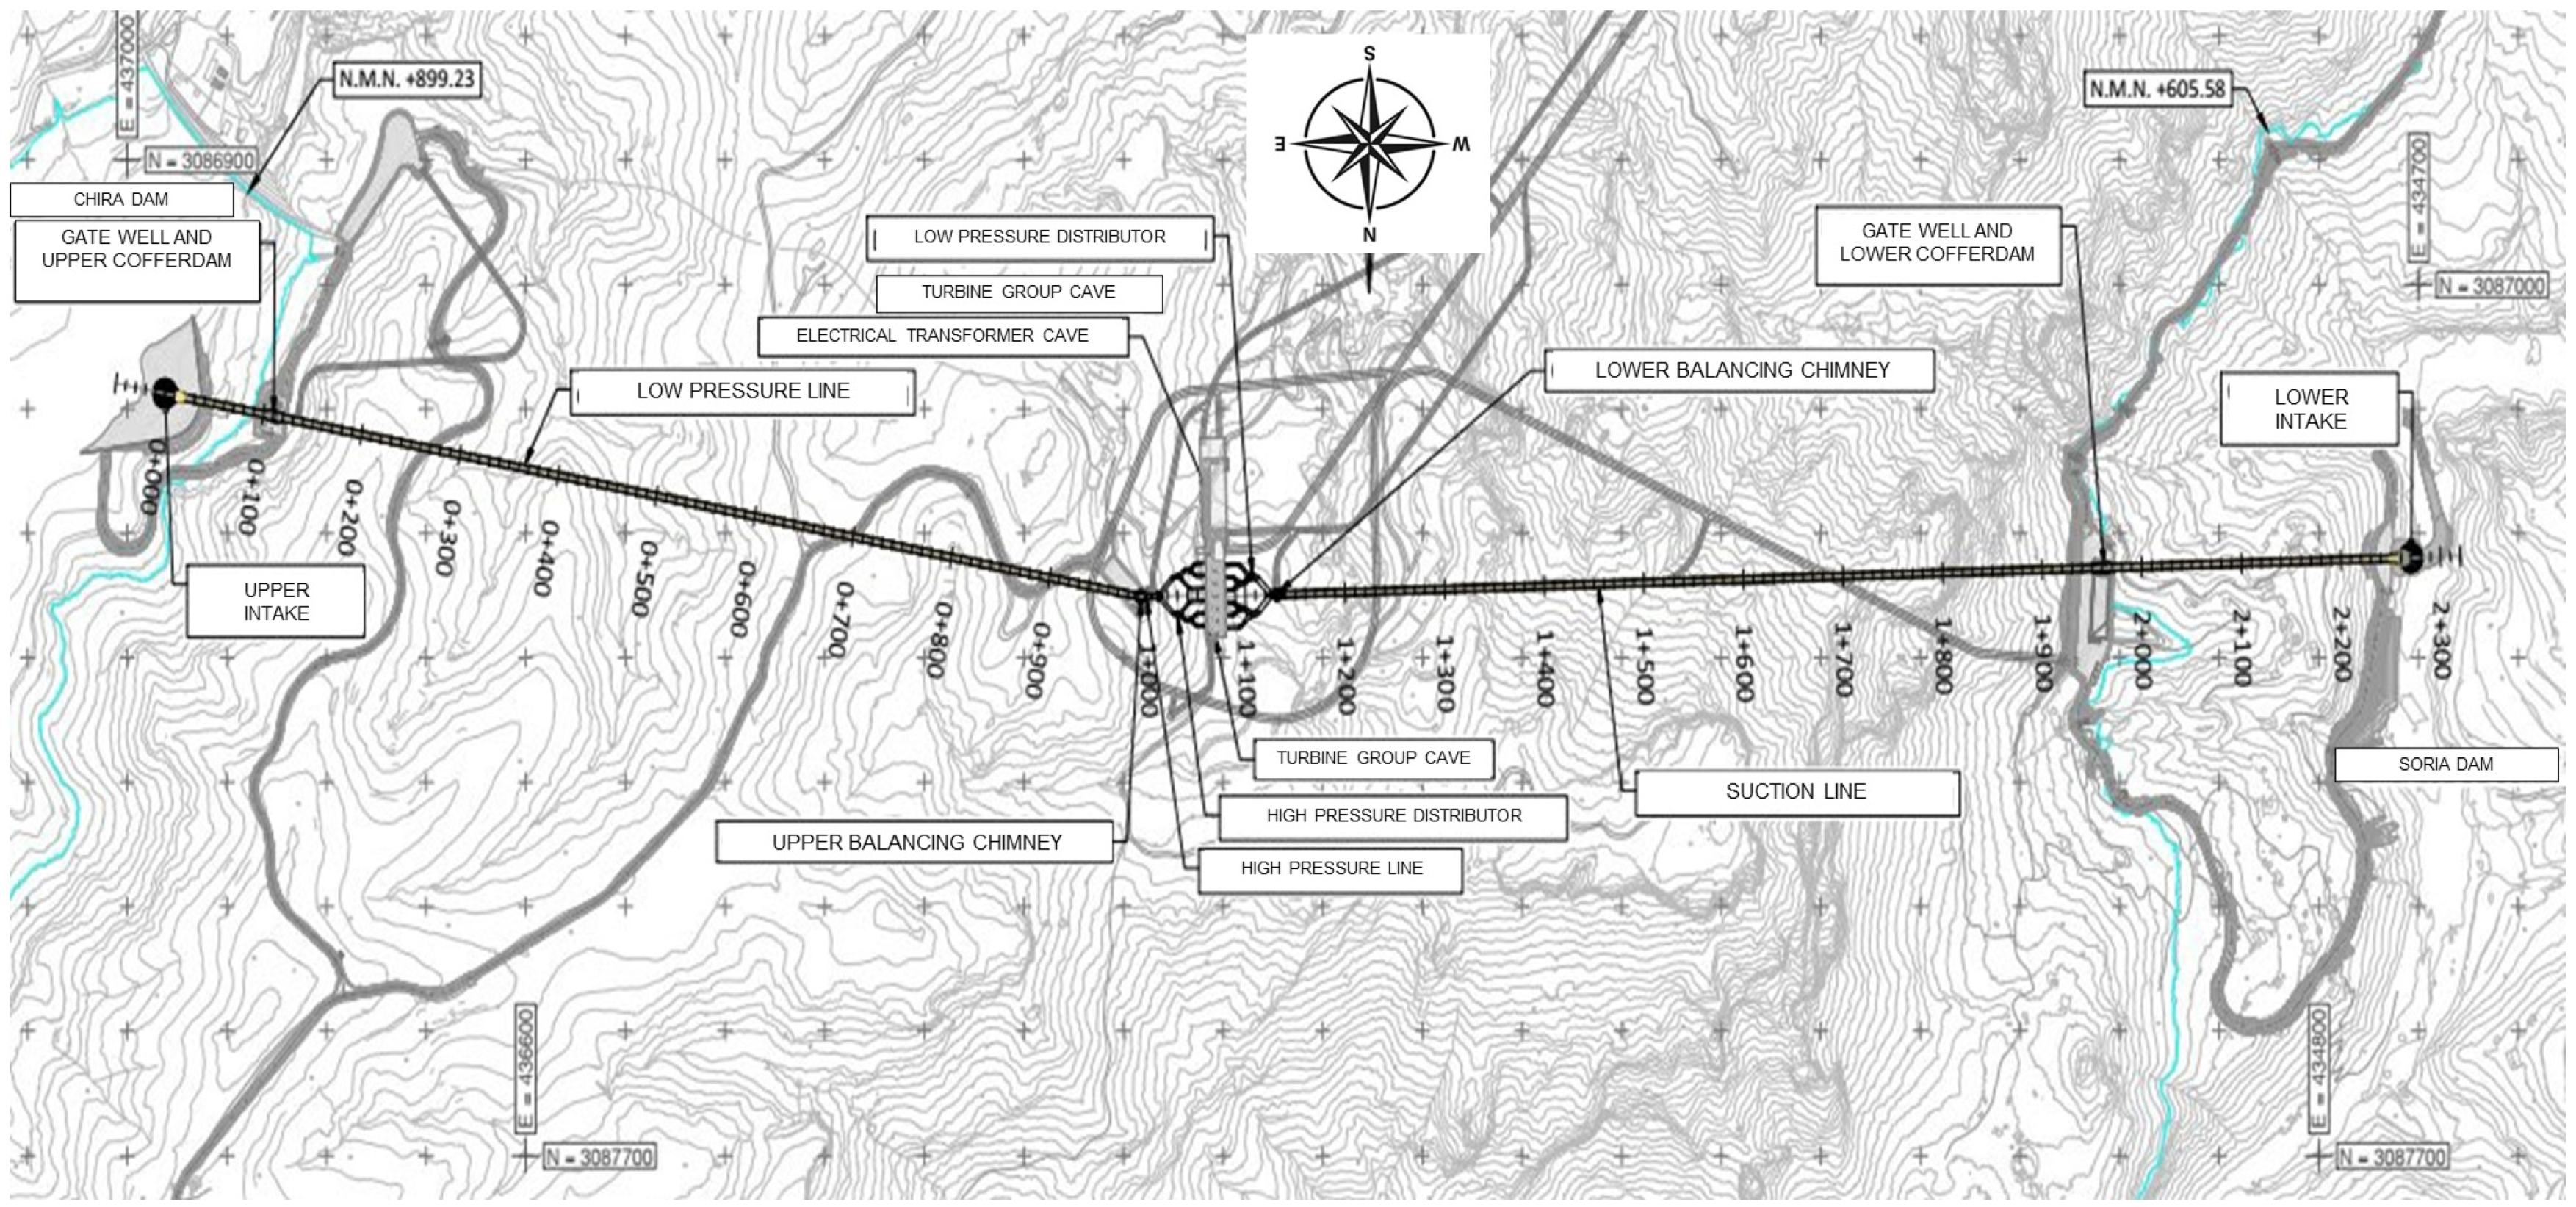
A simplified schematic of the hydraulic network of this installation is shown in Figure 3, Figure 4 and Figure 5 show the general plan of the hydraulic circuit, with the Chira reservoir on the right and the Soria reservoir on the left (image oriented south instead of north).
The turbomachines that make up the PHEs Chira-Soria pumped-storage hydroelectric power station are listed in Table 2, as well as the operating characteristics for turbining and pumping.
The capacity of the Chira dam is 5,640,000.00 m3 and that of the Soria dam is 32,300,000.00 m3, with a maximum transfer capacity of 4,080,000.00 m3.
The seawater reverse osmosis plant will keep the reservoir water within the proper volume limits. Its production figures are negligible compared to those of pumping and turbining, produce 7900.00 m3 in 24 h compared to turbine, 3,939,840.00 m3 in 16 h and pumping 1,537,920.00 m3 in 8 h. This seawater desalination plant, installed in the system as a complement to the natural inputs of the system, consists of an open intake seawater intake, a collection tank, raw water pipes, an outfall with Venturi diffuser, and a product water pumping tank with capacity of 1000 m3.
3.2.2. Stabilization of the Water Resource
A detailed study has been carried out to determine the needs for industrial water supply to the Soria reservoir, and therefore to the hydroelectric power plant. The inflows must allow the hydroelectric system to operate at full capacity at any time during the operating period. Three different calculations have been made for the analysis of the industrial water production needs (Table 3):
(a) Firstly, the annual losses due to evaporation and filtration processes corresponding to own water were determined, resulting in a total of 1.63 hm3/year.
(b) Analyzing the sensitivity to the climate change scenario, in accordance with the conclusions of the Paris Climate Summit, which set the objective of limiting the average annual temperature increase to 1.5 °C by 2010, it is found that annual losses would amount to a maximum of 1.68 hm3/year.
(c) Next, in order to determine the average annual consumption of industrial water, a simulation of the operation of the reservoirs during the period 1972–2019 was carried out, resulting in the following scenarios:
(d) Finally, the time necessary to have a volume of water at 5 hm3, which, according to the requirements of the Concession, must be less than 60 months (5 years), was analyzed. The results obtained were as follows:
- -
- In the case of not having the natural contributions to the Soria reservoir and filling it only with the industrial water produced in the SWRO plant, a total of 43 months would be required, and the flow to be produced would amount to 6,396,160.62 m3.
- -
- With 20% of the natural water reaching the Soria reservoir, as indicated in the Concession, the filling process would produce the following scenarios:Unlikely scenario (5% probability of occurrence): 24 months.Medium scenario (50% probability of occurrence): 38 months.Worst case scenario (100% probability of occurrence): 43 months.
The basic capacity data of the resulting seawater reverse osmosis plant is in Table 4.
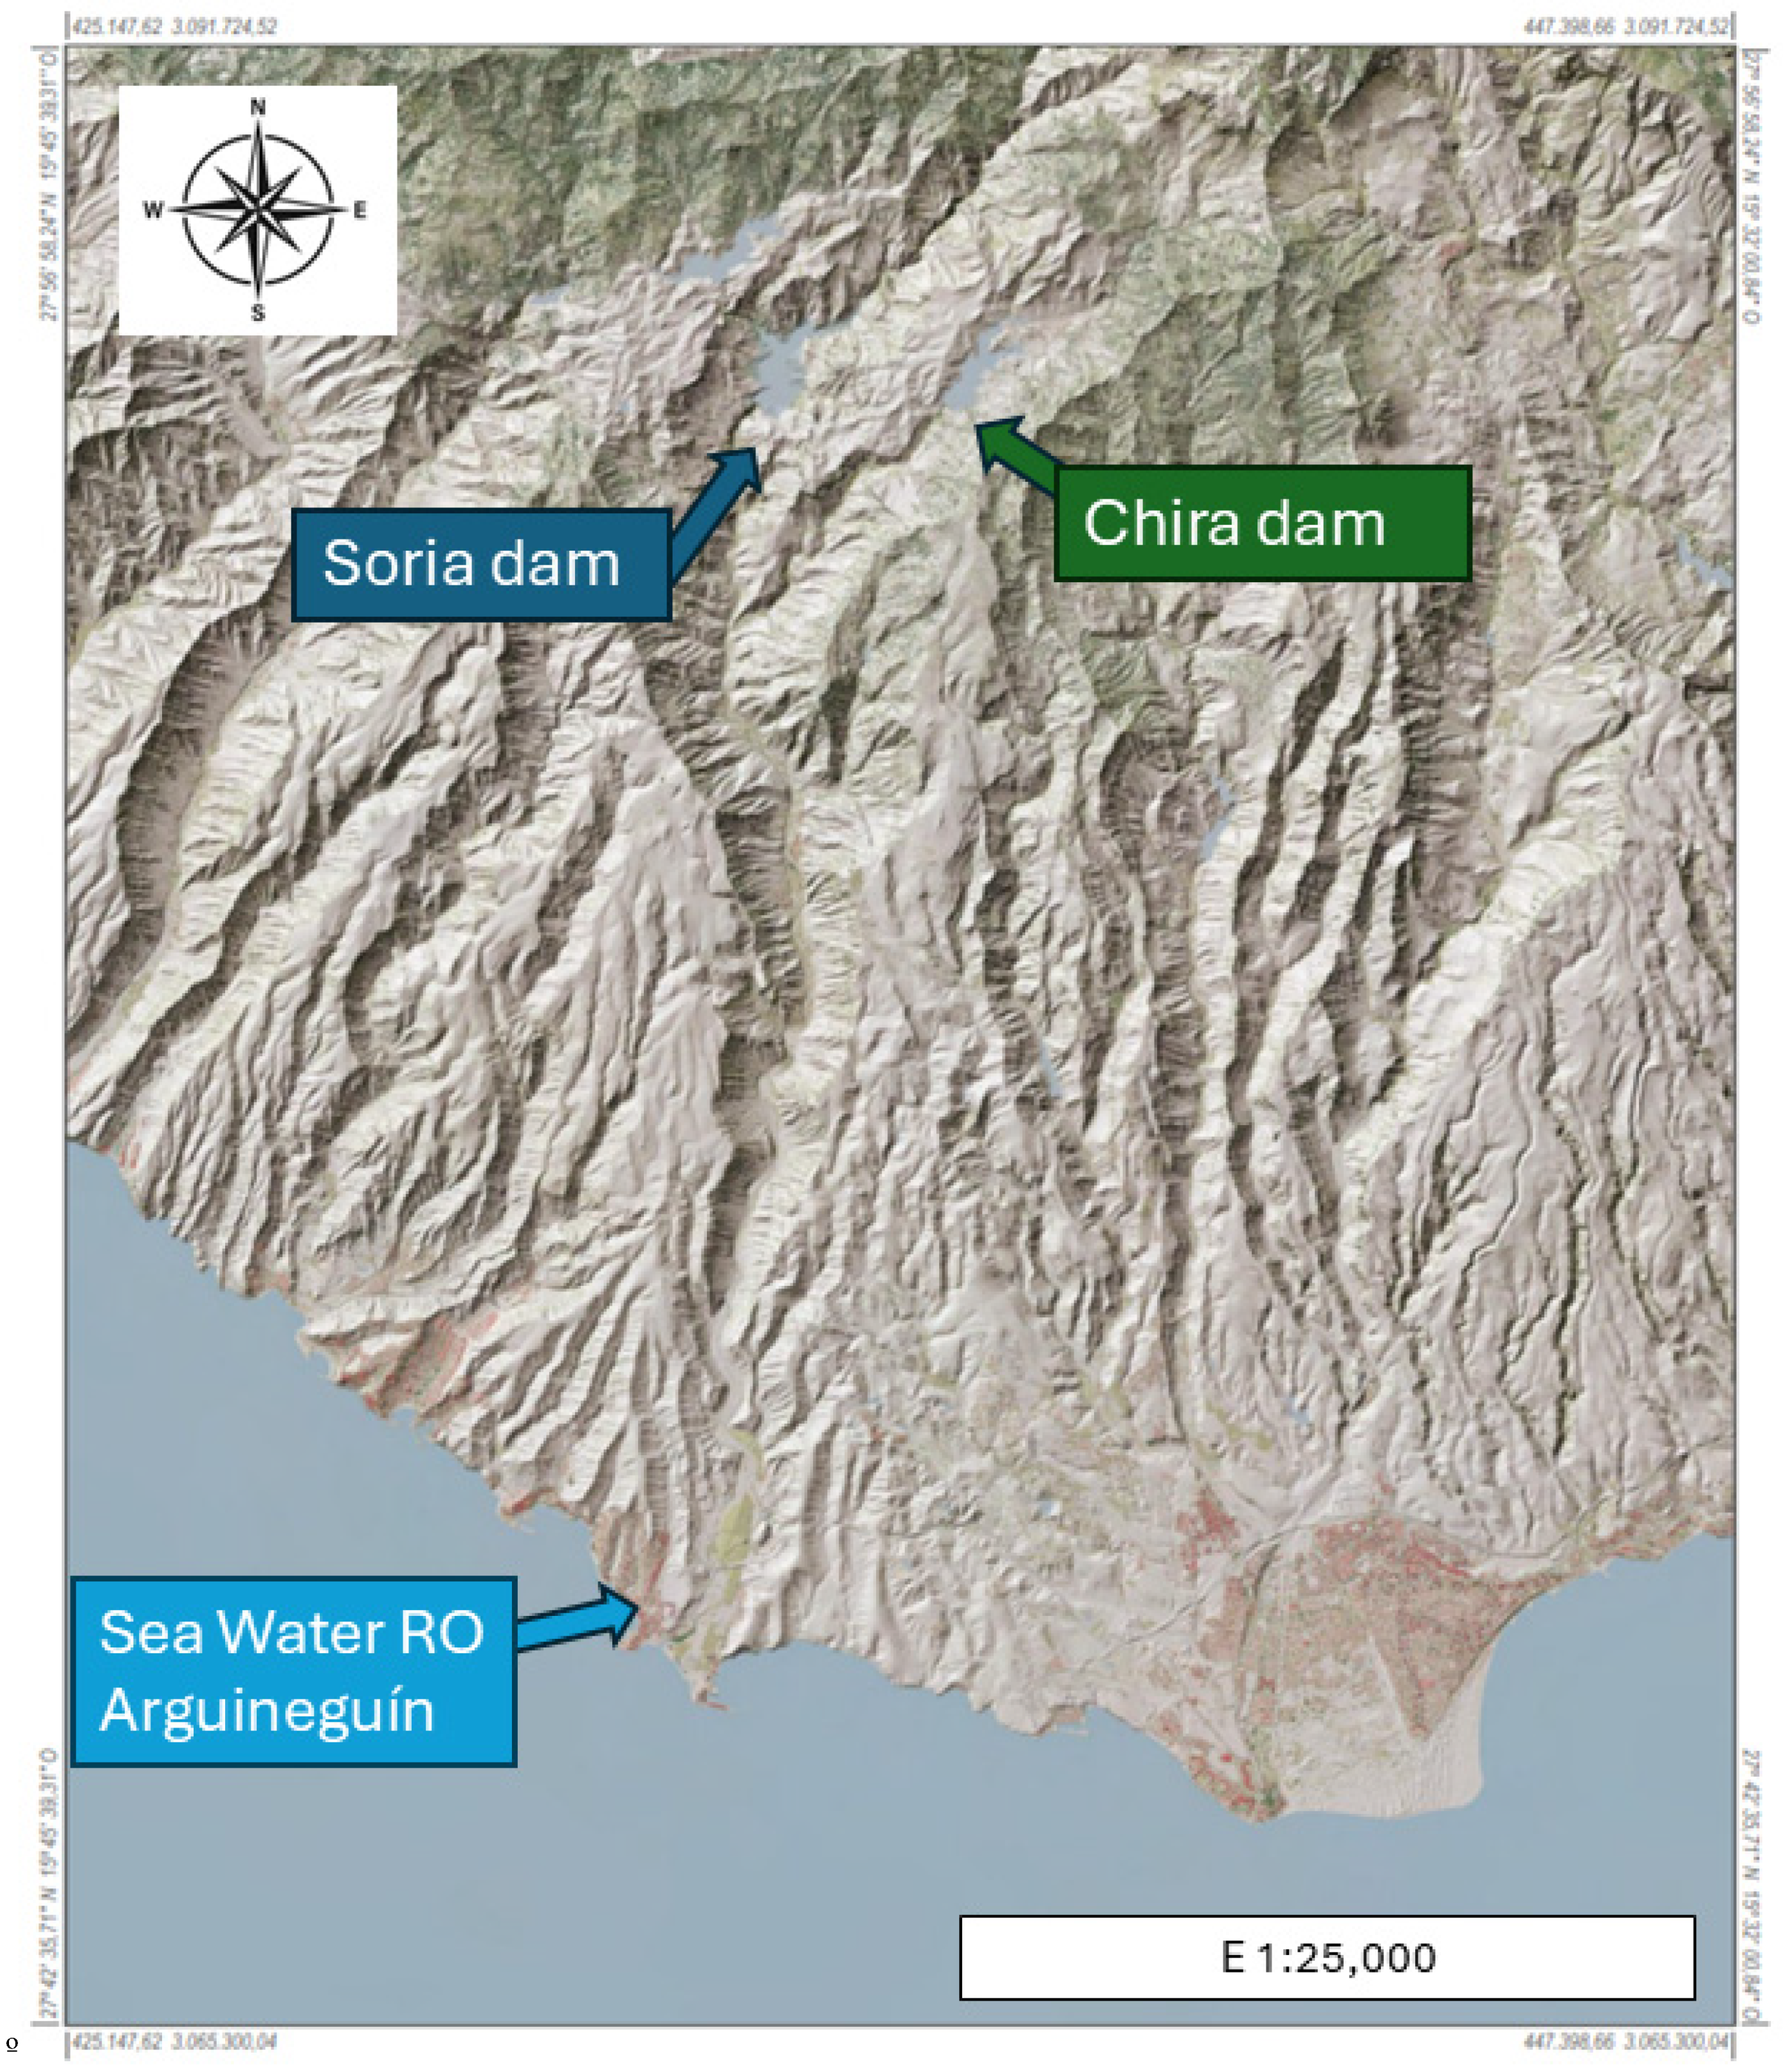
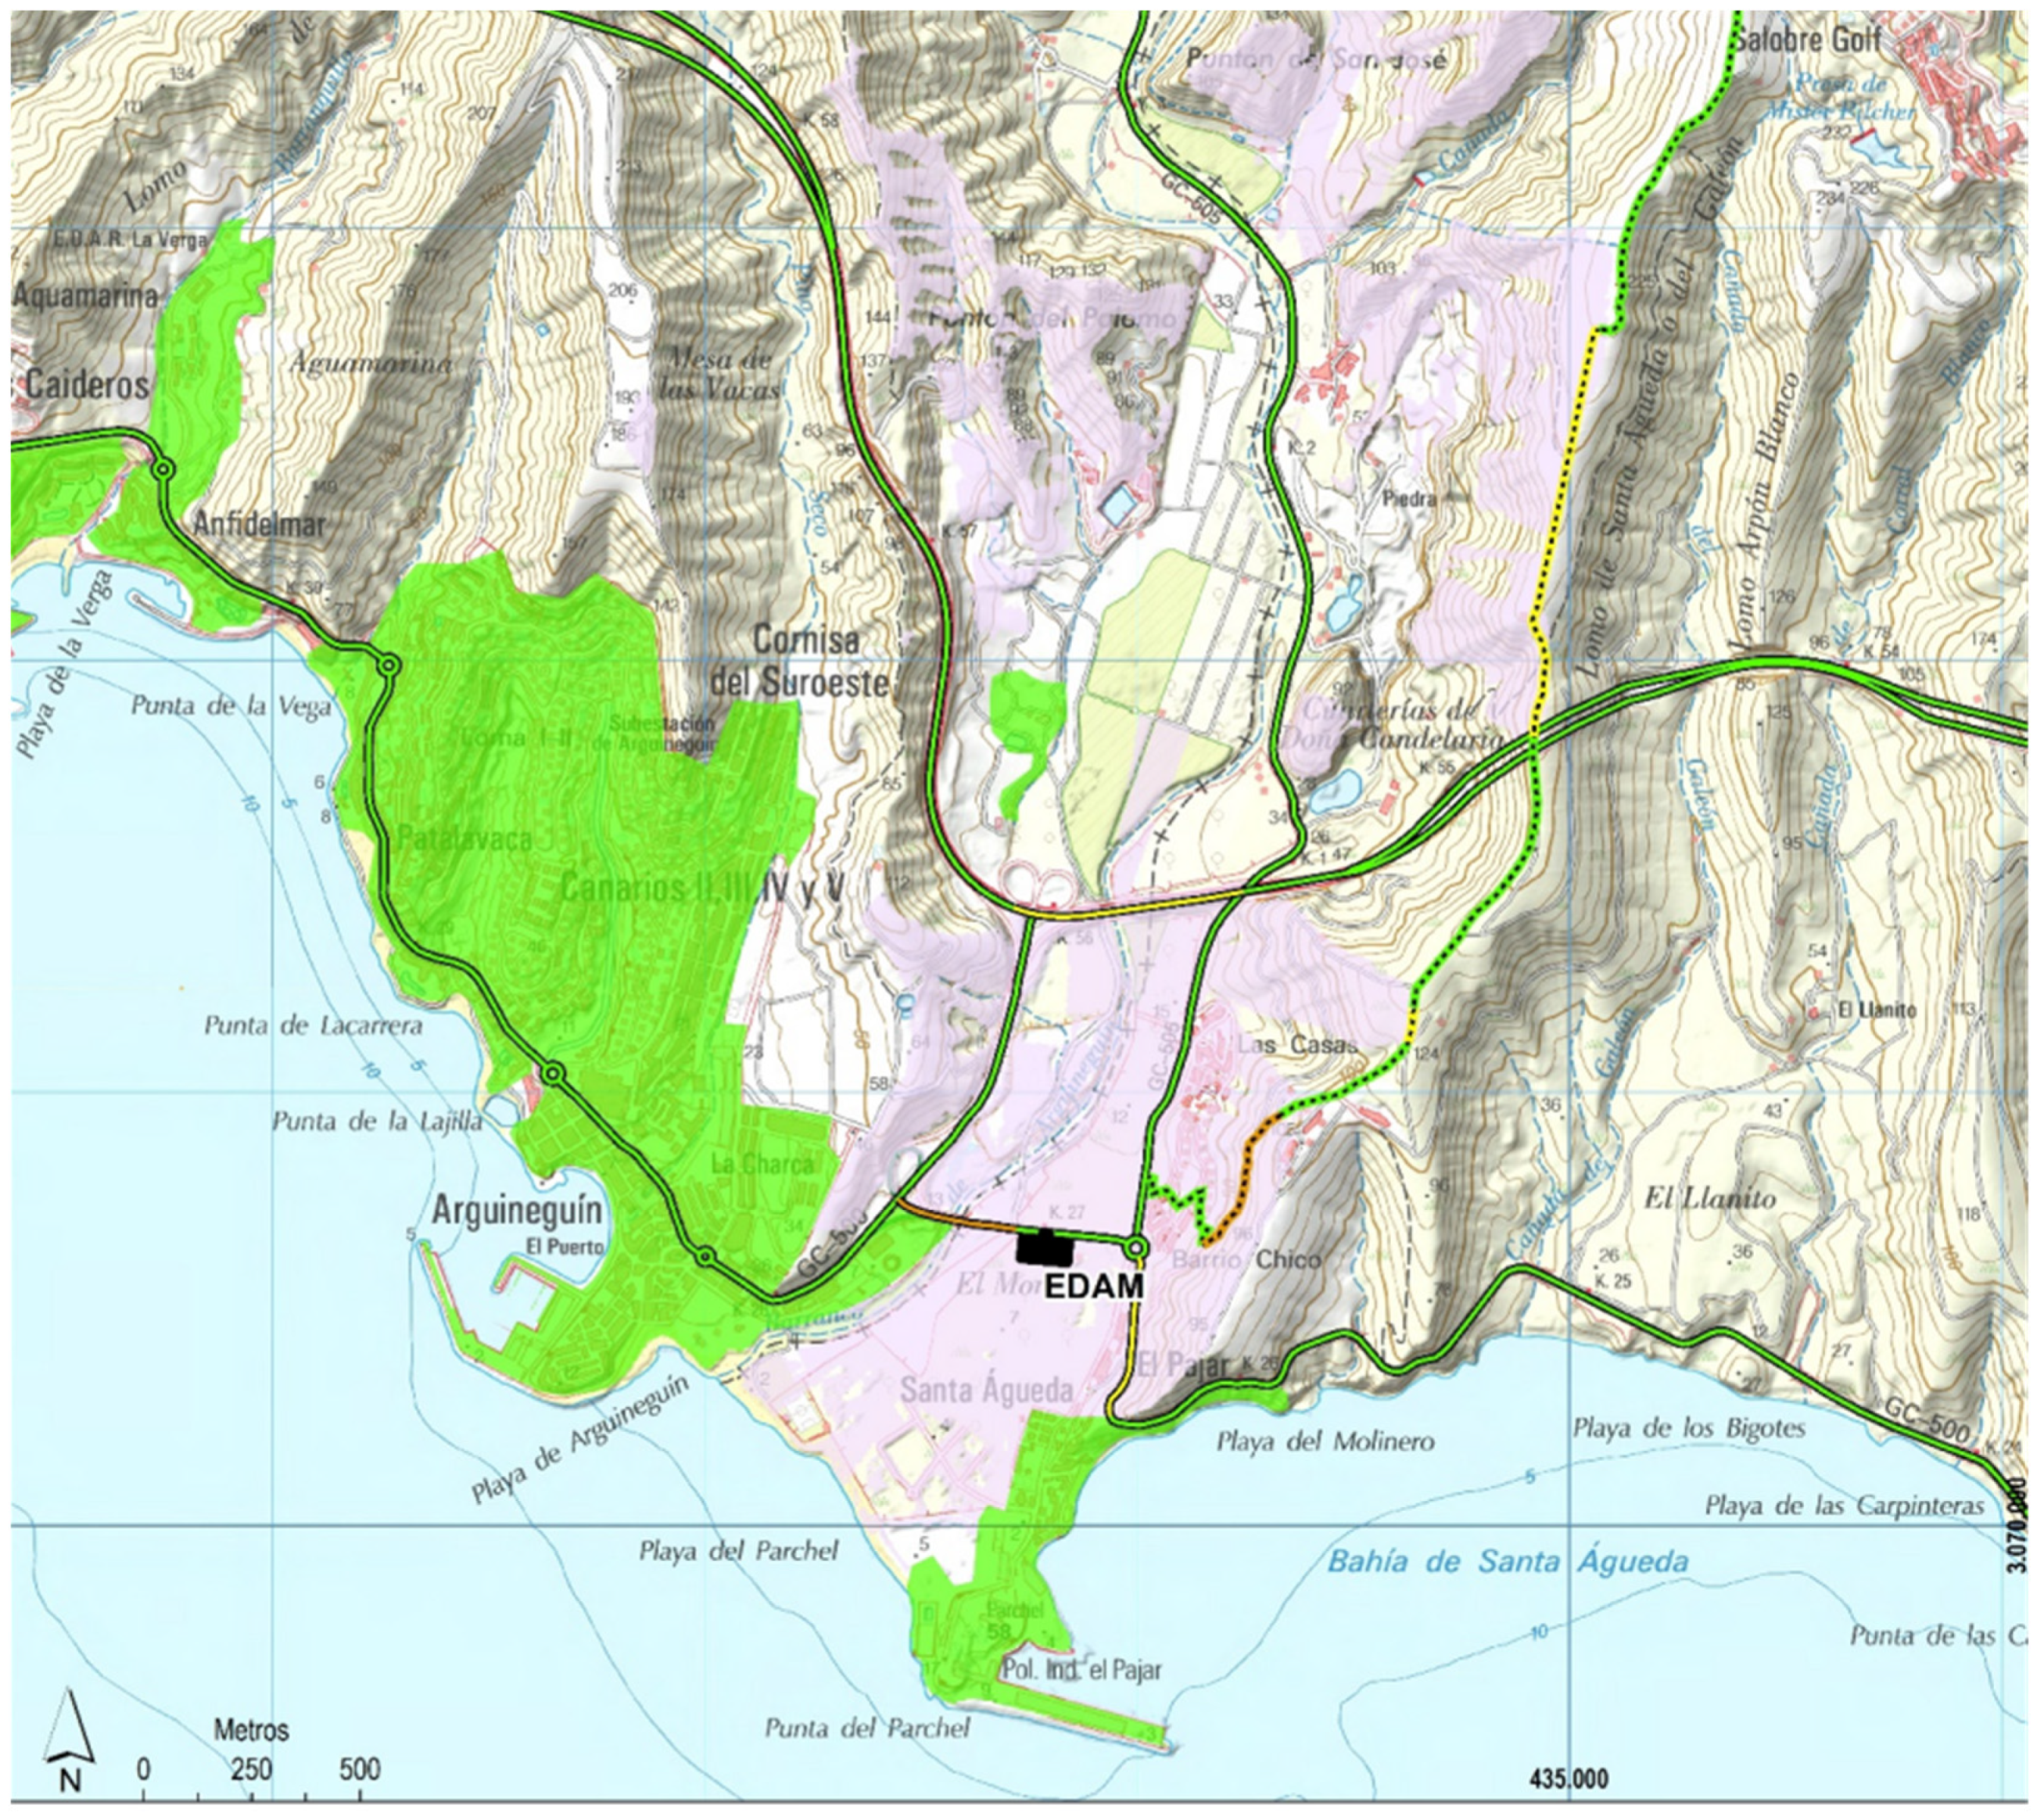
SWRO’s surplus production will also be used to supply the town of Arguineguín, close to the installation (Figure 6).
3.3. Operational Description
As established in the PHEs “Chira-Soria” Project, the power plant’s groups would operate in pumping mode when there is excess energy, due to excess non-manageable generation, mainly wind, or due to low consumption, which would force the large thermal groups to operate in modes of poorer performance or below their technical minimum. Turbinating would occur at peak demand times, replacing the energy that would have been produced by thermal technologies with higher variable system costs and greater environmental impact. Thus, the plant will operate with a daily cycle in which:
- -
- Turbomachines in pumping mode. The groups will consume energy to pump water from the lower basin (Soria) to the upper basin (Chira) in the off-peak period of the night demand (typically from 0:00 h to 7:00 h). This will allow, on the one hand, the use of renewable energy generated at night that is not consumed, as well as the base groups that will be able to operate with better performance during the night and, consequently, reduce the specific CO2 emissions of the whole. It will also avoid shutting down certain units for a few hours, and the subsequent start-up, which is costly. On the other hand, in cases where there is excess wind energy production in the system, pumping will make it possible to “artificially” increase demand, making it possible to integrate the electricity production corresponding to this excess.
- -
- Turbomachines in turbined mode. The units will produce energy by turbining the water conveyed from the upper basin to the lower basin, during peak demand hours (typically from 9.00 to 23.00) and the morning (typically from 10.00 to 13.00) and evening (19.00 to 21.00) peaks. They will thus replace, during the year, higher variable cost technologies (gas turbines running on diesel).
On the other hand, hydroelectric power is very fast in its start-up and power variation, allowing it to respond quickly to failures of grid or system elements. In the event of a total power failure (zero electricity) on the island, the Chira-Soria plant could initiate the recovery of supply in a few minutes, 10–20 min, given its enormous flexibility, being the generating equipment that will initiate the process of replenishing the system. The generation power is 200 MW, the pumping power consumed is 220 MW and the cumulative energy is 3.2 GWh (turbining for 16 h). The transferable volume from the Chira reservoir to the Soria reservoir is 4.08 hm3. The sedimentation study shows that the calculated volume of diversion water will not be affected by the increase in sedimentation and therefore the decrease in the capacity of the dam for at least 50 years, after which it will have to be dredged, which gives us an initial useful life of 50 years of PHEs.
3.4. Data Analysis. Search for Strengths and Weaknesses
3.4.1. Pumping-Turbine Balancing Operation
As indicated in the previous section, the plant’s units would operate in pumping mode and in turbine mode at certain times of the day, and this situation is analyzed first. The table below shows the electricity demand required in both modes for the different operating hours, as well as the amount of water pumped and turbined.
If we want to maintain the transfer level, we cannot turbine without having first replenished the water levels. Consequently, it is always necessary to follow a balance between turbining and pumping in the unit of time that is valued and always without exhausting the transfer capacity. This balance is in Table 5.
This means that if 43.84% of the time (10 h and 31 min) we run the turbines, 56.16% of the time (13 h and 28 min) we need to pump. Obtaining 2104.43 MWh/day with turbine and need 2965.12 MWh/day for pumping.
3.4.2. Estimated Power and Renewable Energy Production
As mentioned above, the PHEs “Chira-Soria” project will maximize the integration of renewable energies, avoiding the discharges that would otherwise occur and enabling the development and installation of this type of energy.
There is a contingent of new installation projects (wind and photovoltaic) with a potential of 725 MW that have at least grid access authorization, the current reality is shown in Table A6, although currently only 400.97 MW are confirmed (which is the situation with final registration).
The forecast growth of energy produced in renewables is shown in Table 6, taking as a reference the data for 2021 on the average operating hours of renewable sources. For wind power, the average annual capacity factor for twelve-month operation is 36.76%, i.e., 8.82 equivalent hours/day (3220 equivalent hours per year). Considering the hours available to work, 24 h a day, 365 days a year, for photovoltaic, the Annual Average Capacity Factor is 24.27%, i.e., 2.91 equivalent hours/day, (1063 equivalent hours per year), considering the hours available to work, 12 h a day, 365 days a year.
3.4.3. Study of Installed Power in the Island Electricity System with the Incorporation of the PHEs “Chira-Soria”
Based on the above analysis, the following facilities are energy producers in Table 7.
The installed capacity has increased by 13.53%, with total installed capacity in renewables accounting for 30.73% of total capacity.
3.4.4. Study of the Energy Demand and Production in the Gran Canaria System with the Incorporation of the PHEs “Chira-Soria”
In terms of demand, with the incorporation of the PHEs project, it should be borne in mind that the plant needs to pump water from Soria to Chira to achieve balance, which means an increase in demand due to pumping of 2965.12 MWh per day on average, or 1,082,268.8 MWh per year on average for maximum pumping use, i.e., 56.16% of the annual average time, which means that the demand with the incorporation of the PHEs project will increase from 3,350,094.00 MWh per year to 4,432,362.80 MWh per year as a maximum.
In terms of energy production, there is an increase, due to the turbine, of 2104.43 MWh per day on average, or 768,118.23 MWh per year on average for maximum turbine use, i.e., 43.84% of the annual average time. With the incorporation of the Chira-Soria hydroelectric pumping station project, electricity production would increase from 3,350,094.0 MWh per year to a maximum of 4,118,212.23 MWh per year, generating a deficit in demand of 314,151,72 MWh per year. Table 8 shows different hypotheses for the increase in demand and electricity production due to the different percentages of pumping and turbine use in the PHEs.
3.4.5. Calculation of the New Needs for Renewable Wind Power Production in the Gran Canaria System with the Incorporation of the “ PHEs “Chira-Soria
To compensate for the new energy production and need to cover the new demand, two scenarios are considered, (a) to cover the difference between pumping and turbining, (b) to cover all pumping. For this purpose, we calculate the wind power requirements for different capacity factors. As indicated above, the average annual capacity factor for twelve-month operation is 36.76%, i.e., 8.82 equivalent hours/day (3220 equivalent h/year).
For the first scenario, Table A7, it turns out that we would need 97.56 MW to cover the net difference in consumption and running pumping and turbining for as long as possible, i.e., 56.16% and 43.84% of the time, and assuming a wind capacity factor of 36.76%, (8.82 h/day) which is the figure achieved in 2021. For the second scenario, Table A8, we would need 336.11 MW to cover pumping for the maximum possible time, i.e., 56.16% of the time, and assuming a wind capacity factor of 36.76% (8.82 h/day), which is the figure achieved in 2021.
On the other hand, these data on installed power and wind energy production versus pumping operating hours must be compared. The operating hours of pumping must be coordinated with the operating hours of wind power. To do this, let us consider the most extreme case, that is, when the entire transfer capacity from Chira to Soria has been turbined and must be pumped back to Chira. The volume that can be transferred from the Chira reservoir to the Soria reservoir is 4.08 hm3 (Table 9).
As shown, the maximum pumping capacity is produced by pumping for 21 h and 13 min. In this case, it is possible to obtain the power shown in the table depending on the capacity wind factor.
Therefore, for the extreme case that concerns us, working the pumping for 21 h and 13 min, we would need 529.27 MW, which could demand 1,703,878.91 MWh per year, assuming a wind power capacity factor of 36.76% (8.82 h/day).
3.4.6. Calculation of the Volume of Volume of Water Transferred in the Soria Reservoir
The number of water renewals in the dam per year to obtain the maximum annual power with the turbine is estimated as follows, i.e., 768,118.23 MWh per year.
As determined above, it takes 16 h and 34 min to empty the dam and 21 h and 13 min to refill it, for a total renovation time of 37 h and 47 min, requiring 231.8 annual renovations to produce the maximum annual turbine power.
4. Integration of the Chira-Soria Hydroelectric Pumping Station into the Overall Energy System of Gran Canaria
4.1. Contribution to the Current Energy System of Gran Canaria
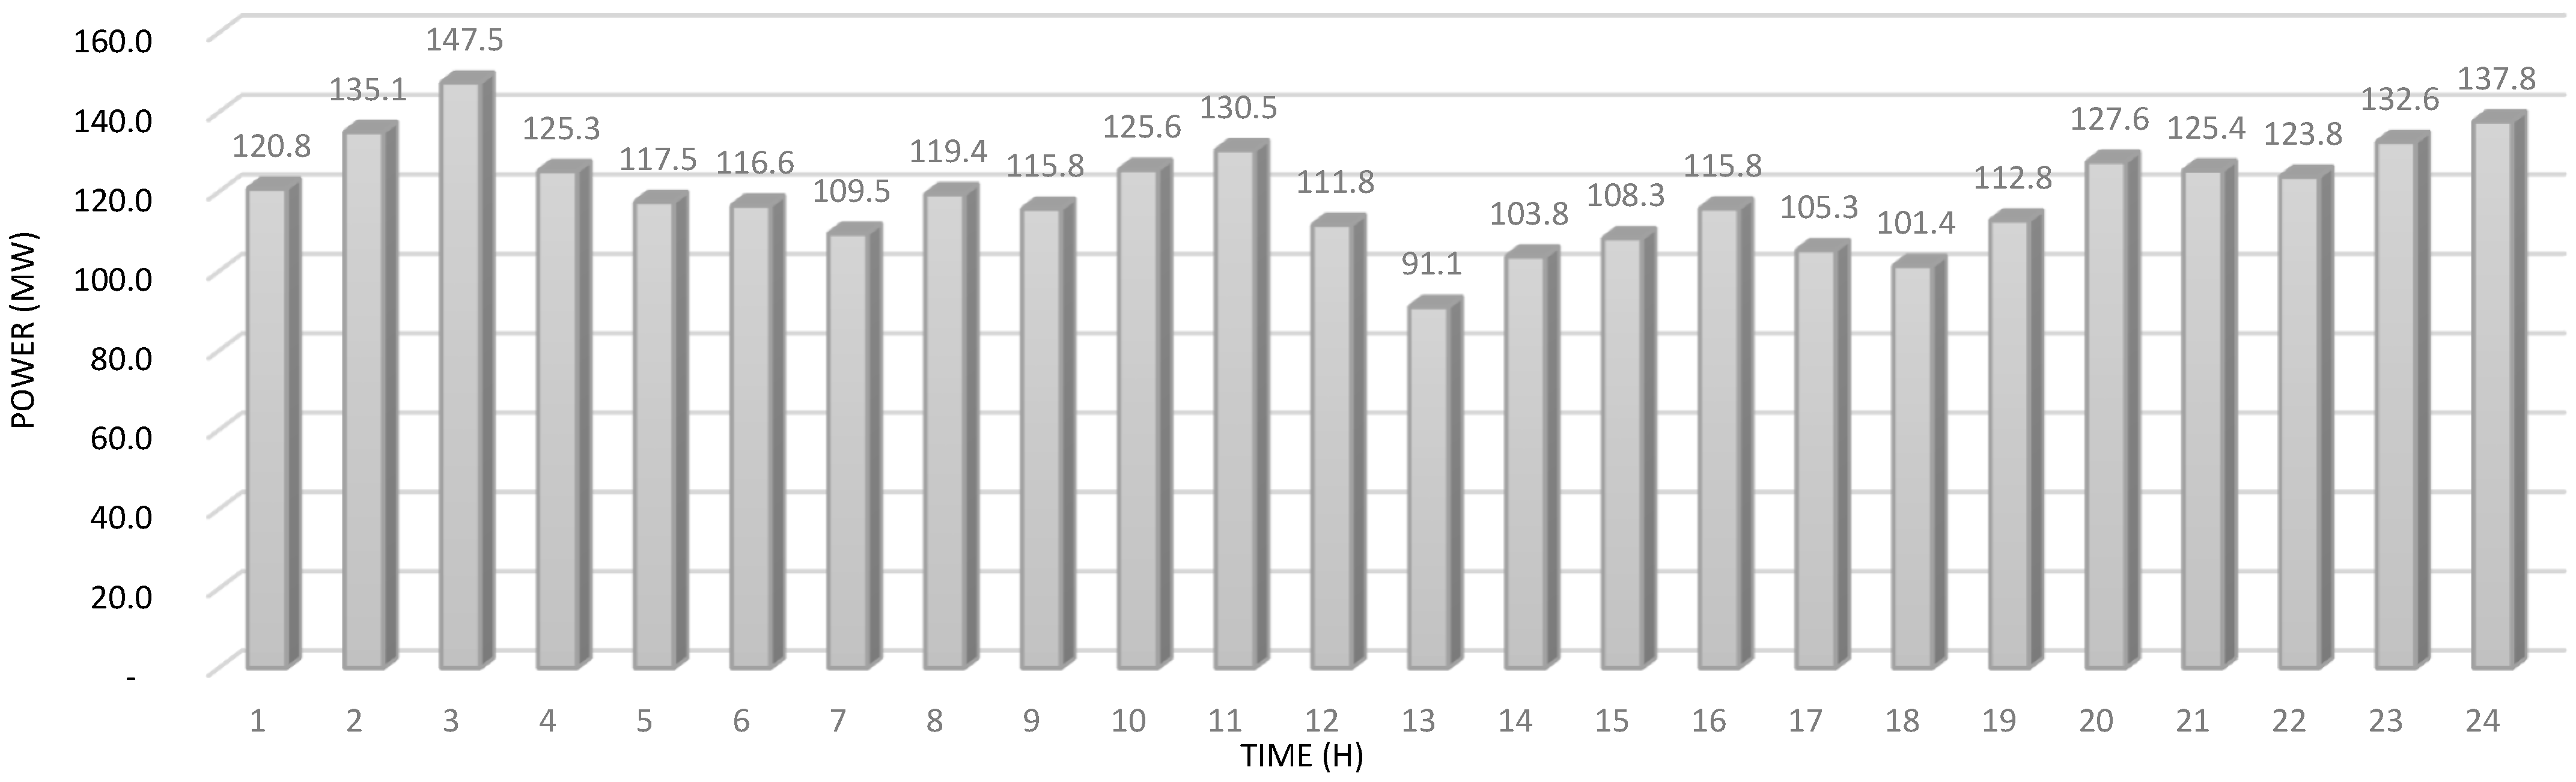
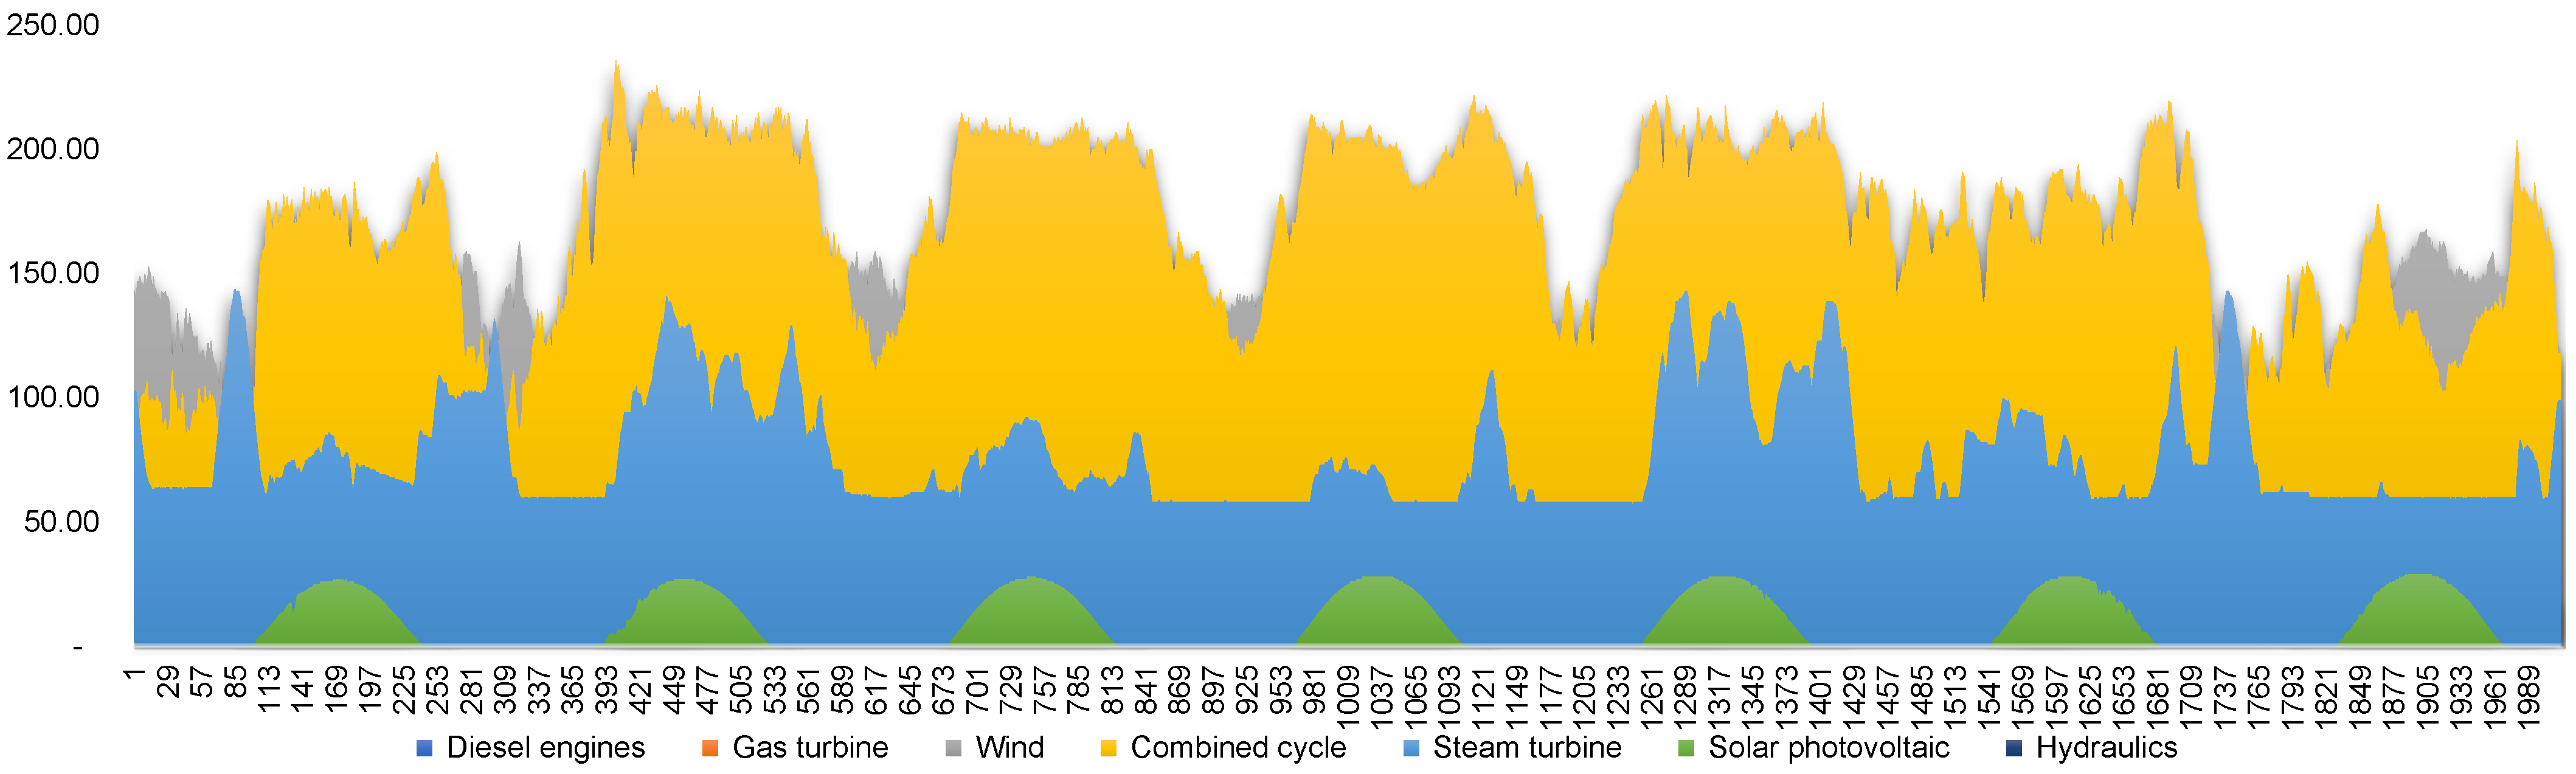
As shown, where the day of highest electricity demand in 2021 is analyzed, among others, the wind energy contribution remains almost constant during the 24 h, instantly disposing of an average of 119.21 MW out of a total of 205.24 MW installed, with its maximum average per hour being 147.5 MW and its minimum average per hour being 91.1 MW. However, these are one-off events as it is practically constant. The following graph shows the average hourly values of wind power during 24 h (Figure 7).
This behavior is repeated annually. This corroborates what we know about installed wind power production: it is far below what is desirable. Therefore, there is still no possibility of waste due to excess wind power production.
The increase in wind power, in addition to that currently existing, to cover the maximum pumping operation (MW) of the PHEs “Chira-Soria” (Table 10), assuming a wind power capacity factor of 36.76% (8.82 h/day), results in 529.27 MW. There is currently 205.24 MW of wind power installed, so the integration and commissioning of the Chira-Soria hydroelectric plant could be carried out, but this would be at the cost of subtracting installed capacity and energy production from the system. In the average that more wind power is installed and we get closer to the proposal, the PHEs “Chira-Soria” will be closer to the objective for which it has been designed (Figure 8).
Another analysis carried out for better integration looks for daily production differences. The weekly energy production-energy demand has been analyzed to study the possible variations in demand on days when there is less work activity and to take advantage of the lower energy production from combustion in that period for use in pumping, thus helping to comply with the minimum technical operating requirements of the groups, almost exclusively in the combined cycle. This situation would be a good transitional contribution until the expected demand in the plant is covered by wind turbines and would be usable on days of less work activity.
4.2. Contribution to the Immediate-Future Energy System of Gran Canaria
The case for which the PHEs “Chira-Soria” has been designed is studied, i.e., according to the results of this study, a minimum additional wind power of 529.27 MW, bringing the total wind renewable energy to 734.51 MW.
Table 11 shows the new power table for this scenario. The total installed capacity is 2007.72 MW, if 49.0% of the capacity comes from renewable sources. In terms of generation, it should be noted that the possible generation includes generation from the hydro turbine and new wind renewables, and that a new demand appears, which is from pumping from the power plant, as shown in Table 12.
This means that there is an increase of 1,389,727.64 MWh per year over the current situation of over-production in renewables. This production can be used, among other things, to mitigate the demand covered by non-renewable production, which is 2,661,453 MWh, and for pumping. It would mean a reduction of almost 47.78% in polluting generation and therefore in emissions and would mean that renewable electricity production would be 71.31%.
5. Results and Discussions
During the analysis process, it has been determined what the incorporation of the PHEs “Chira-Soria” in the energy production system in Gran Canaria entails and the stabilization of the water levels of the dams for their guaranteed operation has been exposed. In short, with the PEHS, great benefits would be achieved.
5.1. Associated with the Characteristics of the Installation
- -
- The use of turbo hydraulic machines that operate in pumping have a worse performance (more power demanded for lower hydraulic consumption), generate a deficit of 20 MW and a lower pumping flow than the turbine.
- -
- As a consequence, more time is required in the pumping phase and more energy than that obtained in the turbine to restore the normal operating levels of the reservoirs. Out of a maximum of 24 h of operation, 13.5 h of pumping are required versus 10.5 h of turbineing. Under these conditions, an annual energy deficit of 314,152 MWh would be obtained.
- -
- The capacity of the Chira reservoir with 5.64 hm3 allows a transfer capacity of 4.08 hm3, this being the limiting value for the determination of the maximum energy delivery in the planned power plant. This maximum value would be obtained in the continuous turbine phase for 16 h and 34 min to deliver 3313.84 MWh that must be compensated with 21 h and 15 min of pumping, requiring 4669.16 MWh.
5.2. Associated with the Integration of Renewables
- -
- According to the PHEs “Chira-Soria”, an installed renewable energy capacity forecast of 725 MW is indicated.
- -
- The need to re-establish the level of the Chira reservoir may eventually require an increase in renewable power of 529.22 MW, to reach 734.51 MW, data obtained because of our study, which, considering the required operating time (21 h and 15 min), will have to be used in the field of wind energy.
- -
- With the above result (734.51 MW), the installed wind power capacity in the island’s energy park would account for 49% of the total.
- -
- If the maximum power production per turbine is sought, 768,118.23 MWh per year, 231.8 annual renewals of the maximum volume of transfer of the reservoir would be needed.
5.3. Associated with Beneficial Contributions to the System
The PEHS, confirming the final installation of 725.00–734.51 MW, would achieve great benefits:
- -
- It would maximize the integration of renewable energies, avoiding spills that would otherwise occur and enabling the development and installation of this type of energy.
- -
- It would provide security to the electrical system and guarantee of supply.
- ✓
- It would stabilize the frequency, the quality of which worsens as the installation of non-dispatchable renewables increases.
- ✓
- It would increase the flexibility of the electrical system, improving its response and making it safer in the face of disturbances.
- -
- It would reduce the costs of the electricity system.
- -
- It would reduce energy dependence on the outside world.
5.4. Challenges
The PHEs “Chira-Soria” would bring new challenges to the system. As proposed by the project, this PHEs would cooperate with wind energy to make better use of it.
- -
- To make up for this deficit in wind energy production, it is certain that future wind energy production in Gran Canaria will reach 725 MW.
- -
- As has been shown, the Chira-Soria Pumped Hydroelectric Power Plant would need a maximum of 529.27 MW of wind power in addition to the installed capacity to cover pumping.
- -
- Until wind energy production does not reach the expected 725 MW, and during the transition, pumping can be encouraged on days of less working activity to comply with the technical minimums of the combined cycle and due to the absence of the necessary wind power quota. It cannot yet be properly exploited due to the shortfall in installed wind power.
Its immediate commissioning would result in an installed power deficit of 97.56 MW in the Gran Canaria electricity system. As more wind power is installed, up to an increase of 529.27 MW, and we get closer to the proposed 734.51 MW, the PHEs “Chira-Soria” will get closer to the objective for which it was designed.
6. Conclusions
The use of turbohydraulic machines that operate in pumping have a worse performance (more power demanded for a lower hydraulic consumption), generate a deficit of 20 MW, and a lower pumping flow than the turbine. This means that, for the maximum operating value, (continuous turbine phase for 16 h and 34 min) it could produce 3313.84 MWh that must be compensated with pumping, (21 h and 15 min), requiring 4669.16 MWh. A deficit of 1355.32 MWh.
For maximum production, 231.8 annual renewals of the maximum transfer volume of the reservoir would be required.
PEHs would maximize the integration of renewable energies, avoiding spills that would otherwise occur and enabling the development and installation of this type of energy and would provide security to the electricity system and guarantee of supply.
Author Contributions
Conceptualization, J.C.L.M., C.A.M.P. and F.L.Z.; Data curation, J.C.L.M., C.A.M.P. and F.L.Z.; Formal analysis, C.A.M.P. and F.L.Z.; Funding acquisition, A.R.M.; Investigation, J.C.L.M., A.R.M., F.L.Z. and C.A.M.P.; Methodology, J.C.L.M., A.R.M., F.L.Z. and C.A.M.P.; Project administration, C.A.M.P. and F.L.Z.; Resources, J.C.L.M., A.R.M., F.L.Z. and C.A.M.P.; Software, J.C.L.M. and C.A.M.P.; Supervision, C.A.M.P. and F.L.Z.; Validation, C.A.M.P. and F.L.Z.; Visualization, J.C.L.M., C.A.M.P. and F.L.Z.; Writing—original draft, J.C.L.M.; Writing—review and editing, J.C.L.M., C.A.M.P. and, F.L.Z. All authors have read and agreed to the published version of the manuscript.
Funding
This research was co-funded by the INTERREG V-A Cooperation, Spain–Portugal MAC (Madeira-Azores-Canaries) 2014–2020 programme, MITIMAC project (MAC2/1.1a/263).
Data Availability Statement
The data presented in this study are available on request.
Conflicts of Interest
The authors declare no conflicts of interest.
Appendix A

Table A1.
Installed Capacity (MW) and Demand Coverage (MWh). Gran Canaria, year 2021 [18].
Table A1.
Installed Capacity (MW) and Demand Coverage (MWh). Gran Canaria, year 2021 [18].
| Type Energy | Type Technology | Installed Power | Demand Coverage | ||
|---|---|---|---|---|---|
| MW | % | MWh | % | ||
| Energies derivatives from oil | Thermal power plants. Steam turbine | 280.00 | 21.9% | 647,519 | 19.3% |
| Thermal power plants. Diesel engine | 84.00 | 6.6% | 199,206 | 5.9% | |
| Thermal power plants. Gas turbine | 173.45 | 13.6% | 60,853 | 1.8% | |
| Thermal power plants. Combined cycle | 461.73 | 36.1% | 1,753,875 | 52.4% | |
| Cogeneration. Steam turbine | 24.20 | 1.9% | 0 | 0.0% | |
| Cogeneration. Diesel engine | 0.68 | 0.1% | 0 | 0.0% | |
| Cogeneration. Gas turbine | 0.00 | 0.0% | 0 | 0.0% | |
| Sum | 1024.06 | 80.1% | 2,661,453 | 79.4% | |
| Energies Renewables | Wind | 205.24 | 16.1% | 632,818 | 18.9% |
| Photovoltaics | 49.15 | 3.8% | 55,823 | 1.7% | |
| Sum | 254.39 | 19.9% | 668,641 | 20.6% | |
| Total | 1278.45 | 100.0% | 3,350,094 | 100.0% | |
Note: Source: Canary Islands Energy Yearbook 2021.
Table A2.
Average daily use (h). Gran Canaria, year 2021 [18].
Table A2.
Average daily use (h). Gran Canaria, year 2021 [18].
| Type Energy | Type Technology | Average Daily Usage | |
|---|---|---|---|
| (h/Day) | (%) | ||
| Non-renewable Energies | Thermal power plants. Steam turbine | 6.34 | 26.40% |
| Thermal power plants. Diesel engine | 6.50 | 27.07% | |
| Thermal power plants. Gas turbine | 0.96 | 4.01% | |
| Thermal power plants. Combined cycle | 10.41 | 43.36% | |
| Cogeneration. Steam turbine | - | - | |
| Cogeneration. Diesel engine | - | - | |
| Cogeneration. Gas turbine | - | - | |
| Media | 7.30 | 30.41% | |
| Renewable Energies | Wind | 8.45 | 35.20% |
| Photovoltaics | 3.11 | 12.97% | |
| Media | 7.42 | 30.90% | |
| Total average | 7.32 | 30.51% | |
Table A3.
SWRO plant and annexes.
| Installation | Flow Rate of Design | Range Operation | Length | Diameter |
|---|---|---|---|---|
| m3/Day | m3/Day | m | mm | |
| Seawater SWRO plant | 5200.00 | 5200.00–7900.00 | - | - |
| Catchment tower | 17,468.00 | 11,643.50–17,468.00 | - | - |
| Open-take catchment inmisario | 17,459.00 | 11,643.50–17,468.70 | 994.93 | 560.0 |
| Raw water impulsión | 11,643.50 | 11,643.50–17,468.70 | 839.56 | 450.0 |
| Brine discharge outfall. With Venturi type diffuser | 9668.70 | 6443.50–9668.70 | 1485.49 | 450.0 |
| Product water pumping. Pumping1 to Pumping II | 5200.00 | - | 17,592.94 | 400.0 |
| Product water pumping. Pumping II to Lower Platform | 5200.00 | - | 4129.07 | 400.0 |
| Product water impulsion. Lower Platform to Soria Reservoir | 5200.00 | - | 402.00 | - |
Note: Source: PHEs Project “Chira-Soria”.
Table A4.
Turbine operation.
| Operating Mode | No. Units | Distribution Operating Time |
|---|---|---|
| Ud | Timetable | |
| (T2) Theoretical continuous turbining | 6 | 9:00–23:00 h |
| (T3) Theoretical tip turbinate | 6 | 10:00–13:00 h and 19:00–21:00 h |
| (B2) Theoretical pumping | 6 | 0:00–7:00 h |
Note: Source: PHEs Project “Chira-Soria”.
Table A5.
Turbine characteristics.
| Operating Mode | Operation | Power | Energy/Day | Flow Rate | Volume of Water Displaced |
|---|---|---|---|---|---|
| h | MW | MWh | m3/s | m3 | |
| (T1) Maximum daily turnover | 16 | 200.0 | 3200.0 | 68.4 | 3,939,840 |
| (T2) Theoretical continuous turbining | 14 | 200.0 | 2800.0 | 68.4 | 3,447,360 |
| (T3) Theoretical continuous turbining | 5 | 200.0 | 1000.0 | 68.4 | 1,231,200 |
| (B1) Maximum daily pumping | 8 | 220.0 | 1760.0 | 53.4 | 1,537,920 |
| (B2) Theoretical pumping | 7 | 220.0 | 1540.0 | 53.4 | 1,345,680 |
Table A6.
Forecast growth in installed capacity in renewables.
| Type Renewable | Chira-Soria Project Estimate | Situation Year 2021 | Situation Year 2023 | Situation with Final Registration |
|---|---|---|---|---|
| MW | MW | MW | MW | |
| Wind | 584.92 | 205.24 | 305.49 | 320.20 |
| Photovoltaic | 140.08 | 49.15 | 73.16 | 80.77 |
| Sum | 725.00 | 254.39 | 378.65 | 400.97 |
Table A7.
Increase in wind power capacity to cover the difference in demand with the incorporation of the Chira-Soria Hydroelectric Pumping Station.
Table A7.
Increase in wind power capacity to cover the difference in demand with the incorporation of the Chira-Soria Hydroelectric Pumping Station.
| Percentage Pumping Performance (%) | 56.16% | 50.00% | 40.00% | 30.00% | 20.00% | 10.00% | 0.00% | |
|---|---|---|---|---|---|---|---|---|
| Hours Pumping Operation per Day (h/Day) | 13.48 | 12.00 | 9.60 | 7.20 | 4.80 | 2.40 | 0.00 | |
| Capacity Factor Wind | Equivalent Operating Hours/Day Wind | Power (MW) | Power (MW) | Power (MW) | Power (MW) | Power (MW) | Power (MW) | Power (MW) |
| 25.00% | 6.00 | 143.45 | 127.72 | 102.18 | 76.63 | 51.09 | 25.54 | 0.00 |
| 29.17% | 7.00 | 122.96 | 109.47 | 87.58 | 65.68 | 43.79 | 21.89 | 0.00 |
| 33.33% | 8.00 | 107.59 | 95.79 | 76.63 | 57.47 | 38.32 | 19.16 | 0.00 |
| 35.71% | 8.57 | 100.43 | 89.42 | 71.54 | 53.65 | 35.77 | 17.88 | 0.00 |
| 36.76% | 8.82 | 97.56 | 86.86 | 69.49 | 52.12 | 34.75 | 17.37 | 0.00 |
| 37.50% | 9.00 | 95.63 | 85.15 | 68.12 | 51.09 | 34.06 | 17.03 | 0.00 |
| 41.67% | 10.00 | 86.07 | 76.63 | 61.31 | 45.98 | 30.65 | 15.33 | 0.00 |
| 45.83% | 11.00 | 78.24 | 69.67 | 55.73 | 41.80 | 27.87 | 13.93 | 0.00 |
Table A8.
Increase in wind power to cover exclusively the increase in total pumping demand with the incorporation of the Chira-Soria hydroelectric pumping station.
Table A8.
Increase in wind power to cover exclusively the increase in total pumping demand with the incorporation of the Chira-Soria hydroelectric pumping station.
| Percentage Pumping Performance (%) | 56.16% | 50.00% | 40.00% | 30.00% | 20.00% | 10.00% | 0.00% | |
|---|---|---|---|---|---|---|---|---|
| Hours Pumping Operation per Day (h/Day) | 13.48 | 12.00 | 9.60 | 7.20 | 4.80 | 2.40 | 0.00 | |
| Capacity Factor Wind | Equivalent Operating Hours/Day Wind | Power (MW) | Power (MW) | Power (MW) | Power (MW) | Power (MW) | Power (MW) | Power (MW) |
| 25.00% | 6.00 | 494.19 | 440.00 | 352.00 | 264.00 | 176.00 | 88.00 | 0.00 |
| 29.17% | 7.00 | 423.49 | 377.14 | 301.71 | 226.29 | 150.86 | 75.43 | 0.00 |
| 33.33% | 8.00 | 370.64 | 330.00 | 264.00 | 198.00 | 132.00 | 66.00 | 0.00 |
| 35.71% | 8.57 | 345.99 | 308.06 | 246.45 | 184.83 | 123.22 | 61.61 | 0.00 |
| 36.76% | 8.82 | 336.11 | 299.25 | 239.40 | 179.55 | 119.70 | 59.85 | 0.00 |
| 37.50% | 9.00 | 329.46 | 293.33 | 234.67 | 176.00 | 117.33 | 58.67 | 0.00 |
| 41.67% | 10.00 | 296.51 | 264.00 | 211.20 | 158.40 | 105.60 | 52.80 | 0.00 |
| 45.83% | 11.00 | 269.56 | 240.00 | 192.00 | 144.00 | 96.00 | 48.00 | 0.00 |
References
- Qiblawey, Y.; Alassi, A.; Zain ul Abideen, M.; Bañales, S. Techno-Economic Assessment of Increasing the Renewable Energy Supply in the Canary Islands: The Case of Tenerife and Gran Canaria. Energy Policy 2022, 162, 112791. [Google Scholar] [CrossRef]
- Uche-Soria, M.; Rodríguez-Monroy, C. Energy Planning and Its Relationship to Energy Poverty in Decision Making. A First Approach for the Canary Islands. Energy Policy 2020, 140, 111423. [Google Scholar] [CrossRef]
- Vargas-Salgado, C.; Águila-León, J.; Alfonso-Solar, D.; Malmquist, A. Simulations and Experimental Study to Compare the Behavior of a Genset Running on Gasoline or Syngas for Small Scale Power Generation. Energy 2022, 244, 122633. [Google Scholar] [CrossRef]
- Berna-Escriche, C.; Vargas-Salgado, C.; Alfonso-Solar, D.; Escrivá-Castells, A. Can a Fully Renewable System with Storage Cost-Effectively Cover the Total Demand of a Big Scale Standalone Grid? Analysis of Three Scenarios Applied to the Grand Canary Island, Spain by 2040. J. Energy Storage 2022, 52, 104774. [Google Scholar] [CrossRef]
- Sigrist, L.; Lobato, E.; Rouco, L.; Gazzino, M.; Cantu, M. Economic Assessment of Smart Grid Initiatives for Island Power Systems. Appl. Energy 2017, 189, 403–415. [Google Scholar] [CrossRef]
- Matsumoto, K.; Matsumura, Y. Challenges and Economic Effects of Introducing Renewable Energy in a Remote Island: A Case Study of Tsushima Island, Japan. Renew. Sustain. Energy Rev. 2022, 162, 112456. [Google Scholar] [CrossRef]
- Pombo, D.V.; Martinez-Rico, J.; Spataru, S.V.; Bindner, H.W.; Sørensen, P.E. Decarbonizing Energy Islands with Flexibility-Enabling Planning: The Case of Santiago, Cape Verde. Renew. Sustain. Energy Rev. 2023, 176, 113151. [Google Scholar] [CrossRef]
- Schreiber, A.; Stenzel, P.; Marx, J.; Koj, J.; Wulf, C.; Zapp, P. Renewable Energies for Graciosa Island, Azores—Life Cycle Assessment of Electricity Generation. Energy Procedia 2016, 135, 62–74. [Google Scholar]
- Dallavalle, E.; Cipolletta, M.; Casson Moreno, V.; Cozzani, V.; Zanuttigh, B. Towards Green Transition of Touristic Islands through Hybrid Renewable Energy Systems. A Case Study in Tenerife, Canary Islands. Renew. Energy 2021, 174, 426–443. [Google Scholar] [CrossRef]
- Padrón, S.; Medina, J.F.; Rodríguez, A. Analysis of a Pumped Storage System to Increase the Penetration Level of Renewable Energy in Isolated Power Systems. Gran Canaria: A Case Study. Energy 2011, 36, 6753–6762. [Google Scholar] [CrossRef]
- Mitali, J.; Dhinakaran, S.; Mohamad, A.A. Energy Storage Systems: A Review. Energy Storage Sav. 2022, 1, 166–216. [Google Scholar] [CrossRef]
- Ferreira, H.L.; Garde, R.; Fulli, G.; Kling, W.; Lopes, J.P. Characterisation of Electrical Energy Storage Technologies. Energy 2013, 53, 288–298. [Google Scholar] [CrossRef]
- Zhang, C.; Wei, Y.-L.; Cao, P.-F.; Lin, M.-C. Energy Storage System: Current Studies on Batteries and Power Condition System. Renew. Sustain. Energy Rev. 2018, 82, 3091–3106. [Google Scholar] [CrossRef]
- Papadopoulos, A.M. Renewable Energies and Storage in Small Insular Systems: Potential, Perspectives and a Case Study. Renew. Energy 2020, 149, 103–114. [Google Scholar] [CrossRef]
- Katsaprakakis, D.; Dakanali, I. Comparing Electricity Storage Technologies for Small Insular Grids. Energy Procedia 2019, 159, 84–89. [Google Scholar] [CrossRef]
- Arévalo, P.; Eras-Almeida, A.A.; Cano, A.; Jurado, F.; Egido-Aguilera, M.A. Planning of Electrical Energy for the Galapagos Islands Using Different Renewable Energy Technologies. Electr. Power Syst. Res. 2022, 203, 107660. [Google Scholar] [CrossRef]
- Colmenar-Santos, A.; de Palacio-Rodriguez, C.; Rosales-Asensio, E.; Borge-Diez, D. Estimating the Benefits of Vehicle-to-Home in Islands: The Case of the Canary Islands. Energy 2017, 134, 311–322. [Google Scholar] [CrossRef]
- Gobierno de Canarias. Anuario Energético de Canarias 2021. January 2023. Available online: https://www3.gobiernodecanarias.org/ceic/energia/oecan/files/AnuarioEnergeticoCanarias_2021_v2.pdf (accessed on 1 January 2024).
- Bonilla-Campos, I.; Sorbet, F.J.; Astrain, D. Radical Change in the Spanish Grid: Renewable Energy Generation Profile and Electric Energy Excess. Sustain. Energy Grids Netw. 2022, 32, 100941. [Google Scholar] [CrossRef]
- Kuang, Y.; Zhang, Y.; Zhou, B.; Li, C.; Cao, Y.; Li, L.; Zeng, L. A Review of Renewable Energy Utilization in Islands. Renew. Sustain. Energy Rev. 2016, 59, 504–513. [Google Scholar] [CrossRef]
- Potrč, S.; Čuček, L.; Martin, M.; Kravanja, Z. Sustainable Renewable Energy Supply Networks Optimization—The Gradual Transition to a Renewable Energy System within the European Union by 2050. Renew. Sustain. Energy Rev. 2021, 146, 111186. [Google Scholar] [CrossRef]
- Mendoza-Vizcaino, J.; Raza, M.; Sumper, A.; Díaz-González, F.; Galceran-Arellano, S. Integral Approach to Energy Planning and Electric Grid Assessment in a Renewable Energy Technology Integration for a 50/50 Target Applied to a Small Island. Appl. Energy 2019, 233–234, 524–543. [Google Scholar] [CrossRef]
- Gils, H.C.; Simon, S. Carbon Neutral Archipelago—100% Renewable Energy Supply for the Canary Islands. Appl. Energy 2017, 188, 342–355. [Google Scholar] [CrossRef]
- Katsaprakakis, D.A. Hybrid Power Plants in Non-Interconnected Insular Systems. Appl. Energy 2016, 164, 268–283. [Google Scholar] [CrossRef]
- Erdinc, O.; Paterakis, N.G.; Catalão, J.P.S. Overview of Insular Power Systems under Increasing Penetration of Renewable Energy Sources: Opportunities and Challenges. Renew. Sustain. Energy Rev. 2015, 52, 333–346. [Google Scholar] [CrossRef]
- Hamilton, J.; Negnevitsky, M.; Wang, X. The Potential of Variable Speed Diesel Application in Increasing Renewable Energy Source Penetration. Energy Procedia 2019, 160, 558–565. [Google Scholar] [CrossRef]
- Alzahrani, A.M.; Zohdy, M.; Yan, B. An Overview of Optimization Approaches for Operation of Hybrid Distributed Energy Systems with Photovoltaic and Diesel Turbine Generator. Electr. Power Syst. Res. 2021, 191, 106877. [Google Scholar] [CrossRef]
- Gómez-Calvet, R.; Martínez-Duart, J.M.; Serrano-Calle, S. Current State and Optimal Development of the Renewable Electricity Generation Mix in Spain. Renew. Energy 2019, 135, 1108–1120. [Google Scholar] [CrossRef]
- Cabrera, P.; Lund, H.; Carta, J.A. Smart Renewable Energy Penetration Strategies on Islands: The Case of Gran Canaria. Energy 2018, 162, 421–443. [Google Scholar] [CrossRef]
- IPCC. Climate Change 2014: Synthesis Report. Contribution of Working Groups I, II and III to the Fifth Assessment Report of the Intergovernmental Panel on Climate Change 2015; IPCC: Geneva, Switzerland, 2014. [Google Scholar]
- Red Eléctrica España. Emisiones de CO2 Asociadas a La Generación de Electricidad En España. 2021. Available online: https://www.google.com/url?sa=t&rct=j&q=&esrc=s&source=web&cd=&cad=rja&uact=8&ved=2ahUKEwiYt-mZ3JWEAxX7s1YBHdOODO8QmuEJegQIEhAB&url=https%3A%2F%2Fapi.esios.ree.es%2Fdocuments%2F580%2Fdownload%3Flocale%3Des&usg=AOvVaw0kdg5vUNfjZsCcdDiIe0CA&opi=89978449 (accessed on 1 January 2024).
- Cabildo de Gran Canaria. Plan Hidrológico de Gran Canaria; Cabildo de Gran Canaria: Las Palmas De Gran Canaria, Spain, 2019. [Google Scholar]
- Leon, F.; Ramos, A.; Vaswani, J.; Mendieta, C.; Brito, S. Climate Change Mitigation Strategy through Membranes Replacement and Determination Methodology of Carbon Footprint in Reverse Osmosis RO Desalination Plants for Islands and Isolated Territories. Water 2021, 13, 293. [Google Scholar] [CrossRef]
- Jaime Sadhwani, J.; Sagaseta de Ilurdoz, M. Primary Energy Consumption in Desalination: The Case of Gran Canaria. Desalination 2019, 452, 219–229. [Google Scholar] [CrossRef]
- Busch, M.; Mickols, W.E. Reducing Energy Consumption in Seawater Desalination. Desalination 2004, 165, 299–312. [Google Scholar] [CrossRef]
- Li, M. Reducing Specific Energy Consumption of Seawater Desalination: Staged RO or RO-PRO? Desalination 2017, 422, 124–133. [Google Scholar] [CrossRef]
- Kim, J.; Hong, S. Pilot Study of Emerging Low-Energy Seawater Reverse Osmosis Desalination Technologies for High-Salinity, High-Temperature, and High-Turbidity Seawater. Desalination 2023, 565, 116871. [Google Scholar] [CrossRef]
- Rehman, S.; Al-Hadhrami, L.M.; Alam, M.M. Pumped Hydro Energy Storage System: A Technological Review. Renew. Sustain. Energy Rev. 2015, 44, 586–598. [Google Scholar] [CrossRef]
- Zhou, D.; Chen, H.; Chen, S. Research on Hydraulic Characteristics in Diversion Pipelines under a Load Rejection Process of a PSH Station. Water 2019, 11, 44. [Google Scholar] [CrossRef]
- Zhang, W.; Cai, F.; Zhou, J.; Hua, Y. Experimental Investigation on Air-Water Interaction in a Hydropower Station Combining a Diversion Tunnel with a Tailrace Tunnel. Water 2017, 9, 274. [Google Scholar] [CrossRef]
Figure 1.
Response to peak demand 2021. Distinction between renewables and non-renewables [31].
Figure 1.
Response to peak demand 2021. Distinction between renewables and non-renewables [31].

Figure 2.
Peak demand response in 2021. Distinction between all renewable and non-renewable technologies [31].
Figure 2.
Peak demand response in 2021. Distinction between all renewable and non-renewable technologies [31].


Figure 3.
Ubication Chira-Soria PHEs.

Figure 4.
General diagram of the PHEs “Chira-Soria” pumped-storage hydroelectric power station (PHEs) hydraulic network.
Figure 4.
General diagram of the PHEs “Chira-Soria” pumped-storage hydroelectric power station (PHEs) hydraulic network.

Figure 5.
General plan of the Hydraulic Circuit, with the Chira reservoir on the right and the Soria reservoir on the left in this image (image oriented south instead of north).
Figure 5.
General plan of the Hydraulic Circuit, with the Chira reservoir on the right and the Soria reservoir on the left in this image (image oriented south instead of north).

Figure 6.
Location SWRO and city of Arguineguin.

Figure 7.
Instantaneous wind power production (MW) on 17 August 2021 [18].
Figure 7.
Instantaneous wind power production (MW) on 17 August 2021 [18].

Figure 8.
Instantaneous production (MW) from 16 to 22 August 2021 [18].
Figure 8.
Instantaneous production (MW) from 16 to 22 August 2021 [18].

Table 1.
Fuels used (t) and GHGs produced (tCO2eq) in Gran Canaria in 2021.
| Type Technology | Fuels | GHGs | ||||
|---|---|---|---|---|---|---|
| Fuel | Diesel | Diesel Oil | CO2 | CH4 | NOx | |
| (t) | (t) | (t) | (tCO2eq) | (tCO2eq) | (tCO2eq) | |
| Steam turbine | 160,119.0 | 129.0 | 0.0 | 524.382 | 427.0 | 1260.0 |
| Diesel engine | 37,852.0 | 1561.0 | 0.0 | 128.793 | 105.0 | 310.0 |
| Gas turbine | 0.0 | 21,781.0 | 0.0 | 68.710 | 58.0 | 172.0 |
| Combined cycle | 0.0 | 334,369.0 | 0.0 | 1.054,799 | 897.0 | 2648.0 |
| Total | 197,971.0 | 357,840.0 | 0.0 | 1,776,684.0 | 1487.0 | 4390.0 |
Note: Source: Canary Islands Energy Yearbook 2021 [18].
Table 2.
Turbine characteristics according to their operation.
| Type Operation | Ud | Stipulated Hours of Work | Power Unit Total | Flow Rate | Volume of Water Displaced | Energy/Day | |
|---|---|---|---|---|---|---|---|
| Ud | h | MW | MW | m3/s | m3 | MWh | |
| (T1) Turbinating | 6 | 16 | 33.33 | 200.00 | 68.40 | 3,939,840.00 | 3200.00 |
| (B1) Pumping | 6 | 8 | 36.67 | 220.00 | 53.40 | 1,537,920.00 | 1760.00 |
Note: Source: PHEs Project “Chira-Soria”.
Table 3.
Simulation of reservoir exploitation during the period 1972–2019.
| Scenario | Description | Annual Average Industrial Water Requirement in “Chira” (m3/Year) |
|---|---|---|
| Lousy | Associated with a 10% probability of occurrence during the concession period. | 1,574,872.91 |
| Medium | Associated with a 50% probability of occurrence during the concession period. | 1,104,571.81 |
| More likely | Associated with a 90% probability of occurrence during the concession period. | 615,389.27 |
Note: Source: PHEs Project “Chira-Soria”.
Table 4.
Water resource and impulsion.
| Concept | Value |
|---|---|
| Capacity | 1.80 hm3/year |
| Availability Factor | 0.95 |
| Reverse Osmosis Conversion | 45.0% |
| Total Production | 5200.00 m3/day |
| Reverse Osmosis Feed Flow | 11,644.50 m3/day |
Note: Source: Chira-Soria Hydroelectric Pumping Plant Project.
Table 5.
Equilibrium pump-turbine operation.
| Operating Mode | Operation | Power | Energy/Day | Flow Rate | Volume of Water Displaced | |
|---|---|---|---|---|---|---|
| h/Day | % | MW | MWh | m/s3 | m3 | |
| Equilibrium Turbinado | 10.522 | 43.84% | 200.0 | 2104.43 | 68.40 | 2,590,978.53 |
| Balance pumping | 13.478 | 56.16% | 220.0 | 2965.12 | 53.40 | 2,590,978.52 |
| Sum | 24.000 | 100.0% | ||||
Table 6.
Forecast growth of energy produced in renewables.
| Type Renewable | Chira-Soria Project Estimate | Situation Year 2021 | Situation Year 2023 | Situation with Final Registration |
|---|---|---|---|---|
| MWh Year | MWh Year | MWh Year | MWh Year | |
| Wind | 1,829,629.76 | 641,990.72 | 955,572.72 | 1,001,585.60 |
| Photovoltaic | 148,905.04 | 52,246.45 | 77,769.08 | 85,858.51 |
| Sum | 1,978,534.80 | 694,237.17 | 1,033,341.80 | 1,087,444.11 |
Table 7.
Estimated Installed Capacity (MW) including the PHEs “Chira-Soria”.
| Type Energy | Type Technology | Installed Power | |
|---|---|---|---|
| MW | % | ||
| Energies Derivatives from oil | Thermal power plants. Steam turbine | 280.00 | 18.94% |
| Thermal power plants. Diesel engine | 84.00 | 5.68% | |
| Thermal power plants. Gas turbine | 173.45 | 11.73% | |
| Thermal power plants. Combined cycle | 461.73 | 31.23% | |
| Cogeneration. Steam turbine | 24.20 | 1.64% | |
| Cogeneration. Diesel engine | 0.68 | 0.05% | |
| Cogeneration. Gas turbine | 0.00 | 0.00% | |
| Sum | 1024.06 | 69.72% | |
| Energies renewables | Wind | 205.24 | 13.88% |
| Photovoltaics | 49.15 | 3.32% | |
| Hydraulics | 200.00 | 13.53% | |
| Sum | 454.39 | 30.73% | |
| Total | 1478.45 | 100.00% | |
Table 8.
Increase in electricity demand and production with the incorporation of the PHEs “Chira-Soria”.
Table 8.
Increase in electricity demand and production with the incorporation of the PHEs “Chira-Soria”.
| Increase in Energy Demand with the Incorporation of the PHEs “Chira-Soria”. | |||||||
|---|---|---|---|---|---|---|---|
| Percentage Pumping performance (%) | 56.16% | 50.00% | 40.00% | 30.00% | 20.00% | 10.00% | 0.00% |
| Hours per day Pumping (h/day) | 13.48 | 12.00 | 9.60 | 7.20 | 4.80 | 2.40 | 0.00 |
| Increase Demand (MWh year) | 1,082,269.95 | 963,600.00 | 770,880.00 | 578,160.00 | 385,440.00 | 192,720.00 | 0.00 |
| Pre-existing demand (MWh year) | 3,350,094.00 | 3,350,094.00 | 3,350,094.00 | 3,350,094.00 | 3,350,094.00 | 3,350,094.00 | 3,350,094.00 |
| Sum (MWh year) | 4,432,363.95 | 4,313,694.00 | 4,120,974.00 | 3,928,254.00 | 3,735,534.00 | 3,542,814.00 | 3,350,094.00 |
| Increased energy production with the incorporation of the Chira-Soria Turbine. | |||||||
| Percentage Turbined Operation (%) | 43.84% | 39.04% | 31.23% | 23.42% | 15.61% | 7.81% | 0.00% |
| Hours per day Turbined (h/day) | 10.52 | 9.37 | 7.49 | 5.62 | 3.75 | 1.87 | 0.00 |
| Production increase (MWh year) | 768,118.23 | 683,894.74 | 547,115.79 | 410,336.84 | 273,557.90 | 136,778.95 | 0.00 |
| Pre-existing production (MWh year) | 3,350,094.00 | 3,350,094.00 | 3,350,094.00 | 3,350,094.00 | 3,350,094.00 | 3,350,094.00 | 3,350,094.00 |
| Sum (MWh year) | 4,118,212.23 | 4,033,988.74 | 3,897,209.79 | 3,760,430.84 | 3,623,651.90 | 3,486,872.95 | 3,350,094.00 |
| Demand-Production Difference (MWh year) | −314,151.72 | −279,705.26 | −223,764.21 | −167,823.16 | −111,882.10 | −55,941.05 | 0.00 |
Table 9.
Maximum Turbinating and Pumping capacity limited by maximum racking capacity.
| Operating Mode | Operation | Flow Rate | Volume of Water Displaced | |
|---|---|---|---|---|
| Hours | % | m/s3 | m3 | |
| Equilibrium Turbinado | 16 h 34 min | 43.84% | 68.40 | 4,080,000.00 |
| Balance pumping | 21 h 13 min | 56.16% | 53.40 | 4,080,000.00 |
| Sum | 100.00% | |||
Table 10.
Wind power increase to cover maximum pumping operation (MW).
| Pumping Operating Hours (h) | 13.48 h | 21.22 h | |
|---|---|---|---|
| 13 h 28 min | 21 h 13 min | ||
| Capacity Factor Wind | Operating Hours Equivalents/Day Wind | Power (MW) | Power (MW) |
| 25.00% | 6.00 | 494.19 | 778.19 |
| 29.17% | 7.00 | 423.49 | 667.02 |
| 33.33% | 8.00 | 370.64 | 583.65 |
| 35.71% | 8.57 | 345.99 | 544.84 |
| 36.76% | 8.82 | 336.11 | 529.27 |
| 37.50% | 9.00 | 329.46 | 518.80 |
| 41.67% | 10.00 | 296.51 | 466.92 |
| 45.83% | 11.00 | 269.56 | 424.47 |
Table 11.
Estimated Installed Capacity (MW).
| Type Energy | Type Technology | Installed Power | |
|---|---|---|---|
| MW | % | ||
| Energies Derivatives from oil | Thermal power plants. Steam turbine | 280.00 | 13.9% |
| Thermal power plants. Diesel engine | 84.00 | 4.2% | |
| Thermal power plants. Gas turbine | 173.45 | 8.6% | |
| Thermal power plants. Combined cycle | 461.73 | 23.0% | |
| Cogeneration. Steam turbine | 24.20 | 1.2% | |
| Cogeneration. Diesel engine | 0.68 | 0.0% | |
| Cogeneration. Gas turbine | 0.00 | 0.0% | |
| Sum | 1024.06 | 51.0% | |
| Energies Renewables | Wind | 734.51 | 36.6% |
| Photovoltaics | 49.15 | 2.4% | |
| Hydraulics | 200.00 | 10.0% | |
| Sum | 983.66 | 49.0% | |
| TOTAL | 2007.72 | 100.0% | |
Table 12.
Estimated increase in production and demand (MWh).
| Type Technology | Powers | Situation 2021 | Increase Production | Increase Demand | Proposal Demand—Equilibrium Production | |
|---|---|---|---|---|---|---|
| MW | MWh | MWh | MWh | MWh | % | |
| Current non-renewable generation | 1024.06 | 2,661,453.00 | 2,661,453.00 | 2,661,453.00 | 1,271,725.36 | 28.69% |
| Current photovoltaic renewable generation | 49.15 | 55,823.00 | 55,823.00 | 55,823.00 | 55,823.00 | 1.26% |
| Current wind renewable generation | 205.24 | 632,818.00 | 632,818.00 | 632,818.00 | 632,818.00 | 14.28% |
| Generation by new wind renewables | 529.27 | - | 1,703,878.91 | - | 1,703,878.91 | 38.44% |
| Hydro turbine generation | 200.00 | - | 768,118.23 | - | 768,118.23 | 17.33% |
| Demand Pumping | −220.00 | - | - | 1,082,269.50 | - | - |
| 3,350,094.00 | 5,822,091.14 | 4,432,363.50 | 4,432,363.50 | 100.00% | ||
Disclaimer/Publisher’s Note: The statements, opinions and data contained in all publications are solely those of the individual author(s) and contributor(s) and not of MDPI and/or the editor(s). MDPI and/or the editor(s) disclaim responsibility for any injury to people or property resulting from any ideas, methods, instructions or products referred to in the content. |
© 2024 by the authors. Licensee MDPI, Basel, Switzerland. This article is an open access article distributed under the terms and conditions of the Creative Commons Attribution (CC BY) license (https://creativecommons.org/licenses/by/4.0/).
Share and Cite
MDPI and ACS Style
Lozano Medina, J.C.; Mendieta Pino, C.A.; Ramos Martín, A.; León Zerpa, F. A Case Study of a Reverse Osmosis Based Pumped Energy Storage Plant in Canary Islands. Water 2024, 16, 515. https://doi.org/10.3390/w16040515
AMA Style
Lozano Medina JC, Mendieta Pino CA, Ramos Martín A, León Zerpa F. A Case Study of a Reverse Osmosis Based Pumped Energy Storage Plant in Canary Islands. Water. 2024; 16(4):515. https://doi.org/10.3390/w16040515
Chicago/Turabian StyleLozano Medina, Juan Carlos, Carlos Alberto Mendieta Pino, Alejandro Ramos Martín, and Federico León Zerpa. 2024. "A Case Study of a Reverse Osmosis Based Pumped Energy Storage Plant in Canary Islands" Water 16, no. 4: 515. https://doi.org/10.3390/w16040515
Note that from the first issue of 2016, this journal uses article numbers instead of page numbers. See further details here.