Article

Towards Optimisation of Microalgae Cultivation through Monitoring and Control in Membrane Photobioreactor Systems

by
Juan Francisco Mora-Sánchez
,
Josep Ribes
*,
Josué González-Camejo
,
Aurora Seco
and
María Victoria Ruano
CALAGUA—Unidad Mixta UV-UPV, Departament d’Enginyeria Química, Universitat de València, Avinguda de la Universitat s/n, 46100 Valencia, Spain
*
Author to whom correspondence should be addressed.
Water 2024, 16(1), 155; https://doi.org/10.3390/w16010155
Submission received: 6 December 2023 / Revised: 19 December 2023 / Accepted: 28 December 2023 / Published: 30 December 2023
(This article belongs to the Section Wastewater Treatment and Reuse)

Abstract

:
This research lays a foundation for optimised membrane photobioreactor performance and introduces novel control parameters crucial for advancing microalgae cultivation techniques and promoting environmental sustainability. Particularly, this study presents an innovative solids retention time (SRT) controller designed for a pilot-scale membrane photobioreactor. Employing a fuzzy-logic knowledge-based approach, this controller uses the first derivative of pH data dynamics (pH′) as an input variable, directly correlated with nitrogen recovery rate and biomass productivity when normalised by average light irradiance (I2). Through a feedback mechanism, it regulates daily SRT variations, ensuring stable reactor operation, optimal volatile suspended solids concentration, efficient nitrogen removal, and enhanced biomass productivity. Normalised nitrogen recovery rate, considering solar light irradiance and volatile suspended solids concentration, increased by 51% compared to previous studies employing fixed SRT and hydraulic retention time (HRT). Combining this SRT controller with a previously studied HRT controller could potentially amplify biomass productivity efficiency. In addition, controlling or not controlling the HRT and SRT are assessed in terms of filtration performance and GHG emissions. Finally, a new dissolved-oxygen-based parameter shows promise for continuous microalgae culture control.

1. Introduction

Microalgae cultivation has garnered significant attention across diverse applications, including wastewater treatment to augment water oxygenation and the production of valuable bioproducts like biofuels and biofertilisers [1]. Particularly, recent global initiatives to combat climate change and decarbonise industries have elevated microalgae biotechnology as a potential solution for substantial carbon sequestration, thereby aiding in mitigating global warming [2,3]. The integration of microalgae cultivation with wastewater remediation has emerged as a focus area within the scientific community, given the urgent need to decarbonise existing wastewater treatment facilities, especially with the proposed energy neutrality requirement for wastewater treatment plants exceeding 10,000 population equivalents by 2040 according to the new wastewater treatment directive, which is currently under revision [4]. Moreover, conventional wastewater treatment plants (WWTPs) entail the use of chemicals and/or the generation of harmful by-products [5]. Hence, water treatment using microalgae cultures is aligned with circular economy principles and enables the shift from current WWTPs, which mainly focus on removing pollutants, to water resource and recovery facilities (WRRFs) that aim to recover all valuable resources contained in wastewater, including reclaimed water and bio-products from microalgae biomass [6,7,8]. In addressing these objectives, several challenges must be considered within the context of wastewater treatment employing microalgae:
  • Efficiency of outdoor microalgae cultivation systems: limitations arise due to varying ambient conditions, external contamination, and underdeveloped control systems (see e.g., [9,10,11,12]).
  • Land requirements: current requirements for microalgae cultivation (up to 10 m2 per equivalent person) impede industrial scalability, demanding a reduction to approximately 1 m2 per equivalent person for viability [13].
Reducing surface area requirements entails minimizing the long hydraulic retention times (HRTs) typically needed for water treatment, i.e., 3–10 days [14,15,16]. One potential solution involves separating microalgae biomass from the treated water, allowing higher wastewater flow into the system to enhance nutrient loads, as they can be limiting in sewage treatment [17,18]. This separation enables decoupling HRT and SRT, which grants microalgae extended growth time within the microalgal photobioreactor (PBR). Hence, membrane photobioreactors (MPBRs) emerge as an advanced form of PBR system, combining microalgae cultivation systems (either open or closed) with membrane technology for separation [19,20,21,22]. While MPBR systems have demonstrated improved microalgae performance in demonstrative environments [23], they still lack competitiveness against conventional wastewater treatment technologies, particularly with closed PBRs [13,24,25,26]. Enhancing efficiency and competitiveness calls for proficient control and monitoring tools, which remain largely in developmental stages and are sparingly tested under demonstrative or real environments [27]. In this respect, Mora-Sanchez et al. [28] evaluated a fuzzy knowledge-based controller in a pilot-scale MPBR under variable HRT, which was modified hourly according to the predicted solar radiation received by the MPBR. Results showed 45% improvement in biologically removed nitrogen when this control was used compared to fixed HRT operation. However, this study maintained a constant solids retention time (SRT) at 2.25 days. Yet, maintaining a fixed SRT might not optimise microalgae activity, considering its direct relation to biomass productivity (BP), which varies under different environmental and wastewater conditions. In theory, optimum SRT is inversely proportional to growth rate (µ), i.e., equal to 2·µ–1 [29]. However, factors such as variable ambient conditions and wastewater characteristics and the presence of competing microorganisms can change the microalgae’s growth rate [30,31]. González-Camejo et al. [32] operated a pilot-scale MPBR unit under 3 d SRT for 30 days. During this period, due to the relatively high temperature in the MPBR, nitrifying bacteria proliferated and outcompeted microalgae in ammonium uptake. A punctual decrease in SRT from 3 to 2 d was applied for one day to reduce the shadow effect of the culture by partially washing out the culture biomass. After this punctual change in SRT, the MPBR system returned to preliminary conditions and the nitrification decreased significantly. This suggests that operating at variable SRT within an optimal range could enhance microalgae performance by potentially increasing light availability within the culture and outcompeting competitor microorganisms, thus potentially improving overall productivity. The influence of SRT/HRT on microalgae cultivation efficiency has been the subject of widespread examination in the academic discourse, addressing the need to control this essential operating parameter in continuous operation under outdoor conditions and dynamic wastewater characteristics [21,33,34,35]. But the relationship between SRT/HRT and microalgae performance is not always linear and their optimal ranges also depend on other parameters, such as those related to outdoor conditions and influent characteristics, which can be highly variable [36,37,38,39]. However, as far as the authors are concerned, there are no SRT control systems for microalgae cultivation that take this variability into account, as they usually focus on operating the systems at constant SRT/HRT, with little variations between annual seasons [40]. In contrast, several on-line monitoring parameters have been suggested for evaluating microalgae cultivation performance with regard to nitrogen recovery rate (NRR) or biomass productivity, such as pH, dissolved oxygen, and oxidation-reduction potential [41].
Therefore, this study aims to further optimise microalgae cultivation in a membrane photobioreactor by introducing a novel control strategy and promising control parameters and investigating the impact of managing a critical operating factor like SRT and HRT. Particularly, there is a proposal for an SRT control system with the objective of improving microalgae performance concerning both NRR and BP efficiency. The SRT controller was tested in an outdoor MPBR pilot plant, aimed at recovering nitrogen from nutrient-enriched wastewater. This research also explores a new parameter related to dissolved oxygen standardised at 25 °C (DO25), which can be continuously calculated and may be linked to monitoring the overall performance of the MPBR, suggesting its potential in future control strategies. In addition, the filtration performance and greenhouse gas (GHG) emissions of the MPBR pilot plant are evaluated for three operating conditions: with controlled SRT and fixed HRT, with controlled HRT and fixed SRT, and with fixed SRT and HRT.

2. Materials and Methods

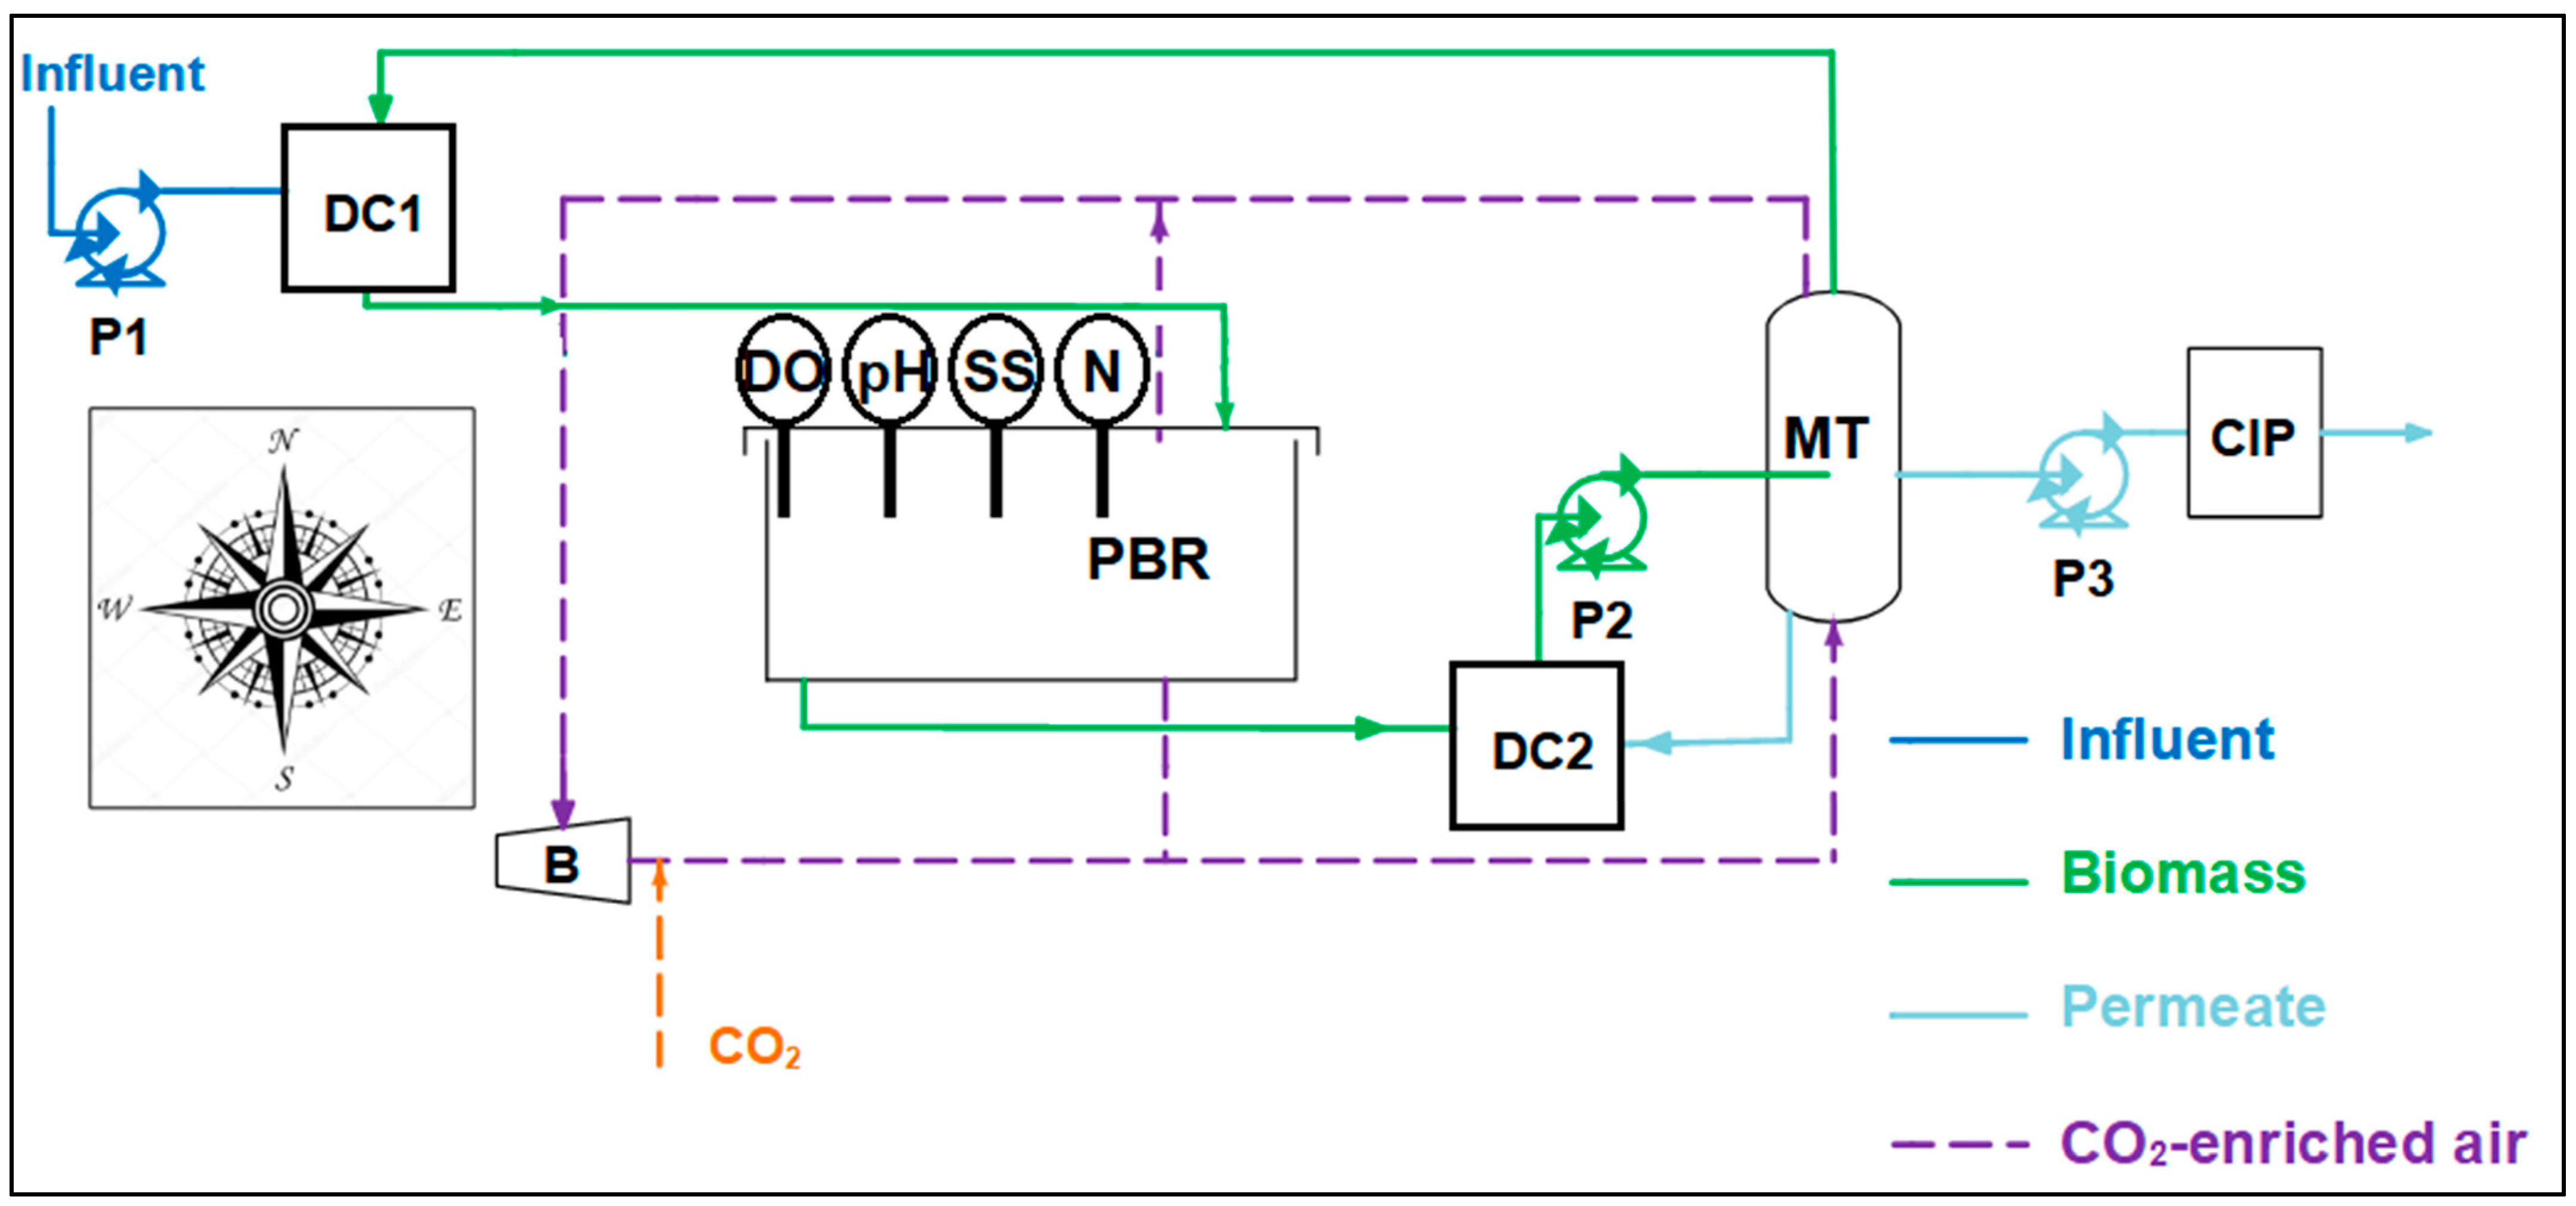
2.1. MPBR Pilot Plant

The MPBR pilot plant, as illustrated in Figure 1, was established as a secondary unit to recover nitrogen within a WRRF pilot plant that was evaluated in [42]. It was placed within the Conca del Carraixet wastewater treatment plant facilities in Valencia, Spain. The system included a planar closed photobioreactor (PBR) paired with a tank (MT), which was equipped with a hollow fibre ultrafiltration membrane. By employing this structure, the extraction of algal biomass from the water permeate was achieved efficiently, and the SRT was decoupled from the HRT. The photobioreactor remained hermetically sealed and continuously aerated at a rate of 0.20–0.25 volume changes per minute, and maintaining pH control involved adding 99.9% pressurised CO2 into the air-flow whenever the pH exceeded a 7.5 set point. Additionally, the system was equipped with twelve white LED lamps (Unique Led IP65 WS-TP4S-40W-ME) located on the shaded surface of the PBR, providing a consistent irradiance of 300 μmol·m–2·s–1 in addition to solar irradiance.

2.1.1. Instrumentation and Automation

The following on-line sensors were integrated into the membrane photobioreactor system: (i) a temperature and pH probe (pHD sc DPD1R1, Hach Lange); (ii) an oxygen content in liquid phase probe (LDO sc LXV416.99.20001, Hach Lange); (iii) an irradiance probe (Apogee Quantum SQ-200) that was mounted at the frontal surface of the PBR to determine photosynthetically active radiation (PAR); (iv) an ammonium and nitrate detection device (ANISE sc LXV440.99.00001, Hach Lange) to monitor the concentration of ammonium, nitrite, and nitrate, summed up as Total Soluble Nitrogen (TSN); (v) a suspended solids (SS) probe (SOLITAX ts-line sc LXV423.99.00100). Sensors (i), (ii), (iv), and (v) stayed within the PBR’s left section, situated at a depth of 30 cm under the upper surface. A schematic representation illustrating the system, comprising the positions of these sensors, is shown in Figure 1.
The maintenance and calibration of the sensors were conducted in accordance with the protocol outlined in [28]. To facilitate control and acquisition of data in the processes, probes were linked to a programmable logic controller (PLC, Siemens S7-315-DP PLC) connected to a personal computer running overseeing control and acquiring data software (SCADA, SIMATIC WinCC V7), which allowed the monitoring of process variables and the storage of the generated data. Additional sensors were set up for measuring variables such as liquid level, pressure, and flow-rate. Extended information of the plant automation can be found in [23].

2.1.2. Microalgae Substrate and Inoculum

The microalgae medium utilised in this investigation comprised pre-filtered (pore diameter of 0.03 microns) effluent from the Conca del Carraixet wastewater treatment plant, sourced from conventional aerobic-activated sludge secondary treatment after ultrafiltration and nutrient enrichment. This substrate aimed to replicate the feed stream from a previous study of the pilot-scale MPBR system supplied by an AnMBR pilot system situated within the same wastewater treatment plant [43]. Nutrients essential for microalgae growth, including bicarbonate, ammonium, and orthophosphate, were supplemented to reach concentrations mirroring those present in the treated discharge stream from this AnMBR pilot facility treating the same raw sewage [43]. The subsequent chemicals were introduced to the feed medium: 85 mg·L–1 of NaHCO3, 24 mg·L–1 of KH2PO4, and 210 mg·L–1 of NH4Cl. The common attributes of the nutrient-enriched feed medium (referred to as MPBR inflow) during the experimental span are outlined in Table 1.

2.1.3. Pilot Plant Operation

The microalgae culture utilised was initially derived from a prior study [28] and consisted of a combination of green microalgae, mainly Desmodesmus and Coelastrella. In order to promote the growth of microalgae over their competitors, allylthiourea was introduced to the culture to sustain a concentration ranging from 1 to 5 mg L−1 in the PBR to inhibit the activity of nitrifying organisms [44,45].
The experiment was conducted over a period of 35 days during the summer season. The unit was run with a constant HRT of 1.5 days amidst fluctuating environmental conditions (see Table 2).
The SRT was set on a daily basis by the controller utilising fuzzy logic suggested in this study (Section 2.2.2). To sustain this daily SRT and the constant HRT, an automated process was implemented to distribute the total culture volume to be wasted and permeated, respectively, on an hourly basis, considering only daylight hours.

2.2. Solids Retention Time Control

It is crucial to highlight that the SRT controller was integrated into the operational workflow of the MPBR pilot plant, overseeing its functions for a continuous period of 35 days. Hereinafter, all its characteristics will be defined.

2.2.1. Monitoring Variables and SRT Control Indicators

To regulate and evaluate the efficiency of the MPBR, information gathered by the probes detailed in Section 2.1.1 were utilised for control and monitoring purposes. Using this record, the following variables were established: (i) NRR was the rate of nitrogen recovery (mg N·L–1·d–1), computed as per Salgado et al. [46]; (ii) BP was the productivity of biomass (mg VSS·L–1·d–1), calculated following [46]; (iii) NLR was the nitrogen loading rate per volume of MPBR (mgN·m–3·d–1); (iv) pH′ represented the differential coefficient of pH data variations (pH unit·d–1), calculated according to González-Camejo et al. [41]; (v) I was the daily solar light irradiance (mol-photon), obtained by Equation (1) adapted from [43]; (vi) NRR:I:VSS was the ratio of NRR to I and VSS (mgN·mol-photon–1·gVSS–1); (vii) BP:I:NLR was the ratio of BP to I and NLR (gVSS·mol-photon–1·mgN–1); (viii) I2 was a dimensionless normalising factor associated with mean light irradiance (Iav, in μmol·m–2·s–1) calculated by Equation (2) based on [41]; (ix) pH′MA:I2 was the 4-day moving average of the pH′ normalised with I2; (x) ΔpH′MA:I2 represented the variation in pH′MA:I2 values calculated between the current day (n) and the previous day (n−1) by Equation (3); (xi) ∑SRT represented the cumulative changes observed in the SRT variable over the preceding 3 days calculated by Equation (4); (xii) NRRMA:I2 was the 4-day moving average of NRR normalised by I2; and (xiii) BPMA:I2 was the 4-day moving average of BP normalised by I2.
I = P A R · A P B R · 8.64 · 10 2
I 2 = I a v I a v + P A R t
p H M A : I 2 = p H M A : I 2 n p H M A : I 2 n 1
S R T = n 3 n 1 S R T
where PAR (μmol·m–2·s–1) was the daily mean solar photosynthetically active radiation received by PBR; APBR (m2) was the area of the PBR; PARt (μmol·m–2·s–1) was the total PAR that was collected by the photobioreactor, arising from both sunlight and LED lamps; and ΔSRT (d) reflects the daily applied variation in SRT.

2.2.2. SRT Controller

The primary goal of the SRT controller was to enhance the performance of the MPBR by maximising microalgae activity in terms of both BP and NRR. The input and output variables of this SRT controller will be defined next.
On each night of MPBR operation, a pH′ value was obtained, which was related to the microalgae photosynthetic activity, following the procedure outlined in [41]. The daily pH′:I2 ratio, combined with the values recorded on previous days, allowed the calculation of ΔpH′MA:I2, the first input variable to the SRT controller. This input variable provided information on operation pattern of the microalgae culture, i.e., the higher the ΔpH′MA:I2 values, the higher the metabolic activity of the algal biomass through photosynthesis.
Additionally, since the effect of a change in SRT cannot be predicted due to the complexity of the dynamics of an outdoor microalgae culture, the SRT controller incorporated a feedback variable, the parameter ∑SRT, as defined in Equation (4). This variable provided information on the average control actions over the SRT (i.e., an increase or decrease in the SRT).
The methodology employed in this study was taken from [28]. During the fuzzification phase, the input parameters ΔpH′MA:I2 and ∑SRT underwent transformation into linguistic variables using fuzzy sets. In this work, linguistic variables were represented using Gaussian-shaped membership functions, as defined by Equation (5).
μ ( p ) = e ( p c ) 2 2 · σ 2
In the context of this study, the input variable is represented by p, where c signifies the centre and σ denotes the amplitude of the Gaussian membership functions for the fuzzification of each input parameter. The input variable ΔpH′MA:I2 was categorised as “Large Positive”, LP, “Zero”, ZE, or “Large Negative”, LN, while the input variable ∑SRT was categorised as “Large Positive”, LP, “Small Positive”, SP, “Zero”, ZE, “Small Negative”, SN, or “Large Negative”, LN. The output parameter (ΔSRT) underwent defuzzification using five Gaussian membership functions corresponding to the categories “Large Positive”, LP, “Small Positive”, SP, “Zero”, ZE, “Small Negative”, SN, and “Large Negative”, LN.
In the inference engine phase, a group of 7 rules was utilised on the fuzzy set acquired during the fuzzification phase, as outlined in Table 3. The output linguistic parameters were deduced in this stage using the Max-Prod operator, adhering to the fuzzy inference methodology described by Larsen et al. [47], and applying the operator described in Equation (6) per every rule defined in Table 3:
μ r u l e , i = 1 j μ j
Similarly, to ensure a unique output linguistic value when more than one rule has an identical consequent, Equation (7) was implemented in the following manner:
μ k = M a x ( μ r u l e , i )
The subsequent defuzzification stage aimed to translate these linguistic variables into corresponding control actions. Following the methodology detailed by [48], this study utilised the Height Defuzzification technique, detailed in Equation (8), for acquiring a single resultant value (P):
P = i = 1 n c i · μ ( p i ) i = 1 n μ ( p i )
As a final step, the exit variable ΔSRT was applied, increasing the previous day’s SRT to determine the resulting SRT for the current day.
The range set for the manipulated final variable SRT was between 1.5 days (corresponding to the fixed HRT applied) and a maximum of 6 days, based on previous experimental data [43,49].

2.3. New Parameter Based on DO25

In a prior study [28], the 25 °C-standardised dissolved oxygen parameter (DO25) and its first derivative DO25′ were defined, exploring their potential correlation with NRR. An advantage of DO-based parameters lies in their continuous measurement, unlike the pH′ value, which is calculated once a day (measured under specific circumstances to separate the influence of the photosynthetic activity of algal biomass as the primary factor affecting pH). Considering the potential for future integrated control strategies encompassing both SRT and HRT, it was deemed valuable to introduce a new parameter analogous to pH′:I2, based on DO25.
As previously outlined in [28], the DO25 parameter commonly demonstrates a stable minimum during night-time. In this study, the DO25baseline was defined as the average of DO25 values recorded during the last hour of the preceding day. To quantify the daily variation in DO25, the ΔDO25 parameter, illustrating the deviation of DO25 at each time of the day concerning the DO25baseline, was calculated using Equation (9):
Δ D O 25 i = D O 25 i D O 25 b a s e l i n e
where i denotes an instantaneous calculation moment.
To calculate I2 continuously, as detailed in Section 2.2.1 and defined by González-Camejo et al. [41], it was essential to estimate a continuous optical density value at 680 nm (OD680). This estimation relied on the 3-year historical data from [49] in conjunction with the VSS values, and a linear correlation (R2 = 0.9495; p-value < 0.05; n = 530) was obtained as shown in Equation (10).
O D 680 = V S S ( m g · L 1 ) · 1.3930 · 10 3 5.1343 · 10 3
The use of Equation (10) in conjunction with the VSS values collected by the SOLITAX probe facilitated the continuous computation of the I2 parameter and, subsequently, the ΔDO25:I2 parameter. The aim was to explore possible associations between this new parameter and both BP:I2 and NRR:I2, which were also continuously computed using VSS and TSN values obtained by the SOLITAX and ANISE probes, respectively. For consistency, all parameters were defined using 60 min moving averages, and their first derivatives were computed over the same 60 min interval.
Additionally, daily average values for ΔDO25:I2 were computed for comparative analysis with respect to pH′:I2, NRR:I2, and BP:I2.

2.4. Sampling and Methods

Twice a week, duplicate samples were procured from both the inflow and outflow currents of the membrane photobioreactor pilot facility. Within the plant, continuous monitoring of ammonium (NH4+) and nitrite (NO2) plus nitrate (NO3) was conducted using the sensors detailed in Section 2.1.1. To ensure sensor accuracy, lab analysis of these nitrogen compounds was performed using a Smartchem 200 analyser (Westco Scientific Instruments, Westco), in accordance with methods 4500-NH3-G, 4500-NO2-B, and 4500-NO3-H as described in [50].
Furthermore, the assessment of VSS within the microalgae culture, derived from the collected samples, was carried out in accordance with [50], specifically using method 2540 E. These recorded values underwent correlation analysis with the suspended solids data collected through the SOLITAX probe, yielding a high correlation coefficient (R2) of 0.9889 and a statistically significant p-value below 0.05, based on a sample size (n) of 12.

2.5. Filtration Performance Assessment

The filtration performance of the membrane photobioreactor pilot facility was assessed for three operating conditions: fixed SRT and HRT, controlled HRT and fixed SRT, and controlled SRT and fixed HRT. Particularly, four operating periods are included, spanning a time horizon of 183 days, with the expected variations in environmental conditions, as the entire filtration experiment began in mid-winter and ended in mid-summer. In particular, period (i) and (iii) had fixed SRT and HRT conditions and period (ii) was where the SRT remained constant while employing a variable HRT via an HRT controller whose MPBR performance in terms of microalgae activity was reported in a previous study [28]. Period (iv) corresponds to the operating period used to validate the performance of the STR controller.
The membrane operation was established following the procedure outlined in [43] for the same membrane filtration module. This operation sequence comprised standard stages of filtration, relaxation, and backflush, complemented by the integration of two additional phases: degasification and ventilation. An essential filtration–relaxation cycle was used as a reference point for determining the frequency of the outstanding phases.
The operating parameters were established in the following manner: backflushing took place every ten cycles of the basic filtration–relaxation (F-R) sequence; ventilation was performed every twenty F-R cycles; and a dual-stage degasification–ventilation was executed each set of fifty F-R cycles. Filtration was sustained for a duration of 250 s. The time spans for the outstanding phases were as follows: relaxation (50 s), backflush (40 s), ventilation (60 s), and degasification (60 s).
To evaluate the efficiency of the filtration operation, the data recorded in real-time were considered, including transmembrane flux (J), transmembrane pressure (TMP), air flow for membrane scouring (Fair), and membrane tank temperature (T). Recognising the significant influence of mixed liquor viscosity on filtration performance, a temperature correction factor (fT) calculated by (11) was incorporated into the transmembrane flux equation, which was used to calculate 20 °C-standardised transmembrane flux (J20) trough (12). The specific air demand per volume of permeate produced (SGDp) was calculated by (13). Moreover, the advancement and effectiveness of the filtration operation were assessed by means of the fouling rate (FR), calculated trough (14):
f T = e 0.0239 · ( T 20 )
J 20 L M H = J · f T
S G D p ( N m a i r 3 · m p e r m e a t e 3 ) = F a i r J 20 · A m e m b r a n e
F R m b a r · m i n 1 = δ T M P δ t T M P t = T M P j n f T M P j n i t j n f t j n i
where Amembrane was the filtration area of the membrane (3.4 m2).
Table 4 presents the operating conditions during the 4 experimental filtration periods, including SRT, HRT, volatile suspended solids in the membrane tank (VSSMT), and temperature. Following the established ranges tested in prior studies [43,49], SGDp was set at 18.5 Nm3air·m–3permeate, while J was set at 23 LMH.

2.6. Energy and GHG Emissions Estimation

The estimation of GHG emissions associated with the MPBR unit for the three operating conditions—with controlled SRT and fixed HRT (this study), controlled HRT and fixed SRT [28], and fixed SRT and HTR [43]—was conducted using the methodology outlined in [51]. In addition, a subsequent harvesting unit by cross-flow ultrafiltration and an anaerobic digestion unit considering only the harvested microalgae, similar to the WRRF pilot plant where the MPBR was included [42], were also considered to take into account the valorisation of the harvested microalgae biomass in the form of biogas. The methodology involved the assessment of total GHG emissions (GHGtotal), comprising both direct (GHGdirect) and indirect emissions (GHGindirect).
For the MPBR unit, GHGtotal was correlated with electrical energy consumption and the CO2 uptake by microalgae biomass according to [42,43]. Concerning the cross-flow ultrafiltration harvesting unit, GHGtotal was correlated with electrical energy consumption and the potential increase in methane yield for the subsequent digestion unit, due to the additional pre-treatment of microalgae induced by the cross-flow ultrafiltration, as observed under mesophilic conditions [52].
The final anaerobic digestion unit was defined to operate under mesophilic conditions as outlined in [52], and its thermal and electrical energy consumption, along with biogas production, were considered in the calculation of GHGtotal.
The generation of biogas resulting from the anaerobic digestion of harvested algal biomass was computed using experimental data extracted from prior studies [53,54]. Furthermore, the augmentation in methane output attributed to the influence of cross-flow ultrafiltration on the harvested microalgae (i.e., higher anaerobic biodegradability), according to [53], was also considered. In particular, this effect was included by considering the increase in biogas production based on the concentration ratio of the harvested microalgae. The methane yield was directly related to the concentration ratio for values below 13.3. However, for values above 13.3, the methane yield remained stable at 0.319 Nm–3·kgVSS–1.
Regarding biogas valorisation, three distinct scenarios were defined: (i) Scenario 1: high-efficiency cogeneration via a CHP system; (ii) Scenario 2: membrane-based upgrading to biomethane plus injection into the grid; and (iii) Scenario 3: microalgae-based upgrading to biomethane plus injection into the grid, with additional algal biomass production at the biogas upgrading unit resulting in an increased methane production during the anaerobic digestion (AD) phase.
The ratios, efficiencies, and emission factors employed in this study align with those referenced in [51,55,56,57,58]. The calculation of carbon uptake and fixation by microalgae (CO2BF), set at 1919 kgCO2e·tVSS−1, was derived considering the stoichiometric CO2 captured for microalgae growth. This calculation was based on the microalgae biomass chemical formula C106H181O45N16P, as specified by [59].
The net energy demand per tonne of produced microalgae biomass, represented by E (kWh·tVSS–1), was determined using (15), requiring to estimate the total thermal energy demand, denoted as Qdemand (kWh·tVSS–1), by means of (16); the balance of the total electrical energy demand, Wdemand (kWh·tVSS–1), defined in (17); and the biomethane production, QBM (kWh·tVSS–1), in Scenarios 2 and 3, calculated using (18). Note that positive values denote net energy consumption, while negative values signify net energy recovery.
E k W h · t V S S 1 = Q d e m a n d + W d e m a n d + Q B M
Q d e m a n d   k W h · t V S S 1 = Q T O T Q r e c o v e r e d
W d e m a n d   k W h · t V S S 1 = W T O T W r e c o v e r e d
Q B M ( k W h · t V S S 1 ) = Q B G · φ u p g r a d i n g k W h · t V S S 1
where QTOT was the heat demanded by the anaerobic digestion process per tonne of produced microalgae biomass (kWh·tVSS–1); Qrecovered was the heat recovered (kWh·tVSS–1); WTOT was the electrical consumption of the equipment of the MPBR unit, the cross-flow ultrafiltration pilot plant, the anaerobic digester, and the valorisation system of each scenario per tonne of produced microalgae biomass (kWh·tVSS–1); Wrecovered was the electricity recovered (kWh·tVSS–1); QBG was the gross production of raw biogas per tonne of produced microalgae biomass (kWh·tVSS–1); and φupgrading is the efficiency of the upgrading process.
Direct greenhouse gases emissions, indirect greenhouse gases emissions, and total greenhouse gases emissions per tonne of produced microalgae biomass were calculated using (19) to (22):
G H G d i r e c t , s c 1 k g C O 2 e · t V S S 1 = M B G · E F C H 4 , s c , i · 28
G H G d i r e c t , s c 2 & 3 k g C O 2 e · t V S S 1 = M B M · E F C H 4 , s c , i · 28
G H G i n d i r e c t k g C O 2 e · t V S S 1 = ( Q B M + Q d e m a n d ) · E F n a t u r a l g a s + W d e m a n d · E F e l e c t r i c i t y
G H G t o t a l k g C O 2 e · t V S S 1 = G H G d i r e c t + G H G i n d i r e c t C O 2 B F
where MBG was the calculated gross production of raw biogas (kgCH4·tVSS–1); EFCH4,i indicated the methane losses emission factor; MBM was the biomethane production (kgCH4·tVSS–1); Qdemand was the total thermal energy demand per tonne of produced microalgae biomass (kWh·tVSS–1); Wdemand was the total electrical energy demand per tonne of produced microalgae biomass (kWh·tVSS–1); EFnatural_gas was the particular emission coefficient for fossil natural gas from the grid; and EFelectricity represented the particular emission coefficient applied for European power corporations.

3. Results and Discussion

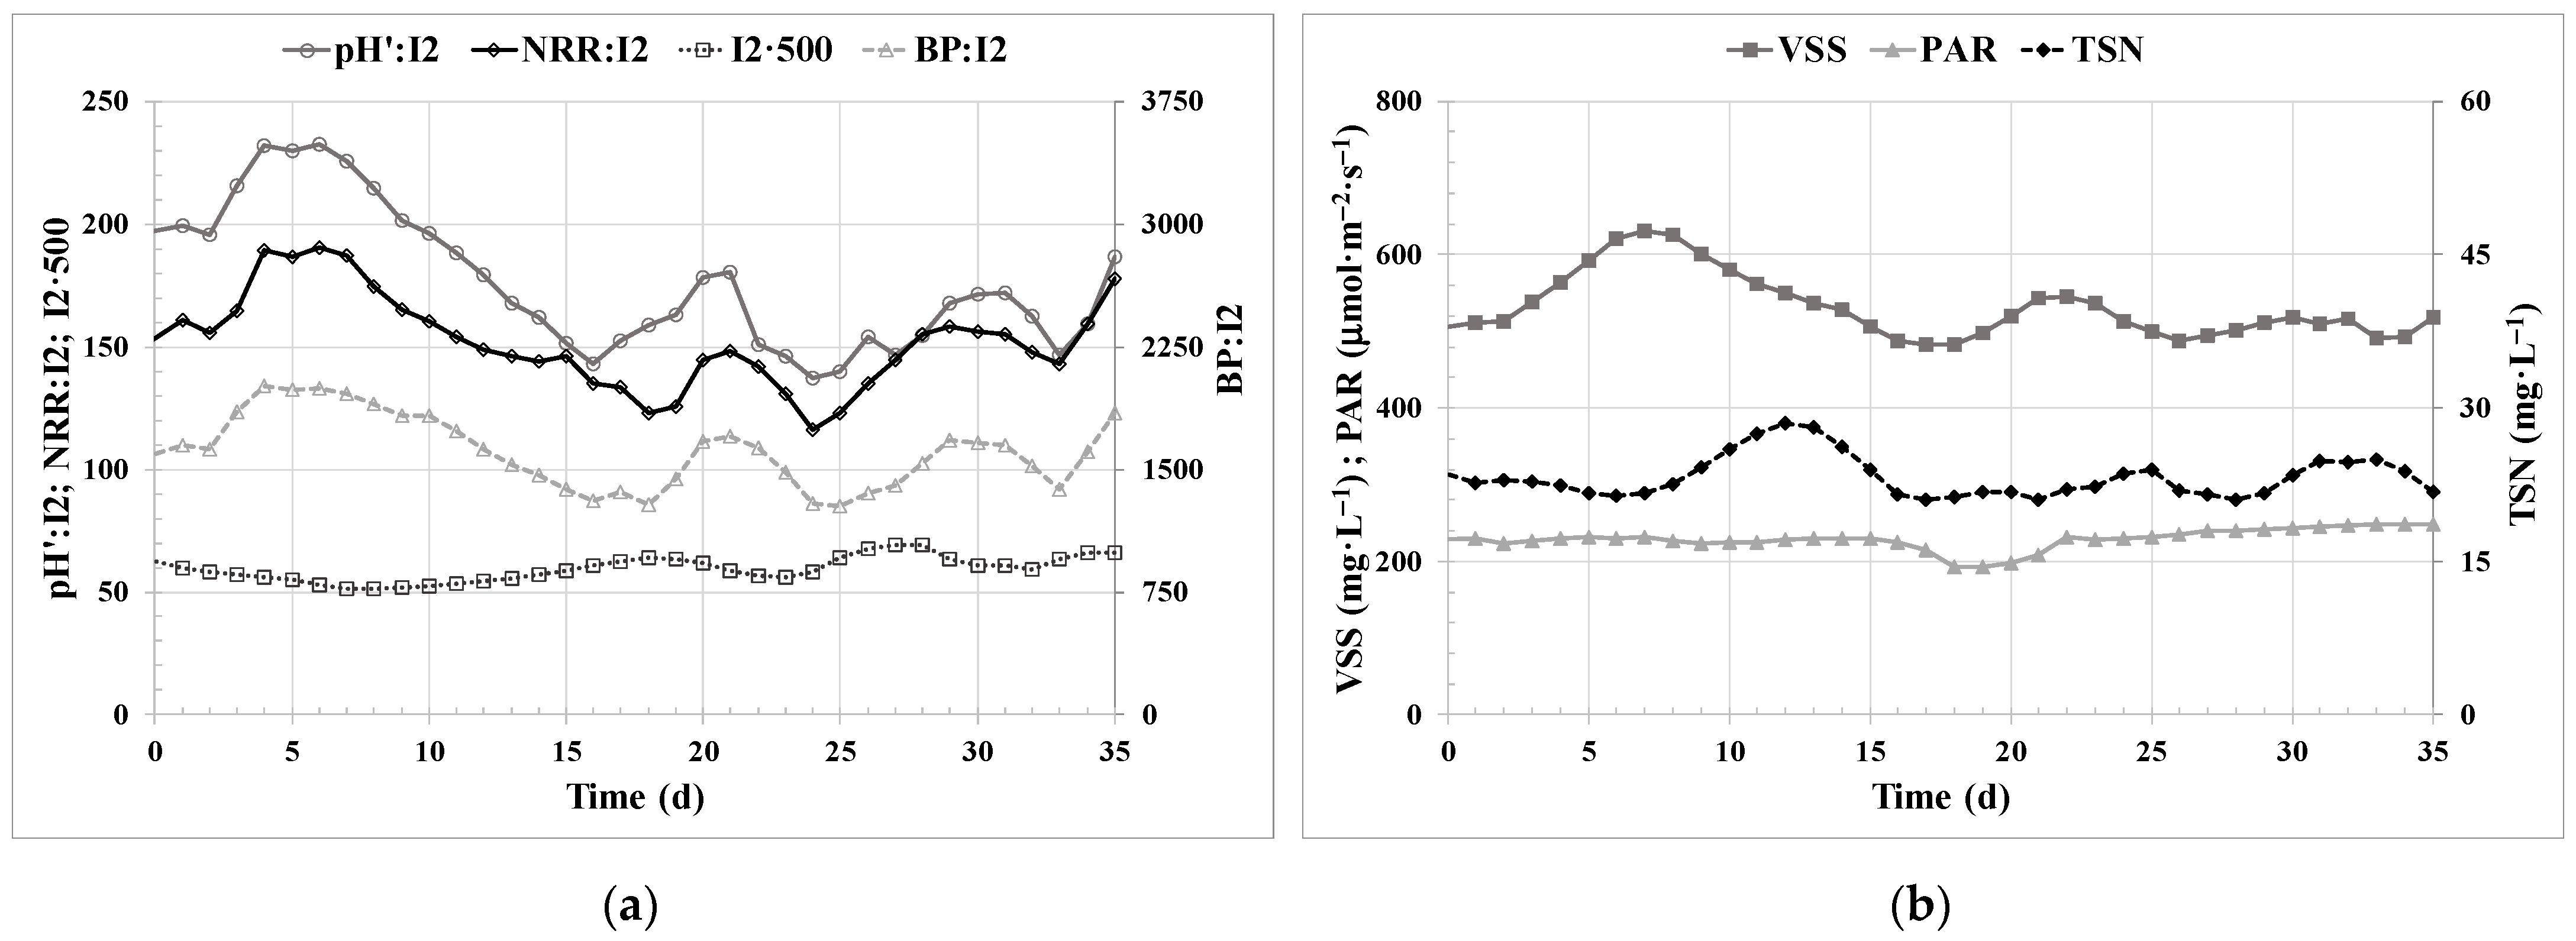
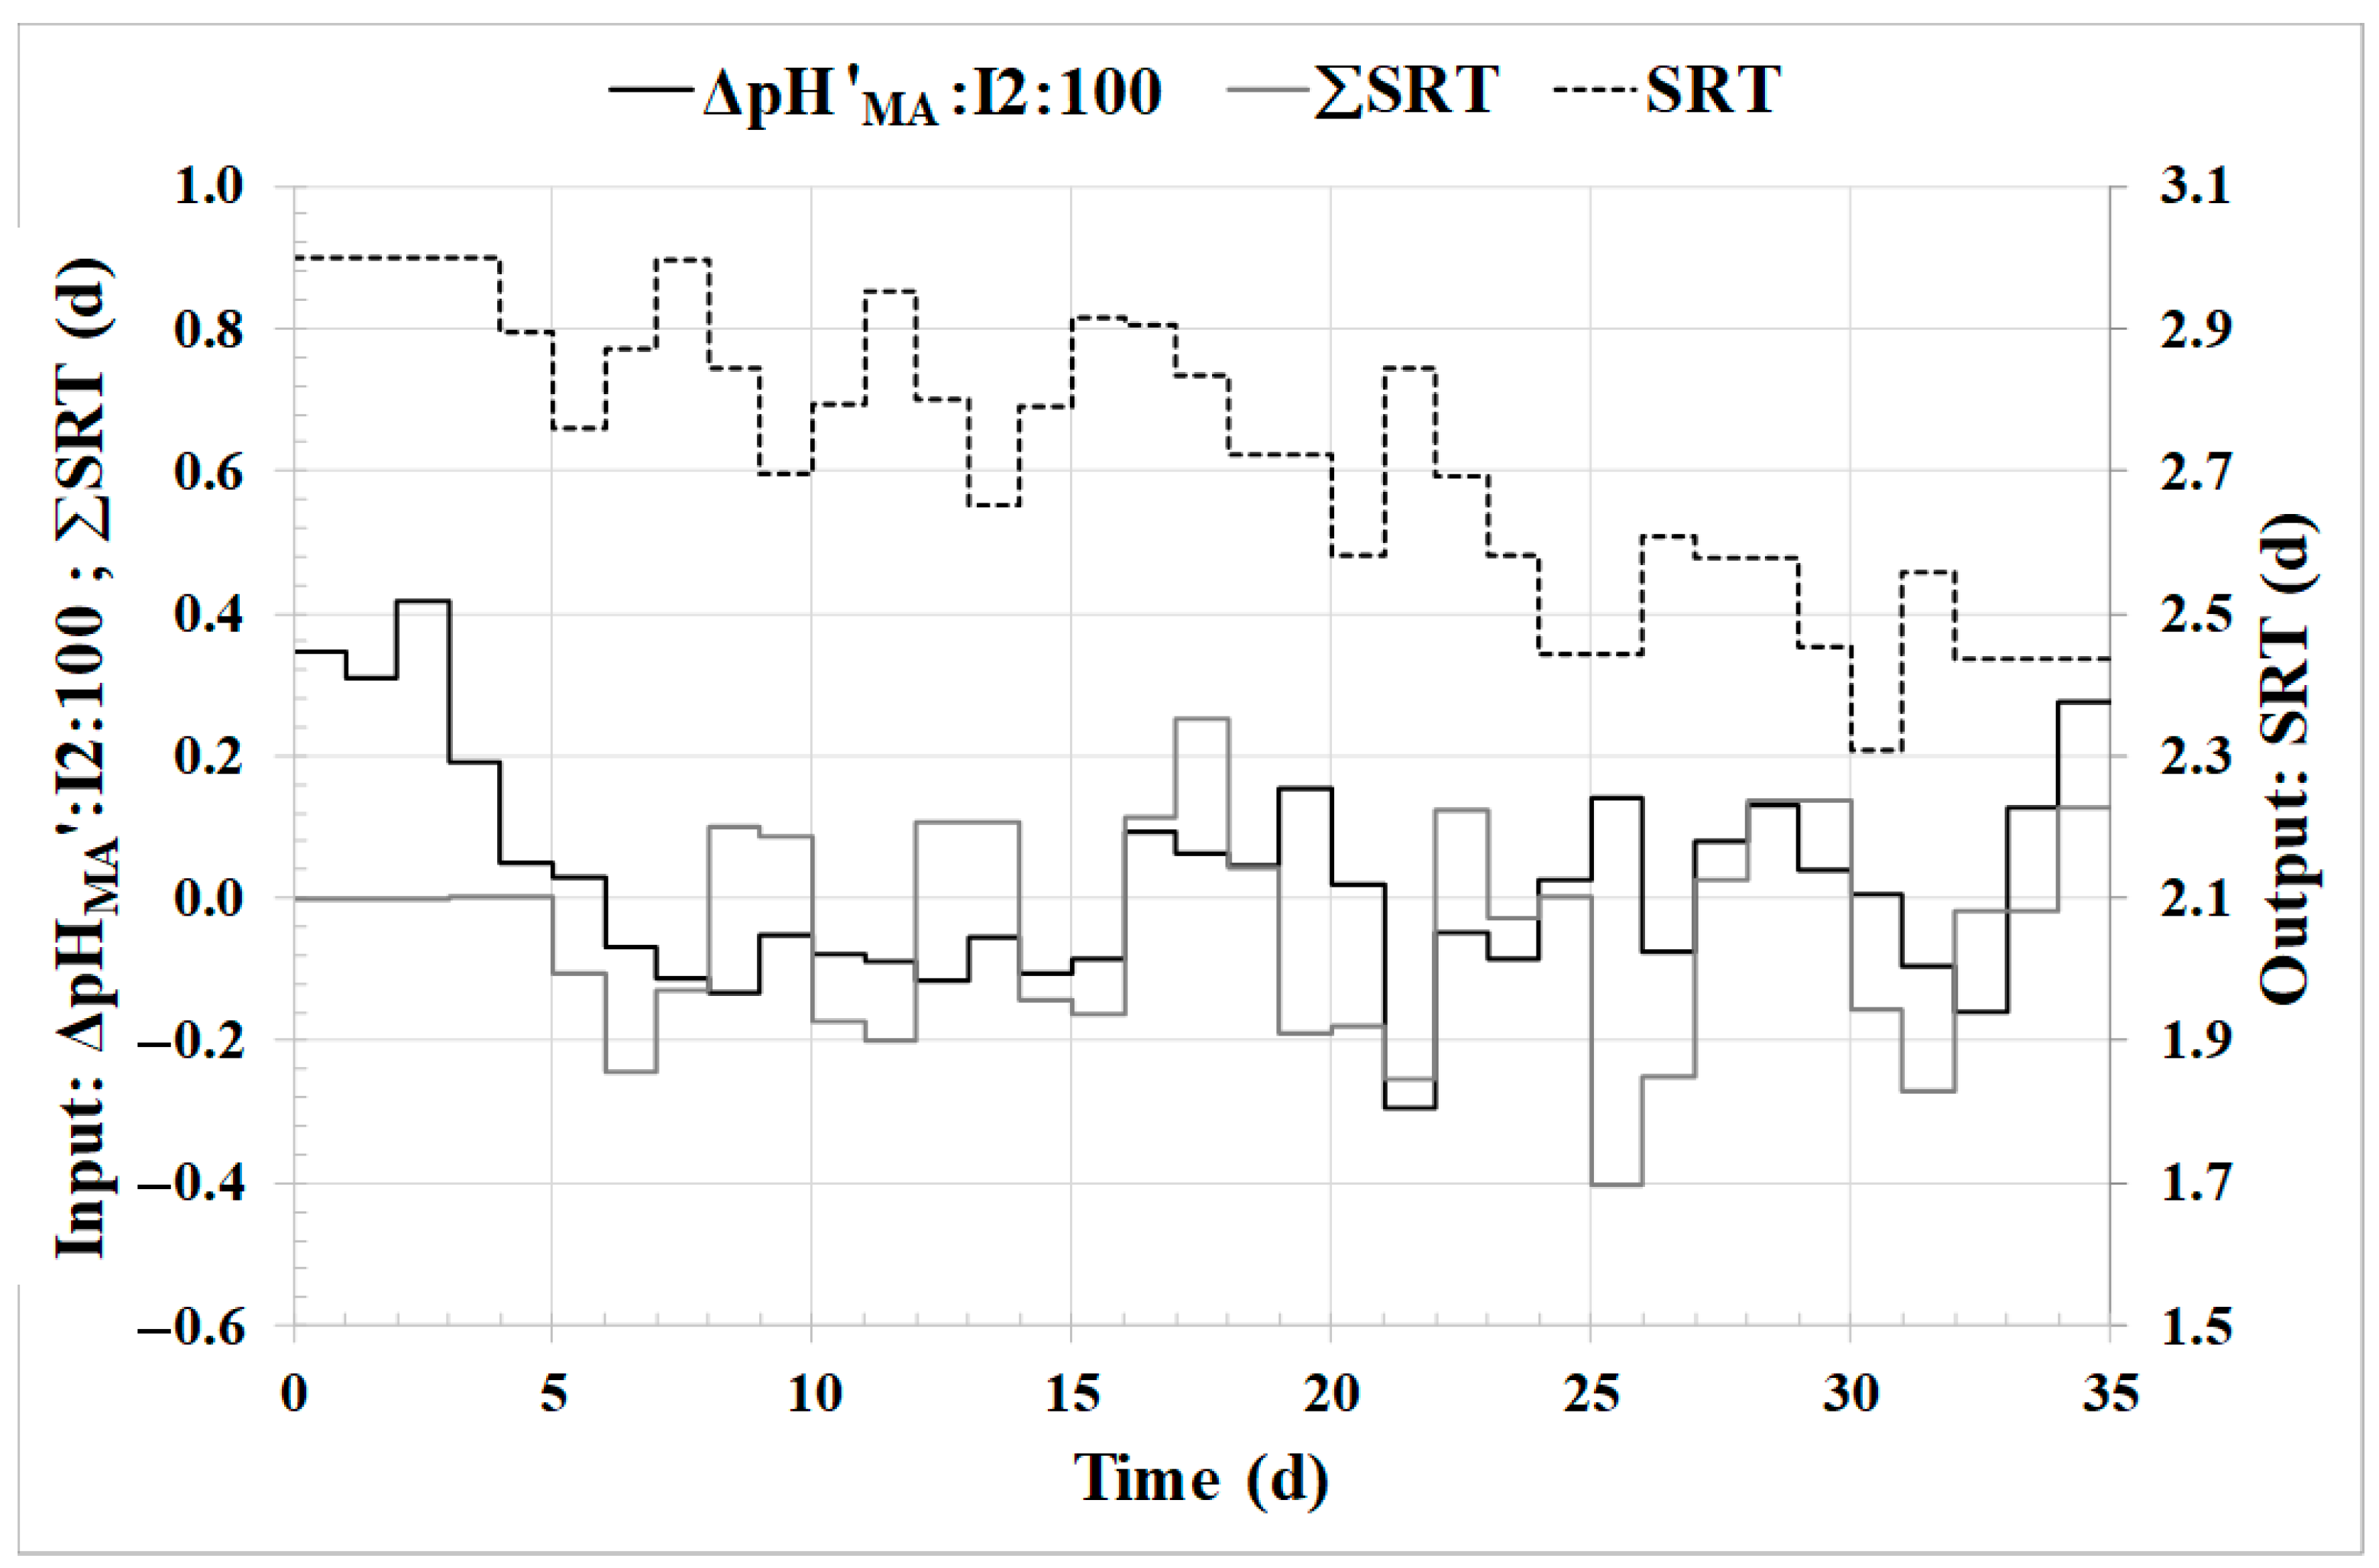
3.1. SRT Controller Performance

Table 5 shows the daily averages of the most important parameters related to the performance of the MPBR during operation of the proposed SRT controller. An average SRT value of 2.59 days was obtained, with a working range of 2.3 to 3 days. These values align with the optimal working ranges observed in previous studies [43]. It is worth noting that the obtained NRR and BP parameters show stable and high levels, despite the relatively low concentrations of VSS in the PBR.
Figure 2a demonstrates the consistent trend between the parameter pH′:I2 and the indicators BP:I2 (R2 = 0.8249; p-value < 0.05; n = 35) and NRR:I2 (R2 = 0.7500; p-value < 0.05; n = 35), although their proportional relationship may vary. This trend supports the previous findings by [41], suggesting that microalgae activity significantly influences carbon concentration variations, thereby impacting pH dynamics in the MPBR unit. Therefore, pH′ theoretically correlates directly with microalgae photosynthetic activity. Moreover, González-Camejo et al. [41] proposed that normalising parameters using the I2 index can provide more reliable evaluations of microalgae cultivation systems than non-normalised values. Their study indicated a direct relationship over extended operational periods between online measurements of pH′:I2 and microalgae performance indicators BP:I2 and NRR:I2. As a result, the trend of the pH′:I2 parameter, defined in Equation (2) as ΔpH′MA:I2, was considered an ideal parameter for the SRT controller to assess the average photosynthetic activity of the microalgae culture in the short term. Its definition as an input variable was validated by the obtained results, confirming its utility in monitoring and controlling the system. Regarding the I2 parameter, presented as I2·500, its correlation with average light irradiance (Iav) [43] is influenced by various culture characteristics such as biomass and pigment concentrations and the presence of bacteria and inert particles [43,60]. Therefore, the slight variations observed in the I2 parameter could be associated with the variability of VSS and OD680.
Figure 2b reveals the remarkable stability of the solar PAR parameter, likely attributed to the predominant operation in July, which is characterised in Valencia (Spain) as a month with exceptional stability and minimal cloud cover. As shown in this figure, the SRT controller was able to keep the VSS and TSN parameters within acceptable ranges despite oscillations. In the case of operation under high cloud cover, the primary limiting factor would be the light (PAR), and thus, what would really influence the performance would be the HRT [28]. The VSS concentration stands out for not being too high, stabilising slightly above 500 mg·L–1, but presenting a high BP, close to 200 gVSS·m–3·d–1. Conversely, the TSN concentration remained stable although relatively elevated, indicating the use of a low HRT. The combined use of the HRT controller, as detailed in [28], could potentially help to reduce these TSN levels.
Figure 3 illustrates the performance of the SRT controller, showing the trends of the input and output variables, ΔpH′DA:I2 and ΣSRT, and the commanded SRT. For instance, on day 22, the concurrent presence of a “Large Negative” categorisation in both input variables (ΔpH′MA:I2 and ∑SRT) led to the dominance of inference rule 7, which resulted in a “Large Positive” categorised output for ΔSRT. Similarly, on days 34 and 35, high values in the ΔpH′MA:I2 trend led to the dominance of inference rule 5, giving a ΔSRT value very close to zero (ZE).
To assess the effectiveness of the SRT controller in maintaining stability and maximising photosynthetic activity, a comparative analysis was conducted, which includes some of the operating periods shown in Table 4. In particular, period (ii) controlled HRT and fixed SRT [28], and period (iv) controlled SRT and fixed SRT, i.e., the data related to the operation period of the SRT controller, and also a period of fixed SRT and HRT reported in a previous study [43]. The comparative results are outlined in Table 6.
The normalisation of the NRR parameter by solar light irradiance (I) and VSS concentration aimed to optimise radiation utilisation per microalgae biomass unit for nitrogen recovery. Comparatively, the current study with variable SRT proved to be 29% more efficient than the study with an HRT controller and fixed SRT and 51% more efficient than the study with fixed SRT and HRT in terms of radiation utilisation for nitrogen recovery.
Regarding the BP parameter, it was normalised by the solar light irradiance (I) and the nitrogen load (NLR) of the system, as the pilot plant was operated as a secondary nitrogen recovery system. The goal was to optimise microalgae biomass productivity while maximising light utilisation and minimising, but not limiting, the nitrogen substrate added to the system. In these terms, the highest efficiency was found in the study with variable HRT using the HRT controller, as expected since the purpose of that controller was to adjust the nitrogen feed based on the microalgae recovery capacity. Comparatively, the HRT controller showed a 2.7% higher performance than the SRT controller and a 10.5% higher performance than the fixed SRT and HRT study.

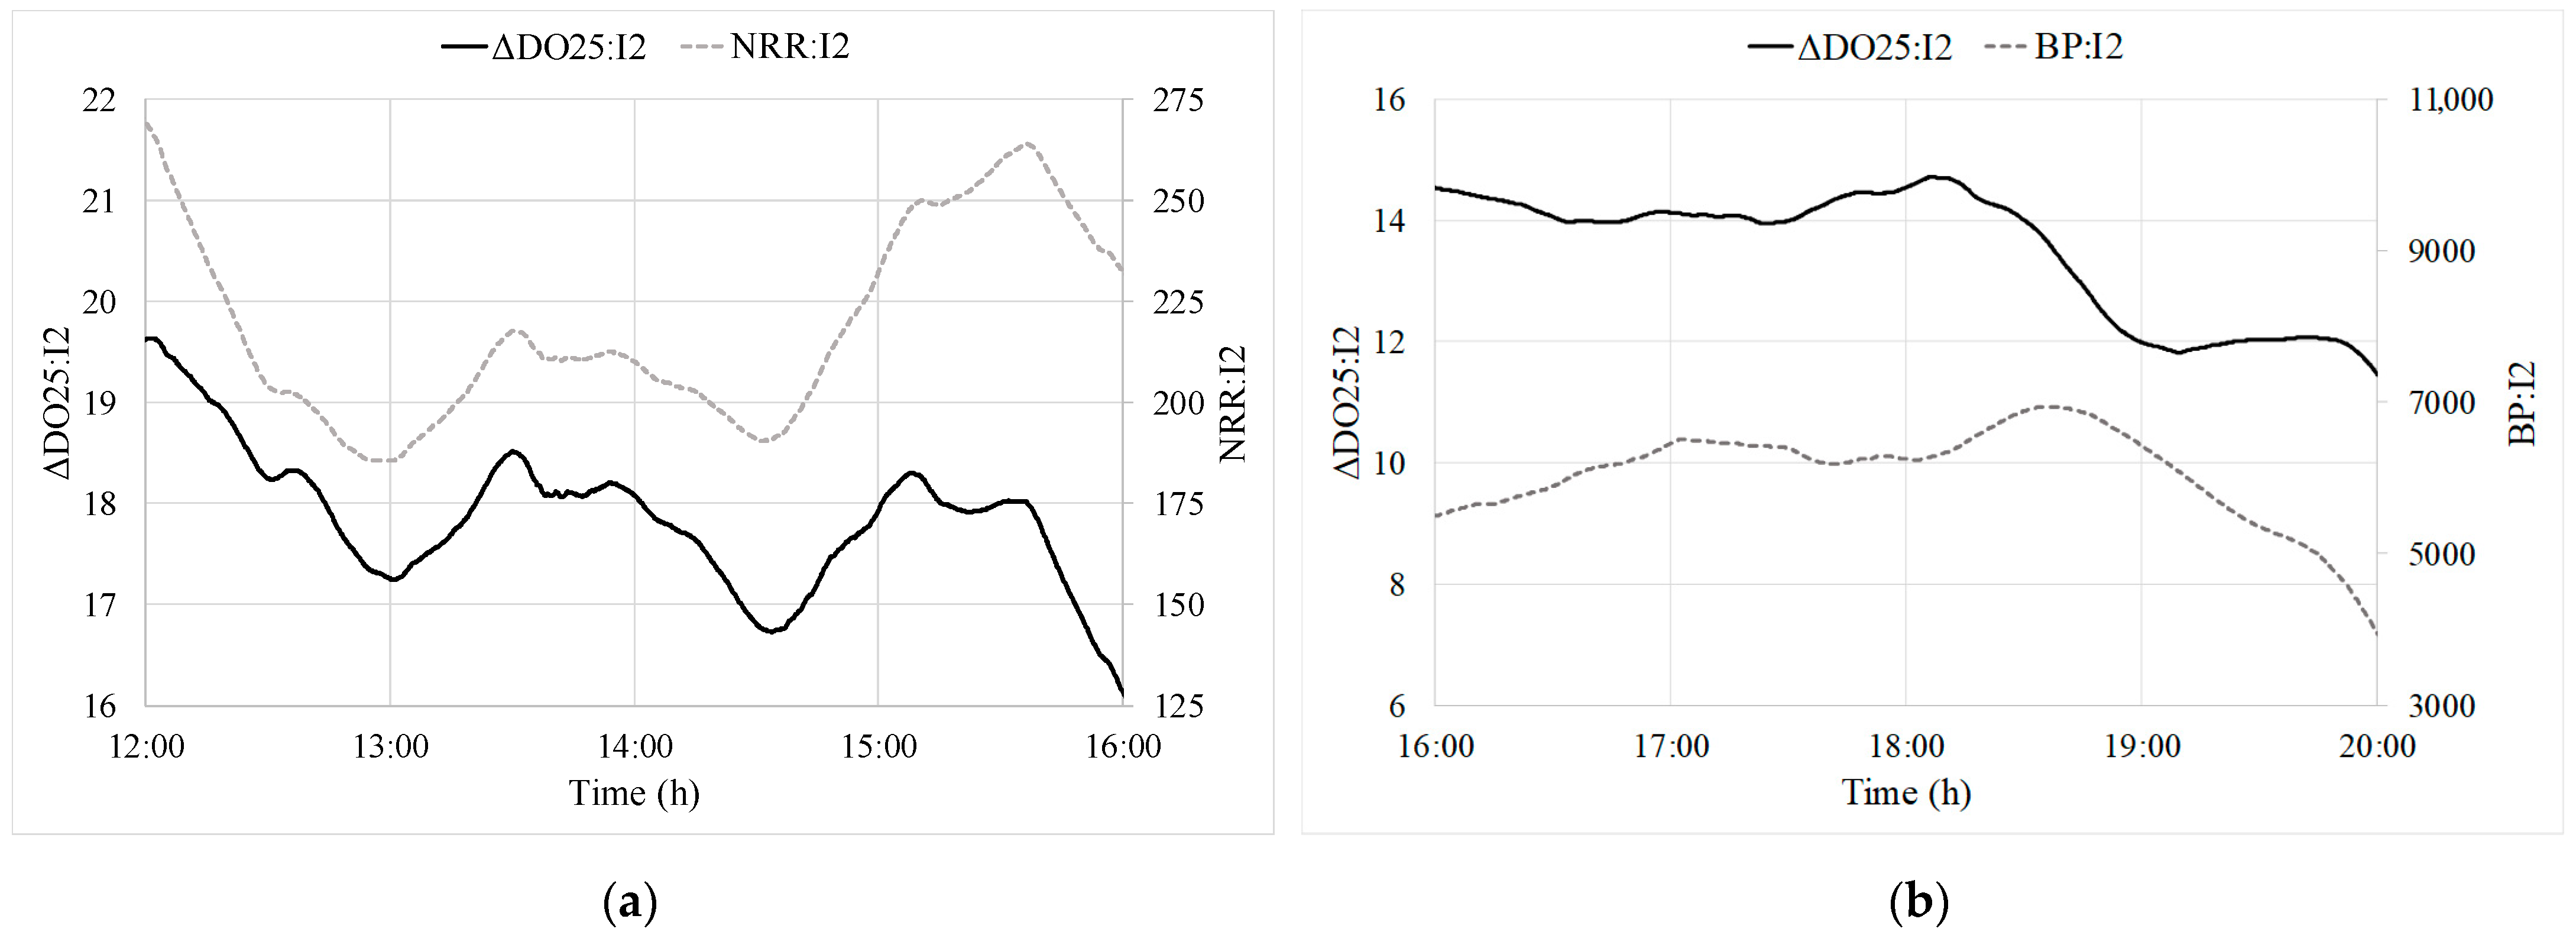
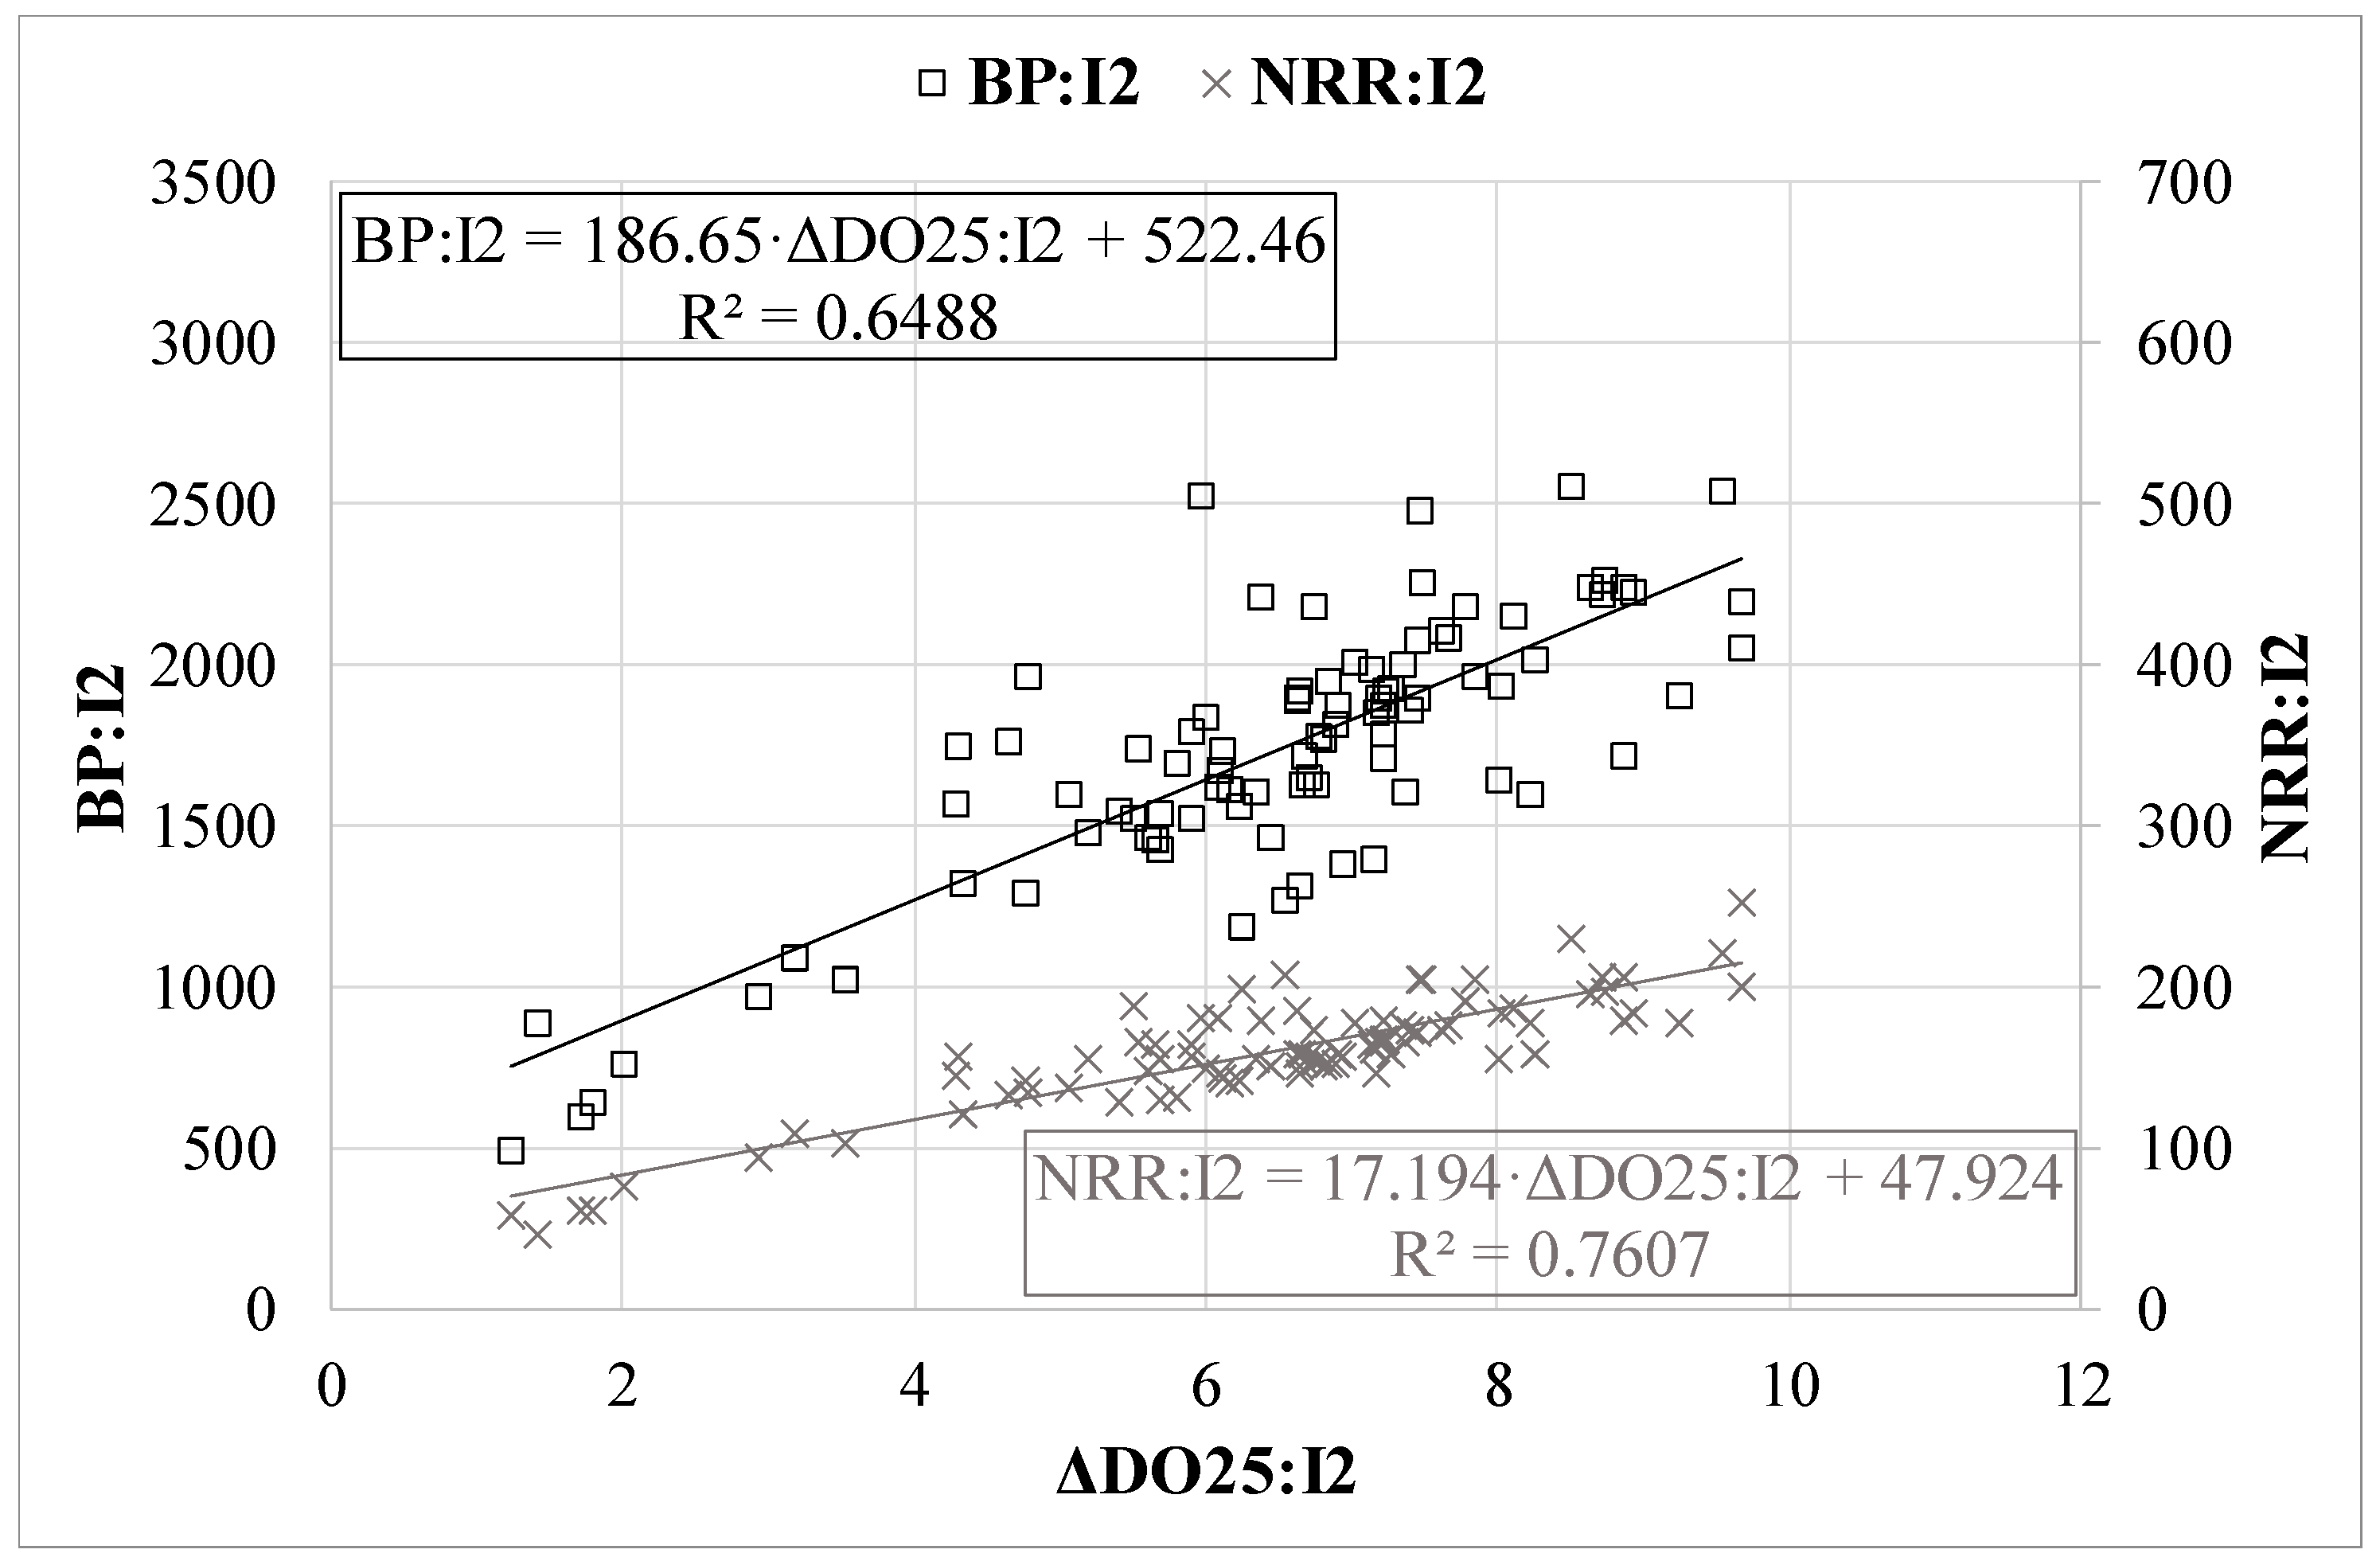
3.2. Evaluation of MPBR Performance through 25 °C-Standardised DO-Based Parameter

As described in Section 2.3, the new parameter ΔDO25 measures the deviation of 25 °C-standardised dissolved oxygen (DO25) during the day from the established overnight minimum, defined as DO25baseline. After standardising ΔDO25 with the I2 factor, correlated trends were observed with NRR:I2 (R2 = 0.7118; p-value < 0.05; n = 5863) and BP:I2 (R2 = 0.5419; p-value < 0.05; n = 5863). Figure 4 illustrates a direct trend between ΔDO25:I2 and NRR:I2, while a slight delay of approximately 20 min is apparent in the correlation between ΔDO25:I2 and BP:I2.
In contrast, Figure 5 shows the resulting linear correlations between the daily means of these parameters (ΔDO25:I2 with NRR:I2 and ΔDO25:I2 with BP:I2). As this figure shows, the calculated daily averages of these parameters revealed enhanced correlation coefficients compared to the real-time recordings, particularly noticeable for BP:I2. Comparing the R2 value obtained for BP:I2 with pH′:I2 (see Section 3.1), the R2 value for ΔDO25:I2 was found to be lower, indicating a less pronounced correlation. However, NRR:I2 shows a slightly stronger R2 correlation with ΔDO25:I2 than with pH′:I2. Considering the reasonable correlations of this new parameter, based on DO25 and standardised by I2, with both NRR and BP, which is evident in both continuous and averaged data, it represents a promising control variable for future strategies to control and optimise the performance of microalgae cultivation.

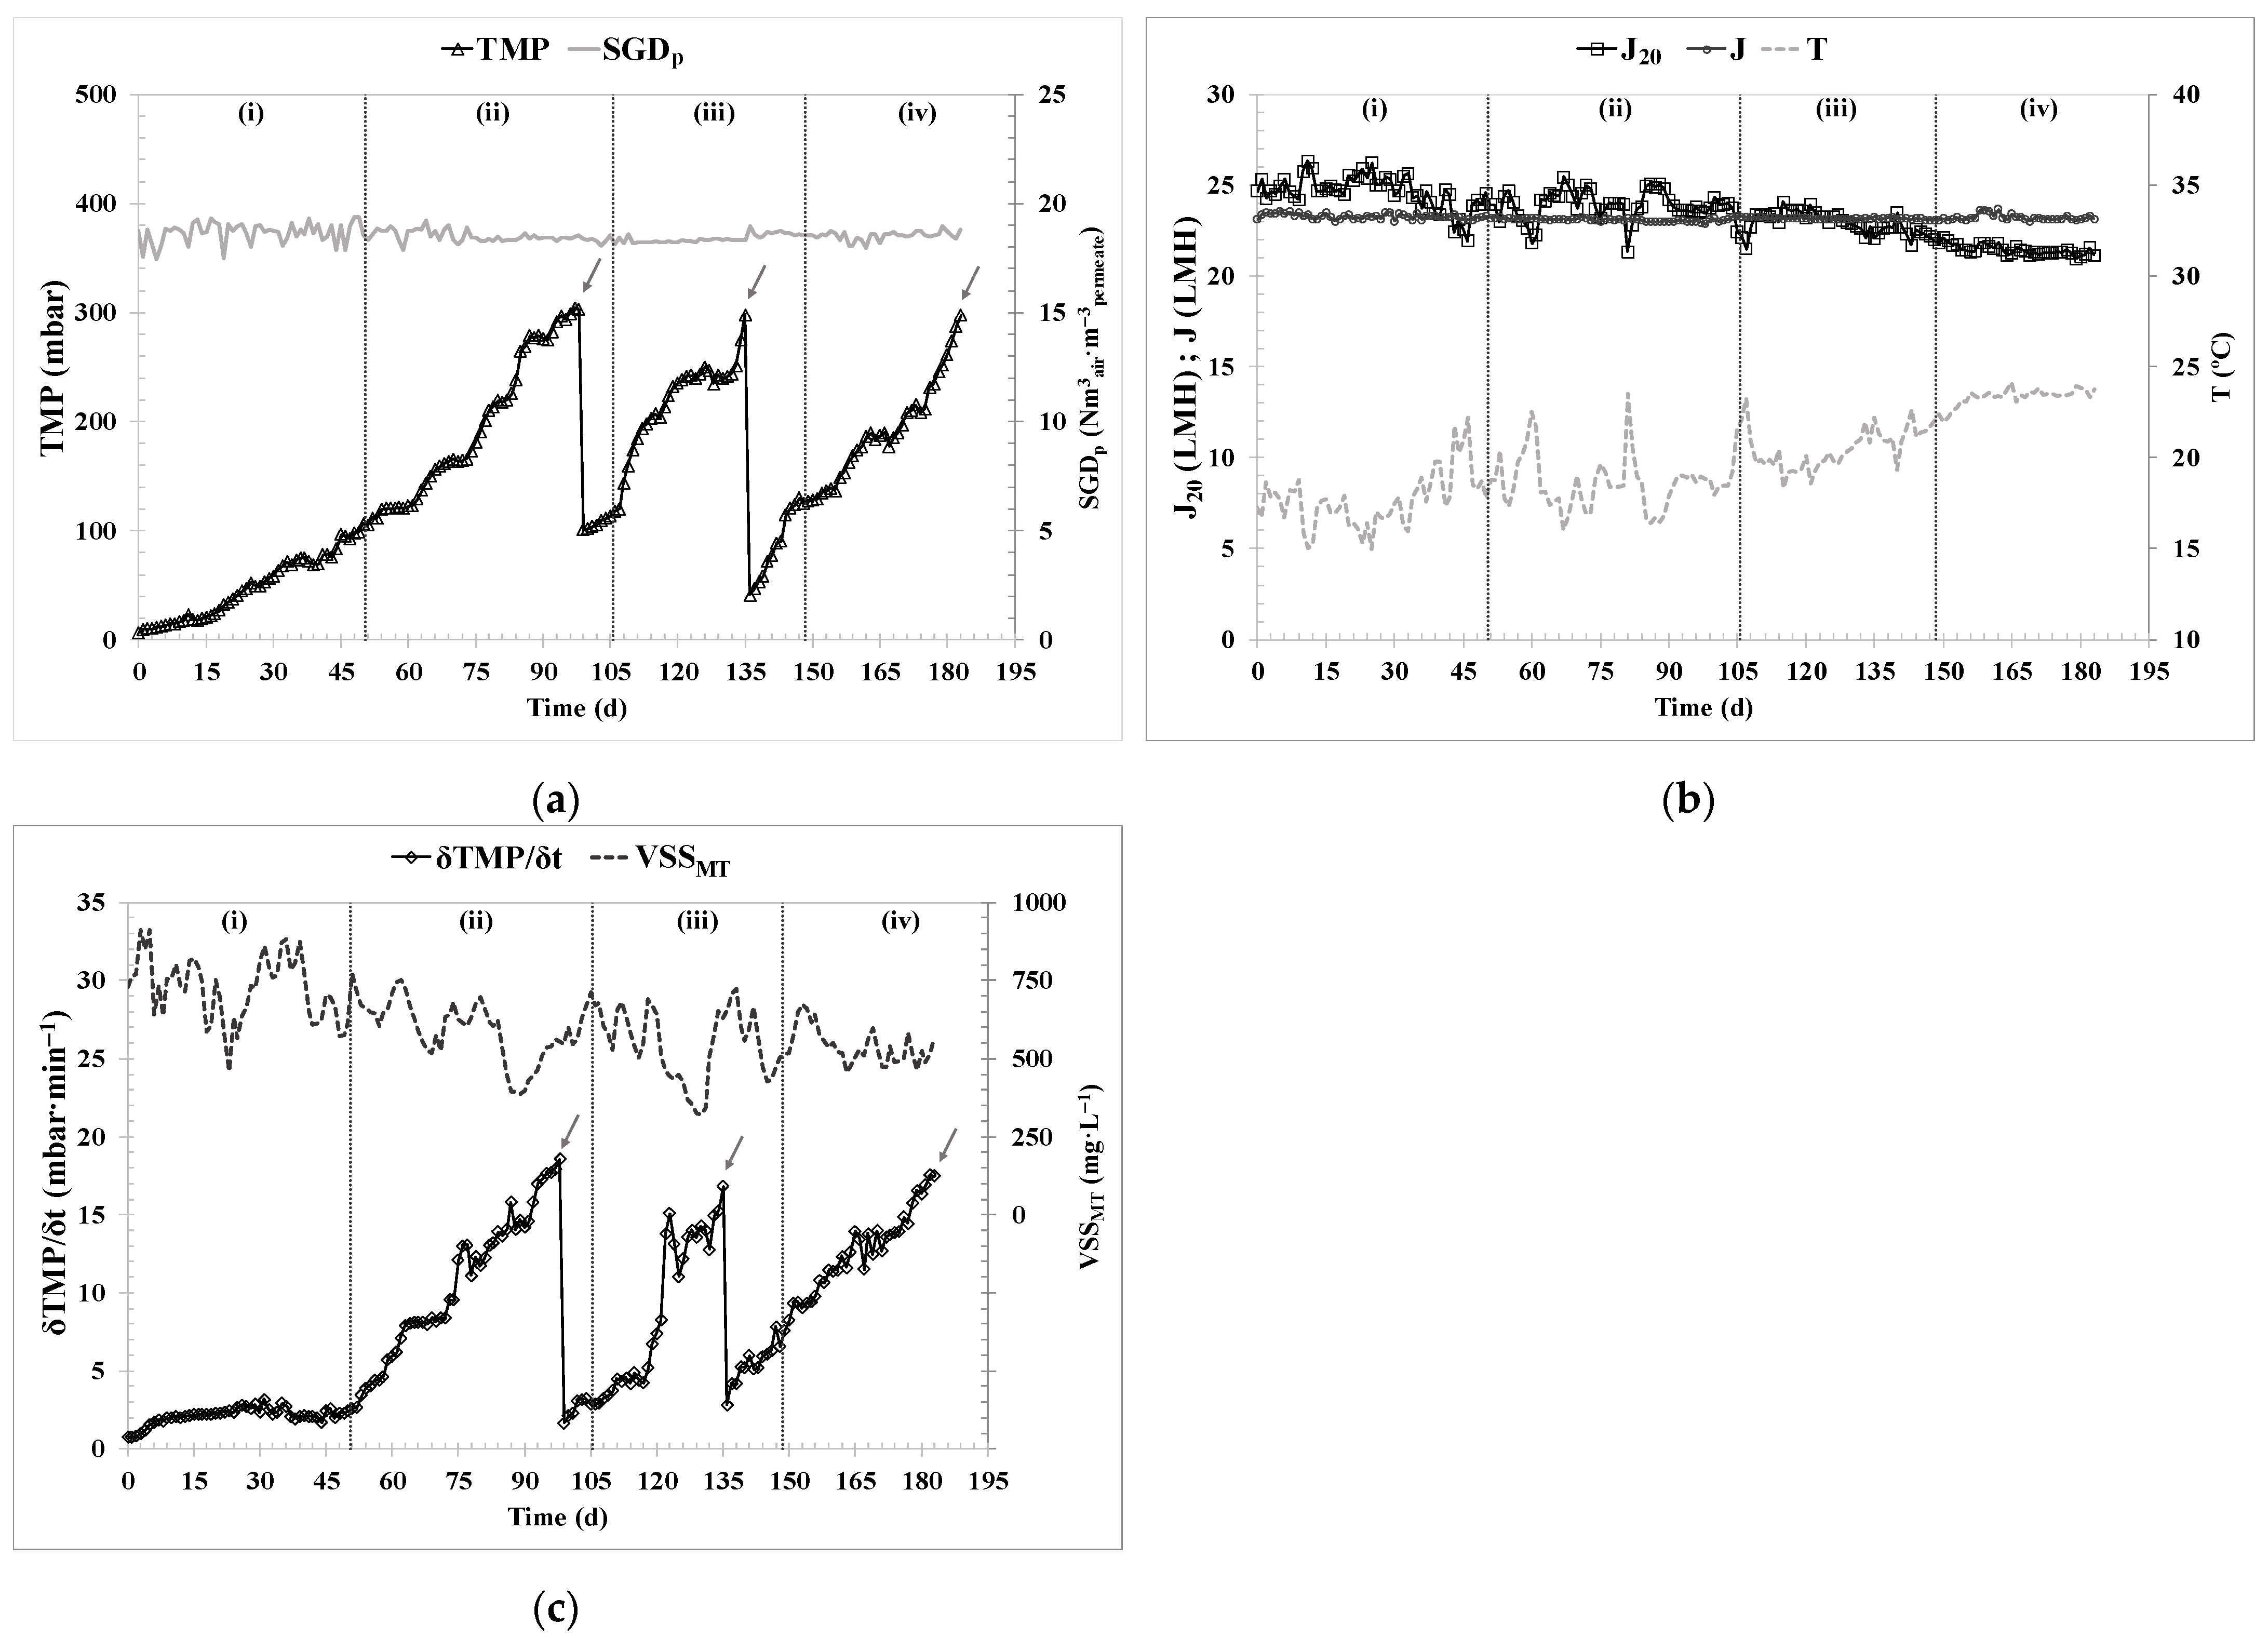
3.3. Filtration Performance

In this section, the filtration performance of the MPBR pilot plant observed across 183 days, from mid-winter to mid-summer, is presented. Figure 6 illustrates the evolution of critical parameters including TMP, SGDp, J, J20, T, fouling rate, and VSSMT; particularly, periods (i) and (iii) with fixed SRT and HRT, (ii) with controlled HRT and fixed SRT, and (iv) with controlled SRT and fixed HRT.
As detailed in Section 2.6, all experimental periods operated under identical filtration stage durations and frequencies. Mean values of J20, FR, SGDp, and VSS for the entire experimental period are presented in Table 7. A comparison is made with the values obtained by González-Camejo [43] from the same MPBR but fed with the effluent of an AnMBR pilot plant included in the WRRF pilot plant [41] with similar characteristics to the substrate used for the periods presented in this study.
The system demonstrated stability throughout the experimental period, particularly in the parameters SGDp and J (Figure 6a,b, respectively). Figure 6b highlights the stability of J, consistently maintained around 24 LMH. The slight decline in J20, attributed solely to temperature correction, aligns with the increasing temperatures observed from January to July during the experimental period. Despite maintaining J20 values above 24 LMH, the first chemical cleaning performance was not necessary until day 98 of operation. Regarding the fouling rate (Figure 6c), it mostly stayed at notably low levels, consistently below 15 mbar·min−1 throughout the experiment. No significant differences in performance were observed among periods (i) and (iii), which were conducted without controllers, period (ii) under the use of the HRT controller, and period (iv) through the employment of the SRT controller. This behaviour was probably due to the fact that the VSS concentrations in the membrane tank remained fairly stable.
The comparison between Period 1 of the experiment by González-Camejo et al. [43] and the current study was driven by similar conditions in J20 and SGDp. Although both studies shared these conditions, González-Camejo et al. [43] employed a feed stream from a previous anaerobic treatment, resulting in a higher VSS concentration in the MT. It is noteworthy that the latter experiment exhibited a higher fouling rate, necessitating more frequent chemical cleanings (four times more frequent), despite allowing a higher maximum TMP before cleaning. This difference in performance might be linked to a greater presence of extracellular polymeric substances due to the previous anaerobic treatment or the higher VSS concentration in the PBR.

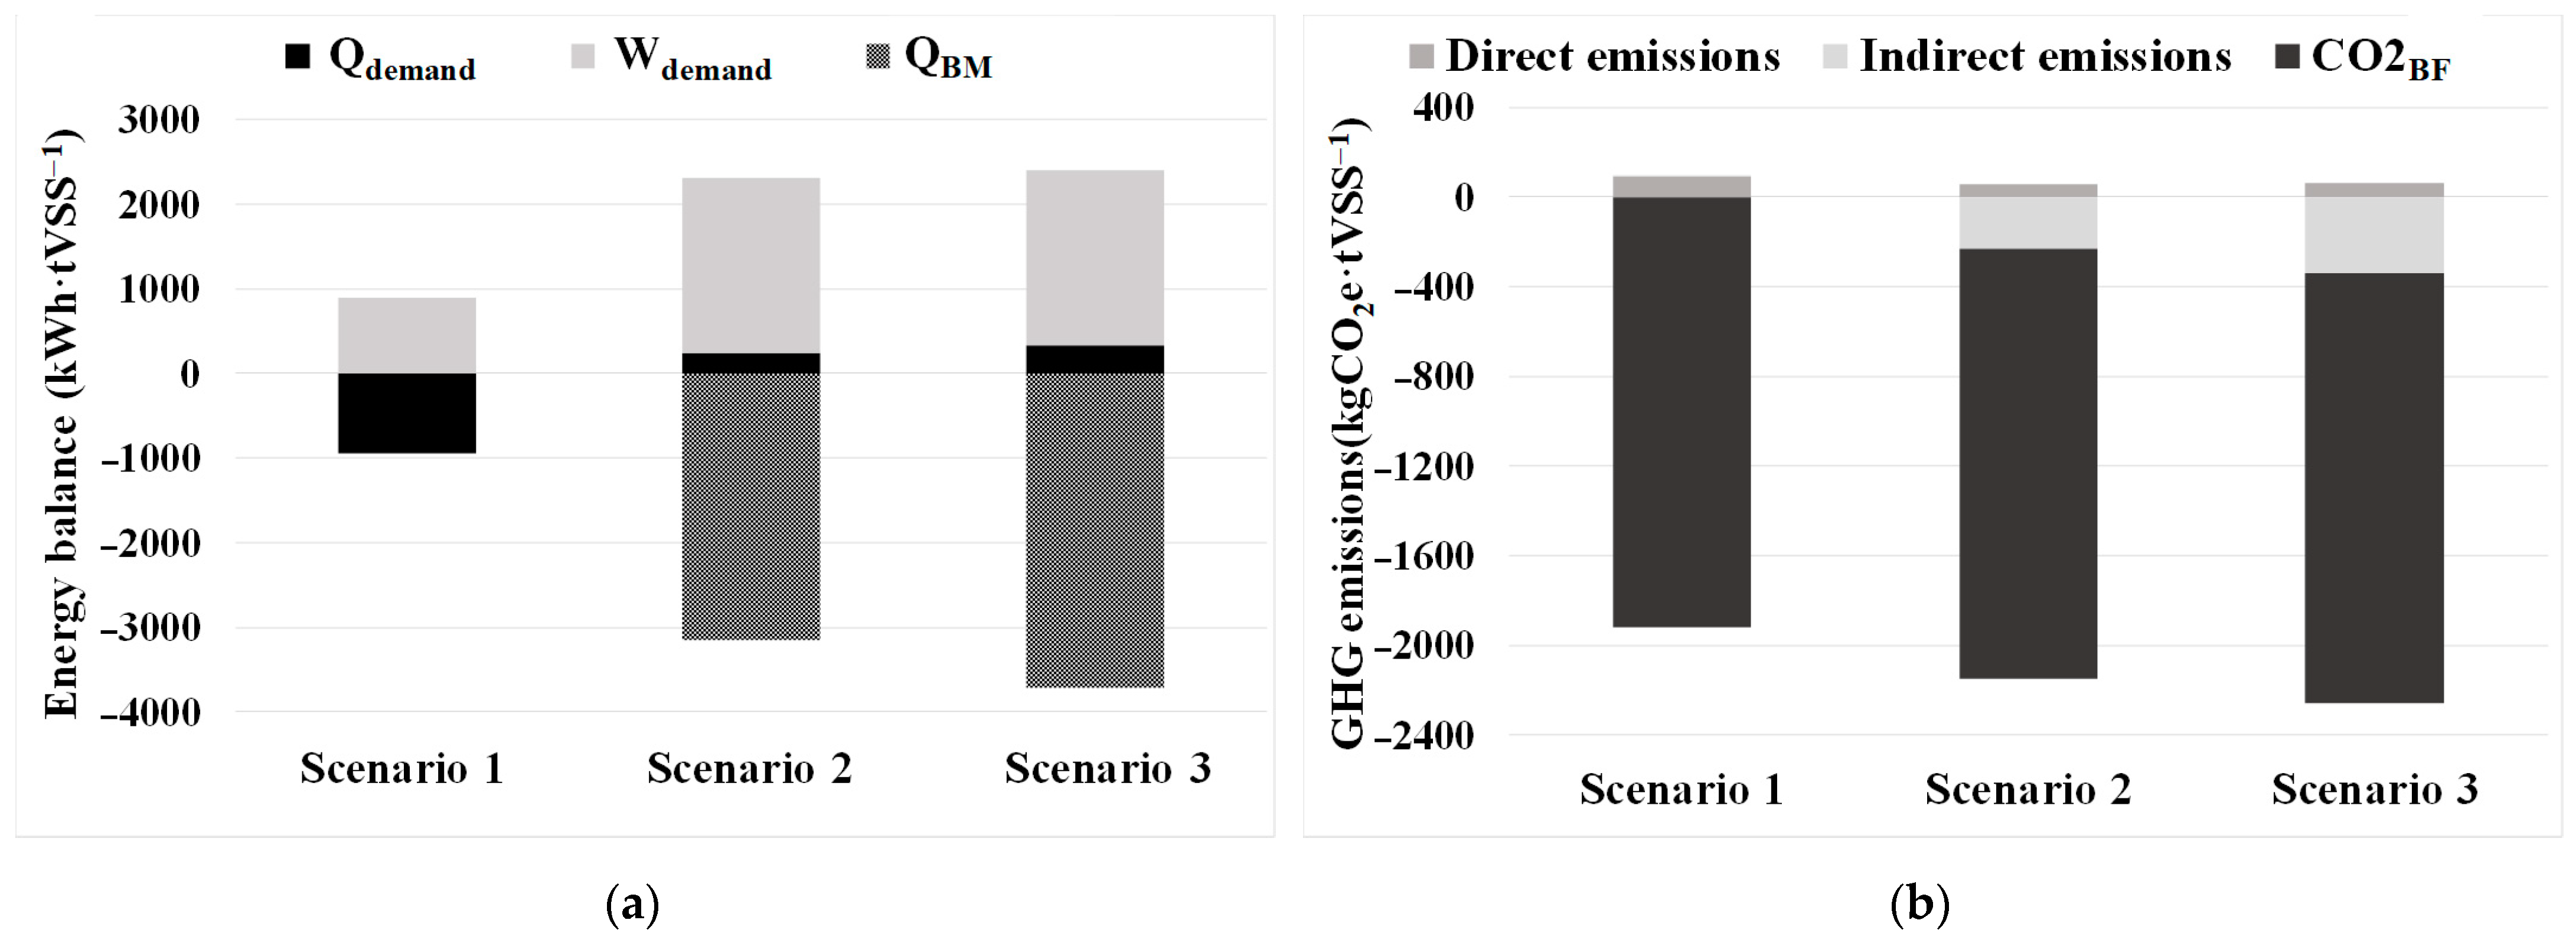
3.4. GHG Emissions Estimation

The GHG emissions were estimated in accordance with Section 2.6, encompassing the MPBR unit for three operating conditions (with controlled SRT and fixed HRT (this study), controlled HRT and fixed SRT [28], and fixed SRT and HTR [43]), the harvesting unit, the digestion unit, and the potential biogas utilisation within three scenarios: Scenario 1 for co-generation, Scenario 2 for membrane-based upgrading, and Scenario 3 for microalgae-based upgrading. Figure 7 shows the results for the MPBR unit operated under controlled SRT and fixed HRT conditions. Figure 7a illustrates the energy balance calculation, while Figure 7b depicts the GHG emissions. All variables have been calculated per tonne of produced biomass (tVSS) in the MPBR unit.
The energy assessment results in an almost neutral energy balance for Scenario 1. In the more favourable scenario, Scenario 3, the primary energy derived from the recovered biomethane surpasses consumed thermal and electrical energy by 50%. In terms of GHG estimation, the main component is the absorption of CO2 by the algal biomass (CO2BF). In Scenario 3, the combined net emissions (GHGdirect + GHGindirect) account as savings for 13% of the overall balance, compared to 8% in Scenario 2. Conversely, in Scenario 1, this sum would imply net emissions, representing 5% of the total.
Table 8 illustrates the resulting GHG emissions for Scenario 3 (the most favourable) and for the three operating conditions of the MPBR unit: controlled SRT and fixed HRT (this study), controlled HRT and fixed SRT [28], and fixed SRT and HRT [43]. The operating period of controlled HRT resulted in emission savings of 5% compared to controlled SRT, due to the direct relationship between all pumping-related consumptions, which were reduced with an increase in HRT. However, the operating period with fixed SRT and HRT results in emission savings 4% lower than those of the controlled SRT period. This was attributed to the higher biomass concentration in the PBR in the experiment from [43], leading to a lower concentration ratio in the harvesting plant and, consequently, lower biodegradability of the harvested biomass [52].

4. Conclusions

In this study, the implementation of the SRT controller in the pilot plant facilitated remarkable stability in VSS, accompanied by achieving notably high NRR and BP values. Normalising NRR by solar light irradiance and VSS concentration displayed a 51% efficiency boost compared to fixed SRT and HRT, showcasing the efficacy of the proposed controller. Similarly, when assessing BP efficiency by normalising it with solar light irradiance (I) and the nitrogen load (NLR), the results were slightly lower than those obtained with the HRT controller tested in a previous study, but surpassed those of fixed SRT and HRT operations by 8%.
Introducing a new parameter based on 25 °C-standardised dissolved oxygen (ΔDO25:I2) offers promising possibilities for future microalgae cultivation control strategies, displaying linear correlations with NRR:I2 and BP:I2, albeit with minor delays.
The assessment of greenhouse gas emissions, which was conducted for the joint operation of the MPBR with different operating conditions in terms of control or no control of the HRT and SRT, a cross-flow ultrafiltration harvesting unit, and an anaerobic digestion unit, highlighted substantial energy recovery, emission savings, and carbon fixation in algal biomass. Scenario 3 with the MPBR operating under a controlled HRT, involving biogas upgrading by microalgae to produce biomethane for grid injection, emerged as the most promising in terms of final biogas valorisation.
Moreover, the 183-day filtration performance displayed low fouling rates with no significant differences in performance among periods with controlled/non-controlled HRT/SRT, as VSS concentrations remained fairly stable.
In summary, our study underscores the success of the SRT controller in promoting stability and efficiency in microalgae cultivation. The ΔDO25:I2 parameter shows potential for refined cultivation strategies, while biogas valorisation results present promising prospects for advancing sustainable energy practices.

Author Contributions

Conceptualisation, J.F.M.-S., A.S. and M.V.R.; methodology, J.F.M.-S. and M.V.R.; validation, J.F.M.-S. and M.V.R.; formal analysis, J.F.M.-S.; investigation, J.F.M.-S., J.R. and J.G.-C.; resources, A.S. and M.V.R.; data curation, J.F.M.-S. and J.R.; writing—original draft preparation, J.F.M.-S., J.R. and J.G.-C.; writing—review and editing, M.V.R.; visualisation, J.F.M.-S.; supervision, A.S. and M.V.R.; project administration, A.S.; funding acquisition, A.S. All authors have read and agreed to the published version of the manuscript.

Funding

This research work was supported by the Science and Innovation Spanish Ministry (Projects CTM2014-54980-C2-1-R/C2-2-R) and the European Regional Development Fund (ERDF). Generalitat Valenciana supported this study via fellowship APOTI/2016/56 to the first author. The Science and Innovation Spanish Ministry have also supported this study via a pre-doctoral FPU fellowship to the third author (FPU14/05082). The authors would also like to acknowledge the financial aid received from the European Climate KIC association for the ‘MAB 2.0’ Project (APIN0057_2015-3.6-230_P066-05).

Data Availability Statement

The data presented in this study are available on request from the corresponding author. The data are not publicly available due to confidentiality.

Conflicts of Interest

The authors declare no conflicts of interest.

References

  1. Oviedo, J.A.; Muñoz, R.; Donoso-Bravo, A.; Bernard, O.; Casagli, F.; Jeison, D. A half-century of research on microalgae-bacteria for wastewater treatment. Algal Res. 2022, 67, 102828. [Google Scholar] [CrossRef]
  2. Dasan, Y.K.; Lam, M.K.; Chai, Y.H.; Lim, J.W.; Ho, Y.C.; Tan, I.S.; Lau, S.Y.; Show, P.L.; Lee, K.T. Unlocking the potential of microalgae bio-factories for carbon dioxide mitigation: A comprehensive exploration of recent advances, key challenges, and energy-economic insights. Bioresour. Technol. 2023, 380, 129094. [Google Scholar] [CrossRef]
  3. Sadvakasova, A.K.; Kossalbayev, B.D.; Bauenova, M.O.; Balouch, H.; Leong, Y.K.; Zayadan, B.K.; Huang, Z.; Alharby, H.F.; Tomo, T.; Chang, J.-S.; et al. Microalgae as a key tool in achieving carbon neutrality for bioproduct production. Algal Res. 2023, 72, 103096. [Google Scholar] [CrossRef]
  4. European Commission. Proposal for a Directive of the European Parliament and of the Council Concerning urban Wastewater Treatment; European Commission: Brussels, Belgium, 2022; Available online: https://environment.ec.europa.eu/publications/proposal-revised-urban-wastewater-treatment-directive_en (accessed on 23 November 2023).
  5. Amaro, H.M.; Salgado, E.M.; Nunes, O.C.; Pires, J.C.M.; Esteves, A.F. Microalgae systems-environmental agents for wastewater treatment and further potential biomass valorization. J. Environ. Manag. 2023, 337, 117678. [Google Scholar] [CrossRef] [PubMed]
  6. Al-Jabri, H.; Das, P.; Khan, S.; Thaher, M.; AbdulQuadir, M. Treatment of Wastewaters by Microalgae and the Potential Applications of the Produced Biomass—A Review. Water 2021, 13, 27. [Google Scholar] [CrossRef]
  7. Olguín, E.J.; Sánchez-Galván, G.; Arias-Olguín, I.I.; Melo, F.J.; González-Portela, R.E.; Cruz, L.; De Philippis, R.; Adessi, A. Microalgae-Based Biorefineries: Challenges and Future Trends to Produce Carbohydrate Enriched Biomass, High-Added Value Products and Bioactive Compounds. Biology 2022, 11, 1146. [Google Scholar] [CrossRef] [PubMed]
  8. Chen, Z.H.; Shao, S.S.; He, Y.J.; Luo, Q.Q.; Zheng, M.M.; Zheng, M.Q.; Chen, B.L.; Wang, M.Z. Nutrients removal from piggery wastewater coupled to lipid production by a newly isolated self-flocculating microalga Desmodesmus sp. PW1. Bioresour. Technol. 2020, 302, 122806. [Google Scholar] [CrossRef]
  9. Li, L.; Gao, K.; Yang, M.; Zheng, Q.; Zhang, M.; Deng, X. Challenges and potential solutions of microalgae-based systems for wastewater treatment and resource recovery. Front. Bioeng. Biotechnol. 2023, 11, 1210228. [Google Scholar] [CrossRef]
  10. De-Luca, R.; Trabuio, M.; Barolo, M.; Bezzo, F. Microalgae growth optimization in open ponds with uncertain weather data. Comp. Chem. Eng. 2018, 117, 410–419. [Google Scholar] [CrossRef]
  11. Day, J.G.; Gong, Y.; Hu, Q. Microzooplanktonic grazers—A potentially devastating threat to the commercial success of microalgae mass culture. Algal Res. 2017, 27, 356–365. [Google Scholar] [CrossRef]
  12. Morais, E.G.; Cristofoli, N.L.; Maia, I.B.; Magina, T.; Cerqueira, P.R.; Teixeira, M.R.; Varela, J.; Barreira, L.; Gouveia, L. Microalgae Systems for Wastewater Treatment: Technological Trends and Challenges towards Waste Recovery. Energies 2021, 14, 8112. [Google Scholar] [CrossRef]
  13. Acién-Fernández, F.G.; Gómez-Serrano, C.; Fernández-Sevilla, J.M. Recovery of Nutrients From Wastewaters Using Microalgae. Front. Sustain. Food Syst. 2018, 2, 59. [Google Scholar] [CrossRef]
  14. Rossi, S.; Mantovani, M.; Marazzi, F.; Bellucci, M.; Casagli, F.; Mezzanotte, V.; Ficara, E. Microalgae cultivation on digestate: Process efficiency and economics. Chem. Eng. J. 2023, 460, 141753. [Google Scholar] [CrossRef]
  15. Xu, X.; Gu, X.; Wang, Z.; Shatner, W.; Wang, Z. Progress, challenges and solutions of research on photosynthetic carbon sequestration efficiency of microalgae. Renew. Sustain. Energy Rev. 2019, 110, 65–82. [Google Scholar] [CrossRef]
  16. Morillas-España, A.; Lafarga, T.; Acién-Fernández, F.G.; Gómez-Serrano, C.; González-López, C.V. Annual production of microalgae in wastewater using pilot-scale thin-layer cascade photobioreactors. J. Appl. Phycol. 2021, 33, 3861–3871. [Google Scholar] [CrossRef]
  17. Ding, M.; Wang, C.; Bae, S.W.; Ng, H.Y. Enhanced nutrient removal and bioenergy production in microalgae photobioreactor following anaerobic membrane bioreactor for decarbonized wastewater treatment. Bioresour. Technol. 2022, 364, 128120. [Google Scholar] [CrossRef] [PubMed]
  18. Arbib, Z.; de Godos, I.; Ruiz, J.; Perales, J.A. Optimization of pilot high rate algal ponds for simultaneous nutrient removal and lipids production. Sci. Total Environ. 2017, 589, 66–72. [Google Scholar] [CrossRef] [PubMed]
  19. Jerney, J.; Spilling, K. Large Scale Cultivation of Microalgae: Open and Closed Systems. In Biofuels from Algae, 1st ed.; Spilling, K., Ed.; Humana: New York, NY, USA, 2018; pp. 1–8. [Google Scholar] [CrossRef]
  20. Luo, Y.; Le-Clech, P.; Henderson, R.K. Assessment of membrane photobioreactor (MPBR) performance parameters and operating conditions. Water Res. 2018, 138, 169–180. [Google Scholar] [CrossRef]
  21. Goh, P.S.; Ahmad, N.A.; Lim, J.W.; Liang, Y.Y.; Kang, H.S.; Ismail, A.F.; Arthanareeswaran, G. Microalgae-Enabled Wastewater Remediation and Nutrient Recovery through Membrane Photobioreactors: Recent Achievements and Future Perspective. Membranes 2022, 12, 1094. [Google Scholar] [CrossRef]
  22. Díaz, V.; Antiñolo, L.; Poyatos Capilla, J.M.; Almécija, M.C.; Muñío, M.d.M.; Martín-Pascual, J. Nutrient Removal and Membrane Performance of an Algae Membrane Photobioreactor in Urban Wastewater Regeneration. Membranes 2022, 12, 982. [Google Scholar] [CrossRef]
  23. Viruela, A.; Robles, A.; Durán, F.; Ruano, M.V.; Barat, R.; Ferrer, J.; Seco, A. Performance of an outdoor membrane photobioreactor for resource recovery from anaerobically treated sewage. J. Clean. Prod. 2018, 178, 665–674. [Google Scholar] [CrossRef]
  24. De Francisci, D.; Su, Y.; Lital, A.; Angelidaki, I. Evaluation of microalgae production coupled with wastewater treatment. Environ. Technol. 2018, 39, 581–592. [Google Scholar] [CrossRef] [PubMed]
  25. Vaz, S.A.; Badenes, S.M.; Pinheiro, H.M.; Martins, R.C. Recent reports on domestic wastewater treatment using microalgae cultivation: Towards a circular economy. Environ. Technol. Innov. 2023, 30, 103107. [Google Scholar] [CrossRef]
  26. Acién-Fernandez, F.G.; Reis, A.; Wijffels, R.H.; Barbosa, M.; Verdelho, V.; Llamas, B. The role of microalgae in the bioeconomy. New Biotechnol. 2021, 61, 99–107. [Google Scholar] [CrossRef] [PubMed]
  27. Oruganti, R.K.; Biji, A.P.; Lanuyanger, T.; Show, P.L.; Sriariyanun, M.; Upadhyayula, V.K.K.; Gadhamshetty, V.; Bhattacharyya, D. Artificial intelligence and machine learning tools for high-performance microalgae wastewater treatment and algal biorefinery: A critical review. Sci. Total Environ. 2023, 876, 162797. [Google Scholar] [CrossRef]
  28. Mora-Sánchez, J.F.; González-Camejo, J.; Seco, A.; Ruano, M.V. Advanced HRT-Controller Aimed at Optimising Nitrogen Recovery by Microalgae: Application in an Outdoor Flat-Panel Membrane Photobioreactor. ChemEngineering 2022, 6, 24. [Google Scholar] [CrossRef]
  29. Ruiz, J.; Álvarez-Díaz, P.D.; Arbib, Z.; Garrido-Pérez, C.; Barragán, J.; Perales, J.A. Performance of a flat panel reactor in the continuous culture of microalgae in urban wastewater: Prediction from a batch experiment. Bioresour. Technol. 2013, 127, 456–463. [Google Scholar] [CrossRef]
  30. Morillas-España, A.; Lafarga, T.; Gomez-Serrano, C.; Acién-Fernández, F.G.; Gonzalez-Lopez, C.V. Year-long production of Scenedesmus almeriensis in pilot-scale raceway and thin-layer cascade photobioreactors. Algal Res. 2020, 51, 102069. [Google Scholar] [CrossRef]
  31. Tan, X.-B.; Zhang, Y.-L.; Yang, L.-B.; Chu, H.-Q.; Guo, J. Outdoor cultures of Chlorella pyrenoidosa in the effluent of anaerobically digested activated sludge: The effects of pH and free ammonia. Bioresour. Technol. 2016, 200, 606–615. [Google Scholar] [CrossRef]
  32. Gonzalez-Camejo, J.; Montero, P.; Aparicio, S.; Ruano, M.V.; Borras, L.; Seco, A.; Barat, R. Nitrite inhibition of microalgae induced by the competition between microalgae and nitrifying bacteria. Water Res. 2020, 172, 115499. [Google Scholar] [CrossRef]
  33. Zhang, M.; Yao, L.; Maleki, E.; Liao, B.-Q.; Lin, H. Membrane technologies for microalgae cultivation and dewatering: Recent progress and challenges. Algal Res. 2019, 44, 101686. [Google Scholar] [CrossRef]
  34. Xu, M.; Li, P.; Tang, T.; Hu, Z. Roles of SRT and HRT of an algal membrane bioreactor system with a tanks-in-series configuration for secondary wastewater effluent polishing. Ecol. Eng. 2015, 85, 257–264. [Google Scholar] [CrossRef]
  35. Lau, A.K.S.; Bilad, M.R.; Osman, N.B.; Marbelia, L.; Putra, Z.A.; Nordin, N.A.H.M.; Wirzal, M.D.H.; Jaafar, J.; Khan, A.L. Sequencing batch membrane photobioreactor for simultaneous cultivation of aquaculture feed and polishing of real secondary effluent. J. Water Process Eng. 2019, 29, 100779. [Google Scholar] [CrossRef]
  36. Zhao, Z.; Muylaert, K.; Vankelecom, I.F.J. Applying membrane technology in microalgae industry: A comprehensive review. Renew. Sustain. Energy Rev. 2023, 172, 113041. [Google Scholar] [CrossRef]
  37. Zou, H.; Rutta, N.C.; Chen, S.; Zhang, M.; Lin, H.; Liao, B. Membrane Photobioreactor Applied for Municipal Wastewater Treatment at a High Solids Retention Time: Effects of Microalgae Decay on Treatment Performance and Biomass Properties. Membranes 2022, 12, 564. [Google Scholar] [CrossRef] [PubMed]
  38. Luo, Y.; Le-Clech, P.; Henderson, R.K. Simultaneous microalgae cultivation and wastewater treatment in submerged membrane photobioreactors: A review. Algal Res. 2017, 24, 425–437. [Google Scholar] [CrossRef]
  39. Mao, Y.; Xiong, R.; Gao, X.; Jiang, L.; Peng, Y.; Xue, Y. Analysis of the Status and Improvement of Microalgae Phosphorus Removal from Municipal Wastewater. Processes 2021, 9, 1486. [Google Scholar] [CrossRef]
  40. Morillas-Espana, A.; Lafarga, T.; Sanchez-Zurano, A.; Acien-Fernandez, F.G.; Rodriguez-Miranda, E.; Gomez-Serrano, C.; Gonzalez-Lopez, C.V. Year-long evaluation of microalgae production in wastewater using pilot-scale raceway photobioreactors: Assessment of biomass productivity and nutrient recovery capacity. Algal Res. 2021, 60, 102500. [Google Scholar] [CrossRef]
  41. González-Camejo, J.; Robles, A.; Seco, A.; Ferrer, J.; Ruano, M.V. On-line monitoring of photosyntethic activity based on pH data to assess microalgae cultivation. J. Environ. Manag. 2020, 276, 111343. [Google Scholar] [CrossRef]
  42. Seco, A.; Aparicio, S.; González-Camejo, J.; Jiménez-Benítez, A.; Mateo, O.; Mora-Sánchez, J.F.; Noriega-Hevia, G.; Sanchis-Perucho, P.; Serna-García, R.; Zamorano-López, N.; et al. Resource recovery from sulphate-rich sewage through an innovative anaerobic-based water resource recovery facility (WRRF). Water Sci. Technol. 2018, 78, 1925–1936. [Google Scholar] [CrossRef]
  43. González-Camejo, J.; Aparicio, S.; Jiménez-Benítez, A.; Pachés, M.; Ruano, M.V.; Borrás, L.; Barat, R.; Seco, A. Improving membrane photobioreactor performance by reducing light path: Operating conditions and key performance indicators. Water Res. 2020, 172, 115518. [Google Scholar] [CrossRef] [PubMed]
  44. Krustok, I.; Odlare, M.; Truu, J.; Nehrenheim, E. Inhibition of nitrification in municipal wastewater-treating photobioreactors: Effect on algal growth and nutrient uptake. Bioresour. Technol. 2016, 202, 238–243. [Google Scholar] [CrossRef] [PubMed]
  45. Sánchez-Zurano, A.; Ciardi, M.; Lafarga, T.; Fernández-Sevilla, J.M.; Bermejo, R.; Molina-Grima, E. Role of Microalgae in the Recovery of Nutrients from Pig Manure. Processes 2021, 9, 203. [Google Scholar] [CrossRef]
  46. Salgado, E.M.; Esteves, A.F.; Gonçalves, A.L.; Pires, J.C.M. Microalgae cultures for the remediation of wastewaters with different nitrogen to phosphorus ratios: Process modelling using artificial neural networks. Environ. Res. 2023, 231 Pt 1, 116076. [Google Scholar] [CrossRef] [PubMed]
  47. Larsen, P.M. Industrial application of fuzzy logic control. Int. J. Man. Mach. Stud. 1980, 12, 3–10. [Google Scholar] [CrossRef]
  48. Mendel, J.M. Fuzzy logic systems for engineering: A tutorial. Proc. IEEE 1995, 83, 345–377. [Google Scholar] [CrossRef]
  49. Gonzalez-Camejo, J.; Barat, R.; Aguado, D.; Ferrer, J. Continuous 3-year outdoor operation of a flat-panel membrane photobioreactor to treat effluent from an anaerobic membrane bioreactor. Water Res. 2020, 169, 115238. [Google Scholar] [CrossRef]
  50. APHA. Standard Methods for the Examination of Water and Wastewater, 2012 22nd ed.; American Public Health Association, American Water Works Association, Water Environment Federation: Washington, DC, USA, 2012. [Google Scholar]
  51. Parravicini, V.; Nielsen, P.H.; Thornberg, D.; Pistocchi, A. Evaluation of greenhouse gas emissions from the European urban wastewater sector, and options for their reduction. Sci. Total Environ. 2022, 838, 156322. [Google Scholar] [CrossRef]
  52. Mora-Sánchez, J.F.; González-Camejo, J.; Noriega-Hevia, G.; Seco, A.; Ruano, M.V. Ultrafiltration harvesting of microalgae culture cultivated in a WRRF: Long-term performance and techno-economic and carbon footprint assessment. Sustainability 2023, 16, 369. [Google Scholar] [CrossRef]
  53. Giménez, J.B.; Bouzas, A.; Carrere, H.; Steyer, J.-P.; Ferrer, J.; Seco, A. Assessment of cross-flow filtration as microalgae harvesting technique prior to anaerobic digestion: Evaluation of biomass integrity and energy demand. Bioresour. Technol. 2018, 269, 188–194. [Google Scholar] [CrossRef]
  54. Greses, S. Degradación Anaerobia de Microalgas Procedentes del Tratamiento del Efluente de un Reactor Anaerobio de Membranas Sumergidas (Anaerobic Degradation of Microalgae from the Effluent Treatment of a Submerged Anaerobic Membrane Reactor). Ph.D. Thesis, Universitat de València, Valencia, Spain, 2017. (In Spanish). [Google Scholar]
  55. Bremond, U.; Bertrandias, A.; de Buyer, R.; Latrille, E.; Jimenez, J.; Escudié, R.; Steyer, J.-P.; Bernet, N.; Carrère, H. Recirculation of solid digestate to enhance energy efficiency of biogas plants: Strategies, conditions and impacts. Energy Convers. Manag. 2021, 231, 113759. [Google Scholar] [CrossRef]
  56. Muller, O.; Bricker, P.; Laurin, B.; Mouton, L. Climate Change and Electricity, European Carbon Factor, Benchmarking of CO2 Emissions by Europe’s Largest Electricity Utilities, 21st ed.; INIS-FR--22-0804; International Atomic Energy Agency: Vienna, Austria, 2022. [Google Scholar]
  57. Bright Biomethane. PUREPAC GRAND. Enschede, The Netherlands. 2023. Available online: https://www.brightbiomethane.com/ (accessed on 28 June 2023).
  58. Mendez, L.; Garcia, D.; Perez, E.; Blanco, S.; Munoz, R. Photosynthetic upgrading of biogas from anaerobic digestion of mixed sludge in an outdoors algal-bacterial photobioreactor at pilot scale. J. Water Process Eng. 2022, 48, 102891. [Google Scholar] [CrossRef]
  59. Christenson, L.; Sims, R. Production and harvesting of microalgae for wastewater treatment, biofuels, and bioproducts. Biotechnol. Adv. 2011, 29, 686–702. [Google Scholar] [CrossRef] [PubMed]
  60. Romero-Villegas, G.I.; Fiamengo, M.; Acien Fernandez, F.G.; Molina Grima, E. Utilization of centrate for the outdoor production of marine microalgae at pilot-scale in flat-panel photobioreactors. J. Biotech. 2018, 284, 102–114. [Google Scholar] [CrossRef]
Figure 1. External membrane photobioreactor unit design. B: CO2-enriched air-blower; CIP: clean in place tank; DC: distribution point; DO: oxygen content in liquid phase sensor; MT: module of membranes; N: ammonium (NH4+) and nitrate (NO3) + nitrite (NO2) sensor ANISE; Pi: pump number i; PBR: photobioreactor; pH: pH sensor; SS: solid particles in suspension sensor SOLITAX.
Water 16 00155 g001
Figure 2. MPBR performance under SRT controller operation. Evolution of parameters (a) pH′:I2, NRR:I2, I2·500, and BP:I2; (b) VSS, solar PAR, and TSN. BP: biomass productivity; I2: dimensionless normalising factor associated with the average light irradiance; NRR: nitrogen recovery rate; PAR: photosynthetically active radiation; TSN: total soluble nitrogen; VSS: volatile suspended solids.
Water 16 00155 g002
Figure 3. SRT controller action. Input variables: ΔpH′MA:I2 divided by 100 for visualising purposes and ∑SRT. Output variable: applied SRT. I2: normalising factor associated with the average light irradiance; pH′: first derivative of pH data dynamics; pH′MA:I2: 4-day moving average of pH′ normalised with I2; SRT: solids retention time to be applied; ΔpH′MA:I2:difference between pH′MA:I24 values on the calculation day and the previous day; ∑SRT: cumulative changes in SRT over the preceding 3 days.
Water 16 00155 g003
Figure 4. Performance comparison of parameter ΔDO25:I2 with (a) NRR:I2; (b) BP:I2. BP: biomass productivity; I2: normalising factor associated with the average light irradiance; NRR: nitrogen recovery rate; pH′: ΔDO25: variation of DO25 in relation to the stable minimum during the night-time period.
Water 16 00155 g004
Figure 5. Linear correlation between daily averages of parameters: ΔDO25:I2 with NRR:I2; and ΔDO25:I2 with BP:I2. BP: biomass productivity; I2: normalising factor associated with the average light irradiance; NRR: nitrogen recovery rate; pH′: first derivative of pH data dynamics; ΔDO25: variation of DO25 in relation to the stable minimum during the night-time period.
Water 16 00155 g005
Figure 6. Comparative filtration performance across four experimental periods: (a) transmembrane pressure (TMP) and specific air demand per volume of permeate (SGDp); (b) transmembrane flux (J), standardised transmembrane flux at 20 °C (J20), and membrane tank temperature (T); (c) fouling rate (FR) as δTMP/δt, and volatile suspended solids in the membrane tank (VSSMT). Dotted lines denote distinct experimental periods—(i) and (iii) representing fixed SRT and HRT conditions; (ii) showcasing the use of the HRT controller [28]; and (iv) highlighting the implementation of the SRT controller, the focus of this study. Arrows illustrate chemical cleaning interventions and their impact on performance.
Water 16 00155 g006
Figure 7. Comparative across three biogas valorisation scenarios: Scenario 1—co-generation; Scenario 2—membrane upgrading; Scenario 3—microalgae-based upgrading: (a) energy balance; (b) GHG estimation. Qdemand: total thermal energy demand; Wdemand: total electrical energy demand; QBM: biomethane production; GHG: greenhouse gases; CO2BF: carbon fixation by microalgae biomass.
Water 16 00155 g007
Table 1. Feed medium (MPBR inflow) properties.
VariableUnitAverage ± Std Deviation
Ammoniummg N L–154.8 ± 3.7
Oxidised nitrogenmg N L–10.4 ± 0.1
Phosphorusmg P L–15.9 ± 0.5
Nitrogen:Phosphorusmolar ratio20.7 ± 2.3
Table 2. Operating and environmental conditions during the operational phase of the membrane photobioreactor. Daily averages.
VariableUnitAverage ± Standard Deviation
Solar photosynthetically active
radiation
μmol m–2 s–1230 ± 20
Maximum solar photosynthetically active radiationμmol m–2 s–1849 ± 66
Temperature°C23.3 ± 0.5
Liquid-phase oxygen contentmg O2 ·L–19.7 ± 0.1
Hydraulic retention time d1.50 ± 0.01
Nitrogen loading rateg N m–3·d–138 ± 3
Table 3. Fuzzy control rules of the SRT controller inference mechanism.
Inference Rules
Rule 1: IF ΔpH′MA:I2 is LN and ∑SRT is LP, THEN ΔSRT is LN
Rule 2: IF ΔpH′MA:I2 is LN and ∑SRT is ZE, THEN ΔSRT is SN
Rule 3: IF ΔpH′MA:I2 is LN and ∑SRT is SP, THEN ΔSRT is SN
Rule 4: IF ΔpH′MA:I2 is ZE, THEN ΔSRT is SN
Rule 5: IF ΔpH′MA:I2 is LP, THEN ΔSRT is ZE
Rule 6: IF ΔpH′MA:I2 is LN and ∑SRT is SN, THEN ΔSRT is SP
Rule 7: IF ΔpH′MA:I2 is LN and ∑SRT is LN, THEN ΔSRT is LP
Notes: I2: dimensionless normalising factor based on average irradiance Iav; pH′: differential coefficient of pH data variations; pH′MA:I2: 4-day moving average of the pH′ normalised with I2; SRT: solids retention time; ΔpH′MA:I2: variation in pH′MA:I2 between the current day and the previous day; ΔSRT: daily applied variation in SRT; ∑SRT: cumulative changes in SRT over the preceding 3 days.
Table 4. Operating conditions during the various intervals evaluated.
Filtration IntervalOperation Interval (d)MPBR Operating ModeSRT (d)HRT (d)VSSMT (g·L–1)T (°C)
(i)1–50Fixed-SRT&HRT2.25 ± 0.021.50 ± 0.010.79 ± 0.1118 ± 2
(ii)51–105Controlled HRT-Fixed SRT2.25 ± 0.01[1.02–2.25]0.64 ± 0.1119 ± 2
(iii)106–148Fixed-SRT&HRT3.45 ± 0.942.25 ± 0.020.06 ± 0.1220 ± 1
(iv) *149–183Controlled SRT-Fixed HRT[2.30–3.00]1.50 ± 0.010.59 ± 0.0623.3 ± 0.5
Note: * Data related to the operation period of the SRT controller, which is the central focus of this study.
Table 5. Performance of SRT controller. Daily averages.
ParameterUnitMean ± SD
PBR VSS concentrationg·L–10.51 ± 0.04
SRTd2.59 ± 0.16
NRRg N·m–3·d–119 ± 5
BPg VSS·m–3·d–1198 ± 56
Notes: BP: biomass productivity; NRR: nitrogen recovery rate; PBR: photobioreactor; SRT: solids retention time; VSS: volatile suspended solids.
Table 6. Nutrient removal and biomass productivity ratios of MPBR under different outdoor and operational conditions. Average values.
StudyType of OperationSRT (d)HRT (d)NRR:I:VSS (mgN·mol-photon–1·gVSS–1)BP:I:NLR (gVSS·mol-photon–1·mgN–1)Reference
1Controlled SRT–Fixed HRT[2.30, 3.00]1.500.800.113This study
2Controlled HRT–Fixed SRT2.25[1.02, 2.25]0.620.116[28]
3Fixed-SRT and HRT3.001.500.530.105[43]
Notes: BP: biomass productivity; BP:I:NLR: ratio of BP to I and NLR; HRT: hydraulic retention time; I: solar light irradiance; NLR: nitrogen loading rate; NRR: nitrogen recovery rate; NRR:I:VSS: ratio of NRR to I and VSS; SRT: solids retention time; VSS: volatile suspended solids.
Table 7. Comparison of MPBR filtration performance using different effluent sources.
ParameterUnitThis StudyPeriod 1
Data from [43]
Effluent source-AerobicAnaerobic
Experimental spand18326
MT VSS concentrationg·L–10.66 ± 0.130.80 ± 0.06
J20LMH23 ± 226
Fouling ratembar·min–17.7 ± 5.310–35
SGDpNm3air·m–3permeate18.3 ± 0.416–20
Maximum TMPmbar300500
Chemical cleaning frequencyd6113
Notes: J20: 20 °C-standardised flux; MT: membrane tank; SGDp: specific gas demand per volume of permeate produced; TMP: transmembrane pressure; VSS: volatile suspended solids.
Table 8. Direct GHG and indirect GHG comparison for Scenario 3: microalgae-based upgrading to biomethane.
StudyMPBR ConditionsGHGtotal
(kgCO2e·tVSS–1)
Reference
1Controlled SRT–fixed HRT−2196This study
2Controlled HRT–fixed SRT−2297[28]
3Fixed SRT and HRT−2116[43]
Disclaimer/Publisher’s Note: The statements, opinions and data contained in all publications are solely those of the individual author(s) and contributor(s) and not of MDPI and/or the editor(s). MDPI and/or the editor(s) disclaim responsibility for any injury to people or property resulting from any ideas, methods, instructions or products referred to in the content.

