
Optimization Research on the Space-V-Type Biomimetic Surface Grooves of a Marine Centrifugal Pump

1
Pipe China Science and Technology Institute, Langfang 300457, China
2
Wuhan Second Ship Design and Research Institute, Wuhan 430060, China
3
Research Center of Fluid Machinery Engineering and Technology, Jiangsu University, Zhenjiang 212003, China
*
Author to whom correspondence should be addressed.
Water 2023, 15(22), 4031; https://doi.org/10.3390/w15224031
Submission received: 22 October 2023
/
Revised: 15 November 2023
/
Accepted: 16 November 2023
/
Published: 20 November 2023
(This article belongs to the Special Issue Design and Optimization of Fluid Machinery)
Abstract
:The biomimetic surface with Space-V grooves can effectively reduce flow resistance and noise. Our investigation was in order to further enhance the drag reduction and noise reduction performance of a marine centrifugal pump with Space-V-groove-shaped biomimetic surfaces. A regression equation was established with response surface methodology between the total sound pressure level and the height (h), width (s), and spacing (b) of the biomimetic groove structure. The interaction effects of various parameters on the total sound pressure level were analyzed, and the parameter range was determined at the lowest total sound pressure level. The hydraulic performance and interior noise of the model before and after optimization were compared. The results showed that the total sound pressure level initially decreased and then increased with increasing groove height. Similarly, with an increase in groove width, the total sound pressure level decreased at first, then increased. When the height of the bionic groove is 0.5–0.7 mm, the groove width is 0.4–0.7 mm, the groove spacing is 0.7–1.3 mm, and the total sound pressure level of the centrifugal pump is the smallest, which is 180–182 dB. On the other hand, the total sound pressure level increased as groove spacing increased. Through the use of an optimized Space-V groove model, under rated working conditions, the model head is increased by 0.27 m and the efficiency is increased by 1.21%. In addition, the optimized model has excellent drag and noise reduction performance, with the drag reduction rate of 3.73% and noise reduction rate of 1.81%, which are, respectively, increased by 0.87% and 0.45% compared with before optimization. The performance of centrifugal pumps for ships can be greatly improved.
1. Introduction
Centrifugal pumps can produce noise and drag during operation, which can have adverse effects on production and operation. The main function of pumps for ships is to transport liquids such as seawater and fuel. Enhancing the stealth capability of a naval vessel is crucial for military operations; therefore, marine centrifugal pumps require higher performance in terms of low noise and low drag when operating. As a result, research on noise and drag reduction for marine centrifugal pumps has received significant attention. One effective method for reducing noise and flow resistance is by imitating the biological surface flow structure.
The use of biological surface features to enhance the flow resistance and noise reduction performance of pumps is a popular research subject. Mou et al. [1,2] incorporated the wing shape of a long-eared owl into centrifugal pump design and created a bio-inspired snail shell. This model was found to reduce pressure pulsations in pumps by up to 56.1%. Zhang [3] examined noise reduction in fan blades using the flexible properties of biological skin surfaces in fluids. The results showed that placing a flexible surface on fan blades could significantly reduce the fan’s noise level, particularly in the medium–low frequency range. However, the effect on high-frequency noises was less pronounced. Dai et al. [4,5] numerically simulated the sound field inside a bio-inspired centrifugal pump utilizing the Proudman method and acoustic analogy equation. Their findings suggest that non-smooth structures can disrupt the near-wall vortex structure of the blades, reduce turbulence dissipation in the impeller, and consequently decrease sound power in the flow channel. Tian et al. [6] developed a bio-inspired structure with heterogeneous composite material, applied it to the impeller surface of a pump, and studied the fluid control mechanism. The results showed that elastic deformation caused by coupling between the elastic surface material and the bio-inspired structure is the fluid control mechanism of the bio-inspired structure with heterogeneous composite material. This deformation alters the actual contact surface between the fluid and the solid, reducing the velocity gradient of the fluid boundary layer and friction force.
Numerous studies have demonstrated the significant effects of grooved surfaces on reducing flow resistance and noise. Komolov [7] utilized grooved surfaces on airfoils and successfully decreased the stall angle by 8–9%. Similarly, Lee [8] applied grooved membranes to an NACA 0012 airfoil and achieved a drag reduction effect. Chamorro et al. [9] placed grooved surfaces on fan blades and discovered that complete coverage of the blade surface was not necessary for optimal drag reduction. In fact, under certain conditions, partial coverage yielded better drag reduction results. To attain optimal drag reduction, the groove size should match that of the blade surface. Walsh [10] employed non-smooth grooved surfaces on airplane fuselages and recorded a 2% decrease in noise level. Park et al. [11] conducted experimental research on grooved surfaces and measured their velocity, which confirmed that non-smooth grooved surfaces can effectively reduce flow noise. Dai [12] analyzed the acoustic characteristics of grooved structures on the surface of centrifugal pumps and discovered that they can reduce discrete noise at blade frequencies and their harmonics. Dai [13] also studied the optimal arrangement of the pit structure of a centrifugal pump blade, and the results showed that the bionic pit unit arranged at any position could produce a drag reduction effect.
Response surface methods are efficient optimization methods that save labor costs and time. Li et al. [14] used the response surface method to optimize the design of the load bearing beam of the loading owner of the safety valve, and the results showed that the maximum deformation of the optimized main load bearing beam was reduced by 16.89% and the maximum stress was reduced by 16.04%. Liu et al. [15] optimized the design of the particle measurement device based on the response surface oscillation balance, and the results showed that the sensitivity of the optimal structure was increased by 6.6 times compared with that before optimization. Qiang et al. [16] optimized the structure of the spiral conveying shaft, the main component of the conveying mechanism, based on the response surface method, and the optimized structure improved the unit conveying efficiency of the spiral conveying shaft. Zhang et al. [17] used the main geometric parameters of the impeller as variables to construct a mathematical model for optimizing the objective using the response surface method, which improved the efficiency of centrifugal pumps and reduced wear rates. Qiang et al. [16] optimized the structure of the helical conveying shaft of a conveyor system using the response surface method and obtained an optimized structure that improved the unit conveying efficiency of the helical conveying shaft. Aelaei et al. [18] studied the effect of design variables on the clamped delta-wing section using CFD calculations based on a response surface optimization method. Thakkar et al. [19] used the blade exit angle, wrap angle, and exit width as design variables to optimize both the pump head and efficiency, resulting in a 9.154% increase in the pump head and a 10.15% increase in efficiency compared to the initial pump. Liu et al. [20] optimized the bionic structure of a centrifugal pump using the response surface method, which reduced the total sound pressure level and improved the hydraulic efficiency of the pump.
The objective of this paper is to enhance the resistance reduction and noise reduction performance of marine centrifugal pumps by optimizing the structural parameters of Space-V grooves [4]. The research aims to obtain the optimal structural parameters and investigate the impact of each parameter on the total sound pressure level. The response surface methodology was employed to optimize the structural parameters, with the total sound pressure level of the marine centrifugal pump serving as the target response value. Based on the results of the central composite design using response surface methodology, a regression equation was constructed for the objective function and each variable. Additionally, a comparative analysis was conducted on the hydraulic performance and interior noise levels of the Space-V groove model before and after optimization. The research ideas and process are shown in Figure 1.
2. Response Surface Experimental Design
Response surface methodology (RSM) is a powerful tool that can simplify the optimization process by establishing a relationship between optimization objectives and influencing factors. It reduces the time required for experimentation and the number of experiments needed, providing great convenience to designers.
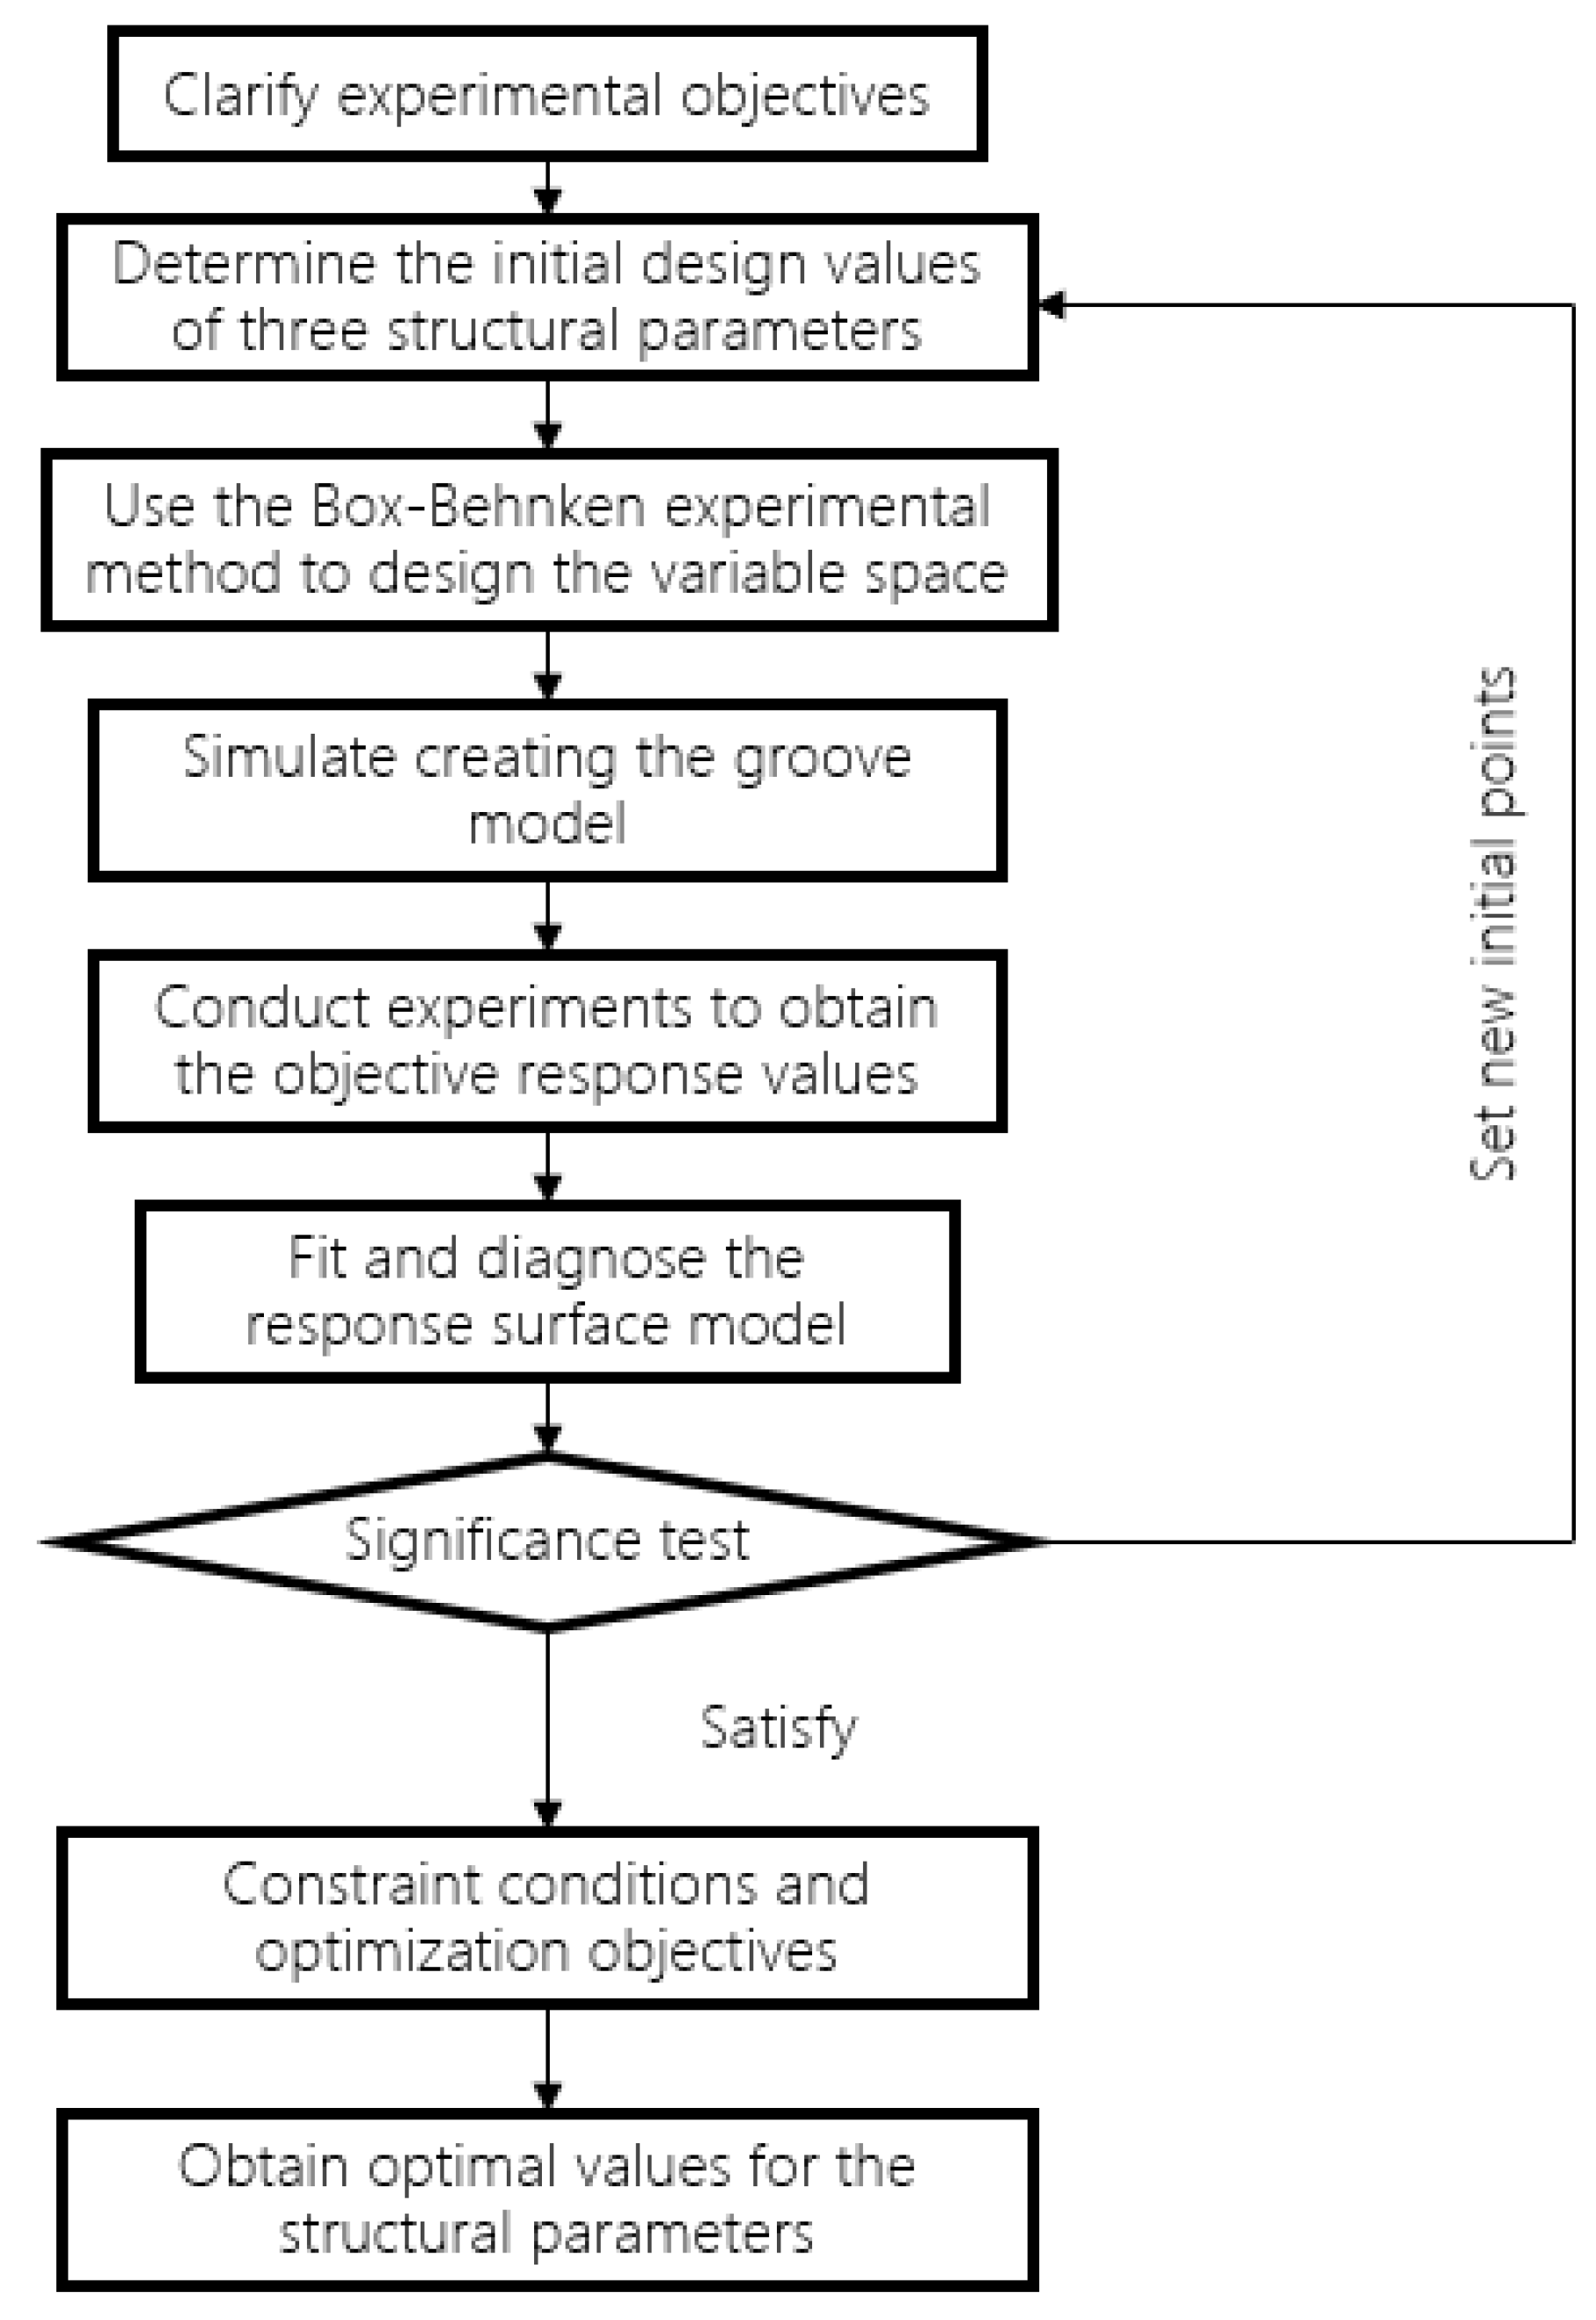
The response surface methodology experimental design employs the Box–Behnken Design (BBD) method to generate experiments and obtain response values based on a chosen experimental scheme. By analyzing the objective response values and parameter values obtained from the experiments, a regression model is established between the variables and objectives, and the significance of the regression model is determined through a variance analysis. If the model is significant, a further interaction analysis can be carried out on different structural parameters to analyze their influence on the optimization objective and identify the optimal structural parameters. If the model is not significant, the experiment has to be re-designed, as depicted in Figure 2.
2.1. Space-V Groove Layout
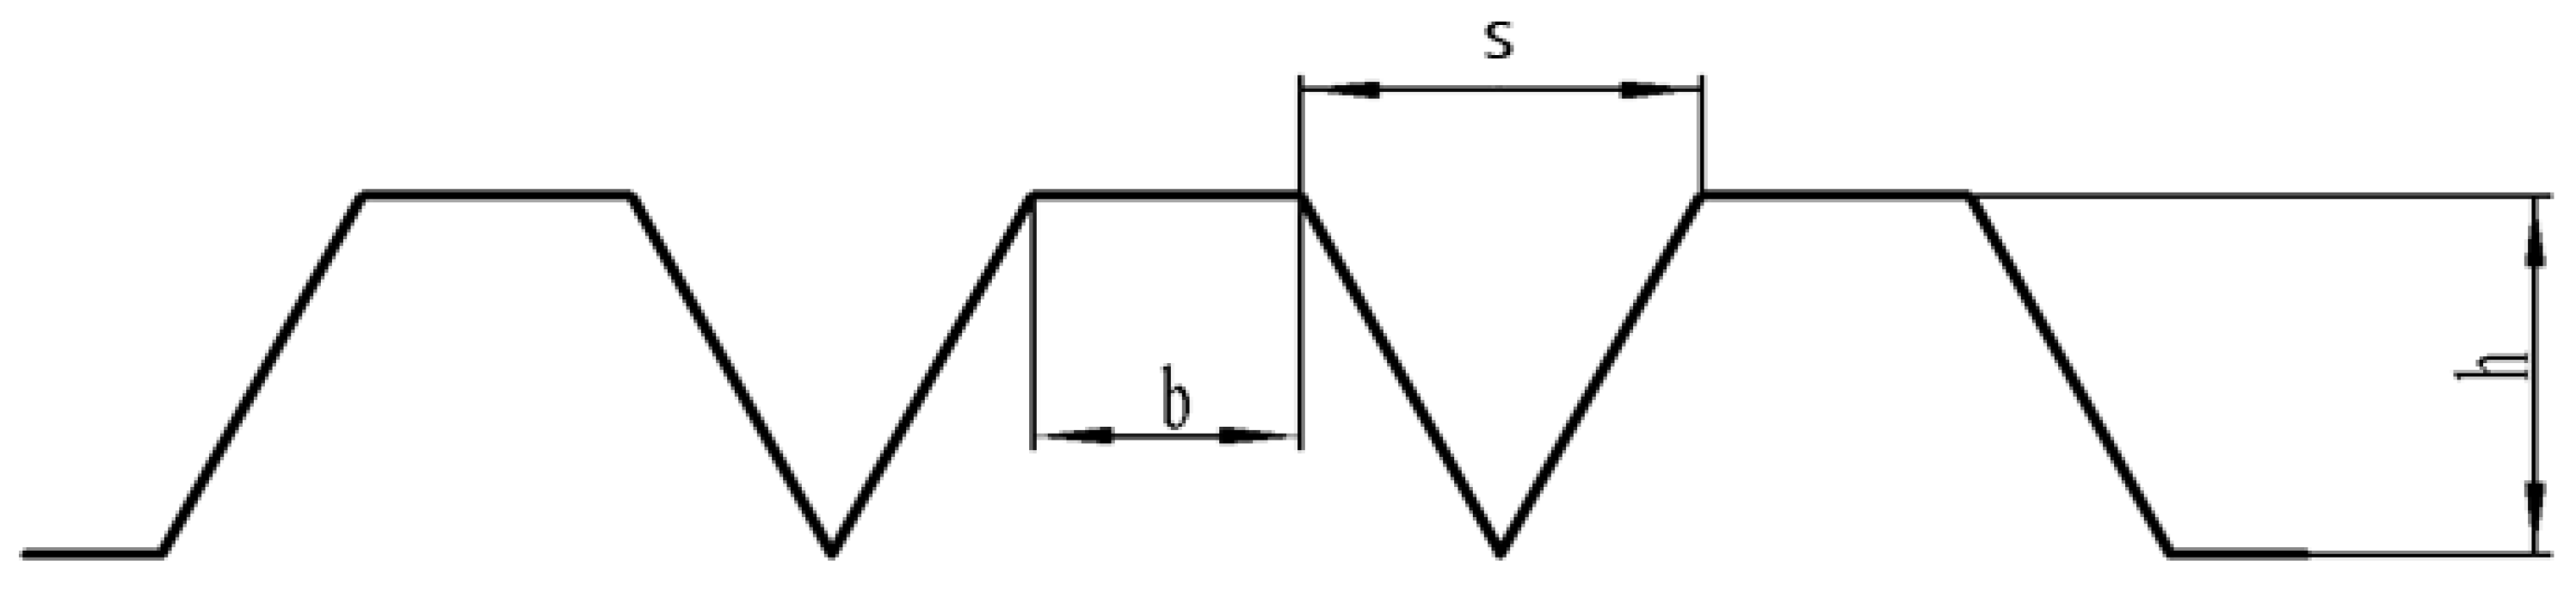
The V-shaped, U-shaped, L-shaped, and Space-V-shaped groove structures are the most commonly studied biomimetic structures in current research [5]. Among these structures, the V-groove has been found to be particularly effective. This study aims to investigate the influence of the Space-V groove structure on the performance of marine centrifugal pumps, as illustrated in Figure 3, which provides a schematic diagram of the biomimetic groove structure.
In Figure 3, b represents the spacing of the Space-V groove, s represents the width of the Space-V groove, and h represents the height of the Space-V groove.
According to Walsh et al. [10], biomimetic groove structures demonstrate drag-reducing characteristics when the non-dimensional parameters of height (h+) and width (s+) are h+ ≤ 25 and s+ ≤ 30, respectively. Using these results as a basis, we chose both h+ and s+ values to be 12, which corresponds to s = h = 0.3 mm based on Equations (1) and (2). In order to generate an accurate comparison between the two designs of biomimetic groove structures, we standardized the dimensions of the Space-V groove to s = h = b = 0.3 mm while minimizing the impact of variables.
In Equations (1) and (2), v represents the dynamic viscosity coefficient, u is the incoming flow velocity, and Cf represents the frictional resistance coefficient.
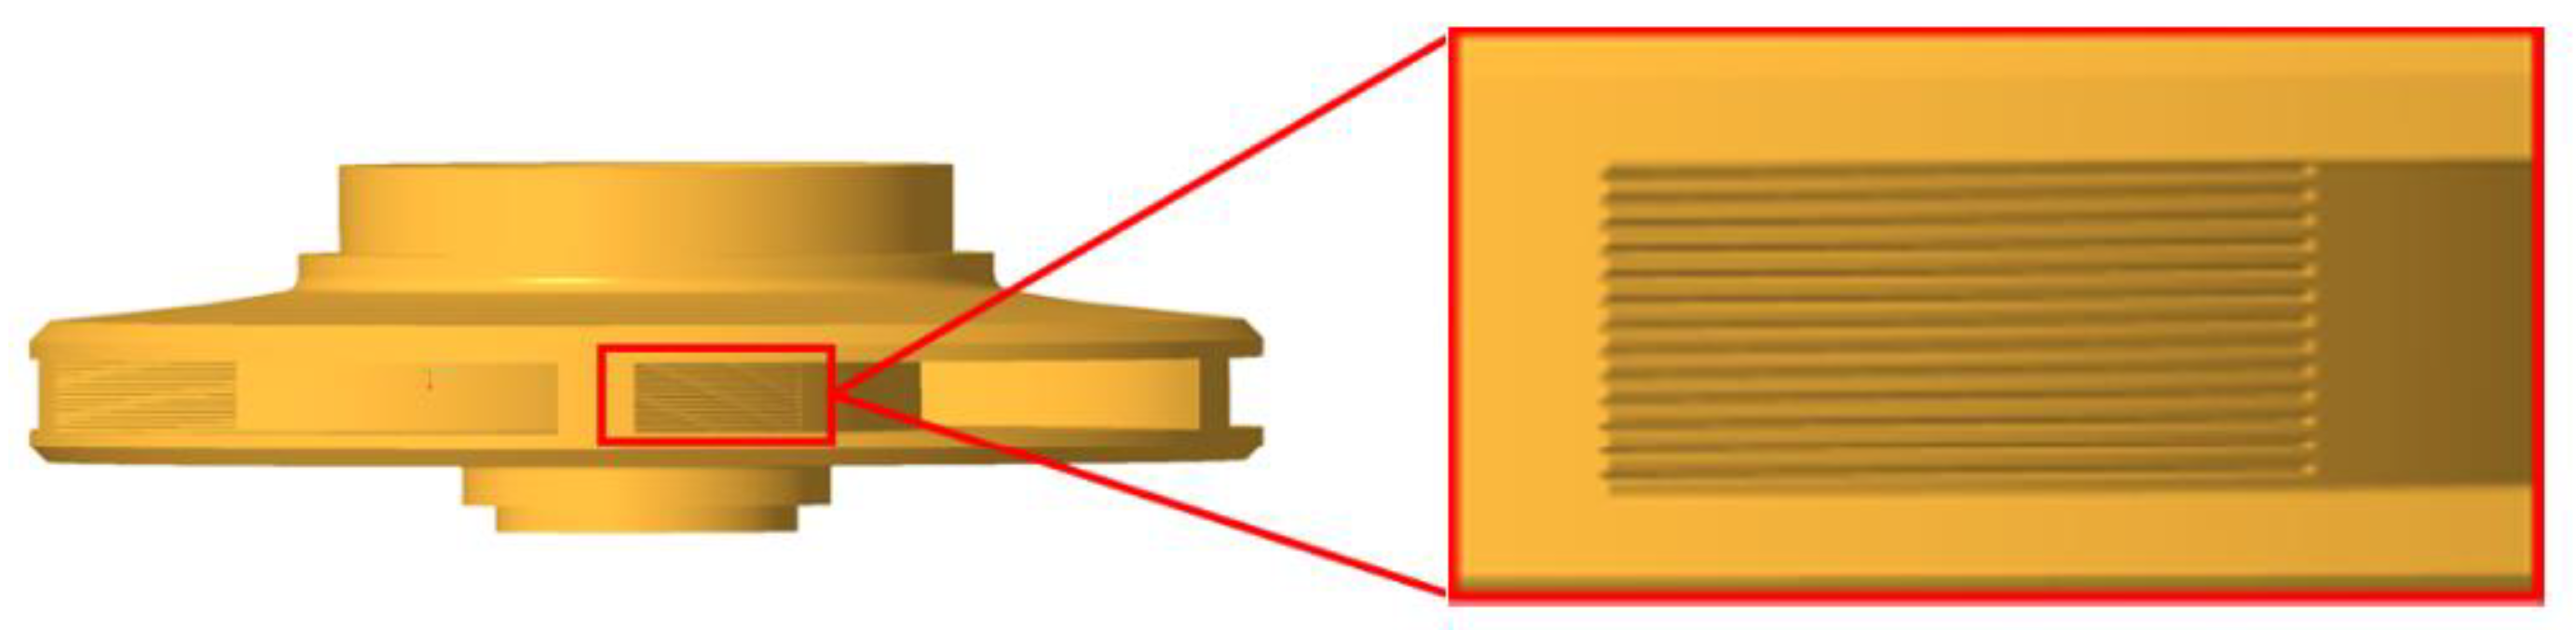
As noted in [21], non-smooth structures placed at the rear end of a rotating body can result in significant drag reduction. Additionally, marine centrifugal pumps can experience high wall shear stress at the blade exit. To address this, the biomimetic groove structure was placed on the working surface of the blade in the 1/3 region near the outlet, as illustrated in Figure 4. This figure provides a visual representation of the components of the biomimetic groove impeller.
2.2. Selection of Experimental Factors and Changes in Coding Levels
The height (h), width (s), and spacing (b) are the three key parameters of the biomimetic groove structure. Thus, these parameters were chosen as the optimization parameters for response surface optimization design. To accommodate the constraints on groove height and width in Equations (1) and (2), the groove height was limited to the range of 0.2–1.0 mm, the groove width to the range of 0.1–0.8 mm, and the groove spacing to the range of 0–2.4 mm. Each of the three factors were assigned three levels (−1, 0, 1), which are presented in Table 1 along with further details.
2.3. Experimental Design
To create a three-factor, three-level experimental scheme, the BBD design method was utilized. A total of 17 experimental plans were generated with 12 fractional factorial points and 5 experimental center points primarily used to estimate experimental errors. The response surface experimental design scheme and the calculation results of the total sound pressure level for each scheme under rated conditions are shown in Table 2.
3. Response Surface Optimization Results Analysis
3.1. Analysis of Parameter Significance
The significance of the regression equation can be tested using Equation (3).
In Equation (3), represents the sum of squares of regression, represents the sum of squares of residuals, represents degrees of freedom, and represents degrees of freedom of residuals.
The significance of the regression equation mainly depends on the relationship between M and Mα (fU, fQE), where α = 0.05. If M > Mα (fU, fQE), the regression equation is significant; if M ≤ Mα (fU, fQE), the equation is not significant [22].
The significance of each variable factor xj in the regression equation can be judged using Equation (4).
In Equation (4), Uj represents the partial sum of squares of factor xj.
The significance of the variable factor mainly depends on the relationship between Mj and Mα (1, fQE). If Mj>Mα (1, fQE), the variable factor xj is significant for the response value; if Mj ≤ Mα (1, QE), the factor is not significant for the response value.
The significance test results of the regression equation coefficients are shown in Table 3. The significance of the influencing factors is mainly judged based on the magnitude of Prob (P) > F (p-value), where indicates extremely significant differences, p > 0.05 indicates non-significant differences, and 0.01 indicates significant differences [23].
From Table 3, it can be seen that the regression model obtained has a P-value of 0.0283, indicating a high level of significance and good fit over the entire regression range. The height of the groove has a significant effect (p = 0.0459) on the total sound pressure level, while the width and spacing of the groove have no significant effect on the total sound pressure level. The order of the effects of the three parameters on the total sound pressure level is groove height (A), groove spacing (C), and groove width (B). Regarding the interaction terms, the significance indicates that the interaction between the three parameters does not significantly affect the total sound pressure level. The ranking of structural parameter interaction terms affecting the coupling effect of the total sound pressure level is groove height and groove width (AB), groove height and groove spacing (AC), and groove width and groove spacing (BC). In addition, A2 has a significant effect, while other effects are not significant.
R2 (coefficient of determination) can also be used to verify the reliability of the model. The closer R2 is to 1, the better the fit of the regression model. The R2 in this model is 0.8554 and the R2adj in this model is 0.8012, indicating a relatively good fit of the regression equation, and the prediction of the total sound pressure level has a high level of reliability. Meanwhile, C.V (general coefficient of variation) and Adeq precision (accuracy) can also measure the reliability of the experiment. A small C.V value indicates higher reliability and accuracy of the experiment. The C.V value of this experiment is 0.31%, indicating high reliability. Adeq precision is considered reasonable if it is greater than 4.0. The precision of this experiment is 6.114, indicating a precise experimental design. Equation (5) represents the regression model of the total sound pressure level.
In Equation (5), hs represents the interaction term between groove height and width; hb represents the interaction term between groove height and spacing; sb represents the interaction term between groove width and spacing.
3.2. Interaction Effects of Parameters on Total Sound Pressure Level
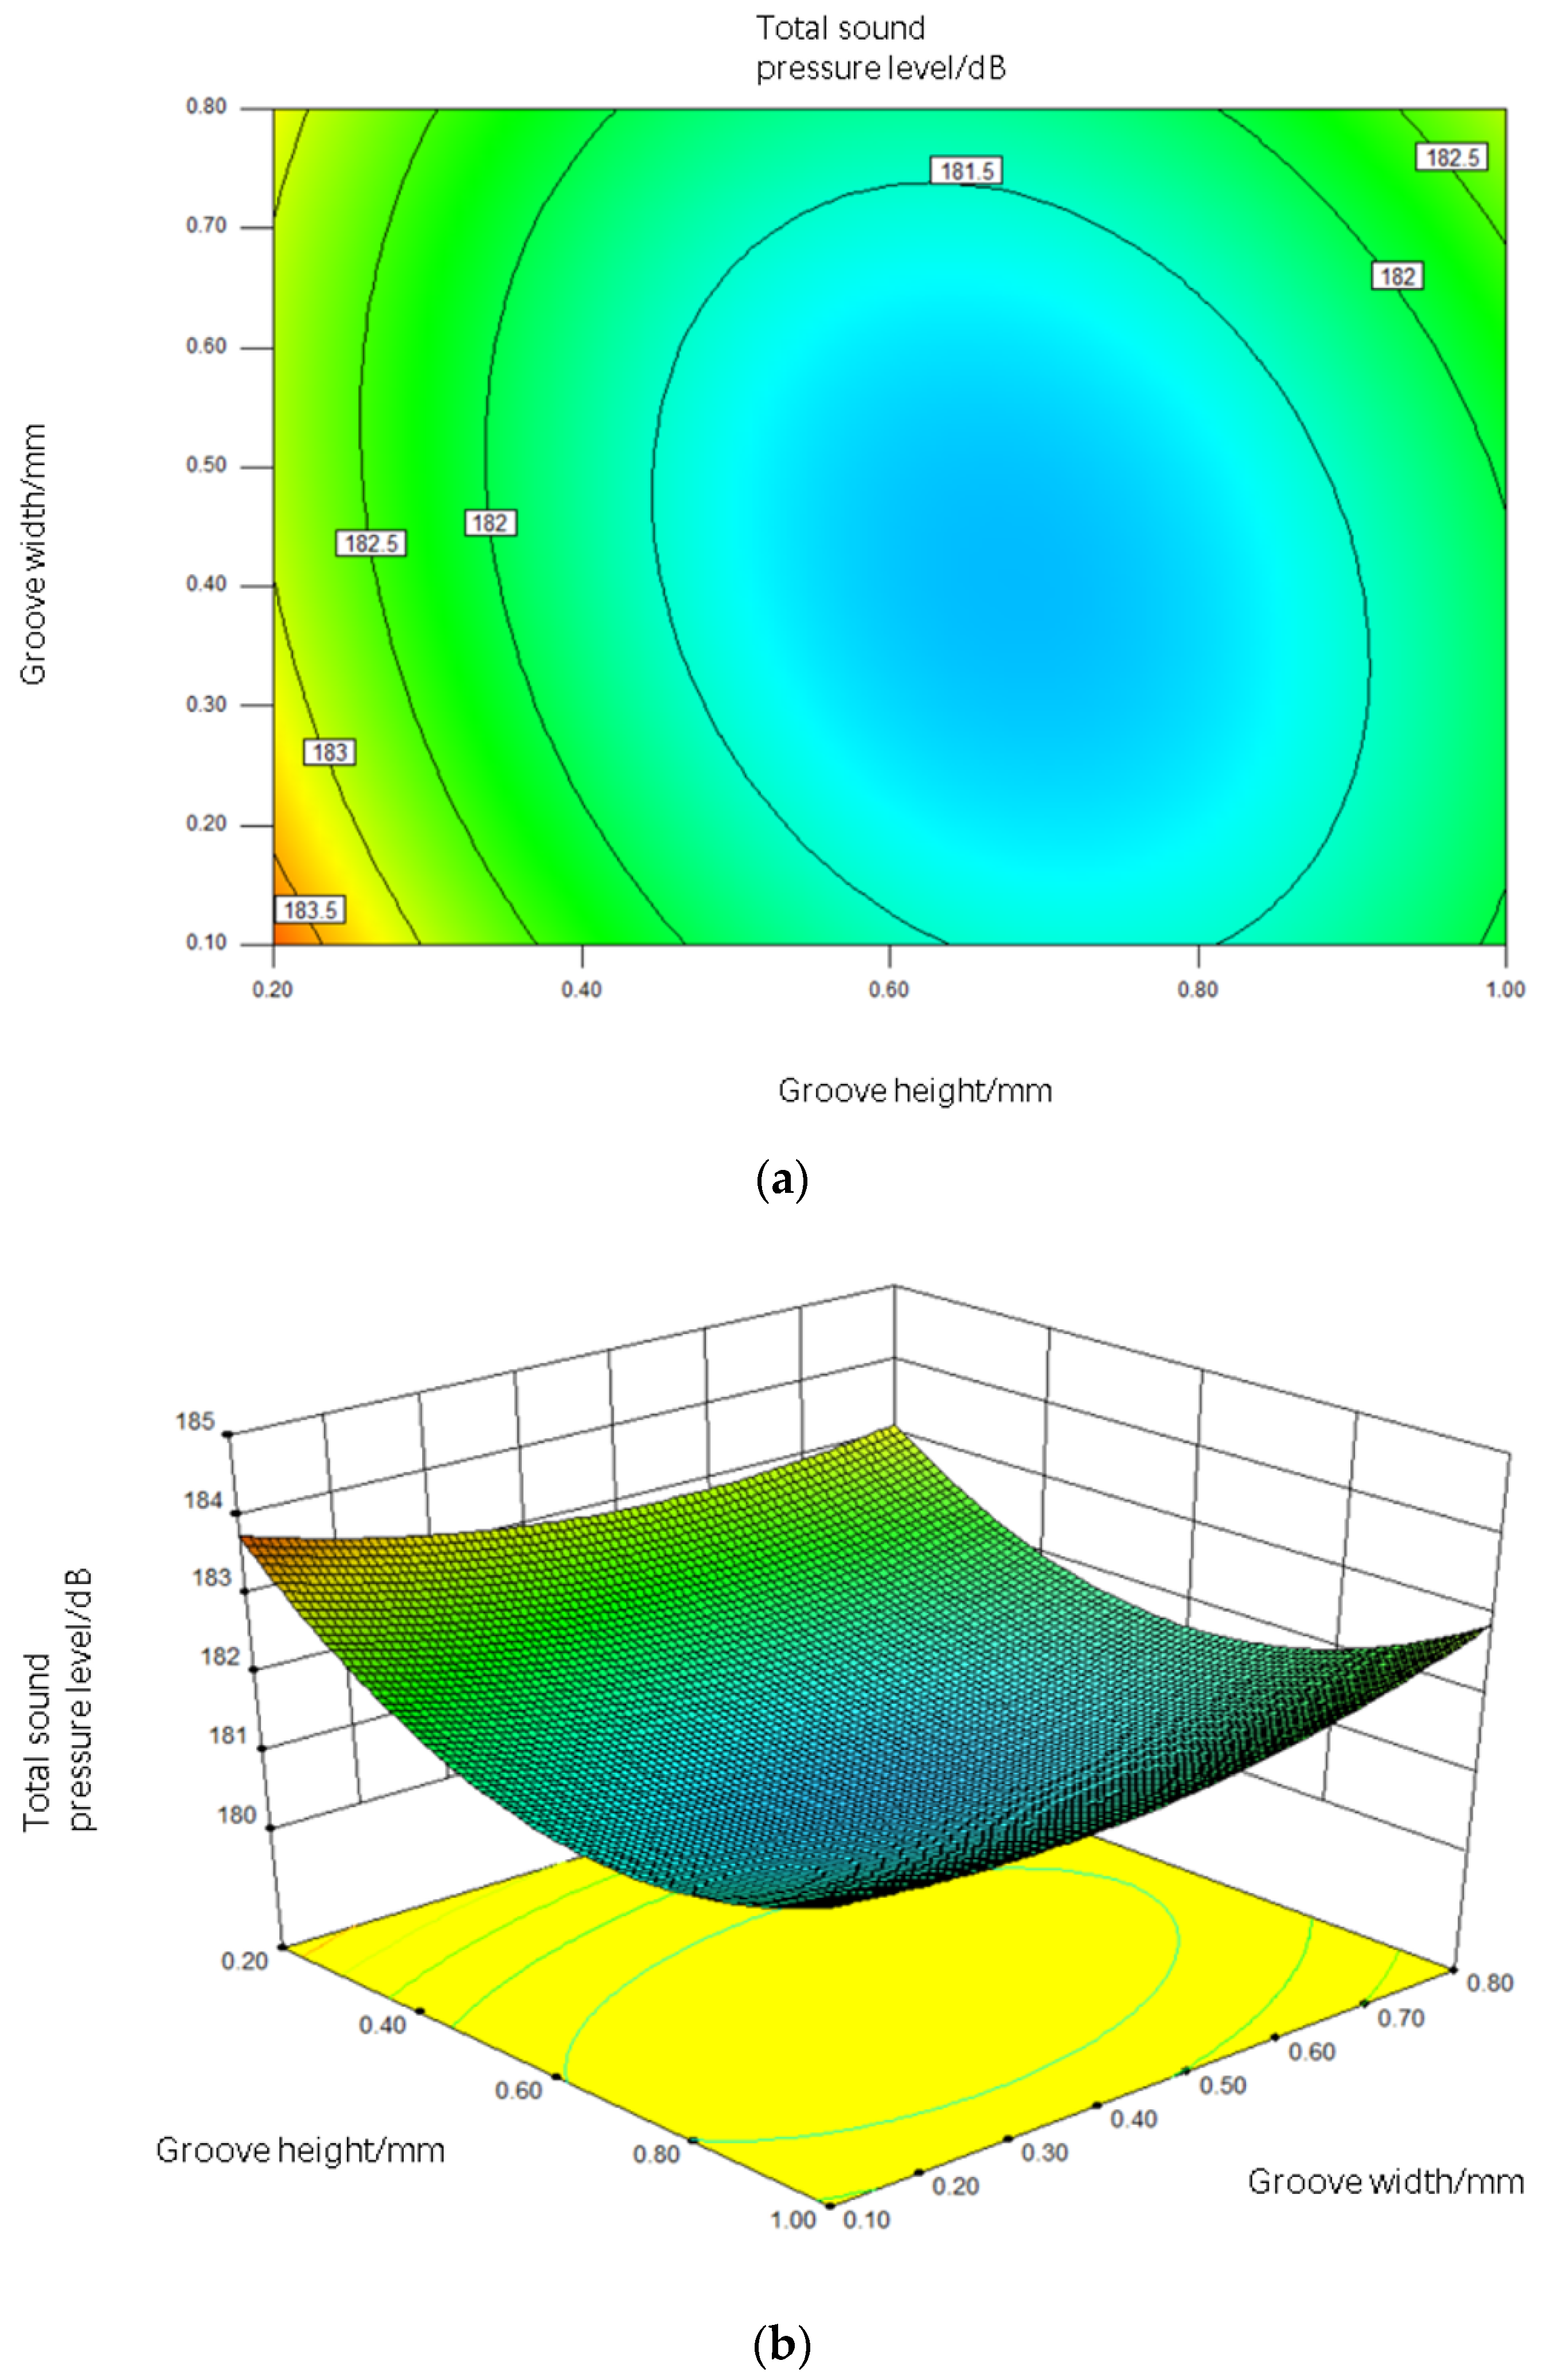
To determine the optimal range of each parameter’s effect on the total sound pressure level, the analysis was conducted on the two-dimensional contours and three-dimensional response surfaces of the interaction terms among the parameters. Figure 5 shows the effect of the interaction between groove height and width on the total sound pressure level when the coding level of groove spacing is set to 0 (1.2 mm).
It can be seen from Figure 5 that the total sound pressure level varies between 180 and 184 (dB). The shape of the response surface is funnel-shaped, with a lower height in the middle and higher heights around it, and a larger curvature radius of the contour. The p-value of the interaction term between groove height and width (AB) is 0.2394 > 0.05, indicating that the interaction between groove height and width has no significant effect on the total sound pressure level. As the groove height and width increase, the total sound pressure level shows a decreasing trend first and then an increasing trend.
To achieve a more optimal target value, when the coding level of groove spacing is set to 0 (1.2 mm), the groove height should be between 0.5 and 0.8 mm, and the groove width should be between 0.4 and 0.7 mm. Under these conditions, the total sound pressure level is at a lower level, ranging from 180 to 182 dB.
Using the same method, when the groove width is at level 0 (0.45 mm), the interactive effect of groove height and groove spacing on the total sound pressure level is shown in Figure 6. It can be concluded that the total sound pressure level is relatively low when the groove height is between 0.4 and 0.7 mm and the groove spacing is between 0.6 and 1.3 mm.
Similarly, when the groove height is at level 0 (0.6 mm), the interactive effect of groove spacing and groove width on the total sound pressure level is shown in Figure 7. It can be concluded that the total sound pressure level is relatively low when the groove width is between 0.4 and 0.7 mm and the groove spacing is between 0.7 and 1.4 mm.
In summary, in order to minimize the total sound pressure level during the operation of a marine centrifugal pump, the optimized biomimetic groove structure parameters are set to a height between 0.5 and 0.7 mm, groove width between 0.4 and 0.7 mm, and groove spacing between 0.7 and 1.3 mm.
4. Comparison of Performance of Biomimetic Marine Centrifugal Pump before and after Optimization
In order to verify the accuracy and reliability of the optimization results, a three-dimensional model of the optimized impeller was created using Creo 6.0 software. After optimization, the three parameters of the biomimetic groove structure were determined to be h = 0.65 mm, s = 0.6 mm, and b = 0.8 mm. Numerical calculations of the internal flow field and internal sound field of the optimized biomimetic marine centrifugal pump were performed and compared with a smooth marine centrifugal pump to analyze the hydraulic performance and internal noise.
4.1. Hydraulic Performance Comparison Analysis
Figure 8 shows the comparison of the head and efficiency curves of the optimized and unoptimized Space-V groove models. It can be seen that the trends of the head and efficiency changes before and after optimization are consistent. The optimized Space-V groove model exhibits varying degrees of head improvement under different operating conditions. Specifically, under rated conditions, the increase in the head is 0.27 m compared to the unoptimized Space-V groove model, and 0.93 m compared to the smooth model.
The optimized Space-V groove model also exhibits varying degrees of efficiency improvement under different operating conditions. Specifically, under rated conditions, the efficiency is 1.21% higher than the unoptimized Space-V groove model, and 4.51% higher than the smooth model. The optimized Space-V groove model demonstrates an improved head and efficiency in comparison to the unoptimized model. This suggests that response surface optimization provides a significant enhancement to the hydraulic performance of the marine centrifugal pump.
Table 4 shows the drag reduction rates of the optimized and unoptimized Space-V groove models under various operating conditions. The table reveals that, compared to the unoptimized model, the optimized Space-V groove model exhibits improved drag reduction rates to varying degrees across different operating conditions. Under the 0.6 Qd condition, the optimized Space-V groove model demonstrates an increase in drag torque compared to the smooth model. However, the optimized Space-V groove model exhibits a decrease in torque when compared to the unoptimized model. At 0.8 Qd, the optimized Space-V groove model begins to show a good drag reduction effect and the torque becomes smaller than the smooth model. At 1.0 Qd, the optimized Space-V groove model demonstrates the best drag reduction effect with a rate of 3.73%, which is 0.87% higher than the unoptimized Space-V groove model. As the flow rate increases further, the drag reduction effect of the optimized Space-V groove model becomes less significant but still notable. At 1.2 Qd, the optimized Space-V groove model shows a drag reduction rate of 1.86%, indicating a good drag reduction effect compared to the unoptimized Space-V groove model. Overall, these results suggest that the Space-V groove model with optimized parameters has a better drag reduction effect than the unoptimized one.
4.2. Analysis of In-Field Noise Comparison
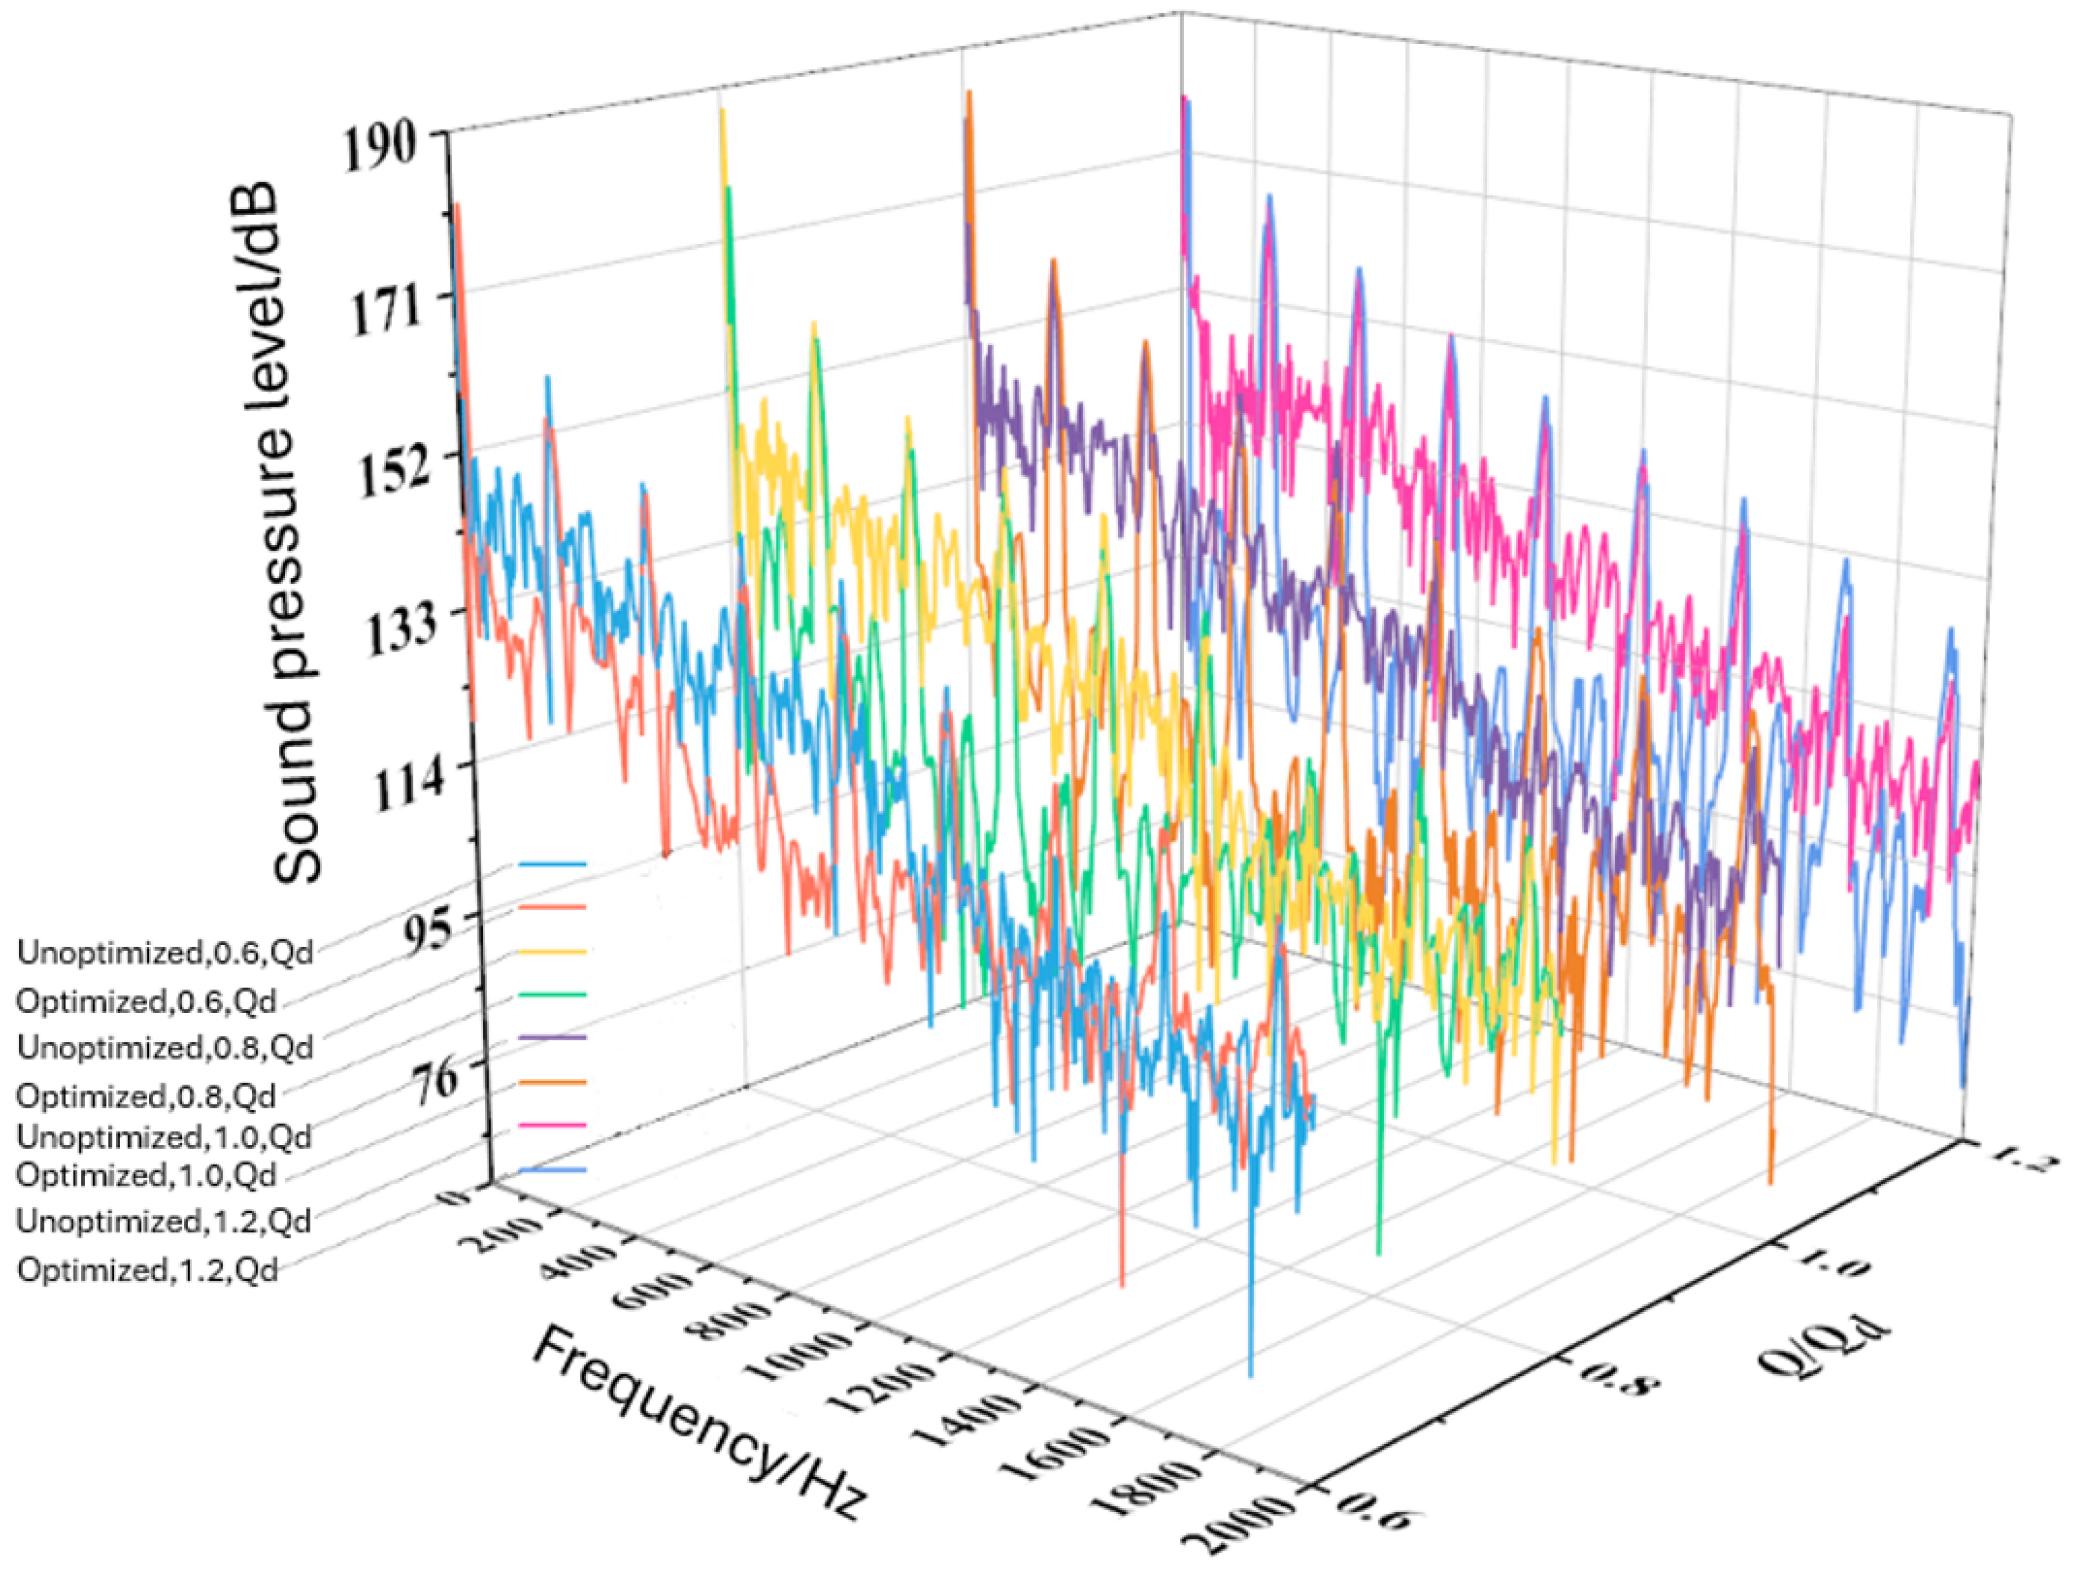
Numerical calculations were performed on the in-field noise of the optimized Space-V groove model under different flow conditions. The comparison of the outlet sound pressure level of the model before and after optimization is shown in Figure 9.
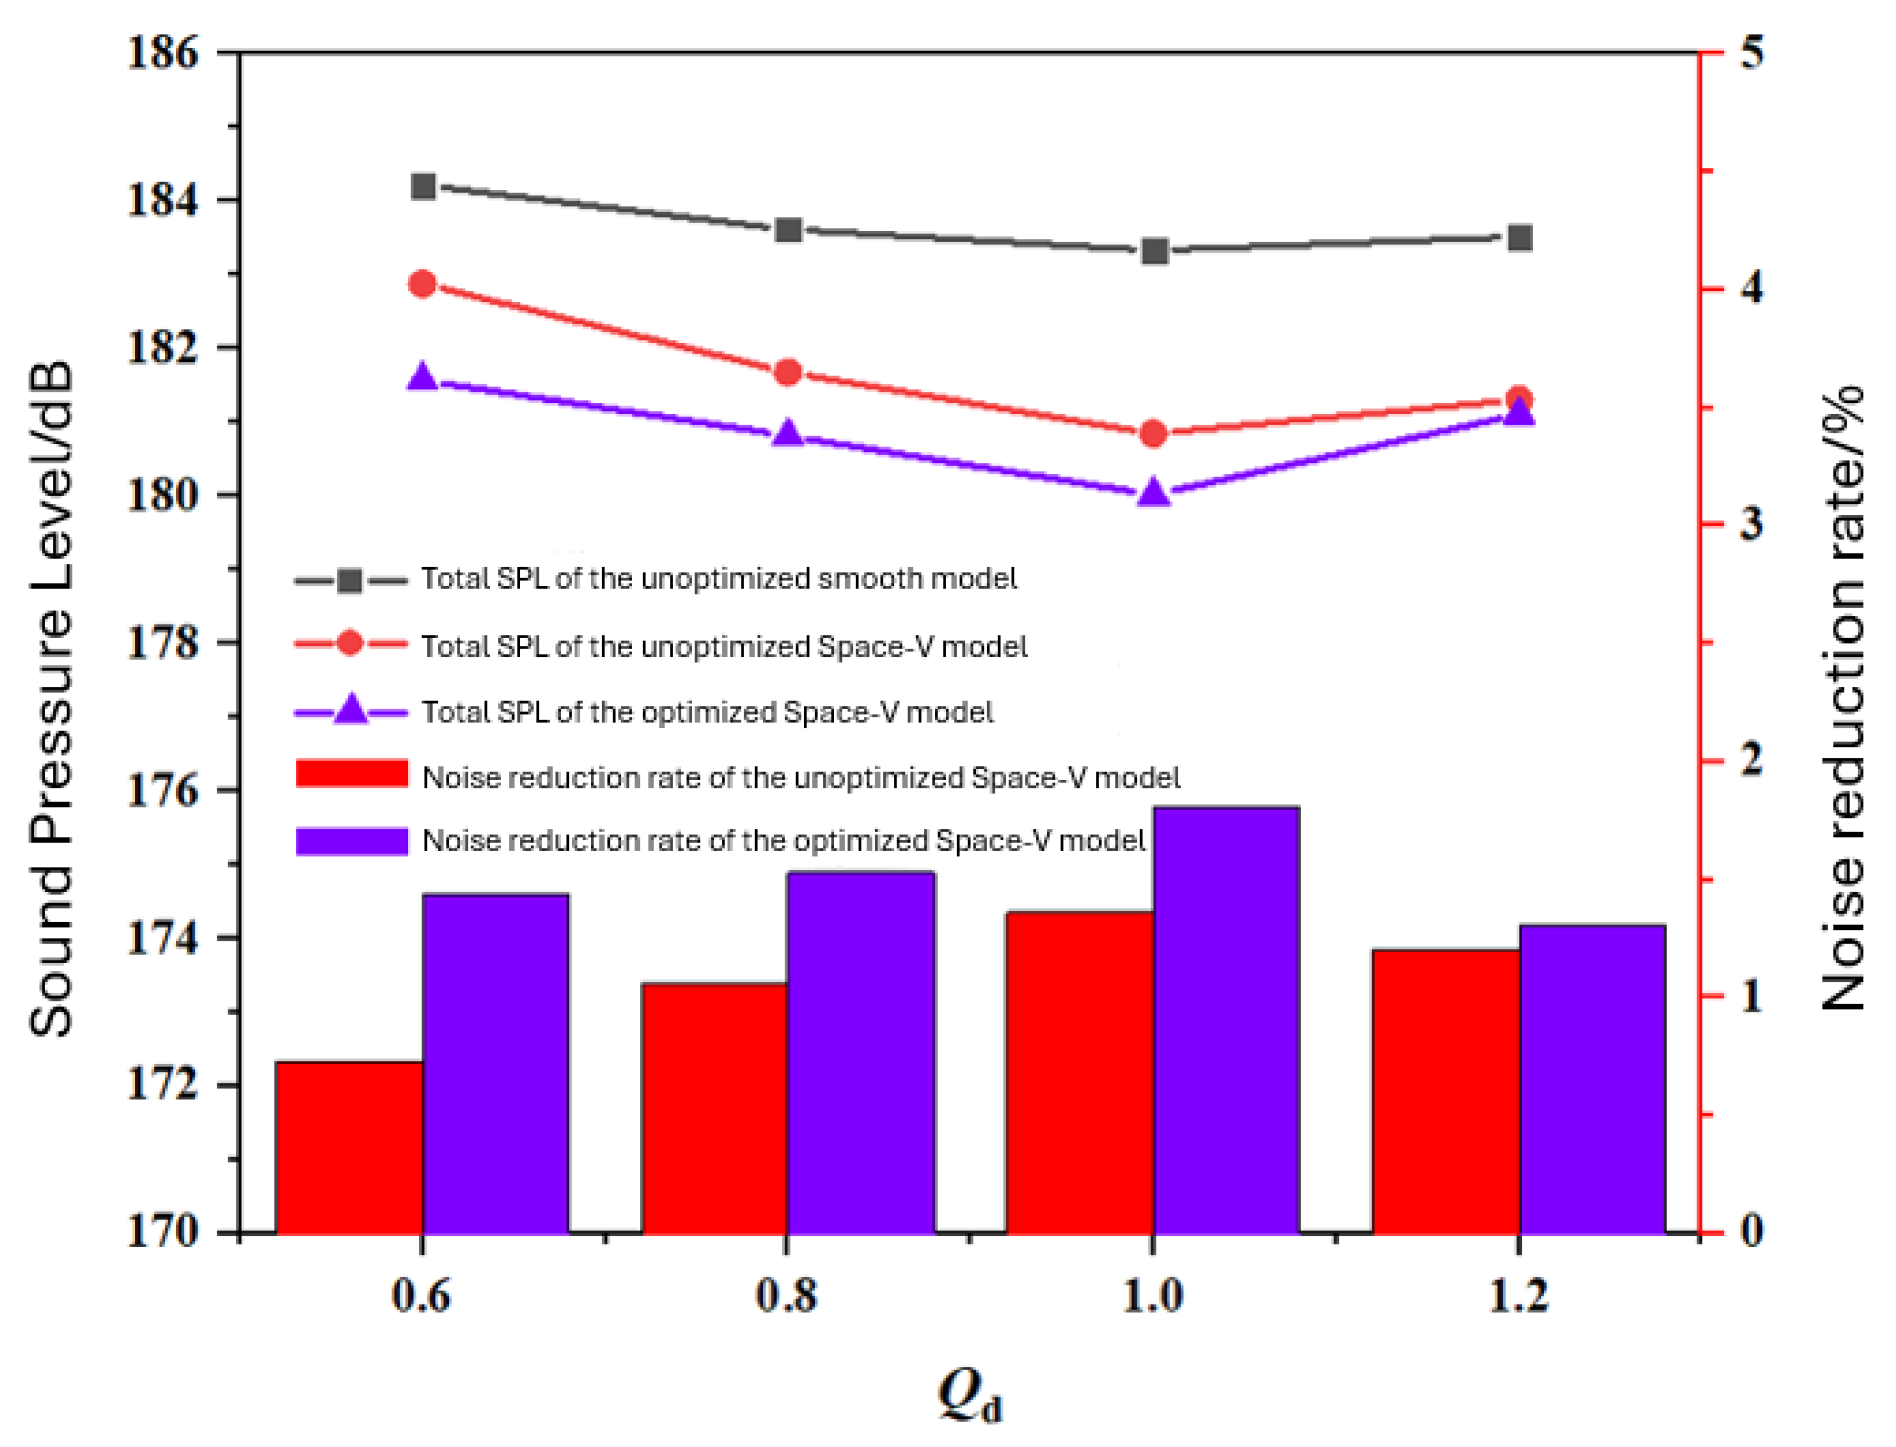
From Figure 9, it can be seen that the trends of noise spectrum variation for the optimized and unoptimized Space-V groove models are basically consistent under different operating conditions. The sound pressure level curves of the optimized and unoptimized Space-V groove models as well as the smooth model are similar, with significant peaks at blade frequency and its harmonics, and the sound pressure level decreases with increasing frequency. By comparing the sound pressure level curves of the optimized and unoptimized Space-V groove models, it can be seen that the optimized model can significantly reduce the broadband noise and discrete noise at characteristic frequencies. To further compare the noise reduction effect of the optimized Space-V groove model before and after optimization, the total sound pressure level under different flow rates is quantitatively analyzed in Figure 10.
From Figure 10, it can be seen that the noise reduction rate of the optimized Space-V grooved model has been improved to varying degrees compared to before optimization under different operating conditions. For different flow rates, the total sound pressure level of the optimized Space-V grooved model is reduced by 2.41~3.32 dB compared with the smooth model, and the total sound pressure level is reduced by 1.31~1.81%. Under the rated condition, the total sound pressure level decreased from 183.34 dB to 180.02 dB, resulting in a reduction of 3.32 dB and a noise reduction rate of 1.81%. This represents an improvement of 0.45% in comparison to the noise reduction rate of the unoptimized Space-V grooved model, which was 1.36%. Therefore, the optimized Space-V grooved model using response surface methodology can effectively improve the noise during the operation of the marine centrifugal pump.
5. Conclusions
In this paper, the Space-V grooved structure was optimized, and a regression equation was established between the total sound pressure level and the groove height, width, and spacing based on response surface methodology. The influence of each parameter on the performance of the marine centrifugal pump was analyzed, and the values of each parameter were obtained to minimize the total sound pressure level. By comparing and analyzing the hydraulic performance and internal noise of the Space-V grooved model before and after optimization through numerical calculation, the following conclusions have been drawn:
- (1)
- The BBD method was used to experimentally design the height, width, and spacing of the biomimetic grooved structure, and a multivariate regression equation was established between the total sound pressure level of the marine centrifugal pump and the three geometric parameters of the grooves. The significance of the model was verified through a variance analysis.
- (2)
- With the increase in groove height, the total sound pressure level first decreases and then increases; with the increase in groove width, the total sound pressure level first decreases and then increases; and with the increase in groove spacing, the total sound pressure level increases.
- (3)
- The optimization scheme for the groove parameters was determined to be height: h = 0.65 mm, width: s = 0.6 mm, spacing: b = 0.8 mm.
- (4)
- The comparative analysis conducted on the Space-V groove model before and after optimization revealed notable improvements in the head and efficiency under various operating conditions. Additionally, the optimized model effectively reduced broadband noise and discrete noise at various characteristic frequencies. Specifically, the optimized Space-V groove model exhibited an increased head of 0.27 m, an increased efficiency of 1.21%, and a drag reduction rate higher than the unoptimized model by 0.87% under the rated condition. Furthermore, in comparison to the smooth model at the rated condition, the optimized Space-V groove model displayed an efficiency improvement of 4.51%, a resistance reduction of 3.73%, and a decrease in the overall sound pressure level by 1.81%.
Author Contributions
Conceptualization, H.L. (Hua Li); methodology, H.L. (Hua Li) and L.D.; writing—original draft preparation, H.L. (Hua Li) and Z.Y.; software, validation, investigation, H.L. (Hua Li) and L.D.; writing—review and editing, visualization, C.L. and C.G.; supervision, L.D.; formal analysis, data curation, project administration, H.L. (Houlin Liu), and R.H.; funding acquisition, H.L. (Hua Li) and Z.Y. All authors have read and agreed to the published version of the manuscript.
Funding
National Natural Science Foundation of China (No. 52279087, 51879122), Zhenjiang key research and development plan (GY2017001, GY2018025), Jiangsu University Young Talent training Program-Outstanding Young backbone Teacher, Program Development of Jiangsu Higher Education Institutions (PAPD), and Jiangsu top six talent summit project (GDZB-017).
Data Availability Statement
The data that support the findings of this study are available on request from the corresponding author, upon reasonable request.
Conflicts of Interest
The authors declare no conflict of interest.
References
- Mou, J.G.; Dai, D.S.; Gu, Y.Q.; Liu, H.; Chen, J.; Li, Y.; Yan, J. Influence of biomimetic snail shell structure on the pulsation characteristics in the baffle region of a centrifugal pump. J. Shanghai Jiaotong Univ. 2016, 50, 1493–1499. [Google Scholar]
- Mou, J.G.; Liu, J.; Gu, Y.Q.; Wei, J.; Yuchan, W.; Diyi, C. Analysis of unsteady flow characteristics inside a biomimetic snail shell centrifugal pump. J. Zhejiang Univ. 2016, 50, 927–933. [Google Scholar]
- Zhang, X.P. Experimental Study on Drag Reduction and Noise Reduction of Flexible Biomimetic Surface of Cooling Fans for Electronic Devices; Jilin University: Changchun, China, 2012. [Google Scholar]
- Dai, C.; Ge, Z.P.; Dong, L.; Guo, C.; Liu, H. Study on drag reduction and noise reduction characteristics of biomimetic surface of centrifugal pump. J. Huazhong Univ. Sci. Technol. 2020, 48, 113–118. [Google Scholar]
- Dai, C.; Guo, C.; Ge, Z.P.; Liu, H.; Dong, L. Study on drag and noise reduction of bionic blade of centrifugal pump and mechanism. J. Bionic Eng. 2021, 18, 428–440. [Google Scholar] [CrossRef]
- Tian, L.; Jin, E.; Li, Z.; Mei, J.; Wang, Y.; Shang, Y. The fluid control mechanism of bionic structural heterogeneous composite materials and its potential application in enhancing pump efficiency. Adv. Mech. Eng. 2015, 7, 1393–1396. [Google Scholar] [CrossRef]
- Konovalov, S.F.; Lashkov, Y.A.; Mikhailov, V.V. Effect of longitudinal riblets on the aerodynamic characteristics of a straight wing. Fluid Dyn. 1995, 30, 183–187. [Google Scholar] [CrossRef]
- Lee, S.J.; Jang, Y.G. Control of flow around a NACA 0012 airfoil with a micro-riblet film. J. Fluids Struct. 2005, 20, 659–672. [Google Scholar] [CrossRef]
- Chamoro, L.P.; Arndt, E.A.; Sotiropoulos, F. Drag reduction of large wind turbine blades through riblets: Evaluation of riblet geometry and application strategies. Renew. Energy 2013, 50, 1095–1105. [Google Scholar] [CrossRef]
- Walsh, M.J. Riblets as a viscous drag reduction technique. AIAA J. 1983, 21, 485–486. [Google Scholar] [CrossRef]
- Park, S.R.; Wallace, J.M. Flow alteration and drag reduction by riblets in a turbulent boundary layer. AIAA J. 1994, 32, 31–38. [Google Scholar] [CrossRef]
- Dai, C.; Chao, G.; Chen, Y.; Dong, L.; Liu, H. Analysis of the Influence of Different Bionic Structures on the Noise Reduction Performance of the Centrifugal Pump. Sensors 2021, 21, 886. [Google Scholar] [CrossRef] [PubMed]
- Dai, C.; Chen, Y.; Dong, L.; Mou, J.; Wu, D.; Yan, M. Placement of bionic non-smooth Structure of centrifugal pump blade. J. Drain. Irrig. Mach. Eng. 2020, 38, 241–247. [Google Scholar]
- Li, T.; Zhu, H.; Kong, N. Optimal design of load bearing beam for loading safety valve based on Response Surface Method. Manuf. Autom. 2022, 44, 73–76. [Google Scholar]
- Liu, D.; Dai, Y.; Shan, C.; Li, D.; Tang, C. Optimization of resonant element structure of oscillation balance based on response surface Method. J. Heilongjiang Univ. Sci. Technol. 2022, 32, 111–116. [Google Scholar]
- Qiang, D.; Li, H.; You, F.; You, F.; Li, J.; Hao, W. Optimization of feeding robot screw shaft structure based on Response surface method. Mach. Manuf. 2022, 60, 21–25. [Google Scholar]
- Zhang, D.S.; Mei, J.; Zhao, R.J.; Liu, H.; Xie, L. Optimization design of fluoroplastic two-phase flow pump based on response surface methodology. J. Drain. Irrig. Mach. Eng. 2020, 38, 898–903. [Google Scholar]
- Aelaei, M.; Karimian, S.; Ommi, F. Sensitivity analysis and optimization of delta wing design parameters using cfd–based response surface method. J. Appl. Fluid Mech. 2019, 12, 1885–1903. [Google Scholar] [CrossRef]
- Thakkar, S.; Vala, H.; Patel, V.K.; Patel, R. Performance improvement of the sanitary centrifugal pump through an integrated approach based on response surface methodology multi-objective optimization and CFD. J. Braz. Soc. Mech. Sci. Eng. 2021, 43, 24. [Google Scholar] [CrossRef]
- Liu, H.L.; Cheng, Z.M.; Ge, Z.P.; Dong, L.; Dai, C. Collaborative improvement of efficiency and noise of bionic vane centrifugal pump based on multi-objective optimization. Adv. Mech. Eng. 2021, 13, 1687814021994976. [Google Scholar] [CrossRef]
- Zhang, C. Drag Reduction Research on Biomimetic Non-smooth Surface Flow Field Control of Turbomachinery; Jilin University: Changchun, China, 2007. [Google Scholar]
- Chen, Y. Noise Reduction Research of Centrifugal Pumps Based on Biomimetic Structures; Jiangsu University: Zhenjiang, China, 2020. [Google Scholar]
- Mao, S.; Wang, J.; Pu, X. Advanced Mathematical Statistics; Higher Education Press: Beijing, China, 2006. [Google Scholar]
Figure 1.
Research ideas and process.

Figure 2.
Design process of response surface second-order test.

Figure 3.
Dimensions of Space-V groove.

Figure 4.
Parts diagram of bionic impeller.

Figure 5.
Influence of groove height and width interaction on total sound pressure level for two-dimensional (a) and three-dimensional response surface (b).
Figure 5.
Influence of groove height and width interaction on total sound pressure level for two-dimensional (a) and three-dimensional response surface (b).

Figure 6.
Influence of groove height and spacing interaction on total sound pressure level.

Figure 7.
Influence of groove spacing and width interaction on total sound pressure level.

Figure 8.
Comparison of external characteristics before and after optimization.

Figure 9.
Comparison of outlet sound pressure level before and after optimization.

Figure 10.
Comparison of total sound pressure level before and after optimization.


Table 1.
Test factors and levels.
| Coding | Experimental Factor | Coding Level | ||
|---|---|---|---|---|
| −1 | 0 | 1 | ||
| A | Groove height/mm | 0.2 | 0.6 | 1.0 |
| B | Groove width/mm | 0.1 | 0.45 | 0.8 |
| C | Groove spacing/mm | 0 | 1.2 | 2.4 |
Table 2.
Scheme and result of response surface test design.
| Number | A | B | C | Total Sound Pressure Level (dB) |
|---|---|---|---|---|
| 1 | 0.2 | 0.1 | 1.2 | 184.13 |
| 2 | 1 | 0.1 | 1.2 | 182.11 |
| 3 | 0.2 | 0.8 | 1.2 | 183.12 |
| 4 | 1 | 0.8 | 1.2 | 182.56 |
| 5 | 0.2 | 0.45 | 0 | 182.73 |
| 6 | 1 | 0.45 | 0 | 182.21 |
| 7 | 0.2 | 0.45 | 2.4 | 183.65 |
| 8 | 1 | 0.45 | 2.4 | 182.86 |
| 9 | 0.6 | 0.1 | 0 | 181.56 |
| 10 | 0.6 | 0.8 | 0 | 182.11 |
| 11 | 0.6 | 0.1 | 2.4 | 181.98 |
| 12 | 0.6 | 0.8 | 2.4 | 182.43 |
| 13 | 0.6 | 0.45 | 1.2 | 181.76 |
| 14 | 0.6 | 0.45 | 1.2 | 181.70 |
| 15 | 0.6 | 0.45 | 1.2 | 181.21 |
| 16 | 0.6 | 0.45 | 1.2 | 180.53 |
| 17 | 0.6 | 0.45 | 1.2 | 180.37 |
Table 3.
Results of variance.
| Factor | Sum of Squares | Degrees of Freedom | Mean Square | F-Value | Prob (P) > F | Significance |
|---|---|---|---|---|---|---|
| Model | 13.34 | 9 | 1.48 | 4.60 | 0.0283 | Significant |
| A | 1.89 | 1 | 1.89 | 5.87 | 0.0459 | Significant |
| B | 0.024 | 1 | 0.024 | 0.075 | 0.7920 | Not significant |
| C | 0.67 | 1 | 0.67 | 2.07 | 0.1935 | Not significant |
| AB | 0.53 | 1 | 0.53 | 1.65 | 0.2394 | Not significant |
| AC | 0.018 | 1 | 0.018 | 0.057 | 0.8189 | Not significant |
| BC | 0.0025 | 1 | 0.0025 | 0.007756 | 0.9323 | Not significant |
| A2 | 7.72 | 1 | 7.72 | 23.96 | 0.0018 | Significant |
| B2 | 1.10 | 1 | 1.10 | 3.42 | 0.1068 | Not significant |
| C2 | 0.65 | 1 | 0.65 | 2.03 | 0.1972 | Not significant |
Table 4.
Drag reduction rate before and after optimization.
| Q/Qd | Torque/N∙m | Drag Reduction Rate/% | |||
|---|---|---|---|---|---|
| Smooth Model | Unoptimized Space-V Groove Model | Optimized Space-V Groove Model | Unoptimized Drag Reduction Rate | Optimized Drag Reduction Rate | |
| 0.6 | 3.19 | 3.24 | 3.20 | −1.56 | −0.31 |
| 0.8 | 3.45 | 3.41 | 3.38 | 1.16 | 2.03 |
| 1.0 | 3.85 | 3.74 | 3.71 | 2.86 | 3.73 |
| 1.2 | 4.31 | 4.27 | 4.23 | 0.93 | 1.86 |
Disclaimer/Publisher’s Note: The statements, opinions and data contained in all publications are solely those of the individual author(s) and contributor(s) and not of MDPI and/or the editor(s). MDPI and/or the editor(s) disclaim responsibility for any injury to people or property resulting from any ideas, methods, instructions or products referred to in the content. |
© 2023 by the authors. Licensee MDPI, Basel, Switzerland. This article is an open access article distributed under the terms and conditions of the Creative Commons Attribution (CC BY) license (https://creativecommons.org/licenses/by/4.0/).
Share and Cite
MDPI and ACS Style
Li, H.; Yu, Z.; Hua, R.; Li, C.; Guo, C.; Liu, H.; Dong, L. Optimization Research on the Space-V-Type Biomimetic Surface Grooves of a Marine Centrifugal Pump. Water 2023, 15, 4031. https://doi.org/10.3390/w15224031
AMA Style
Li H, Yu Z, Hua R, Li C, Guo C, Liu H, Dong L. Optimization Research on the Space-V-Type Biomimetic Surface Grooves of a Marine Centrifugal Pump. Water. 2023; 15(22):4031. https://doi.org/10.3390/w15224031
Chicago/Turabian StyleLi, Hua, Zifeng Yu, Runan Hua, Chenqi Li, Chao Guo, Houlin Liu, and Liang Dong. 2023. "Optimization Research on the Space-V-Type Biomimetic Surface Grooves of a Marine Centrifugal Pump" Water 15, no. 22: 4031. https://doi.org/10.3390/w15224031
Note that from the first issue of 2016, this journal uses article numbers instead of page numbers. See further details here.